
94% of researchers rate our articles as excellent or good
Learn more about the work of our research integrity team to safeguard the quality of each article we publish.
Find out more
ORIGINAL RESEARCH article
Front. Remote Sens., 25 October 2021
Sec. Atmospheric Remote Sensing
Volume 2 - 2021 | https://doi.org/10.3389/frsen.2021.766628
This article is part of the Research TopicDSCOVR EPIC/NISTAR: 5 years of Observing Earth from the first Lagrangian PointView all 24 articles
 Zhendong Lu1
 Jun Wang1,2*
 Xiaoguang Xu3Xi Chen2
 Shobha Kondragunta4Omar Torres5
 Eric M. Wilcox6Jing Zeng2
A series of huge smoke plume events from the largest wildfire season recorded in California’s modern history has occurred in 2020. Here, a research algorithm was modified to retrieve the aerosol optical centroid height (AOCH) and aerosol optical depth (AOD) from Earth Polychromatic Imaging Camera (EPIC) measurements. The research focus is to gain insights of the algorithm’s feasibility in heavy smoke conditions to study the diurnal variation of AOCH; this is only made possible via EPIC due to its unique position at Lagrange-1 point and its equipment of O2 B-band at which the vegetated surface reflectance is low. Vicarious calibration is applied to the EPIC 443, 680 and 688 nm channels based on the Tropospheric Monitoring Instrument (TROPOMI) observation. This new calibration leads to a better agreement of AOCH values between EPIC retrievals and the counterparts derived from the Cloud-Aerosol Lidar with Orthogonal Polarization (CALIOP) aerosol extinction vertical profile. The hourly variation of AOCH up to 0.45 km on September 7 is shown to have important implications for estimating hourly change of surface PM2.5, although more quantitative studies are needed in the future.
The vertical distribution of smoke aerosols from wildfires has several important effects on the weather, climate and air quality. First, via absorbing and scattering of radiation, the altitude of smoke plumes can influence how aerosols alter the thermodynamic structure of atmosphere in the vertical dimension, thus affecting the formation and lifecycle of clouds (Wilcox, 2012). Second, the smoke aerosols can be entrained into the clouds and serve as condensation nuclei for cloud formation, thereby affecting the microphysics and radiative effect of clouds. This process highly depends on the vertical distance between aerosol layer and clouds (Rajapakshe et al., 2017). Third, the relative vertical position of aerosols and clouds determines the sign and magnitudes of the aerosol radiative effects (Wang and Christopher, 2006a; Zarzycki and Bond, 2010; Ge et al., 2014). Lastly, the characterization of smoke vertical distribution is also very important for the retrieval of aerosol optical depth and single scattering albedo using near-UV observations (Torres et al., 1998; Ahn et al., 2021), as well as the remote sensing of surface air quality (Wang and Christopher, 2003). On the one hand, for a given total column aerosol loading, the lower the smoke layer is, the more severe the surface particulate matter pollution would be (Val Martin et al., 2013; Seo et al., 2015; Griffin et al., 2020). On the other hand, the aerosol layer height (ALH) regulates the transport of aerosol particles, with high altitudes favoring the long-range transport, thereby affecting the air quality and human health over the downwind region (Wang et al., 2006b; Val Martin et al., 2013; Tian et al., 2017).
Unfortunately, the operational datasets of ALH from observational sources are very limited. Although spaceborne lidars, such as Cloud-Aerosol Lidar with Orthogonal Polarization (CALIOP), can provide accurate aerosol vertical extinction profile, their footprint diameters are narrow (90 m for CALIOP) at the ground, and consequently, the lidar data is very sparse over time and space. Passive satellite remote sensing has a much wider swath but contains less information of aerosol vertical distribution (Xu et al., 2018). In addition, the diurnal variation of the ALH is not well understood, because most passive sensors with the capability of retrieving ALH are placed at the sun-synchronous orbits. The deficiency of aerosol vertical distribution information leads to large uncertainty and inter-model variability in the simulation of aerosol vertical profile by current climate models (Koffi et al., 2012; Kipling et al., 2016; Koffi et al., 2016), which brings large uncertainty in climate change prediction and air quality forecasting.
Here we present a first attempt to map hourly variation of smoke vertical distribution from space during the 2020 severe fire season. This study builds upon the past work that presented an algorithm to retrieve hourly aerosol optical centroid height (AOCH) from the oxygen absorption A- and B-bands of the Earth Polychromatic Imaging Camera (EPIC) for the smoke plumes over Hudson Bay–Great Lakes area (Xu et al., 2017; Xu et al., 2019). The EPIC is onboard the Deep Space Climate Observatory (DSCOVR) satellite that is parked at Lagrange-1 point (Marshak et al., 2018). This study, however, differs from the past work in several aspects. First, we update the EPIC calibration via the vicarious calibration study that uses the accurate radiance measurements by the Tropospheric Monitoring Instrument (TROPOMI) observation in the oxygen absorption bands. This is needed because EPIC does not have the onboard calibration, and the official after-launch calibration of EPIC measurements at visible and near infrared (NIR) channels (Geogdzhayev and Marshak, 2018) has not been updated since 2017 (https://epic.gsfc.nasa.gov). In addition, the uncertainty of EPIC calibration is probably larger than we expected before (See section Data, EPIC L1B). Second, we seek to retrieve AOCH for the smoke plumes that are optically much thicker than the cases that were studied in the past work. Few studies have studied the altitudes of the smoke plumes associated with the fires in August-December of 2020, the largest wildfire season in California’s modern history (Morris and Dennis, 2021). The two most severe smoke pollution events occurred on September 7–9 and September 14–16, respectively, and they are therefore selected for this study. Finally, not only the change of smoke layer height from both source and downwind regions but also the implications of this work to estimate surface PM2.5 pollution are demonstrated. Of particular interest is the diurnal variation of AOCH that can be uniquely observed by EPIC, as well as its implication for surface air quality.
The EPIC imager is aboard the DSCOVR platform, which was launched in February 2015 to the Lagrange-1 point that gives EPIC a unique viewing perspective to provide the measurements of the sunlit Earth disk every 1–2 h. The EPIC level 1B data used in this study are obtained from NASA Aura Validation Data Center (https://avdc.gsfc.nasa.gov/pub/DSCOVR/Level1b_v03/). The EPIC instrument uses a 30-cm aperture Cassegrain telescope to measure the backscattered solar radiance at 10 narrow bands including oxygen A and B bands with a spatial resolution of 10 km at nadir and 20 km at a viewing zenith angle of 60°. The raw data from EPIC are post-launch calibrated using the well-calibrated measurement from Ozone Mapping and Profiler Suite (OMPS) for four UV (ultraviolet) channels, MODIS Aqua and Terra level 1B top-of-atmosphere (TOA) reflectance for four visible and NIR channels, and EPIC lunar observations for two oxygen absorption bands (Geogdzhayev and Marshak, 2018; Marshak et al., 2018). However, the official calibration coefficients for the EPIC measurements at visible and NIR channels have not been updated since 2017 (https://epic.gsfc.nasa.gov).
Besides from Geogdzhayev and Marshak (2018), several other studies carried out the calibration for EPIC visible and NIR channels using MODIS, Visible Infrared Imaging Radiometer (VIIRS) or Multi-angle Imaging Spectroradiometer (MISR) data as references (Haney et al., 2016; Doelling et al., 2019; Geogdzhayev et al., 2021). The inter-comparison of calibration coefficients from different studies indicates that the accuracy of EPIC inter-calibration depends on the referenced satellite sensor, the platform upon which the sensor resides and the calibration methodology. For example, the uncertainties of MODIS (Aqua and Terra) and VIIRS/S-NPP (Suomi National Polar-Orbiting Partnership) onboard calibration for reflective solar bands (RSB) are both ∼2% (Choi et al., 2016; Xiong et al., 2017), but a 6% positive bias exists for the VIIRS/S-NPP M5 band (672 nm) with respect to MODIS/Aqua B1 channel (646 nm) after accounting for the different spectral response functions of the two instruments (Sayer et al., 2017). However, Doelling et al. (2019) reported that the relative difference in EPIC calibration at 680 nm between using VIIRS/S-NPP M5 band and MODIS/Aqua B1 band is only 3%, indicating an uncertainty of at least 1.5% in their calibration process itself, which is higher than the calibration discrepancy of 0.3% at 680 nm between ATO-RM (all-sky tropical ocean ray-matching) and DCC-RM (deep convective cloud ray-matching) algorithms adopted by their study. Additionally, the calibration difference in the specific referenced sensor onboard different platforms also contributes to the uncertainty of EPIC calibration. The calibration differences between MODIS Aqua and Terra for RSB are within 1.5% (Xiong et al., 2020), but MODIS/Aqua-based EPIC calibration coefficients at 780 nm is 2% lower than that derived from MODIS/Terra (Geogdzhayev et al., 2021). The calibration coefficients for VIIRS/S-NPP at RSB are lower than that of VIIRS/NOAA-20 by 3–7% (Xiong et al., 2020). The MODIS-based EPIC calibration by Doelling et al. (2019) agrees with Geogdzhayev and Marshak (2018) within 1.6% and Geogdzhayev et al. (2021) within 2.6%. Overall, the uncertainty of EPIC calibration using MODIS or VIIRS data as references can be up to 8.5% as we analyzed above, with 7% attributable to the satellite data used as reference (Sayer et al., 2017; Xiong et al., 2020) and at least 1.5% attributable to the calibration process itself.
There are also disagreements regarding the degradation of EPIC instruments among different studies. For instance, Geogdzhayev and Marshak, (2018) reported that there is little degradation of EPIC instruments for four visible and NIR channels based on an 18-month EPIC calibration using MODIS (Aqua and Terra) data. In contrast, Doelling et al. (2019) concluded that the trend of EPIC gain is within 0.15% per year based on a 4-year calibration using VIIRS/S-NPP data. However, Geogdzhayev et al. (2021) found the trend of EPIC calibration coefficient at 443 nm is statistically significant (p = 0.006) with a value of 0.27% per year based on a 5-year EPIC calibration derived from multiple Low Earth Orbit (LEO) instruments. These disagreements again underscore the need to adjust EPIC calibrations for aerosol retrievals. Considering the degradation trend at 443 nm of 0.27% per year (Geogdzhayev et al., 2021) from June 2015 to September 2020, the total uncertainty of EPIC 443 nm in September 2020 could be up to 10%. Indeed, it is not uncommon that the algorithms for aerosol retrievals need further calibration adjustment to the satellite L1B data, such as the empirical corrections to the MISR data (Limbacher and Kahn, 2015; Garay et al., 2020) and MODIS data (Sayer et al., 2015).
The EPIC level 2 UV aerosol product (version 3) obtained from the NASA Langley Research Center Atmospheric Science Data Center (https://doi.org/10.5067/EPIC/DSCOVR/L2_AER_03) are also used in this study. The EPIC UV aerosol retrieval algorithm (Ahn et al., 2021) uses a set of aerosol models, which are identical to those assumed in OMI (Ozone Monitoring Instrument) algorithm (Herman et al., 1997; Torres et al., 2007; Jethva and Torres, 2011; Torres et al., 2013), to represent the carbonaceous aerosols from wildfires and biomass burning, dust and sulfate-based aerosols. The EPIC UV Aerosol Index (UVAI) is derived from 340 to 388 nm radiances for all sky conditions (Torres et al., 2018; Ahn et al., 2021). It is indicative of the presence of absorbing aerosols (smoke, dust, or both particles) at free troposphere and above. The UVAI is sensitive to ALH, aerosol optical depth (AOD) and single scattering albedo (SSA) (Hsu et al., 1999). Jeong and Hsu (2008) retrieved SSA by using UVAI derived from OMI data, MODIS AOD and ALH from CALIOP, then they derived ALH by constraining UVAI, AOD and SSA. Lee et al. (2020) followed the same idea but replace MODIS AOD and OMI UVAI with VIIRS AOD and UVAI from OMPS-NM (Ozone Mapping and Profiler Suite Nadir Mapper). Xu et al. (2019) found the relationship between EPIC UVAI and EPIC ALH varies with different AOD values. In summary, there is no monotonic relationship between UVAI and ALH, because of the dependence of UVAI on the aerosol loading and absorption properties; for the same UVAI value, it can be a result of various combinations of AOD, SSA, and ALH.
CALIOP is an elastic backscatter lidar measuring the attenuated backscattered signal at both 532 and 1,064 nm. It is aboard the Cloud-Aerosol Lidar and Infrared Pathfinder Satellite Observation (CALIPSO) spacecraft in a sun-synchronous orbit with an equatorial crossing time of around 13:30 local time and a repeat cycle of 16 days (Winker et al., 2009). Vertical profiles of aerosol extinction coefficient at 532 nm are obtained from CALIOP level 2 Aerosol Profile product (https://doi.org/10.5067/CALIOP/CALIPSO/CAL_LID_L2_05kmAPro-Standard-V4-21), which has a vertical resolution of 60 m and a horizontal resolution of 5 km. The aerosol extinction profile from CALIOP level 2 product is used to validate the EPIC AOCH retrievals.
The calibrated hyperspectral measurements at visible and near infrared bands from TROPOMI level 1B product (UVIS bands: https://doi.org/10.5067/SENTINEL5P/S5P_L1B_RA_BD3_HiR.1; NIR bands: https://doi.org/10.5067/SENTINEL5P/S5P_L1B_RA_BD6_HiR.1) are convolved to conduct the soft-calibration for EPIC level 1B data. TROPOMI is aboard the Sentinel-5 Precursor (S5P) satellite, which was launched to a sun-synchronous polar orbit on October 13, 2017. With a local overpassing time of around 13:30, TROPOMI can cover the near-global domain in a single day (Veefkind et al., 2012). TROPOMI contains 4 spectrometers covering the ultraviolet (UV), visible (UVIS), NIR and shortwave infrared (SWIR). The spectral resolutions for UV, UVIS, NIR and SWIR bands are 0.45–0.5, 0.45–0.65, 0.34–0.35 and 0.225–0.227 nm, respectively. The footprint size is 5.5 × 7 km2 for SWIR bands, 5.5 × 3.5 km2 for UVIS, NIR and UV band 2 (300–332 nm) and 5.5 × 28 km2 for UV band 1 (267–300 nm).
TROPOMI has the onboard calibration capacity. Its regular calibration is conducted on the eclipse side of the orbit with the internal light sources of TROPOMI to correct the degradation and gain drifts of UV, UVIS and NIR detectors over time. The uncertainty of pre-launch calibration for absolute radiance and irradiance at UVIS and NIR bands is in the range of 0.8–1.3% (Kleipool et al., 2018), and the gain drifts with respect to pre-launch calibration can always be corrected to below 0.1%. The solar angular dependence of the irradiance radiometry is calibrated after launch with higher accuracy and angular sampling than pre-launch calibration. The inconsistency of the absolute irradiance calibration in the overlapped spectral range between UV and UVIS bands are corrected during the in-flight calibration. See more details in Ludewig et al. (2020). The reflectance data from TROPOMI is estimated to have an uncertainty of 1% (Kleipool et al., 2018; Ludewig et al., 2020).
The smoke AOCH values retrieved from EPIC are also compared with the ALH from S5P_L2__AER_LH version 1 product (https://doi.org/10.5270/S5P-j7aj4gr) provided by TROPOMI. The TROPOMI ALH retrieval uses the optimal estimation method for spectral fitting with various aerosol layer pressures and aerosol optical thicknesses in the oxygen A-band. By training a neural network model, the hyperspectral TROPOMI TOA radiance can be simulated with high speed to reduce the computation cost in the ALH algorithm (de Graaf et al., 2019; Nanda et al., 2019). The TROPOMI ALH retrieval algorithm assumes a uniform distribution of aerosols in a single layer with a constant thickness of 50 hPa, and it adopts a single aerosol model with single scattering albedo equal to 0.95 and the Henyey-Greenstein phase function for which the asymmetry factor is 0.7 (de Graaf et al., 2019). The TROPOMI ALH is shown to have a mean negative bias of more than 2 km over land, as compared with CALIOP data, primarily due to the high surface reflectance in O2 A-band that is not favorable for aerosol retrievals (Griffin et al., 2020; Nanda et al., 2020).
Hourly measurements of surface PM2.5 concentrations are collected from United States Environmental Protection Agency (EPA) Air Quality System (https://www.epa.gov/aqs). The PM2.5 dry mass concentrations are measured by Beta Attenuation Monitor (Schweizer et al., 2016), Tapered Element Oscillating Microbalance (Sofowote et al., 2014) techniques, and other methods (Wang et al., 2006b). The data closest to the EPIC overpass time are used to investigate the relationship of smoke layer height and surface PM2.5 pollution.
Aqua is a sun-synchronous satellite passing over the equator in the local afternoon, with a payload imaging sensor MODIS onboard. MCD19A2 AOD product (https://doi.org/10.5067/MODIS/MCD19A2.006) at 1 km resolution based on MODIS MAIAC algorithm is used in this study to compare the AOD retrieved from EPIC. The validation of global MAIAC AOD retrievals during 2000–2016 shows 66% of total retrievals agree with AERONET within ±0.05 ± 0.1 (Lyapustin et al., 2018), where is AOD measured by AErosol RObotic NETwork or AERONET. The AERONET AOD is derived based on Beer-Lambert-Bouguer law from the direct sun measurements by ground-based sun photometers at multiple wavelengths. The AERONET instruments are calibrated routinely at least twice per year, and the absolute uncertainty of AOD from a newly calibrated field instrument is no larger than 0.01 at the wavelength longer than 440 nm under cloud-free condition (Holben et al., 1998).
Hyperspectral measurements at UVIS and NIR bands from TROPOMI are convolved to EPIC narrow bands at 443, 551, 680, 688, 764 and 780 nm using the spectral response function of the EPIC instrument (Chen et al., 2021). To evaluate and update the EPIC level 1B calibration, we picked four boxes with each box containing 10 × 10 EPIC pixels over a convective cloud in eastern United States on September 15, 2020 and compared the EPIC TOA reflectance with convolved and well-calibrated TROPOMI TOA (top-of-atmosphere) reflectance (Figure 1). The near-Lambertian reflectance of convective cloud weakens the geometric dependence of TOA reflectance and thus minimizes the discrepancy between EPIC and TROPOMI observations (Doelling et al., 2013). High-resolution TROPOMI observations are re-gridded to EPIC grid size. The atmospheric window channel 443 nm is used for the EPIC AOD retrieval and the ratio of O2 B absorption band to the continuum band (688/680) plays an important role in EPIC AOCH retrieval. Therefore, we scale the original EPIC L1B data based on the ratios of TROPOMI TOA reflectance to EPIC counterparts at 443, 680 and 688 nm. 764 and 780 nm are not scaled since the ratio of 764/780 nm from EPIC is very close to that of TROPOMI data (Figure 1). No other channels are used in our algorithm.
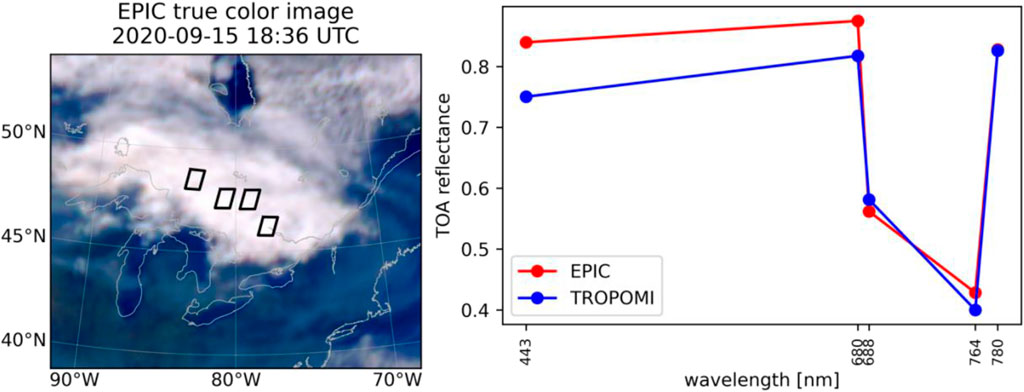
FIGURE 1. Comparison of TOA reflectance from EPIC and TROPOMI. Four boxes (thick black polylines) with each box containing 10 × 10 pixels over a convective cloud in Eastern America on September 15, 2020, are selected for the comparison (left). Mean TOA reflectance of 400 pixels from EPIC and TROPOMI at 443, 680, 764 and 780 nm are compared (right). TROPOMI TOA reflectance values are convolved to EPIC narrow bands using the spectral response function of EPIC. Evaluation of the AOD and AOCH retrievals.
There are several advantages in using TROPOMI data to derive the EPIC calibration coefficients compared to using MODIS and VIIRS data. First, as a young mission launched in October 2017, TROPOMI has a lower calibration uncertainty (∼1%) for the reflectance at the TOA (Kleipool et al., 2018; Ludewig et al., 2020) than MODIS and VIIRS (∼2%) (Choi et al., 2016; Xiong et al., 2017); this superiority is due to TROPOMI’s onboard calibration facility including the daily measurements of spectral radiances directly from the Sun. Second, the convolution of hyperspectral measurements of TROPOMI to EPIC narrow bands using EPIC spectral response functions avoids the complex correction accounting for the different position and bandwidth between EPIC and MODIS (or VIIRS) channels. MODIS (or VIIRS) channels have bandwidth of 10 nm or larger, while EPIC bands have bandwidth of ∼2 nm or less. Finally, any systematic bias in TROPOMI spectrometers could be cancelled out since the TROPOMI measurements used in the vicarious calibration are reflectance-based, because all optical elements for the Earth-view mode are included in the optical path for solar irradiance measurement in TROPOMI instrument (Ludewig et al., 2020).
The smoke AOCH algorithm was originally developed and described in detail by Xu et al. (2017) and Xu et al. (2019). It assumes a quasi-Gaussian aerosol vertical profile characterized by total column AOD and the extinction peak height with a half-width parameter of 1 km following Xu et al. (2017). The height at which the aerosol extinction peaks retrieved by our algorithm is the optical centroid height, so that it is called AOCH (aerosol optical centroid height). The ALH is a broader terminology referring to the aerosol vertical position information retrieved from passive satellite remote sensing techniques, such as aerosol stereo height from MISR (Nelson et al., 2013), aerosol injection height from MODIS MAIAC thermal technique (Lyapustin et al., 2020) and aerosol mid-layer height from TROPOMI (Nanda et al., 2019). After cloud screening using reflectance at 443, 551 and 780 nm, AOD is retrieved from using EPIC atmospheric window channel 443 nm, and the AOCH is derived subsequently based on the ratios of oxygen A and B bands to their respective neighboring continuum bands (764/780 and 688/680). Following Xu et al. (2019), the surface reflectance for water surface comes from GOME-2 Lambert-equivalent reflectivity (LER) product (Tilstra et al., 2017). A 10-year climatology of Lambertian surface reflectance from MODIS BRDF/Albedo product (MCD43) (Schaaf et al., 2002) is applied for the land surface. Cloud mask is conducted through the spatial homogeneity tests at 443 and 551 nm, as well as the brightness tests with the prescribed threshold of TOA reflectance at 443 and 680 nm for land and 443, 680, and 780 over water. The water pixels with a sun glint angle smaller than 30° are removed (Levy et al., 2013). The retrieval algorithm is based on the lookup table constructed by running the radiative transfer model UNL-VRTM (Unified and Linearized Vector Radiative Transfer Model) (Spurr, 2008; Spurr et al., 2012; Wang et al., 2014). Those pixels with EPIC UVAI less than 1 are removed since we only focus on the heavy smoke plume here.
AOD retrieved from EPIC is compared against the AOD from the MODIS/Aqua level 2 MYD04_3K product qualitatively. The collocated aerosol extinction profiles at 532 nm from CALIOP level 2 product are used to calculate an extinction weighted aerosol height AOCHCALIOP for the validation of EPIC AOCH.
where βext,i is 532 nm aerosol extinction coefficient at vertical level i with an altitude of Zi. The EPIC AOCH from EPIC retrieval is also compared with TROPOMI level 2 aerosol layer height product. The EPIC retrievals from the measurements closest to the overpass time of Aqua, CALIPSO and TROPOMI for each day are used in the validation. It is worth noting that CALIOP may lack sufficient sensitivity to detect the aerosol amount at the vertical resolution of 60 m and therefore the level 2 data product would report those layers as no-aerosols (Winker et al., 2013). However, since aerosols are omnipresent in the atmosphere, the accumulation of these below-the-detection-limit 60-m layer of aerosols can lead to a biased CALIOP AOCH. Here, to account for this effect, we, as in our past study (Xu et al., 2019), assume a exponentially decayed background aerosol profile with a columnar AOD of 0.07 for those clear-air layers from CALIOP level 2 data.
The EPIC TOA reflectance values at 443 and 680 nm are much lower than the TROPOMI counterparts, while they are relatively close to each other at 688, 764 and 780 nm. The ratios of mean TOA reflectance of TROPOMI to EPIC are used as scaling factors as vicarious calibration of EPIC measurements at 443, 680 and 688 nm, which are 0.894, 0.934 and 1.03, respectively. It is not surprising that we need the corrections of −10.6% and −6.6% at 443 and 680 nm to align EPIC reflectance values to TROPOMI ones, since the EPIC calibration uncertainty is 10% at 443 nm and 8.5% at other visible and NIR bands (See section DATA/EPIC L1B), and an uncertainty of 1.2–1.3% exists in TROPOMI UVIS channels (Kleipool et al., 2018). While we also had similar findings for other cases (figure not shown), more studies are needed in the future to reduce the EPIC calibration uncertainty. The channels of 764 and 780 nm are not scaled since the discrepancy of the 764/780 ratio between EPIC and TROPOMI is small, and it is the ratio of oxygen absorption band to continuum band (688/680 and 764/780) matters in the AOCH retrieval. Besides, the AOCH over land is primarily retrieved from the ratio of O2 B band and its continuum, because the O2 B band has a much lower land surface reflectance than O2 A band.
Figure 2 shows the comparison of EPIC AOD with and without the vicarious calibration (VC) to the MODIS MAIAC AOD. The EPIC AOD retrieved after the VC is lower than that before the VC (i.e., using the calibration coefficient published in Geogdzhayev and Marshak, 2018), which is expected because EPIC TOA reflectance at 443 nm used for AOD retrieval decreases after VC. Generally, EPIC AOD retrieval captures the smoke plumes shown in the EPIC true color image and shares a similar spatial pattern with MODIS MAIAC AOD. However, the EPIC AOD values after the VC are lower than MAIAC AOD values. Note that the AOD retrievals from EPIC and MODIS MAIAC algorithm are at different wavelengths. It is not surprising the EPIC AOD at longer wavelength (680 nm) is lower than MAIAC AOD at shorter wavelength (550 nm). Previous studies reported the Angstrom exponent (AE) at 550–680 nm for aging smoke particles is at the range of 1.4–2.2 (Reid et al., 1999; Sicard et al., 2019). The ratio of AOD at 680 nm to that at 550 nm is around 0.63–0.74 for this range of AE, which is consistent with the comparison between EPIC 680 nm AOD and MODIS MAIAC 550 nm AOD. Besides, EPIC AOD retrieval has a larger spatial coverage than MAIAC AOD over the areas with extremely heavy smoke plumes. On September 9 and 14, MAIAC algorithm has little valid retrievals over the downwind region of the west coast of United States and South of the Great Lakes, respectively, which can be identified as heavy smoke layers from the EPIC true color images (Figure 1) and EPIC UVAI data (Figure 2). This is understandable because the operational algorithm can often mis-classify heavy aerosol layers as cloud layers and so, no retrievals of AOD are made in these cases (Shi et al., 2019). In addition, we also compared our EPIC AOD retrieval to the AERONET level 1.5 AOD product. We find the root mean square error (RMSE) decreases from 0.68 to 0.37 and the correlation coefficient (R) value increase by 0.25 after the VC. This suggests a better EPIC AOD retrieval with the VC (figure not shown). We will continue to assess the VC once the best quality level 2.0 AOD data is available.
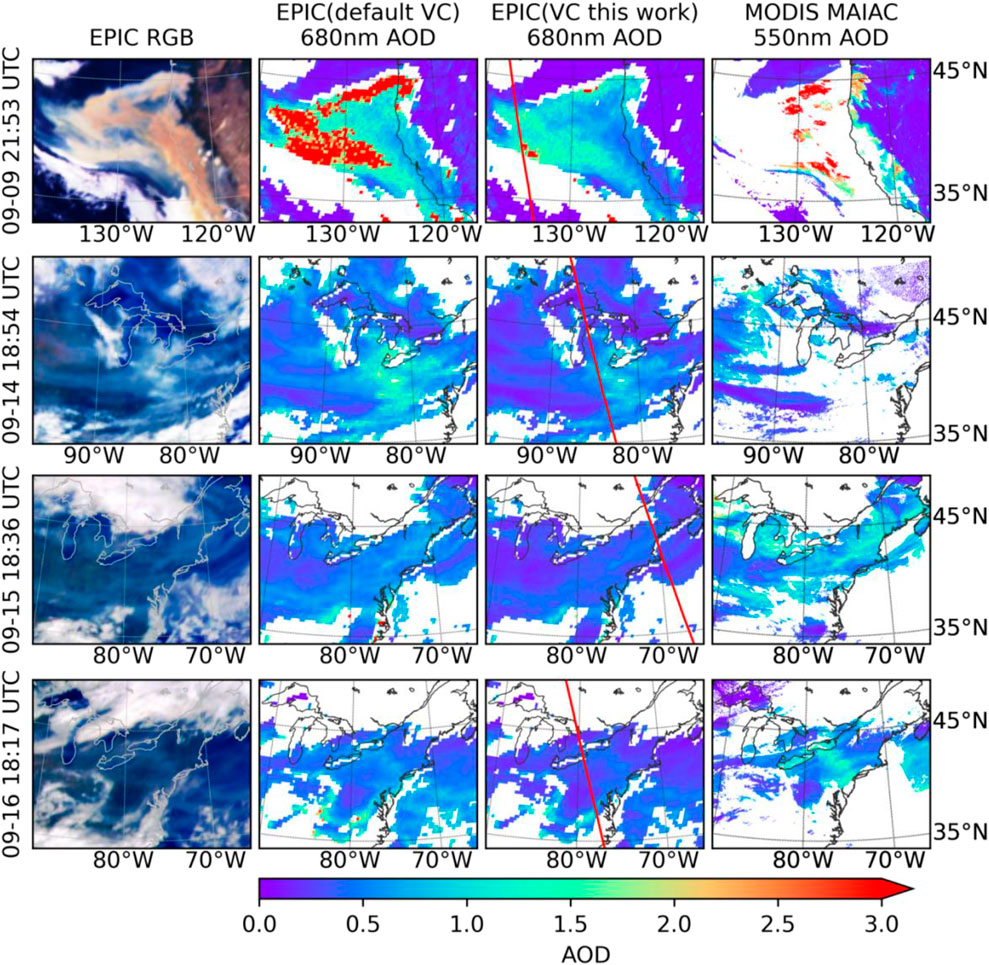
FIGURE 2. Comparison of EPIC AOD and MODIS MAIAC AOD for September 9 and 14–16. The first column is EPIC true color image composed of 443, 551 and 680 nm measurements. The second and third columns are EPIC 680 nm AOD retrievals without and with vicarious calibration. The red lines in the third columns are the CALIOP sub-orbital tracks on each day. The last column is MODIS MAIAC AOD at 550 nm.
The EPIC AOCH retrievals before and after the VC are compared with TROPOMI operational ALH product from KNMI (Royal Netherlands Meteorological Institute) (Figure 3). The EPIC AOCH values increase by 3–4 km after the VC, mainly due to the VC-induced increase of 688/680 ratio. TROPOMI operational ALH values is lower than EPIC AOCH values with the VC by 2–3 km. However, TROPOMI operational ALH product has large uncertainty especially over land. Nanda et al. (2020) reported that TROPOMI ALH product has a negative bias and can be lower than CALIOP ALH by 2.41 km over land and 1.03 km over ocean on average.
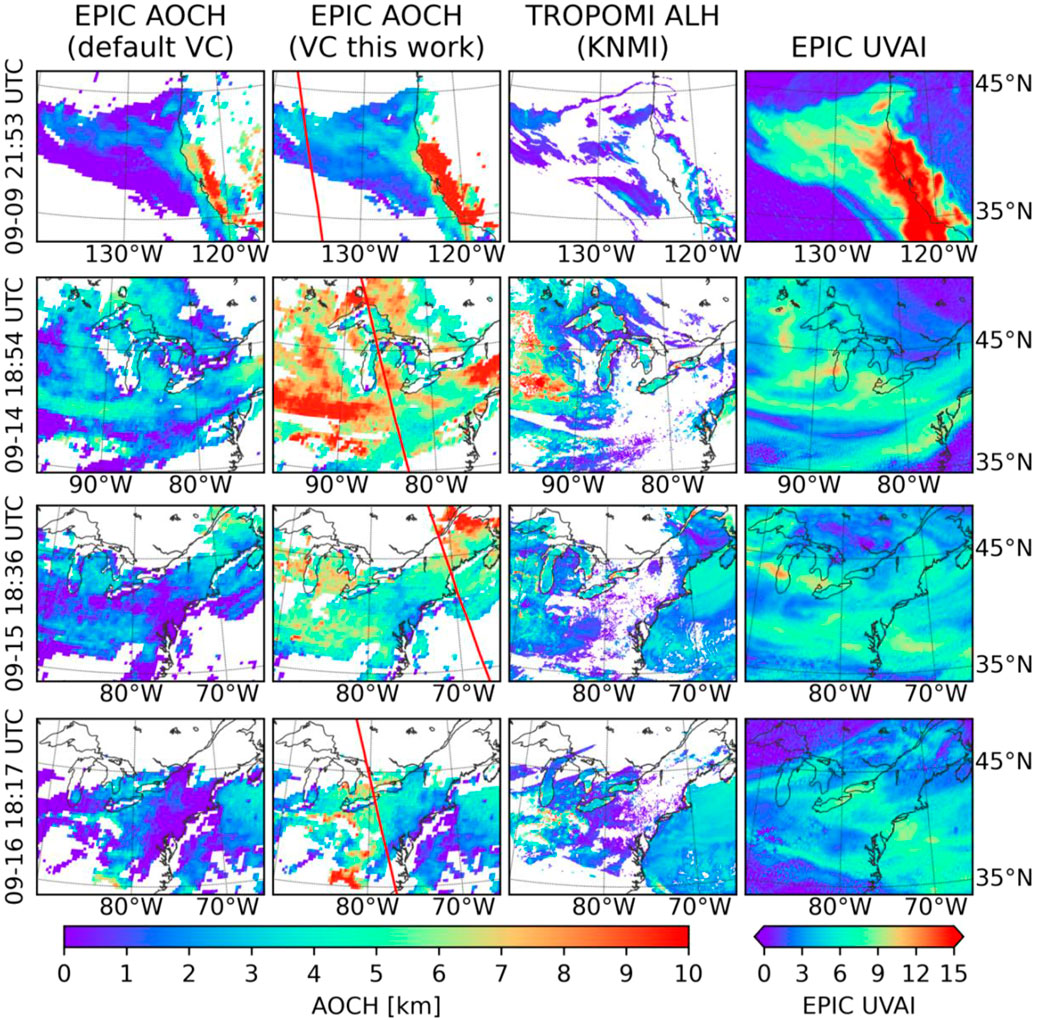
FIGURE 3. Comparison of EPIC AOCH and TROPOMI operational ALH product for September 9 and 14–16. The first and second columns are EPIC AOCH retrievals without and with vicarious calibration. The red lines in the second columns are the CALIOP sub-orbital tracks on each day. The third column is the TROPOMI operational ALH product from KNMI. The last column is the EPIC UVAI.
To further evaluate the EPIC AOCH retrieval with the VC, the extinction-weighted heights calculated from the CALIOP aerosol extinction profile are used (Figures 4, 5). The CALIOP tracks are marked by the red lines in Figure 3. As shown by Figure 4, the EPIC AOCH after the VC matches the CALIOP AOCH well, while the EPIC AOCH retrieval without the VC is lower than the CALIOP AOCH by 1–3 km. Figure 5 indicates that not only the RMSE reduces from 2.76 to 0.91 km after the VC, but the correlation coefficient (R) also improves from 0.736 to 0.885. The discrepancy between CALIOP AOCH and EPIC counterparts with the VC is generally less than 1 km, which is lower than the uncertainty of more than 2 km over land for TROPOMI operational ALH product (Nanda et al., 2020; Chen et al., 2021).
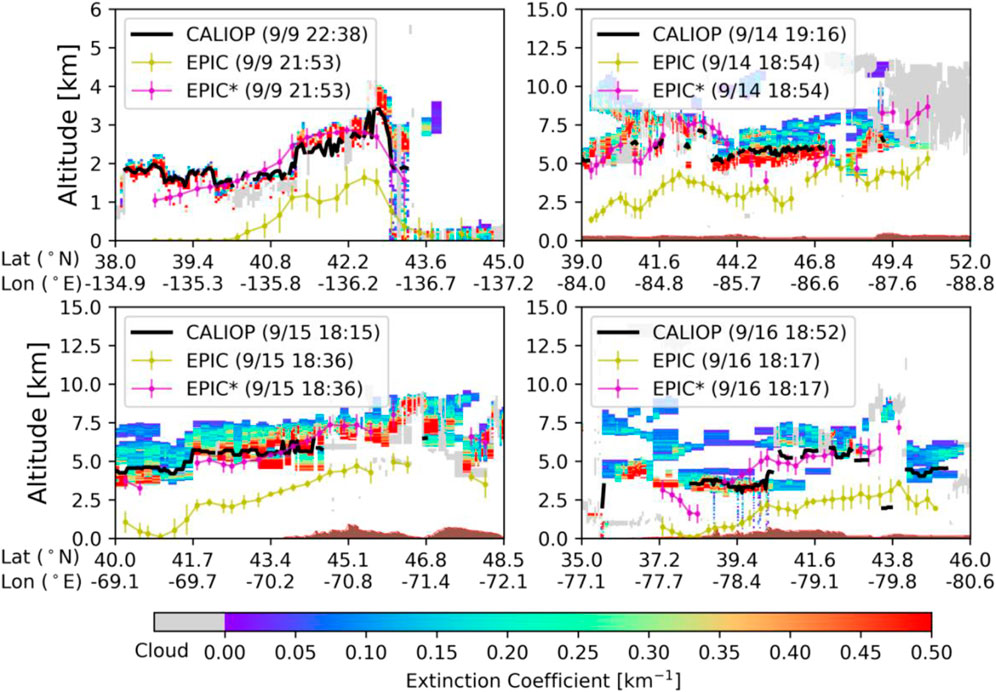
FIGURE 4. Comparison of EPIC AOCH and CALIOP aerosol extinction profile as well as CALIOP AOCH for September 9 and 14–16. The CALIOP tracks are marked by red lines in Figure 3. The CALIOP AOCH values are represented by black lines, and EPIC AOCH retrievals with the vicarious calibration (EPIC*) and without the vicarious calibration (EPIC) are marked by pink and yellow lines respectively.
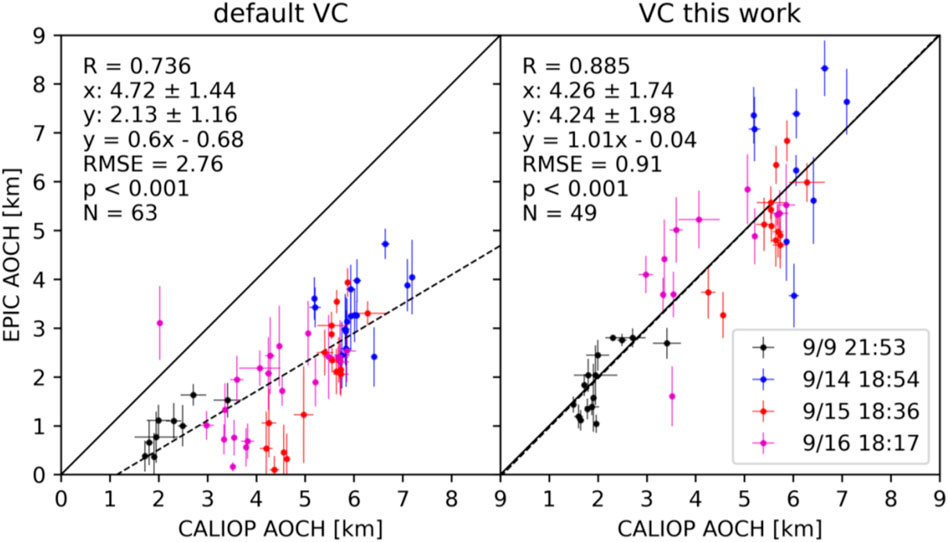
FIGURE 5. Scatter plot of EPIC AOCH retrieval and CALIOP AOCH for September 9 and 14–16. The left panel shows the EPIC retrieval without the vicarious calibration, and the right panel shows that with the vicarious calibration.
The diurnal variation of smoke layer height over land from local morning to local noon time (17:06–20:42 UTC) on September 7 is investigated to reveal the implications of aerosol layer height on the surface PM2.5 pollution (Figure 6). We did not extend the analysis to the afternoon because the fire activity and probably the smoke optical depth reach the peak in the late afternoon (Giglio et al., 2006). It would be more helpful to investigate the time period when the smoke optical depth changes little, but show a large hourly variation, since our focus here is to illustrate the implications of hourly variation of smoke height on the surface PM2.5. The heavy smoke layer extended from California to the Colorado, which can be clearly seen from the EPIC true color image and UVAI maps. The surface PM2.5 concentrations measured at EPA sites in California, southern Nevada and Utah exceed the National Ambient Air Quality Standard (NAAQS) for 24-h PM2.5 pollution (35 μg m−3). The mean AOCH values of the smoke plume decreased from 6.0 to 4.3 km within 216 min. The hourly variations have significant impacts on the surface PM2.5 pollution. In the areas indicated by the black ellipse in Figure 6, the PM2.5 concentrations increase during this time period as the smoke layer was descending. Meanwhile, the AOD does not show much temporal variation.
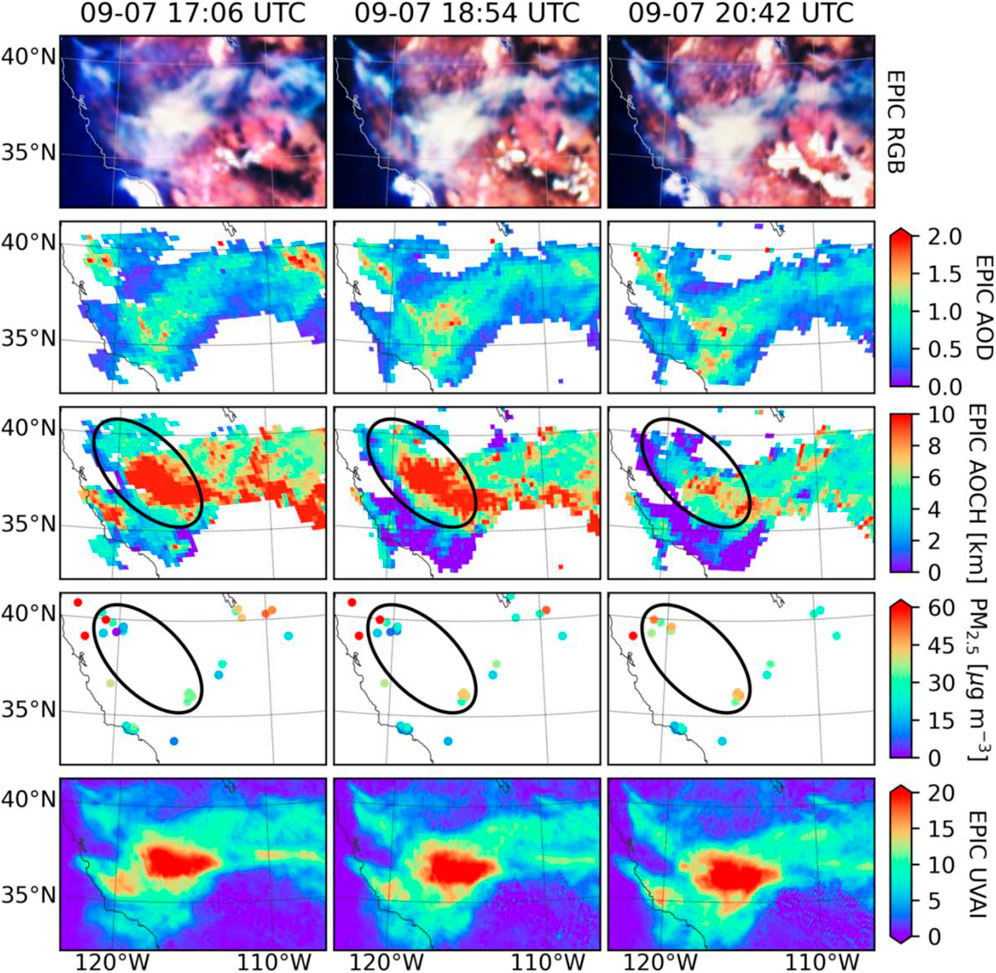
FIGURE 6. Diurnal variation of EPIC AOCH and its implication on surface PM2.5 concentration from 17:06 to 20:42 UTC on September 7, 2020. The first row is EPIC true color image, and the second row is the EPIC AOD. The third row is the EPIC AOCH retrievals, and the fourth row is the EPA surface PM2.5 mass concentrations at 17:00, 19:00 and 21:00 UTC respectively. The last row is EPIC UVAI.
For comparison, we also studied the hourly change of smoke height and surface PM2.5 over Eastern United States from 15:00 to 16:48 UTC on September 15 (Figure 7). Since the long-range transport diffuses the smoke plumes, the smoke layer in Eastern United States exhibits a smaller AOD than that over western United States on September 7. The majority of PM2.5 measurements in Eastern United States on September 15 are lower than 20 μg m−3. The PM2.5 concentrations are higher in the southwest of the research domain indicated by the pink circle in Figure 7 than that in the northeast indicated by the black circle, with the AOD values even lower in the southwest than northeast. Again, this is due to the lower smoke height in the southwestern region, which also indicates the smoke plumes already affected the surface PM2.5 concentrations at least in the southwestern region. However, since both the AOD and AOCH do not show much hourly variation in the whole Eastern United States domain, the surface PM2.5 concentrations remain at similar level during these 2 hours.
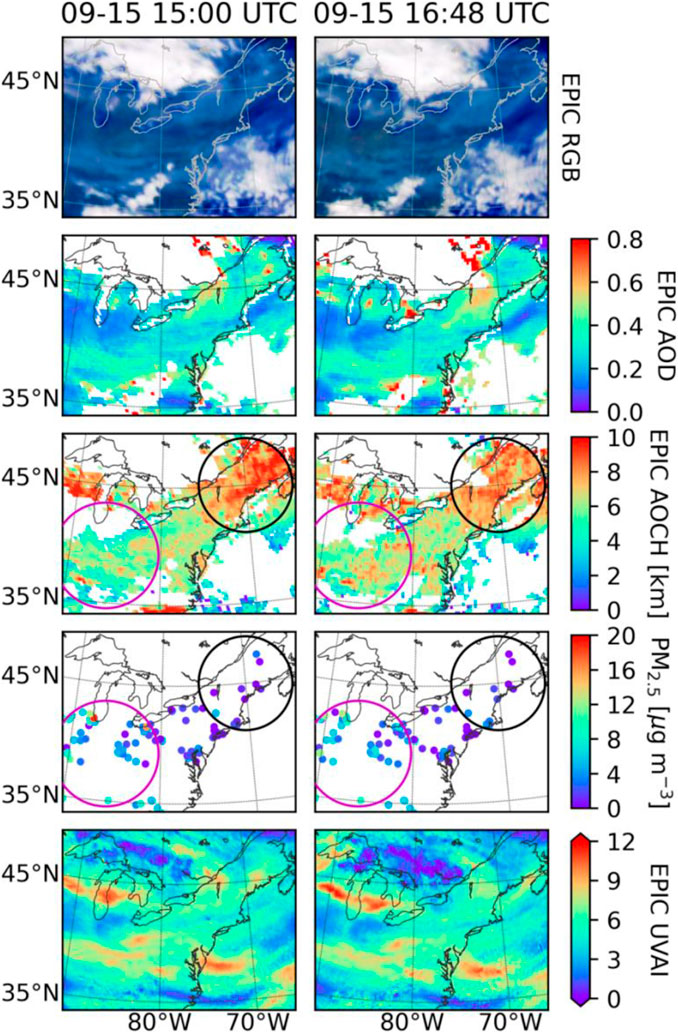
FIGURE 7. Same as Figure 6, but for 15:00–16:48 UTC on September 15, 2020.
This study applied vicarious calibration to EPIC measurements based on the TROPOMI level 1B data to retrieve the smoke aerosol optical centroid heights for the 2020 California fire events on September 7, 9 and 14–16, because the EPIC instrument does not have on-board calibration and its after-launch calibration is out of date. The cases of September 9 and 14–16 are used for validation of the EPIC retrievals after the new calibration. Subsequently, the implication of hourly variation of the smoke heights on the surface PM2.5 pollution on September 7 and 15 is investigated.
The vicarious calibration leads to important improvement of the EPIC AOCH retrieval. Without the new calibration, the EPIC AOCH is lower than the CALIOP AOCH by 1–3 km, while after the vicarious calibration, the EPIC AOCH retrieval matches with the CALIOP AOCH very well. The RMSE of the AOCH retrievals reduces from 2.76 to 0.91 km, and the correlation coefficient increases from 0.736 to 0.885 after the vicarious calibration. The TROPOMI operational ALH product is lower than the new EPIC AOCH retrieval by 2–3 km, which is consistent with Nanda et al. (2020).
The case studies on September 7 and 15 indicate that the spatial and diurnal variations of smoke plume height have significant implications on the surface PM2.5 pollution. The hourly change of smoke height and the response of surface PM2.5 thereafter are of particular interest as it can be uniquely investigated via EPIC observations. The descending of the smoke height in ∼3.5 h on September 7 leads to the increase of surface PM2.5 concentrations. By contrast, the smoke height did not change much during 15:00–16:48 UTC on September 15 over Eastern United States, and there is little hourly variation in PM2.5 concentrations during this time period.
This study is the among the first to demonstrate the feasibility to retrieve simultaneous hourly AOD and AOCH for thick smoke plumes in the United States from a passive-sensing instrument without on-board calibration, such as EPIC; hourly AODs from geostationary satellites have been available but without AOCH information. As the big fires occurred in many parts of the world in the last several years and are likely to continue as a result of global warming, the impacts of these fires on air quality have to be mitigated with the better monitoring and predictions of smoke transport, specially the placement of smoke layer in the vertical with respect to the planetary boundary layer where human live. While more studies are needed, the work here shows the critical value of passive sensors such as EPIC to derive hourly AOCH and mapping the vertical movement of smoke layer with large spatial coverage, all of which can potentially needed to the improvement of surface air quality monitoring and prediction.
The major limitation of our current algorithm includes two perspectives: 1) the surface reflectance is assumed to be Lambertian, and we will consider BRDF in the future; 2) sometimes the retrieval results have some shattered cloud contamination, and we plan to apply the spectral slope test as in Chen et al. (2021) and post processing to further remove the cloud noise. In addition, we are going to improve the algorithm in the following perspectives: 1) calculate the UVAI online and set some threshold to determine whether to do the retrieval for each pixel; 2) develop some techniques to separate the smoke and dust aerosol and apply proper aerosol model in the retrieval; 3) retrieve hourly AOCH and AOD from EPIC operationally.
The original contributions presented in the study are included in the article/Supplementary Material, further inquiries can be directed to the corresponding author.
ZL performed the retrievals and data analysis. ZL and JW wrote the paper. JW designed the research. XX developed the retrieval algorithm. XC generated the lookup table and convolved the TROPOMI L1B data. SK, OT, and EW contributed to writing. JZ contributed to the research design. ZL and JW also refined the algorithm.
This work is supported by the NASA DSCOVR program (grant #: 80NSSC19K1283), NASA’s Applied Science program, HAQST science team (grant #: 80NSSC21K0428), NASA’s FIREX-AQ program (grant #: 80NSSC18K0791), NASA’s Terra/Aqua/SNPP program (grant #: 80NSSC18K0846), and NOAA GEO-XO program (NA21OAR4310249).
The authors declare that the research was conducted in the absence of any commercial or financial relationships that could be construed as a potential conflict of interest.
All claims expressed in this article are solely those of the authors and do not necessarily represent those of their affiliated organizations, or those of the publisher, the editors and the reviewers. Any product that may be evaluated in this article, or claim that may be made by its manufacturer, is not guaranteed or endorsed by the publisher.
Ahn, C., Torres, O., Jethva, H., Tiruchirapalli, R., and Huang, L. K. (2021). Evaluation of Aerosol Properties Observed by DSCOVR/EPIC Instrument from the Earth-Sun Lagrange 1 Orbit. Geophys. Res. Atmos. 126 (12), e2020JD033651. doi:10.1029/2020JD033651
Chen, X., Wang, J., Xu, X., Zhou, M., Zhang, H., Castro Garcia, L., et al. (2021). First Retrieval of Absorbing Aerosol Height over Dark Target Using TROPOMI Oxygen B Band: Algorithm Development and Application for Surface Particulate Matter Estimates. Remote Sensing Environ. 265, 112674. doi:10.1016/j.rse.2021.112674
Choi, T., Shao, X., Cao, C., and Weng, F. (2016). Radiometric Stability Monitoring of the Suomi NPP Visible Infrared Imaging Radiometer Suite (VIIRS) Reflective Solar Bands Using the Moon. Remote Sensing 8 (1), 15. Retrieved from https://www.mdpi.com/2072-4292/8/1/15.
de Graaf, M., de Haan, J. F., and Sanders, A. F. J. (2019). TROPOMI ATBD of the Aerosol Layer Height. Retrieved from http://www.tropomi.eu/sites/default/files/files/publicSentinel-5P-TROPOMI-ATBD-Aerosol-Height.pdf.
Doelling, D., Haney, C., Bhatt, R., Scarino, B., and Gopalan, A. (2019). The Inter-calibration of the DSCOVR EPIC Imager with Aqua-MODIS and NPP-VIIRS. Remote Sensing 11 (13), 1609. Retrieved from. doi:10.3390/rs11131609 https://www.mdpi.com/2072-4292/11/13/1609.
Doelling, D. R., Morstad, D., Scarino, B. R., Bhatt, R., and Gopalan, A. (2013). The Characterization of Deep Convective Clouds as an Invariant Calibration Target and as a Visible Calibration Technique. IEEE Trans. Geosci. Remote Sensing 51 (3), 1147–1159. doi:10.1109/tgrs.2012.2225066
Garay, M. J., Witek, M. L., Kahn, R. A., Seidel, F. C., Limbacher, J. A., Bull, M. A., et al. (2020). Introducing the 4.4 Km Spatial Resolution Multi-Angle Imaging SpectroRadiometer (MISR) Aerosol Product. Atmos. Meas. Tech. 13 (2), 593–628. doi:10.5194/amt-13-593-2020
Ge, C., Wang, J., and Reid, J. S. (2014). Mesoscale Modeling of Smoke Transport over the Southeast Asian Maritime Continent: Coupling of Smoke Direct Radiative Effect below and above the Low-Level Clouds. Atmos. Chem. Phys. 14 (1), 159–174. doi:10.5194/acp-14-159-2014
Geogdzhayev, I. V., Marshak, A., and Alexandrov, M. (2021). Calibration of the DSCOVR EPIC Visible and NIR Channels Using Multiple LEO Radiometers. Front. Remote Sens. 2 (12). doi:10.3389/frsen.2021.671933
Geogdzhayev, I. V., and Marshak, A. (2018). Calibration of the DSCOVR EPIC Visible and NIR Channels Using MODIS Terra and Aqua Data and EPIC Lunar Observations. Atmos. Meas. Tech. 11 (1), 359–368. doi:10.5194/amt-11-359-2018
Giglio, L., Csiszar, I., and Justice, C. O. (2006). Global Distribution and Seasonality of Active Fires as Observed with the Terra and Aqua Moderate Resolution Imaging Spectroradiometer (MODIS) Sensors. J. Geophys. Res. 111 (G2), a–n. doi:10.1029/2005JG000142
Griffin, D., Sioris, C., Chen, J., Dickson, N., Kovachik, A., de Graaf, M., et al. (2020). The 2018 Fire Season in North America as Seen by TROPOMI: Aerosol Layer Height Intercomparisons and Evaluation of Model-Derived Plume Heights. Atmos. Meas. Tech. 13 (3), 1427–1445. doi:10.5194/amt-13-1427-2020
Haney, C., Doelling, D., Minnis, P., Bhatt, R., Scarino, B., and Gopalan, A. (2016). “The Calibration of the DSCOVR EPIC Multiple Visible Channel Instrument Using MODIS and VIIRS as a Reference,”. Earth Observing Systems Xxi. Editors J. J. Butler, X. Xiong, and X. Gu, 9972. doi:10.1117/12.2238010
Herman, J. R., Bhartia, P. K., Torres, O., Hsu, C., Seftor, C., and Celarier, E. (1997). Global Distribution of UV-Absorbing Aerosols from Nimbus 7/TOMS Data. J. Geophys. Res. 102 (D14), 16911–16922. doi:10.1029/96jd03680
Holben, B. N., Eck, T. F., Slutsker, I., Tanré, D., Buis, J. P., Setzer, A., et al. (1998). AERONET-A Federated Instrument Network and Data Archive for Aerosol Characterization. Remote Sensing Environ. 66 (1), 1–16. doi:10.1016/s0034-4257(98)00031-5
Hsu, N. C., Herman, J. R., Torres, O., Holben, B. N., Tanre, D., Eck, T. F., et al. (1999). Comparisons of the TOMS Aerosol index with Sun-Photometer Aerosol Optical Thickness: Results and Applications. J. Geophys. Res. 104 (D6), 6269–6279. doi:10.1029/1998JD200086
Jeong, M.-J., and Hsu, N. C. (2008). Retrievals of Aerosol Single-Scattering Albedo and Effective Aerosol Layer Height for Biomass-Burning Smoke: Synergy Derived from "A-Train" Sensors. Geophys. Res. Lett. 35 (24). doi:10.1029/2008GL036279
Jethva, H., and Torres, O. (2011). Satellite-based Evidence of Wavelength-dependent Aerosol Absorption in Biomass Burning Smoke Inferred from Ozone Monitoring Instrument. Atmos. Chem. Phys. 11 (20), 10541–10551. doi:10.5194/acp-11-10541-2011
Kipling, Z., Stier, P., Johnson, C. E., Mann, G. W., Bellouin, N., Bauer, S. E., et al. (2016). What Controls the Vertical Distribution of Aerosol? Relationships between Process Sensitivity in HadGEM3-UKCA and Inter-model Variation from AeroCom Phase II. Atmos. Chem. Phys. 16 (4), 2221–2241. doi:10.5194/acp-16-2221-2016
Kleipool, Q., Ludewig, A., Babić, L., Bartstra, R., Braak, R., Dierssen, W., et al. (2018). Pre-launch Calibration Results of the TROPOMI Payload On-Board the Sentinel-5 Precursor Satellite. Atmos. Meas. Tech. 11 (12), 6439–6479. doi:10.5194/amt-11-6439-2018
Koffi, B., Schulz, M., Bréon, F.-M., Dentener, F., Steensen, B. M., Griesfeller, J., et al. (2016). Evaluation of the Aerosol Vertical Distribution in Global Aerosol Models through Comparison against CALIOP Measurements: AeroCom Phase II Results. J. Geophys. Res. Atmos. 121 (12), 7254–7283. doi:10.1002/2015JD024639
Koffi, B., Schulz, M., Bréon, F.-M., Griesfeller, J., Winker, D., Balkanski, Y., et al. (2012). Application of the CALIOP Layer Product to Evaluate the Vertical Distribution of Aerosols Estimated by Global Models: AeroCom Phase I Results. J. Geophys. Res. 117 (D10), a–n. doi:10.1029/2011jd016858
Lee, J., Hsu, N. C., Sayer, A. M., Seftor, C. J., and Kim, W. V. (2021). Aerosol Layer Height with Enhanced Spectral Coverage Achieved by Synergy between VIIRS and OMPS-NM Measurements. IEEE Geosci. Remote Sensing Lett. 18, 949–953. doi:10.1109/lgrs.2020.2992099
Levy, R. C., Mattoo, S., Munchak, L. A., Remer, L. A., Sayer, A. M., Patadia, F., et al. (2013). The Collection 6 MODIS Aerosol Products over Land and Ocean. Atmos. Meas. Tech. 6 (11), 2989–3034. doi:10.5194/amt-6-2989-2013
Limbacher, J. A., and Kahn, R. A. (2015). MISR Empirical Stray Light Corrections in High-Contrast Scenes. Atmos. Meas. Tech. 8 (7), 2927–2943. doi:10.5194/amt-8-2927-2015
Ludewig, A., Kleipool, Q., Bartstra, R., Landzaat, R., Leloux, J., Loots, E., et al. (2020). In-flight Calibration Results of the TROPOMI Payload on Board the Sentinel-5 Precursor Satellite. Atmos. Meas. Tech. 13 (7), 3561–3580. doi:10.5194/amt-13-3561-2020
Lyapustin, A., Wang, Y., Korkin, S., and Huang, D. (2018). MODIS Collection 6 MAIAC Algorithm. Atmos. Meas. Tech. 11 (10), 5741–5765. doi:10.5194/amt-11-5741-2018
Lyapustin, A., Wang, Y., Korkin, S., Kahn, R., and Winker, D. (2020). MAIAC Thermal Technique for Smoke Injection Height from MODIS. IEEE Geosci. Remote Sensing Lett. 17 (5), 730–734. doi:10.1109/lgrs.2019.2936332
Marshak, A., Herman, J., Adam, S., Karin, B., Carn, S., Cede, A., et al. (2018). Earth Observations from DSCOVR EPIC Instrument. Bull. Am. Meteorol. Soc. 99 (9), 1829–1850. doi:10.1175/bams-d-17-0223.1
Morris, G., and Dennis, C. (2021). Fire Siege. Retrieved from https://www.fire.ca.gov/media/hsviuuv3/cal-fire-2020-fire-siege.pdf.
Nanda, S., de Graaf, M., Veefkind, J. P., Sneep, M., ter Linden, M., Sun, J., et al. (2020). A First Comparison of TROPOMI Aerosol Layer Height (ALH) to CALIOP Data. Atmos. Meas. Tech. 13 (6), 3043–3059. doi:10.5194/amt-13-3043-2020
Nanda, S., de Graaf, M., Veefkind, J. P., ter Linden, M., Sneep, M., de Haan, J., et al. (2019). A Neural Network Radiative Transfer Model Approach Applied to the Tropospheric Monitoring Instrument Aerosol Height Algorithm. Atmos. Meas. Tech. 12 (12), 6619–6634. doi:10.5194/amt-12-6619-2019
Nelson, D., Garay, M., Kahn, R., and Dunst, B. (2013). Stereoscopic Height and Wind Retrievals for Aerosol Plumes with the MISR INteractive eXplorer (MINX). Remote Sensing 5 (9), 4593–4628. Retrieved from. doi:10.3390/rs5094593 https://www.mdpi.com/2072-4292/5/9/4593.
Rajapakshe, C., Zhang, Z., Yorks, J. E., Yu, H., Tan, Q., Meyer, K., et al. (2017). Seasonally Transported Aerosol Layers over Southeast Atlantic Are Closer to Underlying Clouds Than Previously Reported. Geophys. Res. Lett. 44 (11), 5818–5825. doi:10.1002/2017gl073559
Reid, J. S., Eck, T. F., Christopher, S. A., Hobbs, P. V., and Holben, B. (1999). Use of the Ångstrom Exponent to Estimate the Variability of Optical and Physical Properties of Aging Smoke Particles in Brazil. J. Geophys. Res. 104 (D22), 27473–27489. doi:10.1029/1999jd900833
Sayer, A. M., Hsu, N. C., Bettenhausen, C., Holz, R. E., Lee, J., Quinn, G., et al. (2017). Cross-calibration of S-NPP VIIRS Moderate-Resolution Reflective Solar Bands against MODIS Aqua over Dark Water Scenes. Atmos. Meas. Tech. 10 (4), 1425–1444. doi:10.5194/amt-10-1425-2017
Sayer, A. M., Hsu, N. C., Bettenhausen, C., Jeong, M. J., and Meister, G. (2015). Effect of MODIS Terra Radiometric Calibration Improvements on Collection 6 Deep Blue Aerosol Products: Validation and Terra/Aqua Consistency. J. Geophys. Res. Atmos. 120 (23). doi:10.1002/2015jd023878
Schaaf, C. B., Gao, F., Strahler, A. H., Lucht, W., Li, X., Tsang, T., et al. (2002). First Operational BRDF, Albedo Nadir Reflectance Products from MODIS. Remote Sensing Environ. 83 (1), 135–148. doi:10.1016/S0034-4257(02)00091-3
Schweizer, D., Cisneros, R., and Shaw, G. (2016). A Comparative Analysis of Temporary and Permanent Beta Attenuation Monitors: The Importance of Understanding Data and Equipment Limitations when Creating PM 2.5 Air Quality Health Advisories. Atmos. Pollut. Res. 7 (5), 865–875. doi:10.1016/j.apr.2016.02.003
Seo, S., Kim, J., Lee, H., Jeong, U., Kim, W., Holben, B. N., et al. (2015). Estimation of PM10 Concentrations over Seoul Using Multiple Empirical Models with AERONET and MODIS Data Collected during the DRAGON-Asia Campaign. Atmos. Chem. Phys. 15 (1), 319–334. doi:10.5194/acp-15-319-2015
Shi, Y. R., Levy, R. C., Eck, T. F., Fisher, B., Mattoo, S., Remer, L. A., et al. (2019). Characterizing the 2015 Indonesia Fire Event Using Modified MODIS Aerosol Retrievals. Atmos. Chem. Phys. 19 (1), 259–274. doi:10.5194/acp-19-259-2019
Sicard, M., Granados-Muñoz, M. J., Alados-Arboledas, L., Barragán, R., Bedoya-Velásquez, A. E., Benavent-Oltra, J. A., et al. (2019). Ground/space, Passive/active Remote Sensing Observations Coupled with Particle Dispersion Modelling to Understand the Inter-continental Transport of Wildfire Smoke Plumes. Remote Sensing Environ. 232, 111294. doi:10.1016/j.rse.2019.111294
Sofowote, U., Su, Y., Bitzos, M. M., and Munoz, A. (2014). Improving the Correlations of Ambient Tapered Element Oscillating Microbalance PM2.5 Data and SHARP 5030 Federal Equivalent Method in Ontario: A Multiple Linear Regression Analysis. J. Air Waste Manag. Assoc. 64 (1), 104–114. doi:10.1080/10962247.2013.833145
Spurr, R. (2008). LIDORT and VLIDORT: Linearized Pseudo-spherical Scalar and Vector Discrete Ordinate Radiative Transfer Models for Use in Remote Sensing Retrieval Problems.
Spurr, R., Wang, J., Zeng, J., and Mishchenko, M. I. (2012). Linearized T-Matrix and Mie Scattering Computations. J. Quantitative Spectrosc. Radiative Transfer 113 (6), 425–439. doi:10.1016/j.jqsrt.2011.11.014
Tian, P., Cao, X., Zhang, L., Sun, N., Sun, L., Logan, T., et al. (2017). Aerosol Vertical Distribution and Optical Properties over China from Long-Term Satellite and Ground-Based Remote Sensing. Atmos. Chem. Phys. 17 (4), 2509–2523. doi:10.5194/acp-17-2509-2017
Tilstra, L. G., Tuinder, O. N. E., Wang, P., and Stammes, P. (2017). Surface Reflectivity Climatologies from UV to NIR Determined from Earth Observations by GOME-2 and SCIAMACHY. J. Geophys. Res. Atmos. 122 (7), 4084–4111. doi:10.1002/2016JD025940
Torres, O., Ahn, C., and Chen, Z. (2013). Improvements to the OMI Near-UV Aerosol Algorithm Using A-Train CALIOP and AIRS Observations. Atmos. Meas. Tech. 6 (11), 3257–3270. doi:10.5194/amt-6-3257-2013
Torres, O., Bhartia, P. K., Herman, J. R., Ahmad, Z., and Gleason, J. (1998). Derivation of Aerosol Properties from Satellite Measurements of Backscattered Ultraviolet Radiation: Theoretical Basis. J. Geophys. Res. 103 (D14), 17099–17110. doi:10.1029/98jd00900
Torres, O., Bhartia, P. K., Jethva, H., and Ahn, C. (2018). Impact of the Ozone Monitoring Instrument Row Anomaly on the Long-Term Record of Aerosol Products. Atmos. Meas. Tech. 11 (5), 2701–2715. doi:10.5194/amt-11-2701-2018
Torres, O., Tanskanen, A., Veihelmann, B., Ahn, C., Braak, R., Bhartia, P. K., et al. (2007). Aerosols and Surface UV Products from Ozone Monitoring Instrument Observations: An Overview. J. Geophys. Res. 112 (D24). doi:10.1029/2007JD008809
Val Martin, M., Heald, C. L., Ford, B., Prenni, A. J., and Wiedinmyer, C. (2013). A Decadal Satellite Analysis of the Origins and Impacts of Smoke in Colorado. Atmos. Chem. Phys. 13 (15), 7429–7439. doi:10.5194/acp-13-7429-2013
Veefkind, J. P., Aben, I., McMullan, K., Förster, H., de Vries, J., Otter, G., et al. (2012). TROPOMI on the ESA Sentinel-5 Precursor: A GMES mission for Global Observations of the Atmospheric Composition for Climate, Air Quality and Ozone Layer Applications. Remote Sensing Environ. 120, 70–83. doi:10.1016/j.rse.2011.09.027
Wang, J., and Christopher, S. A. (2003). Intercomparison between Satellite-Derived Aerosol Optical Thickness and PM2.5mass: Implications for Air Quality Studies. Geophys. Res. Lett. 30 (21). doi:10.1029/2003gl018174
Wang, J., and Christopher, S. A. (2006a). Mesoscale Modeling of Central American Smoke Transport to the United States: 2. Smoke Radiative Impact on Regional Surface Energy Budget and Boundary Layer Evolution. J. Geophys. Res. 111 (D14). doi:10.1029/2005jd006720
Wang, J., Christopher, S. A., Nair, U. S., Reid, J. S., Prins, E. M., Szykman, J., et al. (2006b). Mesoscale Modeling of Central American Smoke Transport to the United States: 1. "Top-Down" Assessment of Emission Strength and Diurnal Variation Impacts. J. Geophys. Res. 111 (D5). doi:10.1029/2005jd006416
Wang, J., Xu, X., Ding, S., Zeng, J., Spurr, R., Liu, X., et al. (2014). A Numerical Testbed for Remote Sensing of Aerosols, and its Demonstration for Evaluating Retrieval Synergy from a Geostationary Satellite Constellation of GEO-CAPE and GOES-R. J. Quantitative Spectrosc. Radiative Transfer 146, 510–528. doi:10.1016/j.jqsrt.2014.03.020
Wilcox, E. M. (2012). Direct and Semi-direct Radiative Forcing of Smoke Aerosols over Clouds. Atmos. Chem. Phys. 12 (1), 139–149. doi:10.5194/acp-12-139-2012
Winker, D. M., Tackett, J. L., Getzewich, B. J., Liu, Z., Vaughan, M. A., and Rogers, R. R. (2013). The Global 3-D Distribution of Tropospheric Aerosols as Characterized by CALIOP. Atmos. Chem. Phys. 13 (6), 3345–3361. doi:10.5194/acp-13-3345-2013
Winker, D. M., Vaughan, M. A., Omar, A., Hu, Y., Powell, K. A., Liu, Z., et al. (2009). Overview of the CALIPSO Mission and CALIOP Data Processing Algorithms. J. Atmos. Oceanic Tech. 26 (11), 2310–2323. doi:10.1175/2009jtecha1281.1
Xiong, X., Angal, A., Chang, T., Chiang, K., Lei, N., Li, Y., et al. (2020). MODIS and VIIRS Calibration and Characterization in Support of Producing Long-Term High-Quality Data Products. Remote Sensing 12 (19), 3167. Retrieved from. doi:10.3390/rs12193167 https://www.mdpi.com/2072-4292/12/19/3167.
Xiong, X. X., Angal, A., Barnes, W., Chen, H. D., Chiang, V., Geng, X., et al. (2017). “Updates of MODIS On-Orbit Calibration Uncertainty Assessments,” in Earth Observing Systems Xxii. Editors J. J. Butler, X. Xiong, and X. Gu. Vol. 10402.
Xu, X., Wang, J., Wang, Y., and Kokhanovsky, A. (2018). Passive Remote Sensing of Aerosol Height. Remote Sensing of Aerosols, Clouds, and Precipitation. Elsevier, 1–22. doi:10.1016/b978-0-12-810437-8.00001-3
Xu, X., Wang, J., Wang, Y., Zeng, J., Torres, O., Reid, J. S., et al. (2019). Detecting Layer Height of Smoke Aerosols over Vegetated Land and Water Surfaces via Oxygen Absorption Bands: Hourly Results from EPIC/DSCOVR in Deep Space. Atmos. Meas. Tech. 12 (6), 3269–3288. doi:10.5194/amt-12-3269-2019
Xu, X., Wang, J., Wang, Y., Zeng, J., Torres, O., Yang, Y., et al. (2017). Passive Remote Sensing of Altitude and Optical Depth of Dust Plumes Using the Oxygen A and B Bands: First Results from EPIC/DSCOVR at Lagrange-1 point. Geophys. Res. Lett. 44 (14), 7544–7554. doi:10.1002/2017gl073939
Keywords: DSCOVR EPIC, thick smoke layer, AOCH, California fires, surface PM2.5, hourly variation, aerosol retrieval algorithms
Citation: Lu Z, Wang J, Xu X, Chen X, Kondragunta S, Torres O, Wilcox E and Zeng J (2021) Hourly Mapping of the Layer Height of Thick Smoke Plumes Over the Western U.S. in 2020 Severe Fire Season. Front. Remote Sens. 2:766628. doi: 10.3389/frsen.2021.766628
Received: 29 August 2021; Accepted: 30 September 2021;
Published: 25 October 2021.
Edited by:
Gregory Schuster, Langley Research Center, National Aeronautics and Space Administration (NASA), United StatesReviewed by:
Jason Tackett, Langley Research Center, National Aeronautics and Space Administration (NASA), United StatesCopyright © 2021 Lu, Wang, Xu, Chen, Kondragunta, Torres, Wilcox and Zeng. This is an open-access article distributed under the terms of the Creative Commons Attribution License (CC BY). The use, distribution or reproduction in other forums is permitted, provided the original author(s) and the copyright owner(s) are credited and that the original publication in this journal is cited, in accordance with accepted academic practice. No use, distribution or reproduction is permitted which does not comply with these terms.
*Correspondence: Jun Wang, anVuLXdhbmctMUB1aW93YS5lZHU=
Disclaimer: All claims expressed in this article are solely those of the authors and do not necessarily represent those of their affiliated organizations, or those of the publisher, the editors and the reviewers. Any product that may be evaluated in this article or claim that may be made by its manufacturer is not guaranteed or endorsed by the publisher.
Research integrity at Frontiers
Learn more about the work of our research integrity team to safeguard the quality of each article we publish.