 Conor Haney
 David R. Doelling
 Wenying Su
 Rajendra Bhatt2
- 1Science Systems and Applications, Inc., Hampton, VA, United States
- 2NASA Langley Research Center, Hampton, VA, United States
The DSCOVR mission was designed to take advantage of the first Lagrangian position (L1) to continuously observe the Earth sunlit disk. To facilitate EPIC V03 data product validation and fusion, the EPIC V03 navigation and calibration stability is assessed. The Aqua-MODIS, NPP-VIIRS, and N20-VIIRS based radiometric scaling factors are also provided. The V03 navigation error was 15.5 km, a 50% improvement over V02 and within what can be achieved by an objective image alignment algorithm. Both the navigation accuracy and precision were improved in V03 and were found to be comparable across all EPIC visible channels. The all-sky tropical ocean and deep convective cloud ray-matched MODIS- and VIIRS-referenced EPIC inter-calibration gains are within 0.4% of one-another, and are also within 0.4% of a previous study’s NPP-VIIRS-referenced gains. The inter-calibration study reveals that EPIC bands 5 and 6 degraded mostly within the first year of operation and becoming stable thereafter, whereas bands 7 and 10 were stable during the 6-years record. The capability of the V03 navigation allowed EPIC stability to be monitored using DCC and Libya-4 invariant targets. The EPIC V03 calibration was mostly stable within 0.3% over the 6-years record, as determined from inter-calibration and invariant target monitoring methods. Remarkably, both the DCC- and Libya-4-based methods were able to confirm the stability of the E-8 and E-9 oxygen absorptions—a stability comparable to that of the E-7 and E-10 reference bands. No significant change in the navigation accuracy or calibration stability was observed after the DSCOVR 2019 safe mode incident. The impressive stability of the DSCOVR EPIC L1B V03 channel radiances can greatly benefit the Earth remote sensing community by providing diurnally complete daytime radiative flux and environmental retrievals for future sensors located at L1.
Introduction
The Deep Space Climate Observatory (DSCOVR), launched on February 11, 2015, orbits the first Lagrange point (L1)—about 1.5 million km from the Earth in roughly the direction of the Sun. This orbit location allows the DSCOVR satellite instruments to have unique views of both the Sun and the Earth. The Earth Polychromatic Imaging Camera (EPIC) is an Earth-facing instrument on DSCOVR that has a constant view of the sunlit side of the Earth, almost entirely in the backscattering direction (Marshak et al., 2018). The EPIC sensor images the Earth between 10 and 22 times during a 24-h interval using a CCD array. A filter wheel allows the EPIC sensor to observe the Earth at 10 different narrow spectral channels ranging from the UV to the NIR. These channels lead to formulation of various Level-2 products that enable investigation of aerosols, ozone, clouds, vegetation, volcanic SO2, and glint (Marshak et al., 2018). The diurnal sampling capability of EPIC allows for more robust daily averaged retrievals compared to the capabilities of single daytime sun-synchronous, low Earth orbit (LEO) instruments such as the MODerate Resolution Imaging Spectroradiometer (MODIS) and Visible Infrared Imaging Radiometer Suite (VIIRS). This advantage is especially important for maritime stratus regions where morning clouds often dissipate by the afternoon, or for afternoon convective monitoring over land where morning clear skies transition to thunderstorms in the late afternoon. Furthermore, the EPIC diurnally derived broadband shortwave fluxes are consistent with the geostationary imager based broadband SW fluxes derived for the CERES SYN1deg product (Su et al., 2018).
The EPIC retrievals are validated against coincident MODIS and VIIRS (M/V) retrievals. To compare the EPIC with M/V retrievals, the EPIC channel radiances must be radiometrically scaled against the M/V L1B calibration reference. The M/V L1B calibrated radiances are referenced to their onboard solar diffusers and are not radiometrically scaled with one another. For some visible bands, the NPP-VIIRS and N20-VIIRS calibrated radiances can differ by 3% (Uprety and Cao, 2020; Moyer et al., 2021; Mu et al., 2021; Wu et al., 2020). The future CLARREO Pathfinder instrument will provide an absolute calibration reference in space with which the EPIC sensor calibration can be anchored to (Wielicki et al., 2013; Shea et al., 2020). Until an absolute calibration reference in space is realized, EPIC visible channel calibration coefficients for Aqua-MODIS, NPP-VIIRS, and N20-VIIRS are needed for data fusion and are provided for in this study.
In this study, we aim to complete the EPIC V03 navigation assessment initiated by Doelling et al., 2019, which aligned the EPIC coincident images with the well-navigated M/V images. The assessment utilized 2 days of EPIC R06 data, the precursor to EPIC V03, and found that the navigation was an improvement over V02. This refinement in navigation resulted from the improved geolocation and CCD array flatfielding accuracy in V03 (Kostinski et al., 2021). This furthered study also provides a calibration stability assessment of the EPIC sensor, which does not contain any onboard calibration systems. Two independent inter-calibration approaches are utilized that rely on coincident ray-matched radiance pairs. The first method remaps the coincident EPIC and M/V pixel-level radiances over all-sky tropical ocean (ATO-RM) and inter-calibrates the angular matched radiance pairs. The second method utilizes only ray-matched deep convective cloud (DCC-RM) targets to inter-calibrate M/V with EPIC. Agreement between the two independent inter-calibration methodologies and the recently published Geogdzhayev et al. (2021) EPIC calibration coefficients should not only ensure robust EPIC calibration coefficients, but also lend confidence to the capability of the calibration methods. Particular attention is given to determine if there were any EPIC calibration discontinuities experienced during the DSCOVR spacecraft safe mode incident between June 2019 and February 2020.
With the anticipated EPIC V03 navigation improvement, we attempt to apply a Pseudo Invariant Calibration Site (PICS) or Earth invariant target approach to monitor the stability of EPIC visible bands. PICS are widely used amongst satellite calibration teams for monitoring the onboard calibration systems, because the method simply relies on a stable Earth target rather than on concurrent sensors, thereby avoiding sensor-embedded calibration drifts. The DCC and Libya-4 invariant target (IT) methodologies were chosen to assess the stability of the EPIC visible channels. Sun-synchronous sensor based invariant target methodologies were modified for consideration of the random local time sampling of the EPIC images over the invariant target. The DCC-IT and Libya-4 stability results are verified with the ATO-RM and DCC-RM stability assessment.
Methodology section describes the EPIC, MODIS, and VIIRS datasets, the navigation accuracy assessment strategy, the ATO-RM and DCC-RM methodologies, and the DCC-IT and Libya-4 invariant target approaches. The EPIC calibration coefficient formulas that describe the EPIC sensor degradation are also discussed in Methodology section. Results section provides the EPIC V03 navigation assessment. The Aqua-MODIS, NPP-VIIRS, and N20-VIIRS referenced EPIC calibration coefficients and comparison with the Geogdzhayev et al. (2021) coefficients are likewise found in Results section. The Libya-4 and DCC invariant target results and overall EPIC stability assessment finishes Results section. Conclusions section contains the summary.
Methodology
Data
The EPIC L1B data were obtained from the NASA Langley Atmospheric Science Data Center Distributed Active Archive Center (ASDC DAAC). Both EPIC V03 (July 2015–February 2020) and V02 (July 2015–July 2019) are used in this study. EPIC V02 data is only available up until the safe mode incident, whereas the V03 data was processed from the beginning of the record and continues after the safe mode event. The EPIC imager employs a filter wheel to observe the Earth in 10 reflective solar band channels using the same CCD array. The first four bands are UV channels and are not evaluated in this study. The remaining visible bands are utilized and are listed in Table 1. The EPIC imager requires ∼7 min to step through all 10 channels. The CCD array nominal pixel resolution is ∼8-km. To facilitate data transmission, the pixel resolution is degraded by a factor of 2, except for band 5. The EPIC image is geo-rectified onto a common latitude and longitude 2048 by 2048 (8-km nominal resolution) grid for all 10 bands. The view and solar angles are based on the measurement time. For convenience, the EPIC observed photon (12-bit) counts sec−1 are simply referred to as counts in this manuscript.
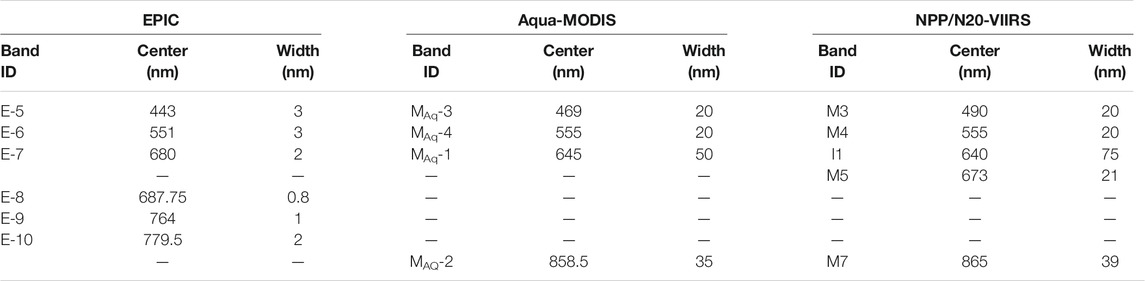
TABLE 1. EPIC, MODIS, and VIIRS band nomenclature used for this study (ID), and wavelength center and width (FWHM) in nm obtained from https://avdc.gsfc.nasa.gov/pub/DSCOVR/EPIC_NISTAR_Documents/DSCOVR-EPIC-Description.pdf, https://modis.gsfc.nasa.gov/sci_team/meetings/199310/presentations/x153_refl_bands.pdf, and https://ladsweb.modaps.eosdis.nasa.gov/missions-and-measurements/viirs/. The bands are listed by increasing wavelength.
The L1B MODIS data used in this study are from Aqua-MODIS Collection 6.1 (C6.1), which have a nominal resolution of 1 km. For VIIRS L1B, the Suomi-NPP and N20 NASA Land Science Investigator-led Processing System (LandSIPS) data are used. The NPP-VIIRS data are from Collection 1, and the N20-VIIRS data are from Collection 2. The M bands are observed at a 750-m nominal resolution, whereas the I band resolution is 375 m. The I band pixel reflectances are first aggregated into the M band resolution. The M/V pixels are subsampled at 2 and 1.5 km, respectively, for this study. The M/V bands utilized in this study are listed in Table 1 along with their respective EPIC band pairings. Note that the EPIC band 10 (0.780 µm) is paired with both the M/V 0.65-µm and 0.86-µm channels because most M/V based retrievals rely on the 0.86-µm band rather than their equivalent VIIRS M6 (0.746 µm) or MODIS B15 (0.748 µm) counterparts. MODIS band 2 (0.865 µm) is not utilized in this study, because both the ATO-RM and DCC-RM methods are adversely impacted by the MODIS band 2 saturated measurements over very bright targets.
Table 1 defines the sensor band nomenclature used in this study. EPIC bands are defined by a prefix of E, for example, E-5 for EPIC band 5. The Aqua MODIS bands are designated by a prefix of MAq followed by the MODIS band number, for example, MAq-1 is Aqua MODIS band 1. The NPP-VIIRS and N20-VIIRS bands are denoted by VNPP and VN20, respectively, and followed by their respective I or M band numbers, such as VNPP-I1 or VN20-I1. Table 1 shows the band center wavelengths and their respective band widths. Note the very narrow EPIC bands compared with their respective M/V bands. The VIIRS M5 band is also narrower than the corresponding I1 band.
EPIC Navigation
Unlike near-Earth sensors, aligning the EPIC CCD array onto the Earth and computing the pixel coordinates from the sensor pointing vector is very challenging given the DSCOVR distance from Earth. Even after focused study to rectify, residual navigation errors still remain in V03 and need to be evaluated. An automated EPIC image geolocation correction algorithm was developed to mitigate spatial discrepancies when inter-calibrating coincident EPIC and M/V images (Haney et al., 2016 and Doelling et al., 2019). The image geolocation correction algorithm also evaluates the EPIC navigation accuracy. The navigation accuracy is limited by the 0.25° latitude by longitude spatial resolution used to shift the underlying EPIC image. Because the EPIC and M/V inter-calibration events occur mostly at the center, i.e., near the sub-satellite point, of the EPIC image, the navigation accuracy results are only valid near the EPIC sub-satellite domain.
A detailed description of the geolocation correction algorithm is found in Haney et al. (2016) and is briefly summarized here. For a given EPIC image, coincident (within 15-min) M/V granules within ±30° in latitude from the equator are identified. The 5-min MODIS or 6-min VIIRS granule pixel-level reflectances are gridded into a 0.25° latitude by longitude grid. The associated EPIC image pixel counts are similarly gridded. For each M/V granule, the EPIC grid is shifted by ±5 grid cells in both the East-West and North-South direction. For each of the 121 EPIC grid shifts, the M/V reflectance and EPIC grid cell count pairs are linearly regressed and the square of the Pearson correlation coefficient (R2) is noted. The grid shift with the largest R2 value is considered the optimal navigation correction. The process is repeated with the remaining coincident M/V granules in the EPIC domain. The navigation correction algorithm is best suited for images with contrasting features such as coastlines and cloud boundaries.
ATO-RM
The all-sky tropical ocean ray-matching inter-calibration methodology follows closely that described in Doelling et al. (2019). The advantage of ATO-RM methodology is that it compares the full Earth-viewed visible radiance dynamic range between sensors. The 15-min coincident aligned EPIC counts with M/V gridded reflectances (from EPIC Navigation) are first aggregated into a 0.5° grid (note that gridding in this manner may reduce the visible dynamic range). A relative to the mean grid cell standard deviation threshold of 70% is applied based on the imager pixel reflectances to mitigate the impact of 1) heterogeneous scenes, 2) cloud spatial shifts due to the time matching differences, and 3) any residual EPIC navigation errors. Grid cells located over ocean glint and land are avoided. The EPIC and M/V view zenith angle (VZA), relative azimuthal angles (RAZ), and scattering angles are matched within 15°. A graduated angle matching (GAM) approach is applied, which further restricts the angle matching over dark scenes that exhibit anisotropic behavior, while maintaining the initial angle matching for the more Lambertian bright scenes (Doelling et al., 2016). The first quartile of the visible dynamic range requires the VZA and RAZ to be matched within 5°, while the second quartile requires them to be within 10°. The 15° angle matching is retained for the 3rd and 4th quartiles. The M/V reflectances are adjusted to the EPIC SZA by the ratio of the EPIC and M/V cosine SZA (µ0) as shown in Eq. 1 for MODIS.
An ATO, reflectance-based 2nd order spectral band adjustment factor (SBAF) based on the Scanning Imaging Absorption Spectrometer for Atmospheric Chartography (SCIAMACHY) hyper-spectral radiances is applied to the M/V channel reflectances to mitigate the impact of the spectral band differences (Bovesmann et al., 1999; Scarino et al., 2016). The ATO-RM EPIC channel counts and LEO imager reflectance pairs are then linearly regressed monthly. Any EPIC count and imager reflectance pairs that are outside of 4 × the linear regression standard error are removed as a way of avoiding any residual mis-navigated pairs. Figure 1A shows the ATO-RM E-7 and VNPP-I1 reflectance pair scatter plot for May 2020. The linear regression through the space offset or EPIC count of zero (referred to as the force fit) is used to compute the monthly gain. The corresponding linear regression offset is -352, which is very close to the assumed space count of zero in relation to the large dynamic range of EPIC counts (Figure 1A). The tightly aligned dark reflectance pairs and the increased scatter about the bright pairs in Figure 1A are a result of the GAM methodology.
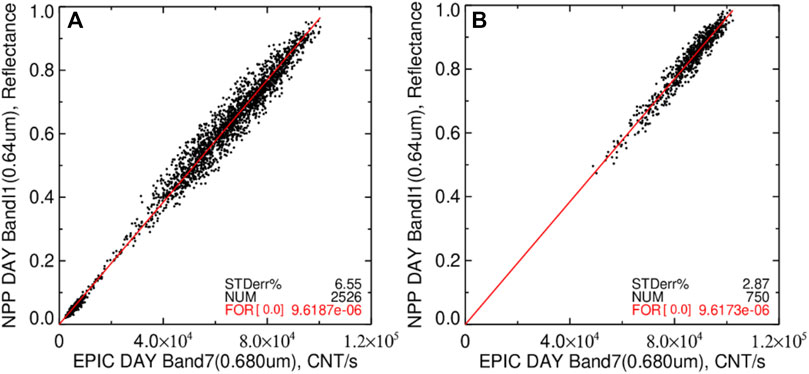
FIGURE 1. The (A) ATO-RM and (B) DCC-RM E-7 count and VNPP-I1 reflectance pair scatter plots for May 2020 with associated linear regression (solid red line). The number of pairs (NUM), standard error (STDerr%), and linear regression slope through an offset of 0 (FOR) in count−1 or gain (Eq. 1) is given in the lower right.
Imager Calibration Drift Mitigation
Because ATO ray-matching utilizes contemporaneous observations between the EPIC and LEO imagers, it is essential that all LEO imager drifts are removed prior to performing the stability assessment of the EPIC channels. We performed independent assessments of the MODIS and VIIRS L1B calibration stability using the DCC and Saharan Desert invariant targets (Doelling et al., 2013; Bhatt et al., 2014). During 2015–2021, both MODIS instruments’ visible bands calibration in C6.1 L1B radiances were found stable, except for some embedded residual scan-angle dependencies remaining near the end of the MODIS cross-track scans (Bhatt et al., 2019). Similarly, noticeable temporal calibration drifts were observed in some of the reflective solar bands L1B radiances for the two VIIRS instruments. The NPP-VIIRS C1 data shows a positive trend of ∼0.6% in the I1 band from 2012 through 2018. During April 2018, a LUT update was implemented to make the record post-April 2018 more stable and consistent with that of 2012. As such, there is a ∼0.6% discontinuity between the pre- and post-April 2018 NPP-VIIRS data in C1. The newly released C2 of NPP-VIIRS data from NASA LandSIPS has a consistent calibration LUT implemented across the full record and is believed to have these drifts corrected in the L1B radiances. Figure 2A shows the VNPP-I1-based E-7 monthly gains plotted over the EPIC record. As expected, the gain (open circles) appears to decrease over time due to the VIIRS LUT update during April 2018. The I1 band radiances from N20-VIIRS C2 data were also found to have a minor downward temporal trend of ∼0.6% over the 3-year period. As such, the VN20-I1-based E-7 monthly gains also show a downward trend (Figure 2B). The presence of these drifts in the VIIRS L1B products was confirmed with the VIIRS Characterization and Support Team at Goddard Space Flight Center. The time-dependent magnitudes of these temporal drifts were characterized based the DCC invariant target analysis. Correction factors were derived from the DCC-based drift analysis and were applied to stabilize the ATO-RM VIIRS radiances prior to computing the EPIC monthly gains from the ATO-RM data. The filled circles in Figure 2 shows both the VNPP-I1 and VN20-I1 based E-7 monthly gains after applying the drift correction—revealing a near stable record.
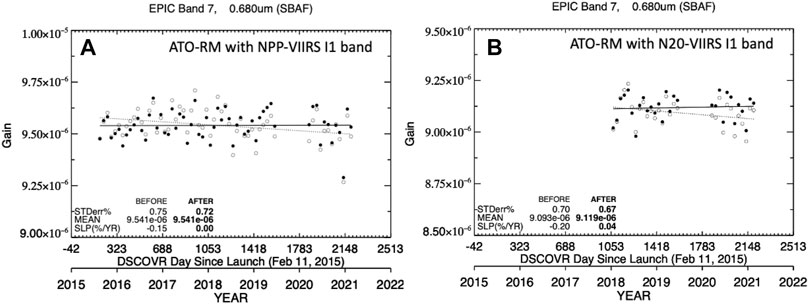
FIGURE 2. (A) The ATO-RM E-7/VNPP-I1 monthly gains and associated linear trend line before (open circles and dotted line) and after (filled circles and solid line) VNPP-I1 drift-corrected reflectances. The EPIC gain is in count−1. The before and after standard error (STDerr%), mean, and linear trend [SLP (%/yr)] are located in the lower left corner. (B) Same as (A) but for N20-VIIRS based monthly gains for E-7.
DCC-RM
The deep convective cloud ray-matching (DCC-RM) methodology relies on very bright TOA tropical targets that are nearly spectrally flat (for wavelengths <1 µm) and nearly isotropic for SZA and VZA conditions less than 40°. The DCC-RM inter-calibration has increased signal to noise, reduced SBAF uncertainty, and allows for greater angle matching tolerance compared with those of the ATO-RM approach. The EPIC DCC-RM is outlined in Doelling et al. (2019) and is summarized here. The EPIC Navigation section coincident angle matched EPIC and M/V-aligned 0.25° gridded radiances are identified as DCC targets if their corresponding MAq-31 or VNPP/N20-M15 11 µm BT measurements are less than 220 K. A visible and IR spatial homogeneity threshold of 5% and 2.5 K based on the relative standard deviation of the M/V pixel values within the 0.25° grid cell is applied. Unlike the ATO-RM, the DCC-RM includes ocean and land grid cells. The approximate DCC linear regression SBAF (Scarino et al., 2016) is applied to the M/V drift-corrected (Imager Calibration Drift Mitigation) and EPIC SZA-adjusted channel reflectances (Eq. 1). The EPIC count and LEO channel reflectance pairs are linearly regressed monthly through the space count of zero and a 4 × standard error outlier filter is applied. Figure 1B shows the DCC-RM E-7 count and VNPP-I1 reflectance pair scatter plot for May 2020, which can be compared with the corresponding ATO-RM plot in Figure 1A. Both methods provide a nearly identical force fit result (within 0.1%). As expected, there are fewer DCC-RM reflectance pairs compared with ATO-RM given that only 0.3% of the tropics contain DCC (Hong et al., 2005).
DCC Invariant Target Methodology
The DCC-IT methodology was formulated in the ground-breaking work of Hu et al. (2004). The EPIC DCC-IT calibration method is based on the Doelling et al. (2011) and Doelling et al. (2013) DCC-IT methodology, which relies on the fact that when the large ensemble of DCC-identified pixel TOA reflectances are analyzed collectively, they behave as an invariant target. The DCC-IT methodology has been well established in the calibration community and is used to monitor the onboard calibration of M/V (Doelling et al., 2013; Bhatt et al., 2014; Mu et al., 2017; Angal et al., 2018; Wang and Cao 2015; Wang and Cao 2020). The methodology has been further developed and utilized for this study for daily monitoring, which requires increased DCC sampling than needed by monthly monitoring methods (Doelling et al., 2021). The EPIC DCC-IT methodology relies on the DCC-RM spatially matched, but not necessarily angle matched, EPIC with M/V coincident images, including necessary 11 µm BT information (see DCC-RM section). Typically, for high pixel resolution (∼1 km) imagers, a BT threshold of 205 K is used to identify DCC pixels. Furthermore, a homogeneity filter of 1 K (IR) and 3% (visible) based on the 8 surrounding M/V pixels is effective in filterering out the less bright anvil pixels (Doelling et al., 2013). Due to the low pixel resolution, any 0.25° grid cell with a M/V BT less than 220 K is utilized. Applying homogeneity filters would severely limit the sample size required by the large ensemble methodology. As such, no homogeneity thresholds are applied. The SZA and VZA thresholds are expanded to 60°. Because the matched EPIC images are tied to the 13:30 local sampling time of Aqua, NPP, and N20 sun-synchronous satellites, the diurnal-dependent DCC lifecycle over land is not aliased into the DCC reflectance. The individual DCC-identified grid cell counts are corrected for both overhead Sun conditions by dividing by the cosine of the SZA and by the Earth-Sun distance as follows.
The monthly frequency probability density function (PDF) of E-7 DCCcounts are shown in Figure 3A. Each month contains between 20 k and 100 k DCCcount. The monthly PDF shapes are fairly consistent over the record. Typically for high pixel resolution sensors, the monthly PDF mode DCCcount is tracked over time. However, for EPIC, the PDF peak is not well defined and the monthly PDF mode DCCcount is very noisy. The application of the Hu et al. (2004) DCC bidirectional reflectance distribution function (BRDF) model did not enhance the PDF peak. A future empirical EPIC DCC BRDF model based on the first 3-years of EPIC DCCcount may reduce the PDF mode noise and enhance the peak. Since the PDF mean is more stable than the mode, the PDF mean DCCcount is used to monitor the sensor stability. Figure 3B shows the monthly DCCcount over the EPIC record. The DCCcount response shows a distinct seasonal cycle. The DCCcount is deseasonalized using the ratio-to-moving average method as described in Bhatt and Wu (2017). The deseasonalization process is a multi-step procedure where a monthly seasonal index (SI) is first computed from the average relative ratio between an individual month DCC response and a 12-months centered running mean. The monthly DCC responses are then divided by the month-specific SI value to yield a deseasonalized DCC timeseries. The ratio-to-moving average method requires at least two complete years of data to compute monthly SI, and leaves intact any drift in the time series. The deseasonalized DCCcount values are also shown in Figure 3B. The deseasonalized E-7 record linear trend standard error was reduced by 20% from 1.54 to 1.23%. Deseasonalization also reduced the linear trend from -0.04%/yr to -0.01%/yr because the monthly gain variation at the beginning and end of the record may have impacted the trend.
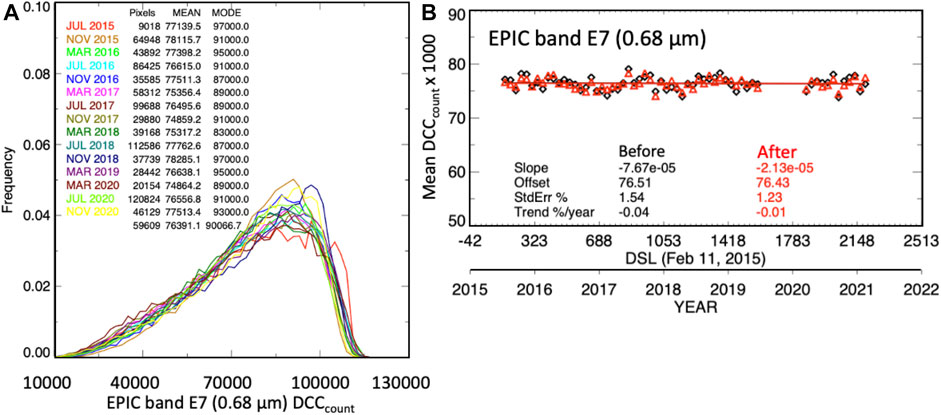
FIGURE 3. (A) The July, November, and March over the EPIC record monthly probability density functions (PDF) of the E-7 DCCcount (Eq. 2). The number of monthly DCC identified grid cells (Pixels), mean DCCcount (MEAN), and PDF mode DCCcount (MODE) statistics are located in the upper left corner. The monthly PDF lines are color coordinated with the month and year column of the statistics. (B) The DCC E-7 monthly mean DCCcount and associated linear trend line before (black open circles and line) and after (red open triangles and line) deseasonalization. The linear regression slope (DCCcount/day), offset, mean DCCcount, standard error (STDerr%), and linear trend are located at the bottom of the plot.
Libya-4 Invariant Target Methodology
The Libya-4 desert site, center location at 28.55°N and 23.4°E, is a CEOS recommended Cal/Val site and is one of the most used PICS for calibration and stability monitoring (Cosnefroy et al., 1996; Teillet and Chander, 2010; Chander et al., 2013). Staylor and Suttles (1990) computed AVHRR calibration degradation using the Libyan desert based on a BRDF model developed by the Nimbus-7 ERB measurements. In other desert-based PICS studies, Teillet et al. (1990) used White Sands, NM to inter-calibrate the AVHRR and Landsat-TM sensors using a historical BRDF. Kaufman and Holben (1993) used an Egyptian desert PICS and Kogan et al. (1996) used several Saharan desert PICS to determine the AVHRR degradation. Cosnefroy et al. (1996) characterized multiple Saharan and Arabian deserts as potential PICS by their clear-sky frequency, temporal stability, and surface brightness, while Moulin et al. (1996) utilized four Saharan invariant desert targets to monitor and calibrate the geostationary Meteosat-2 sensor visible channel. Often the Libya-4 desert site was used to produce official AVHRR calibration coefficients (Rao et al., 1994; Rao and Chen, 1996; Rao et al., 1999). Furthermore, the sun-synchronous M/V sensor onboard calibration have been validated using Libya-4 (Doelling et al., 2015, Bhatt et al., 2014b. Uprety and Cao, 2015, Wu et al., 2016, Xiong et al., 2010b). Lastly, the Libya-4 site is one of multiple PICS used to determine the MODIS response versus scan-angle (RVS) real-time corrections (Sun et al., 2014; Mu et al., 2018).
The Libya-4 region of interest (ROI) is 0.6° in latitude and longitude region centered at 28.55°N and 23.4°E. For a given EPIC image, the Libya-4 ROI center and 8 surrounding pixels counts are averaged and the relative standard deviation is computed. The EPIC sensor views the Libya-4 desert on daily basis. Unlike the set geostationary sensor imaging schedules, the EPIC images are not scanned at fixed GMT times. The EPIC PICS methodology cannot rely on an annually repeating daily angular observations to remove BRDF effects (Bhatt et al., 2014). Although the Libya-4 desert is sampled by EPIC several times a day, only the EPIC images observed between 10 and 12 GMT, which are closest to local noon (10:45 GMT) are utilized. Local noon images avoid the large SZA and VZA conditions observed near the terminator. Because occasional clouds can impact the Libya-4 TOA reflectance, only clear-sky conditions are utilized. A relative standard deviation homogeneity (sigma) threshold is used to delineate clear-sky and cloudy conditions. Figure 4A shows that most daily sigma values are less than 250 counts, which is the chosen threshold for identifying clear-sky conditions.
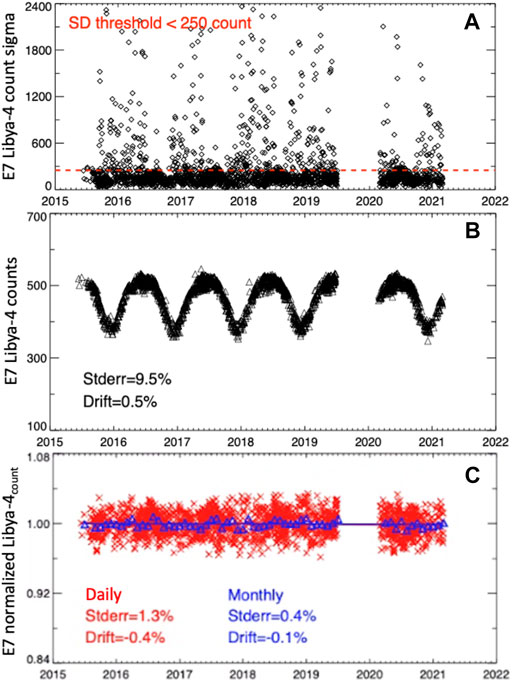
FIGURE 4. (A) The EPIC E-7 (0.68 µm) daily standard deviation of the count of the Libya-4 ROI (0.6° in latitude and longitude region centered at 30°N and 30°E). The red dashed line represents a count value of 250. Counts below the red dashed line indicate clear-sky conditions. (B) The E-7 Libya-4 clear-sky daily counts. The linear regression standard error and trend (%/year) statistics are located in the lower left corner (trend line not shown). (C) The E-7 Libya-4count daily (red x and red solid line) and monthly mean (blue open triangles and blue solid line) associated trend lines. The trend line standard error (Stderr) in % and drift in %/yr are given at the bottom of the plot.
Figure 4B shows a large seasonal cycle of the clear-sky daily E-7 Libya-4 counts over the EPIC record owed to the SZA seasonal variation. Because the DSCOVR orbit about L1 is not synchronized with the Earth’s declination angle, the Libya-4 daily RAZ does not repeat annually (Marshak et al., 2018), and therefore a BRDF model is required to mitigate angular reflectance effects. The EPIC Libya-4 counts are first converted to scaled reflectance by adjusting for the Earth-Sun distance corrections and normalizing by the cosine of the SZA, as described in Eq. 2 for DCC pixels. A semi-empirical BRDF model is then constructed using the first 3-years of the EPIC scaled reflectance data over Libya-4, based on a linear combination of two kernel functions (Roujean et al., 1992). Due to the large range of angular conditions observed over the year, multiple BRDF models across the observed angular domain are constructed as follows: 6° VZA and SZA bins between 0° and 60°, and a single RAZ bin is defined between 165° and 180°. The multiple BRDF models are an improvement over a single BRDF model covering the angular domain. The multiple BRDF models also account for seasonal variation of the atmosphere above the desert surface because the SZA is a function of time of year, where overhead Sun conditions are realized in summer and the oblique Sun in winter. Although the Sahara Desert has low humidity, the hot air temperature allows for greater atmospheric precipitable water (PW), which is exponentially dependent with temperature. Additionally, the multiple BRDF approach was successful in modeling anvil cloud top BRDF reflectance across the full range of SZA angles (Scarino et al., 2020).
The daily clear-sky Libya-4 observed scaled reflectances are divided by the predicted reflectances from the multiple BRDF models to derive normalized Libya-4 counts (Libya-4count), which are shown in Figure 4C. The seasonal cycle is successfully removed after applying the multiple BRDF models. The daily linear trend standard error of daily E-7 normalized Libya-4count is 1.3%. By averaging the daily Libya-4count into monthly values, the linear trend drift and standard error are measured as 0.1 and 0.4% over the 6-years EPIC record. The remarkable Libya-4count stability suggests that EPIC navigation accuracy is sufficient, the Libya-4 invariant target methodology is robust, and that Libya-4 reflectance is invariant over time.
EPIC Calibration Coefficients
Previous studies have used linear trends to describe the EPIC visible channel on-orbit degradation (Doelling et al., 2019; Geogdzhayev et al., 2021). The EPIC visible gain is tracked from the day since launch (dsl) of February 11, 2015 as follows:
where the offset and slope are the linear regression coefficients. Figure 5A shows the E-5 (0.46 µm) gain linear trends, where the solid lines represent ATO-RM and the dashed lines represent DCC-RM, and the black, green, and red monthly gains are calibrated against Aqua, NPP, and N20, respectively. Note the consistency of the ATO-RM and DCC-RM linear trends given the independent ATO-RM and DCC-RM monthly gain variability. The N20 ATO-RM and DCC-RM E-5 linear gain trends seem more stable when compared with their Aqua and NPP counterparts. Herman et al. (2018) (their Figure 2) indicated that most of the EPIC degradation occurred during the first year of operation for all UV channels. The shorter wavelength EPIC UV channels showed more degradation than the longer wavelength UV channels. To determine if the E-5 early record degradation was greater than the later record, the 2015–2017 and the 2018–2021 linear trends were computed and are shown in Figure 5B. The 2018 breakpoint (Figure 5B vertical blue line) coincides with the beginning of the N20 record. The 2015–2017 Aqua and NPP based ATO-RM linear trend E-5 gains were 0.48%/yr and 0.45%/yr, respectively, whereas the 2018–2021 linear trend gains were 0.04%/yr and 0.10%/yr, respectively, which represents a reduction of ∼75%, becoming more in line with the N20 linear trend gain of -0.02%/yr. In this study, the early record temporal trends are evaluated for statistical significance at 95% confidence level using the approach described by Weatherhead et al., 1998. According to Eq. 3 from Weatherhead et al. (1998), the minimum detectable trend for a given timeseries is governed by the length of the record, noise about the trend, and the autocorrelation of the monthly gains. Detection of smaller-magnitude trends requires a lower standard error and longer record length. For E-5, the Aqua and NPP ATO-RM linear trend standard error is less than the DCC-RM standard error (Figure 5A), indicating that the ATO-RM trends are able to confidently detect smaller-magnitude trends over the same record length. The Aqua and NPP ATO-RM linear trends are 0.14%/yr and 0.18%/yr, respectively, and have exceeded the corresponding minimum detectable trend values of 0.11%/yr and 0.10%/yr, respectively, based on the Weatherhead statistics. The observed trends exceed the minimum detectable trend thresholds, thereby, proving their statistical significance. Similarly, prior to 2018 (Figure 5B), the Aqua and NPP ATO-RM linear trends were found to be significant, whereas the post-2018 trends were found to be insignificant. This indicates that the E-5 degradation found in the overall trend was realized prior to 2018. For E-6, the Aqua and NPP 2015–2017 ATO-RM linear trends were 0.61 and 0.48% (not shown), however, the post-2018 Aqua, NPP, and N20 ATO-RM linear trends were 0.03%/yr, 0.17%/yr, and 0.09%/yr, respectively, proving E-6 also degraded mostly in the early record. To sum up, the overall and pre-2018 record for E-5 and E-6 had statistically significant linear trends, whereas the significance test failed for post-2018 record, suggesting that the degradation occurred during the early record.
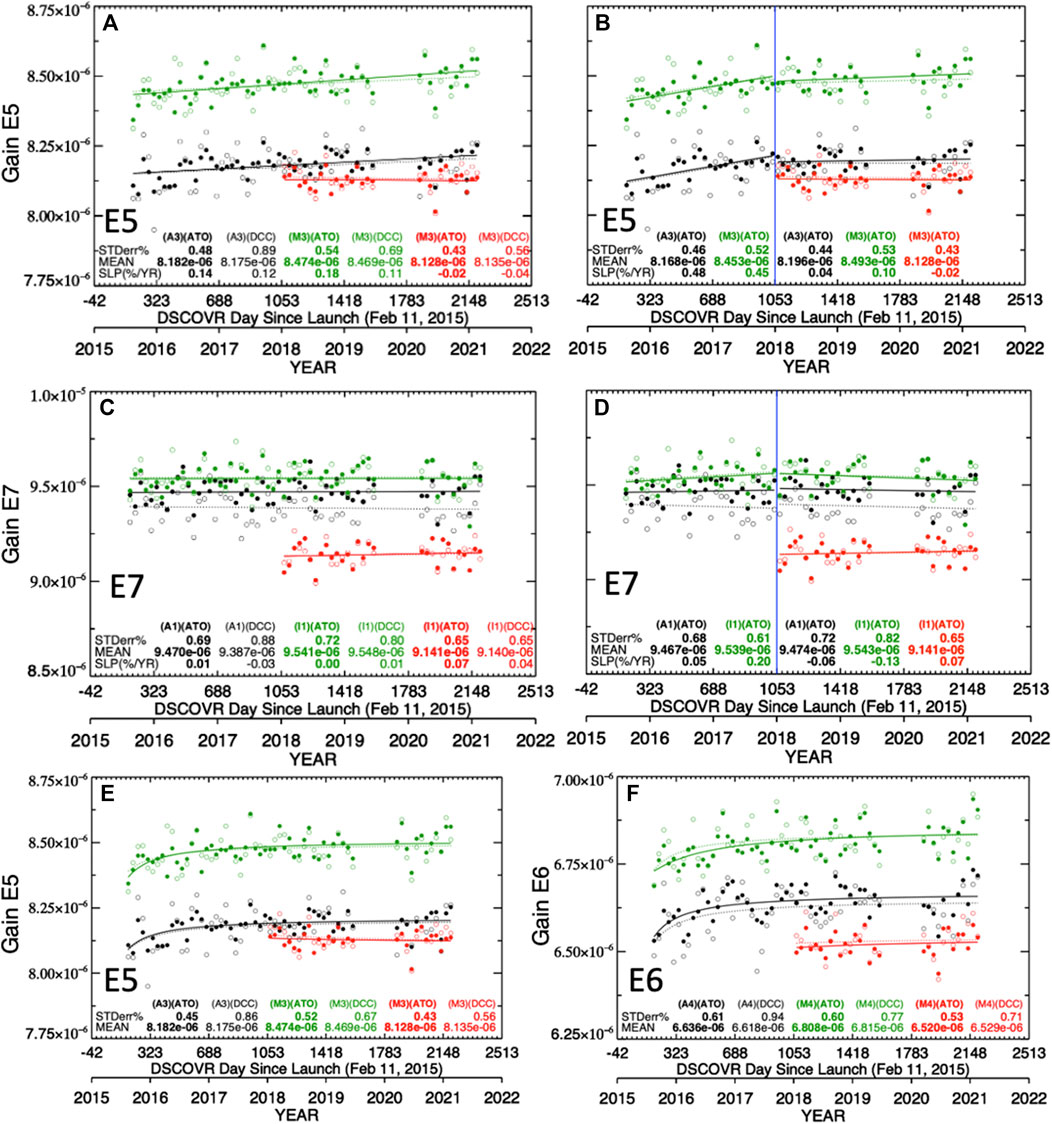
FIGURE 5. (A) The time series of E-5 with MAq-3 (black), VNPP-M3 (green) and VN20-M3 (red) ATO-RM (solid circles and solid line) and DCC-RM (open circles and dotted line) monthly reflectance gains (ref/count) and linear trends. Also shown are the standard error (STDerr%), mean gain (ref/count), and slope SLP(%/YR). (B) Same as (A) except for E-5 time series before 2018 and after 2018 as delineated by the vertical blue line. Both ATO-RM and DCC-RM monthly gains and linear trends are plotted but only the ATO-RM statistics are listed. (C) Same as (A) except for E-7, (D) same as (B) except for E-7. (E) same as (A) except an asymptotic trend is used. (F) same as (E) except for E-6.
Relying on two independent pre- and post-breakpoint linear regression trends to define the E-5 temporal gain in Figure 5B is problematic, since there will be a discontinuity between the two trends at the breakpoint. A continuous piecewise linear regression solves the problem of the discontinuity at the breakpoint. However, the Figure 5B 2018 breakpoint position is arbitrary. The breakpoint was shifted between 2016 and 2019 to evaluate the pre- and post-breakpoint trend significance. Shifting the breakpoint backwards from 2019 leads to the pre-breakpoint trend becoming insignificant once the breakpoint reaches mid-2017, as shortening the length of the record reduces the confidence in the trend. The E-5 gain record is too noisy to set an accurate single or multiple breakpoints to describe an E-5 gain that becomes more stable over time. An asymptotic or an exponential dampening function may better describe the E-5 (Figure 5E) and E-6 (Figure 5F) gains as they become increasingly more stable over time. The asymptotic fit is more sensitive to the first few monthly gains in the record than a linear trend. Given that the E-5 gains are noisy, the asymptotic fit may exaggerate the gain during the first few months.
The same analysis is carried out for the E-7 band. The E-7 gain based on VNPP-I1 ATO-RM (Figure 2), DCCcount (Figure 3B), and Libya-4count (Figure 4C) has been shown to be stable. Figure 5C confirms that the NPP ATO-RM and DCC-RM linear trend gains are stable and that Aqua and N20 show similar stable linear trend gains, where all trends are within ±0.07%/yr. Figure 5D shows that the Aqua ATO-RM before and after 2018 linear trend gains were within ±0.06%/yr. However, the NPP ATO-RM monthly gain is trending slightly upward before 2018 trends and trending downward after 2018. Perhaps the NPP calibration drift correction (Imager Calibration Drift Mitigation) did not completely mitigate the LUT update impact. Unlike E-5 and E-6, the E-7 (Figures 5C,D) gain is nearly stable over the record and shows no signs of greater degradation during the earlier record. The overall, pre- and post-2018 E-7 ATO-RM linear trends were found to be insignificant, suggesting that the E-7 gain is stable over the record. Similarly, The E-10 Aqua and NPP 2015–2017 ATO-RM linear trends were 0.02%/yr and 0.16%/yr (not shown), and were comparable to the post-2018 Aqua, NPP, and N20 ATO-RM linear trends of 0.01%/yr, -0.09%/yr, and 0.08% %/yr, respectively, demonstrating good stability throughout the EPIC record and their associated trends were found to be insignificant.
In order to account for the greater E-5 and E-6 degradation in the early record, an asymptotic trend is applied to the monthly gains
where g0, g1, and g2 are the asymptotic trend coefficients and exp is the natural exponent. The asymptotic trends are applied to the E-5 and E-6 gains in Figures 5E,F, respectively. As expected, the asymptotic fit also shows most of the EPIC degradation at the beginning of the record and a near stable trend after 2018. Although the asymptotic trends did not significantly reduce the trend standard error (Figure 5E) compared with linear trends (Figure 5A), the asymptotic trends seem to capture the degradation more accurately. The E-6/MAq-4 (Figure 5F) asymptotic trend shows a greater degradation during the first year of EPIC than the E-5 channel and is probably due to the greater monthly E-6 gain noise and not associated with the E-6 degradation. Although the asymptotic fit does not perfectly describe the E-5 and E-6 degradation over the record, it is more accurate in characterizing the sensor radiometric trend compared to applying a linear fit. This study utilizes the asymptotic fit from Eq. 4 to derive the E-5 and E-6 gain and employs the linear fit from Eq. 3 to obtain the E-7, E-8, E-9, and E-10 gain. Similar exponential optical degradation for shorter visible wavelengths was also observed in other visible imagers (Fougnie et al., 2007; Eplee et al., 2012; Xiong et al., 2010a; Xiong et al., 2019).
Results
V03 Navigation Assessment
Figure 6 shows the navigation error frequency for E-7/VNPP-I1 for V02 and V03. The navigation error is the number of EPIC 0.25° grid cell shifts required to optimally align with the underlying VIIRS granule (see EPIC Navigation section). Figure 6A shows that the navigation error for V02 was centered within two 0.25° grid cells to the northeast, whereas Figure 6B shows that the V03 navigation error were mostly positioned at the center indicating that no navigation correction was required. The V02 navigation correction encompassed a much broader part of the northeast quadrant than that for V03, which covers a narrow section slightly northwest. Comparing the V02 and V03 navigation error frequency plots suggests that V03 has improved both navigation accuracy and precision over V02. Table 2 reveals that the EPIC V03 NPP E-7/VNPP-I1 navigation accuracy was -11.1 ± 16.2 km and 11.0 ± 15.1 km in the longitude and latitude directions, respectively, which is smaller than the 0.25° grid resolution or the 25-km navigation accuracy that can be achieving by shifting the EPIC gridded image. The EPIC channel images taken during a 7-min period are geo-rectified so that the individual EPIC channel images are aligned. We should expect the EPIC navigation error to be similar for all EPIC and M/V band pairings. Table 2 verifies that the EPIC band navigation accuracy is in good agreement whether aligned with Aqua, NPP, or N20 as well as with the various EPIC band pairs. To assess the EPIC V02 and V03 navigation accuracy, all of the band pair Table 2 column data are simply averaged. The EPIC V02 navigation errors were 32.2 ± 31.5 km and 17.3 ± 19.4 km in longitude and latitude, respectively, whereas the EPIC V03 were -10.9 ± 12.1 km and 11.0 ± 14.7 km. The Doelling et al., 2019 V02 error assessments were 27.4 ± 35.9 km and 15.9 ± 19.9 km, respectively, within close agreement with this study. After applying the Pythagorean theorem, the V02 and V03 navigation errors were 36.5 and 15.5 km, respectively, more than a 50% reduction. After the DSCOVR safe mode anomaly ended in early 2020, EPIC no longer employs gyroscope or reaction wheel inputs, which were replaced by a star tracking technique for pointing knowledge (Geogdzhayev et al., 2021). The EPIC V03 E-7/VNPP-I1 2018–2019 navigation errors were -10.2 ± 15.3 km and 11.2 ± 14.7 km in longitude and latitude, respectively, whereas the 2020–2021 errors were -10.3 ± 14.0 km and 10.6 ± 14.4 km. The pre- and post-EPIC safe mode anomaly navigation error difference is insignificant, indicating that the EPIC navigation performance is similar whether based on the star-tracking or the gyroscope.
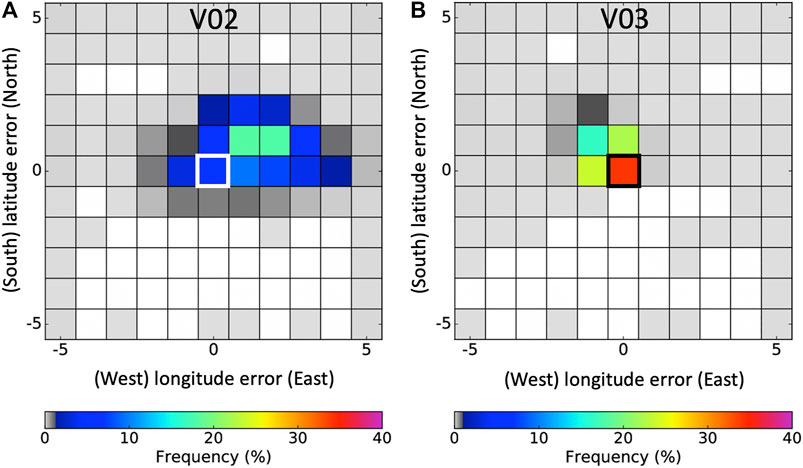
FIGURE 6. The E-7/VNPP-I1 (0.65 µm) (A) V02 and (B) V03 navigation error frequency plots in 0.25° latitude and longitude grid increments. The center white or black box represents no spatial shift or perfect navigation. Note the improved V03 navigation accuracy and precision based on 26,351 E-7/VNPP-I1 total image shifts.
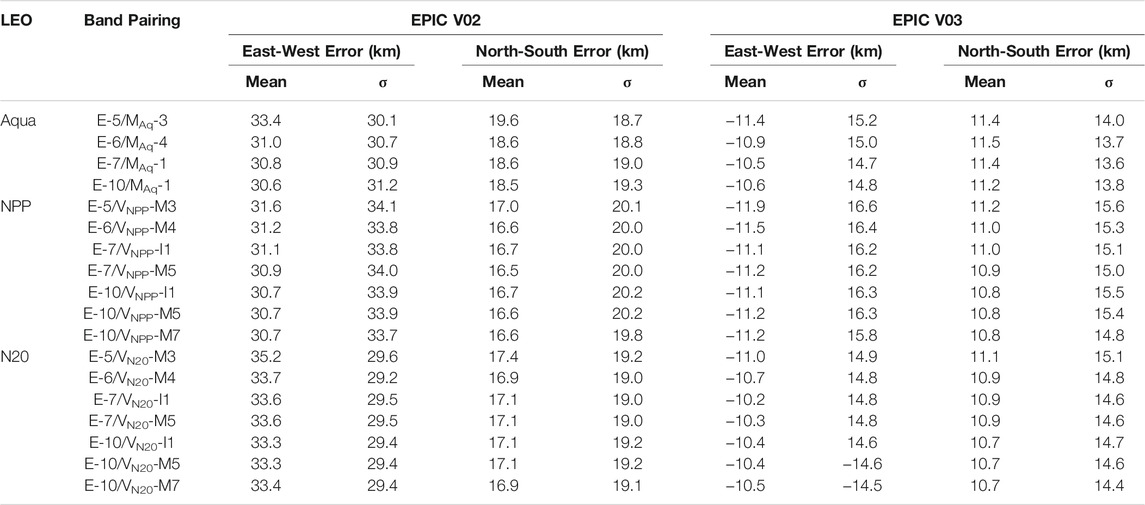
TABLE 2. The V02 and V03 mean and standard deviation (σ) navigation error in the East-West and North-South direction in km with respect to Aqua-MODIS, NPP-VIIRS, and N20-VIIRS analogous band pairs with EPIC. See Table 1 for band pair nomenclature. Statistics in the table are calculated under the assumption that a 0.25° navigation shift translates to a distance of 25 km.
Both V02 and V03 navigation error frequency plots show cases where the EPIC image shifting is well outside of the typical navigation errors observed, which are indicated by the light gray shading in Figure 6. These M/V granules were mostly positioned outside of the EPIC 0.25° gridded domain (±30° in latitude) allowing only a small snippet of the granule available for shifting. Due to the small snippet domain, the May 2020 EPIC count and NPP reflectance pair scatter plot (Figure 1A) only contained one pair that was located outside of the ±1 latitude/longitude shift in Figure 5B. We are confident that these large spurious image shifts are not impacting the overall ATO-RM and DCC-RM monthly gains. Perhaps a snippet size threshold could be used for future EPIC navigation assessments.
EPIC DCC-RM and ATO-RM Calibration Gains
Figure 5 qualitatively shows that the DCC-RM and ATO-RM trend lines are mostly consistent, except for E-7/MAq-1 (compare the Figure 5C and Figure 5D solid and dashed black lines). Table 3 quantitatively lists the DCC-RM and ATO-RM mean gain difference over the 6-years EPIC record. The mean gain difference is mostly less than 0.4% for all band pairs, except for E-7/MAq-1 and E-10/MAq-1, and are similar to the Doelling et al. (2019) (see their Table 2) mean gain differences, which were also less than 0.4%. Note that the consistent ATO-RM and DCC-RM gain differences validate the robustness of the unique band pair and scene type SBAFs required in Eq. 1, given the very narrow 3 nm EPIC spectral bands (Table 1).
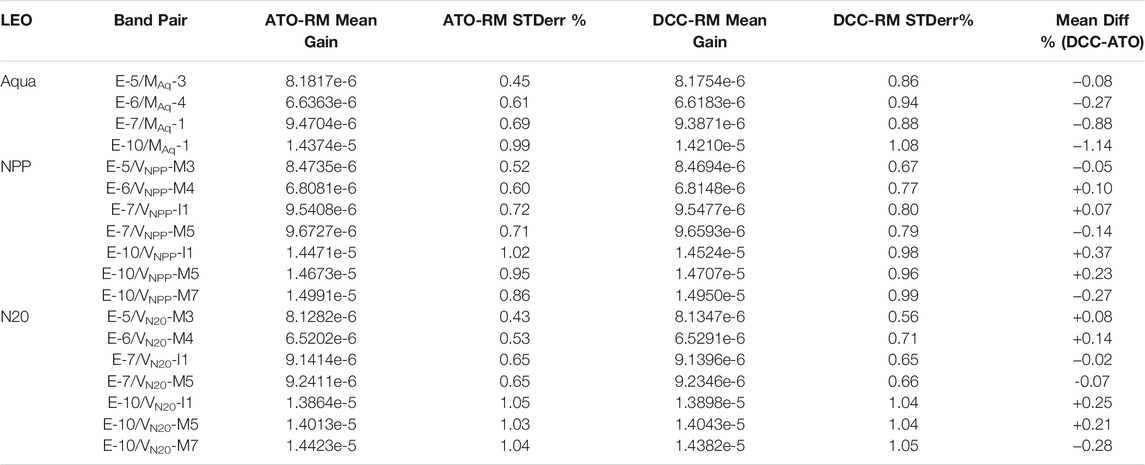
TABLE 3. EPIC V03 channel ATO-RM and DCC-RM mean gain and trend standard error over the EPIC (2015–2021) record with respect to the Aqua, NPP, and N20 band pairings. Note that the Aqua-MODIS, NPP-VIIRS, and N20-VIIRS channels are independently calibrated against their respective solar diffusers and the resulting gains are not expected to match between imagers. The ATO-RM and DCC-RM gain difference is also given. Note that the two independent ray-matching methods provide very similar gain differences.
The E-7/MAq-1 and E-10/MAq-1 show a mean gain difference of −0.9% and −1.1%, respectively. As reported in Bhatt et al. (2019), the MODIS L1B C6.1 MAq-1 reflectances have residual RVS angle dependence of 1.5% for the left-side or backscatter-side of the scan. The residual RVS increases with greater VZA, which would explain the ATO-RM and DCC-RM gain difference, since the DCC-RM limits the VZA to 40°, whereas the ATO-RM does not limit the VZA (Doelling et al., 2019). Note the residual RVS is not mitigated in the Imager Calibration Drift Mitigation section, since the DCC-IT calibration drift correction only corrects the nadir response.
Although, the two independent inter-calibration methods provide consistent EPIC band pair calibration coefficients, they do not provide similar Aqua-MODIS, NPP-VIIRS, or N20-VIIRS referenced EPIC calibration coefficients, given that their L1B reflectances are calibrated against their respective onboard solar diffusers. Table 3 provides the EPIC 6-years record mean gains referenced to the M/V imager L1B reflectance. For example, the E-7/VNPP-I1 mean gain is 4.4% greater than the corresponding E-7/VN20-I1 gain, similar to the NPP and N20 VIIRS imager calibration differences found by other studies (Uprety et al., 2020; Moyer et al., 2021; Mu et al., 2021; Wu et al., 2020).
EPIC DCC-RM Gain Comparison with Previous Study
The DCC-RM V03 gains are compared against the EPIC coefficients provided by Geogdzhayev et al. (2021). The Geogdzhayev et al. (2021) approach (referred to DCC-G in this study) identifies all EPIC pixels with a corresponding M/V imager reflectance greater than 0.6 and a relative standard deviation less than 10%. The EPIC pixel count and imager reflectance ratios are binned according to their relative standard deviation values and a linear regression is used to infer the ratio with a relative standard deviation of zero. The independent DCC-RM and DCC-G gains are compared in Table 4 for the EPIC record ending before the June 2019 safe mode incident. The EPIC and NPP band pair DCC-RM and DCC-G gains agreed within 0.4%, similar to the ATO-RM and DCC-RM gain differences.
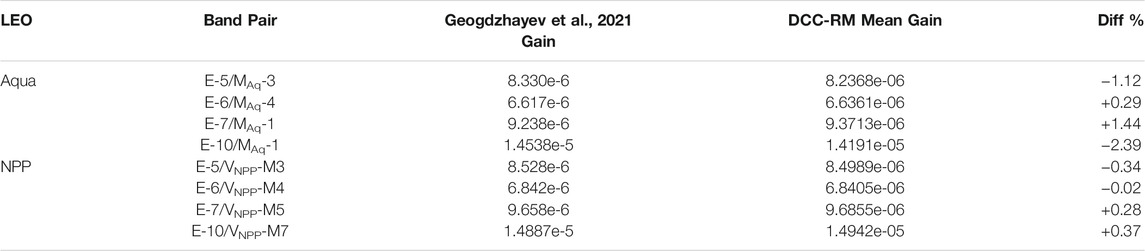
TABLE 4. The EPIC V03 channel DCC-RM and the Geogdzhayev et al., 2021 mean gain for the record ending in June 2019 before the safe mode incident. The DCC-RM method drift-corrected the Aqua and NPP channel reflectances, while Geogdzhayev et al., 2021 combined the Terra and Aqua MODIS reflectances to compute the MODIS based gains. Note that Geogdzhayev et al., 2021 used E-10/MAq-2 while this study uses E-10/MAq-1.
The Aqua based DCC-RM and DCC-G EPIC band pair gains differed from +1.4% to −2.4%. Geogdzhayev et al. (2021) combined Terra and Aqua-MODIS reflectances and report that Terra-MODIS is brighter by 0.6%, −0.1%, -0.2%, and 2.0% for MAq-3, MAq-4, MAq-1, and MAq-2 bands, respectively. Doelling et al. (2015) (their Table 3) reports that Terra-MODIS L1B C6 (2002–2015) is +0.9%. -0.1%, -1.3%, and +0.6% brighter than the above Aqua-MODIS bands, respectively. The Geogdzhayev et al. (2021) and Doelling et al. (2015) Terra and Aqua-MODIS band gain differences explains much of the Table 4 EPIC/Aqua band pair differences. The EPIC E-5, E-6, and E-7 L1B V03 absolute calibration is more consistent with the Terra-MODIS L1B C6 calibration than the Aqua-MODIS L1B C6 calibration. Some of the DCC-G E-10/MAq-2 and DCC-RM E-10/MAq-1 difference may be due to the MAq-1 and MAq-2 absolute calibration difference and that the MAq-2 band reflectance saturates over bright clouds.
Invariant Target Validation
The EPIC DCC and Libya-4 invariant target reflectance are validated by comparing with the corresponding Aqua and NPP ATO-RM and DCC-RM monthly gains. The normalized EPIC invariant target monthly DCCcount and Libya-4count as well as the ATO-RM and DCC-RM gains (after normalizing over the 6-years record) are plotted in Figure 7 with their respective temporal trends. By normalizing the Aqua and NPP ATO-RM and DCC-RM gains, the M/V absolute calibration difference is removed. The inverse of the DCCcount and Libya-4count, which is proportional to the gain, is plotted to facilitate comparison amongst these methods. Qualitatively, The DCCcount and Libya-4count trends are mostly consistent with their corresponding Aqua and NPP ATO-RM and DCC-RM trends. In spite of the sparce DCCcount sampling, the DCCcount has shown to be remarkably stable. The Libya-4count stability confirms that the EPIC V03 navigation accuracy is sufficient to monitor the EPIC degradation utilizing PICS.
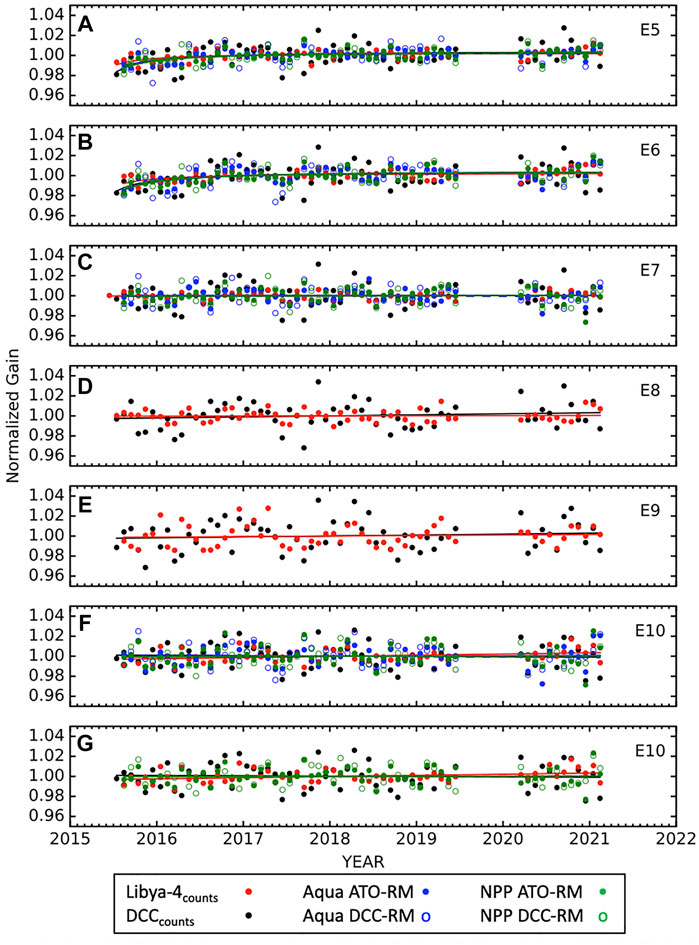
FIGURE 7. Time series of the EPIC band normalized response showing the inverse of the DCCcounts (black) and Libya-4counts (red), as well as the Aqua-MODIS (blue), and NPP-VIIRS (green) monthly gains. Filled circles and solid lines for Aqua-MODIS and NPP-VIIRS represent ATO-RM, and open circles with dashed lines represent the DCC-RM counterparts. (A) through (E) show the corresponding E-5, E-6, E-7, E-8, and E-9 time series, respectively. (F) shows DCCcounts, Libya-4counts, ATO-RM, and DCC-RM with MAq-1 and VNPP-I1, (G) same as (F) except VNPP-M7 instead of MAq-1 and VNPP-I1.
Notably, both DCCcount and Libya-4count are able to monitor the stability of the E-8 and E-9 bands, which is not possible with the M/V ATO-RM or DCC-RM methods because they do not have oxygen A and B band channels. The E-8 and E-9 stability is on par with their E-7 and E-10 reference channels. Given that the E-8 and E-9 gains are stable, perhaps the oxygen absorption bands can be used to locate DCC cells located at the tropopause without the aid of a concurrent IR sensor in future studies (Fougnie and Bach, 2009). Note, currently the EPIC calibration team utilizes the moon as an invariant target to monitor the degradation of the EPIC visible channels (Geogdzhayev and Marshak, 2018). The E-7 gain is transferred to the E-8 channel, by assuming the lunar reflectance is the same for both E-7 and E-8 bands, since the moon has no atmosphere.
EPIC Stability Assessment
The Figure 7 EPIC channel stability using Aqua and NPP ATO-RM and DCC-RM gains as well as the DCCcounts and Libya-4counts are quantified in Table 5. The trend uncertainty for ATO-RM and DCC-RM methods are mostly within 1% over the EPIC record. The Libya-4count has a slightly lower uncertainty than the ray-matching methods, while the DCCcount has a greater uncertainty than the ray-matching methods. All methods have mostly smaller trend uncertainties for the EPIC shorter wavelengths than for the longer wavelengths.
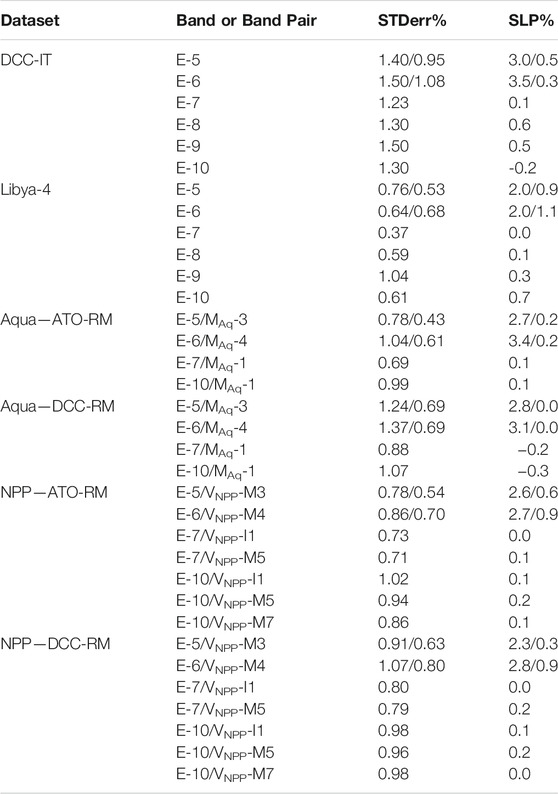
TABLE 5. The monthly gain linear regression standard error (STDerr%) and slope (% over the 6-years record) for all invariant targets and band pairs. The E-5 and E-6 band linear regression statistics are performed twice (2015–2017 and 2018–2021, separated by a “/”).
All stability methods show EPIC channel degradation is mostly less than 0.3% over the EPIC record, excluding the early record of E-5 and E-6. The asymptotic fit has probably over-estimated the early E-5 and E-6 early record degradation due to the magnitude of the monthly gain noise. The greatest single EPIC band method degradation discrepancy was for the E-5 and E-6 bands for both the pre-2018 and post-2018 records. Generally greater degradation was observed for smaller wavelengths than for larger wavelengths. The E-7 band was the most stable of the visible EPIC bands, where all methods showed within a 0.2% degradation over the record. The near stable E-7 record has the potential of monitoring concurrent satellite sensor stability, similar to lunar and Earth invariant targets. The E-10 stability is within 0.4% for most methods over the record, except for Libya-4. Note that the invariant target-based stability may be aliased with the natural variability of the reflectance over target. The same holds true for methods relying on well-calibrated sensors such as M/V, where unaccounted calibration drifts may be embedded in the record.
To determine if the 8-month EPIC safe mode anomaly caused a discontinuity in the monthly gains, a t-test of the 2018–2019 and 2020–2021 mean gains was performed to determine if the two gains differed significantly. All ATO-RM, DCC-RM and DCCcount gains had t-test statistics less than 1. The Libya-4counts t-test statistics had a value less than 2.0, which denotes the 95% confidence level and suggests that no calibration discontinuity was observed after the safe-mode incident.
Conclusion
The DSCOVR mission was designed to take advantage of the L1 position to continuously observe the Earth sunlit disk. The frequent daily EPIC observations are optimized for diurnal and backscatter condition studies. The EPIC sensor retrievals are processed into various aerosol, ozone, cloud, vegetation, volcanic SO2, and glint Level-2 products. These products are now being validated and integrated for their diurnal utility with corresponding MODIS and VIIRS (M/V) products. The EPIC sensor does not have any onboard calibration systems, resulting in an uncalibrated EPIC L1B V03 dataset. To facilitate the EPIC data validation and fusion, an assessment of the navigation accuracy and calibration stability is performed along with providing the M/V sensor and band specific radiometric scaling factors.
The EPIC navigation accuracy was assessed by aligning the individual EPIC channel images onto their corresponding M/V granule images. The navigation error was similar across the EPIC visible channels, validating the EPIC geo-rectification algorithm. Both the EPIC V03 navigation accuracy and precision was improved over V02. The V02 and V03 navigation errors were 36.5 and 15.5 km, respectively, a 50% reduction and within what can be achieved by the image alignment algorithm. After the EPIC 2019 safe mode incident, EPIC navigation relied on star-tracking rather than gyroscope and no significant difference in navigation accuracy was observed.
The EPIC visible channel calibration gains, which have been radiometrically scaled to their analogous Aqua-MODIS, NPP-VIIRS, and N20-VIIRS channels is provided in Table 3. Both ATO-RM and DCC-RM independent inter-calibration method channel pair gains were mostly within 0.4%. The EPIC channel DCC-RM gains were within 0.4% compared with the Geogdzhayev et al., 2021 NPP-VIIRS referenced gains. The EPIC based NPP and N20-VIIRS calibration gain differences were similar to other inter-calibration studies.
The EPIC sensor calibration stability was assessed by the ATO-RM and DCC-RM inter-calibration method gains that relied on the stable Aqua-MODIS and NPP-VIIRS channel reflectances, which were corrected for any residual calibration drifts using DCC targets. By comparing the individual EPIC channel with analogous referenced Aqua-MODIS and NPP-VIIRS gains with their corresponding later record N20-VIIRS gains, the E-5 and E-6 calibration degraded mostly during the first year of operation and became stable thereafter. This was also observed for the EPIC UV channels (Herman et al., 2018). The E-7 and E-10 bands were found to be stable across the full EPIC record. Asymptotic temporal trends were used to describe the E-5 and E-6 degradation, while linear trends defined the remaining EPIC visible bands.
The improved EPIC V03 navigation allowed the EPIC stability to be monitored using DCC and Libya-4 invariant targets. The invariant target stability results were found consistent to those from the ray-matching methods. Most methods indicated that the EPIC V03 L1B radiances were within 0.3% over the 6-years EPIC record, excluding the early record of E-5 and E-6 with an associated uncertainty of ∼1%. Remarkably, both the DCC and Libya-4 were able to determine the stability of the E-8 and E-9 oxygen absorption bands, which were similar to their E-7 and E-10 reference bands. Lastly, no significant EPIC calibration discontinuity was observed across the 2019 safe mode incident.
The impressive stability of the DSCOVR EPIC L1B V03 channel radiances achieved without onboard calibration systems can greatly benefit the Earth remote sensing community. EPIC’s distance from the Earth minimizes the effects of harmful reflected solar radiation on the optics compared to low Earth orbit sensors. Having a future constellation of overlapping L1 satellite sensors can provide a stable record of environmental retrievals and has the potential of monitoring the stability of near-Earth orbit sensors. As sensor detector, optics, pointing, and data transmission technology improves over time, the L1 position will have the ability to monitor regional diurnal variations through the lens of a single sensor and will be an important addition to sun-synchronous satellite retrieved observations to monitor the Earth’s climate.
Data Availability Statement
The datasets presented in this study can be found in online repositories. The names of the repository/repositories and accession number(s) can be found below: DSCOVR EPIC L1B data: https://asdc.larc.nasa.gov/project/DSCOVR/DSCOVR_EPIC_L1B_3 Aqua-MODIS L1B data: https://ladsweb.modaps.eosdis.nasa.gov/archive/allData/61/MYD021KM/ VIIRS L1B data: https://ladsweb.modaps.eosdis.nasa.gov/archive/.
Author Contributions
CH processed and plotted all of the EPIC navigation, ATO-RM, and DCC-RM calibration results and prepared the initial draft of the manuscript. DD formulated and directed the methodology, validation, and results analysis, as well as revised the manuscript. WS reviewed and provided feedback on the manuscript. RB processed and plotted all of the EPIC DCC and Libya-4 invariant target calibration results. BS and AG determined the SBAF coefficients. All authors contributed to the methodology, validation, results analysis and reviewed the manuscript.
Funding
This study was supported by NASA ROSES proposal NNH14ZDA001N-DSCOVR A.22 DSCOVR Earth Science Algorithms. The DSCOVR EPIC data were obtained from the NASA Langley Research Center Atmospheric Science Data Center. The MODIS and VIIRS granules were obtained from the CERES project.
Conflict of Interest
CH, AG and BS was employed by Science Systems and Applications, Inc.
The remaining authors declare that the research was conducted in the absence of any commercial or financial relationships that could be construed as a potential conflict of interest.
Publisher’s Note
All claims expressed in this article are solely those of the authors and do not necessarily represent those of their affiliated organizations, or those of the publisher, the editors and the reviewers. Any product that may be evaluated in this article, or claim that may be made by its manufacturer, is not guaranteed or endorsed by the publisher.
Acknowledgments
The authors would like to thank the reviewers of the manuscript. The authors are appreciative of the helpful discussions with the NASA EPIC and MODIS calibration teams as well as the NOAA VIIRS calibration teams.
References
Angal, A., Xiong, X., Mu, Q., Doelling, D. R., Bhatt, R., and Wu, A. (2018). Results from the Deep Convective Clouds-Based Response versus Scan-Angle Characterization for the MODIS Reflective Solar Bands. IEEE Trans. Geosci. Remote Sensing 56 (2), 1115–1128. doi:10.1109/TGRS.2017.2759660
Bhatt, R., Doelling, D. R., Angal, A., Xiong, X., Haney, C., Scarino, B. R., et al. (2020). Response versus Scan-Angle Assessment of MODIS Reflective Solar Bands in Collection 6.1 Calibration. IEEE Trans. Geosci. Remote Sensing 58 (4), 2276–2289. doi:10.1109/TGRS.2019.2946963
Bhatt, R., Doelling, D. R., Angal, A., Xiong, X., Scarino, B., Gopalan, A., et al. (2017). Characterizing Response versus Scan-Angle for MODIS Reflective Solar Bands Using Deep Convective Clouds. J. Appl. Remote Sens. 11, 016014. doi:10.1117/1.JRS.11.016014
Bhatt, R., Doelling, D. R., Morstad, D., Scarino, B. R., and Gopalan, A. (2014). Desert-Based Absolute Calibration of Successive Geostationary Visible Sensors Using a Daily Exoatmospheric Radiance Model. IEEE Trans. Geosci. Remote Sensing 52 (6), 3670–3682. doi:10.1109/TGRS.2013.2274594
Bhatt, R., Doelling, D., Wu, A., Xiong, X., Scarino, B., Haney, C., et al. (2014b). Initial Stability Assessment of S-NPP VIIRS Reflective Solar Band Calibration Using Invariant Desert and Deep Convective Cloud Targets. Remote Sensing 6, 2809–2826. doi:10.3390/rs6042809
Bovesmann, H., Burrows, J. P., Buchwitz, M., Frerick, J., Noël, S., Rozanov, V. V., et al. (1999). SCIAMACHY: Mission Objectives and Measurement Modes. J. Atmos. Sci. 56, 127–150.
Chander, G., Hewison, T. J., Fox, N., Wu, X., Xiong, X., and Blackwell, W. J. (2013). Overview of Intercalibration of Satellite Instruments. IEEE Trans. Geosci. Remote Sensing 51 (3), 1056–1080. doi:10.1109/TGRS.2012.2228654
Cosnefroy, H., Leroy, M., and Briottet, X. (1996). Selection and Characterization of Saharan and Arabian Desert Sites for the Calibration of Optical Satellite Sensors. Remote Sensing Environ. 58 (1), 101–114. doi:10.1016/0034-4257(95)00211-1
Doelling, D., Haney, C., Bhatt, R., Scarino, B., and Gopalan, A. (2019). The Inter-calibration of the DSCOVR EPIC Imager with Aqua-MODIS and NPP-VIIRS. Remote Sensing 11, 1609. doi:10.3390/rs11131609
Doelling, D., Haney, C., Bhatt, R., Scarino, B., and Gopalan, A. (2021). Daily Monitoring Algorithms to Detect Geostationary Imager Visible Radiance Anomalies. Submitted Can. J. Remote Sensing.
Doelling, D. R., Haney, C. O., Scarino, B. R., Gopalan, A., and Bhatt, R. (2016). Improvements to the Geostationary Visible Imager ray-matching Calibration Algorithm for CERES Edition 4. J. Atmos. Ocean. Technol. 33, 2679–2698. doi:10.1175/jtech-d-16-0113.1
Doelling, D. R., Morstad, D., Scarino, B. R., Bhatt, R., and Gopalan, A. (2013). The Characterization of Deep Convective Clouds as an Invariant Calibration Target and as a Visible Calibration Technique. IEEE Trans. Geosci. Remote Sensing 51, 1147–1159. doi:10.1109/tgrs.2012.2225066
Doelling, D. R., Wu, A., Xiong, X., Scarino, B. R., Bhatt, R., Haney, C. O., et al. (2015). The Radiometric Stability and Scaling of Collection 6 Terra- and Aqua-MODIS VIS, NIR, and SWIR Spectral Bands. IEEE Trans. Geosci. Remote Sensing 53 (8), 4520–4535. doi:10.1109/TGRS.2015.2400928
Eplee, R. E., Meister, G., Patt, F. S., Barnes, R. A., Bailey, S. W., Franz, B. A., et al. (2012). On-orbit Calibration of SeaWiFS. Appl. Opt. 51, 8702–8730. doi:10.1364/ao.51.008702
Fougnie, B., and Bach, R. (2009). Monitoring of Radiometric Sensitivity Changes of Space Sensors Using Deep Convective Clouds: Operational Application to PARASOL. IEEE Trans. Geosci. Remote Sensing 47 (3), 851–861. doi:10.1109/TGRS.2008.2005634
Fougnie, B., Bracco, G., Lafrance, B., Ruffel, C., Hagolle, O., and Tinel, C. (2007). PARASOL In-Flight Calibration and Performance. Appl. Opt. 46, 5435–5451.
Geogdzhayev, I. V., Marshak, A., and Alexandrov, M. (2021). Calibration of the DSCOVR EPIC Visible and NIR Channels Using Multiple LEO Radiometers. Front. Remote Sens. 2, 6719333. doi:10.3389/frsen.2021.671933
Geogdzhayev, I. V., and Marshak, A. (2018). Calibration of the DSCOVR EPIC Visible and NIR Channels Using MODIS Terra and Aqua Data and EPIC Lunar Observations. Atmos. Meas. Tech. 11, 359–368. doi:10.5194/amt-11-359-2018
Haney, C., Doelling, D., Minnis, P., Bhatt, R., Scarino, B., and Gopalan, A. (2016). “The Calibration of the DSCOVR EPIC Multiple Visible Channel Instrument Using MODIS and VIIRS as a Reference,” in Proc. SPIE 9972, Earth Observing Systems XXI, San Diego, CA, United States, 28 August - 1 September 2016 (SPIE), 99720P. doi:10.1117/12.2238010
Herman, J., Huang, L., McPeters, R., Ziemke, J., Cede, A., and Blank, K. (2018). Synoptic Ozone, Cloud Reflectivity, and Erythemal Irradiance from Sunrise to sunset for the Whole Earth as Viewed by the DSCOVR Spacecraft from the Earth-Sun Lagrange 1 Orbit. Atmos. Meas. Tech. 11, 177–194. doi:10.5194/amt-11-177-2018
Hong, G., Heygster, G., Miao, J., and Kunzi, K. (2005). Detection of Tropical Deep Convective Clouds from AMSU-B Water Vapor Channels Measurements. J. Geophys. Res. 110, D05205. doi:10.1029/2004JD004949
Hu, Y., Wielicki, B. A., Ping Yang, P., Stackhouse, P. W., Lin, B., and Young, D. F. (2004). Application of Deep Convective Cloud Albedo Observation to Satellite-Based Study of the Terrestrial Atmosphere: Monitoring the Stability of Spaceborne Measurements and Assessing Absorption Anomaly. IEEE Trans. Geosci. Remote Sensing 42, 2594–2599. doi:10.1109/tgrs.2004.834765
Kaufman, Y. J., and Holben, B. N. (1993). Calibration of the AVHRR Visible and Near-IR Bands by Atmospheric Scattering, Ocean Glint and Desert Reflection. Int. J. Remote Sensing 14 (1), 21–52. doi:10.1080/01431169308904320
Kogan, F. N., Sullivan, J. T., and Bu, P. (1996). Testing post-launch Calibration for the AVHRR Sensor on World Desert Targets during 1985–1993. Adv. Space Res. 17 (1), 47–50. doi:10.1016/0273-1177(95)00444-J
Kostinski, A., Marshak, A., and Várnai, T. (2021). Deep Space Observations of Terrestrial Glitter. Earth Space Sci. 8, e2020EA001521. doi:10.1029/2020EA001521
Marshak, A., Herman, J., Adam, S., Karin, B., Carn, S., Cede, A., et al. (2018). Earth Observations from DSCOVR EPIC Instrument. Bull. Am. Meterol. Soc. 99, 1829–1850. doi:10.1175/BAMS-D-17-0223.1
Moulin, C., Lambert, C. E. J. Poitou., Poitou, J., and Dulac, F. (1996). Long Term (1983-1994) Calibration of the Meteosat Solar (VIS) Channel Using Desert and Ocean Targets. Int. J. Remote Sensing 17 (6), 1183–1200. doi:10.1080/01431169608949076
Moyer, D. I., Uprety, S., Wang, W., Cao, C., and Guch, I. (2021). “S-NPP/NOAA-20 VIIRS Reflective Solar Bands On-Orbit Calibration Bias Investigation,” in Proc. SPIE 20219, Earth Observing Systems, San Diego, CA, United States, 1-5 AUGUST 2021 (SPIE), 1182912. doi:10.1117/12.2595175
Mu, Q., Angal, A., Wu, A., and Xiong, X. (2021). “Performance Assessment of the NOAA-20 VIIRS RSB Using Deep Convective Clouds,” in Proc. SPIE 20219, Earth Observing Systems XXVI, San Diego, CA, United States, 1-5 AUGUST 2021 (SPIE), 1182918. doi:10.1117/12.2593514
Mu, Q., Chang, T., Wu, A., and Xiong, X. (2018). “Evaluating the Long-Term Stability and Response versus Scan Angle Effect in the SNPP VIIRS SDR Reflectance Product Using a Deep Convective Cloud Technique,” in Proc. SPIE 10644, Algorithms and Technologies for Multispectral, Hyperspectral, and Ultraspectral Imagery XXIV, Orlando, FL, United States, 15-19 April 2018 (SPIE), 106440O. doi:10.1117/12.2304395
Mu, Q., Wu, A., Xiong, X., Doelling, D., Angal, A., Chang, T., et al. (2017). Optimization of a Deep Convective Cloud Technique in Evaluating the Long-Term Radiometric Stability of MODIS Reflective Solar Bands. Remote Sensing 9, 535. doi:10.3390/rs9060535
Rao, C. R. N., and Chen, J. (1996). Post-launch Calibration of the Visible and Near-Infrared Channels of the Advanced Very High Resolution Radiometer on the NOAA-14 Spacecraft. Int. J. Remote Sensing 17, 2743–2747. doi:10.1080/01431169608949104
Rao, C. R. N., Weinreb, M. P., and Chen, J. (1994). Recalibration of the Advanced Very High Resolution Radiometer for Climate Change Research. Adv. Space Res. 14 (1), 117–120. doi:10.1016/0273-1177(94)90359-X
Rao, C. R. N., Chen, J., Sullivan, J. T., and Zhang, N. (1999). Post-launch Calibration of Meteorological Satellite Sensors. Adv. Space Res. 23 (8), 1357–1365. doi:10.1016/S0273-1177(99)00284-7
Roujean, J. L., Leroy, M. J., and Deschamps, P. Y. (1992). A Bidirectional Reflectance Model of the Earth’s Surface for the Correction of Remote Sensing Data. J. Geophys. Res. 97 (D18), 20455–20468. doi:10.1029/92jd01411
Scarino, B. R., Bedka, K., Bhatt, R., Khlopenkov, K., Doelling, D. R., and Smith Jr, W. L. (2020). A Kernel-Driven BRDF Model to Inform Satellite-Derived Visible Anvil Cloud Detection. Atmos. Meas. Tech. 13, 5491–5511. doi:10.5194/amt-13-5491-2020
Scarino, B. R., Doelling, D. R., Minnis, P., Gopalan, A., Chee, T., Bhatt, R., et al. (2016). A Web-Based Tool for Calculating Spectral Band Difference Adjustment Factors Derived from SCIAMACHY Hyperspectral Data. IEEE Trans. Geosci. Remote Sensing 54, 2529–2542. doi:10.1109/TGRS.2015.2502904
Shea, Y., Fleming, G., Kopp, G., Lukashin, C., Pilewskie, P., Smith, P., et al. (2020). “Clarreo Pathfinder: Mission Overview and Current Status,” in IGARSS 2020 - 2020 IEEE International Geoscience and Remote Sensing Symposium, Waikoloa, HI, USA, 26 Sept.-2 Oct. 2020 (IEEE), 3286–3289. doi:10.1109/IGARSS39084.2020.9323176
Staylor, W. F., and Suttles, J. T. (1990). Reflection and Emission Models for Deserts Derived from Nimbus-7 ERB Scanner Measurements. J. Clim. Appl. Meteorol. 25 (2), 196–202. doi:10.1175/1520-0450(1986)025<0196:raemfd>2.0.co;2
Su, W., Liang, L., Doelling, D. R., Minnis, P., Duda, D. P., Khlopenkov, K. V., et al. (2018). Determining the Shortwave Radiative Flux from Earth Polychromatic Imaging Camera. J. Geo. Res. Atmos. 123, 11479–11491. doi:10.1029/2018jd029390
Sun, J., Xiong, X., Angal, A., Chen, H., Wu, A., and Geng, X. (2014). Time-Dependent Response versus Scan Angle for MODIS Reflective Solar Bands. IEEE Trans. Geosci. Remote Sensing 52 (6), 3159–3174. doi:10.1109/tgrs.2013.2271448
Teillet, P. M., and Chander, G. (2010). Terrestrial Reference Standard Sites for Postlaunch Sensor Calibration. Can. J. Remote Sensing 36 (5), 437–450. doi:10.5589/m10-079
Teillet, P. M., Slater, P. N., Ding, Y., Santer, R. P., Jackson, R. D., and Moran, M. S. (1990). Three Methods for the Absolute Calibration of the NOAA AVHRR Sensors In-Flight. Remote Sensing Environ. 31, 105–120. doi:10.1016/0034-4257(90)90060-Y
Uprety, S., Cao, C., and Shao, X. (2020). Radiometric Consistency between GOES-16 ABI and VIIRS on Suomi NPP and NOAA-20. J. Appl. Rem. Sens. 14 (3), 1. doi:10.1117/1.JRS.14.032407
Uprety, S., and Cao, C. (2015). Suomi NPP VIIRS Reflective Solar Band On-Orbit Radiometric Stability and Accuracy Assessment Using Desert and Antarctica Dome C Sites. Remote Sensing Environ. 166, 106–115. doi:10.1016/j.rse.2015.05.021
Wang, W., and Cao, C. (2015). DCC Radiometric Sensitivity to Spatial Resolution, Cluster Size, and LWIR Calibration Bias Based on VIIRS Observations. J. Atmos. Oceanic Tech. 32 (1), 48–60. doi:10.1175/JTECH-D-14-00024.1
Wang, W., and Cao, C. (2020). Evaluation of NOAA-20 VIIRS Reflective Solar Bands Early On-Orbit Performance Using Daily Deep Convective Clouds Recent Improvements. IEEE J. Sel. Top. Appl. Earth Observations Remote Sensing 13, 3975–3985. doi:10.1109/JSTARS.2020.3007863
Weatherhead, E. C., Reinsel, G. C., Tiao, G. C., Meng, X.-L., Choi, D., Cheang, W.-K., et al. (1998). Factors Affecting the Detection of Trends: Statistical Considerations and Applications to Environmental Data. J. Geophys. Res. 103 (D14), 17149–17161. doi:10.1029/98JD00995
Wielicki, B. A., Young, D. F., Mlynczak, M. G., Thome, K. J., Leroy, S., Corliss, J., et al. (2013). Achieving Climate Change Absolute Accuracy in Orbit. Bull. Am. Meteorol. Soc. 94 (10), 1519–1539. doi:10.1175/bams-d-12-00149.1
Wu, A., Mu, Q., Angal, A., and Xiong, X. (2020). “Assessment of MODIS and VIIRS Calibration Consistency for Reflective Solar Bands Calibration Using Vicarious Approaches,” in Proc. SPIE 11530, Sensors, Systems, and Next-Generation Satellites XXIV, United Kingdom, 21-25 September 2020 (SPIE), 1153018. doi:10.1117/12.2573022
Wu, A., Xiong, X., Cao, C., and Chiang, K.-F. (2016). Assessment of SNPP VIIRS VIS/NIR Radiometric Calibration Stability Using Aqua MODIS and Invariant Surface Targets. IEEE Trans. Geosci. Remote Sensing 54 (5), 2918–2924. doi:10.1109/TGRS.2015.2508379
Xiong, X., Angal, A., Twedt, K. A., Chen, H., Link, D., Geng, X., et al. (2019). MODIS Reflective Solar Bands On-Orbit Calibration and Performance. IEEE Trans. Geosci. Remote Sensing 57 (9), 6355–6371. doi:10.1109/TGRS.2019.2905792
Xiong, X., Sun, J., Xie, X., Barnes, W. L., and Salomonson, V. V. (2010a). On-Orbit Calibration and Performance of Aqua MODIS Reflective Solar Bands. IEEE Trans. Geosci. Remote Sensing 48, 535–546. doi:10.1109/TGRS.2009.2024307
Keywords: DSCOVR/EPIC, MODIS, VIIRS, calibration, DCC, Libya-4
Citation: Haney C, Doelling DR, Su W, Bhatt R, Gopalan A and Scarino B (2022) Radiometric Stability Assessment of the DSCOVR EPIC Visible Bands Using MODIS, VIIRS, and Invariant Targets as Independent References. Front. Remote Sens. 2:765913. doi: 10.3389/frsen.2021.765913
Received: 27 August 2021; Accepted: 11 November 2021;
Published: 24 January 2022.
Edited by:
Alexander Marshak, National Aeronautics and Space Administration, United StatesReviewed by:
Gerhard Meister, National Aeronautics and Space Administration (NASA), United StatesIgor Geogdzhayev, Columbia University, United States
Copyright © 2022 Haney, Doelling, Su, Bhatt, Gopalan and Scarino. This is an open-access article distributed under the terms of the Creative Commons Attribution License (CC BY). The use, distribution or reproduction in other forums is permitted, provided the original author(s) and the copyright owner(s) are credited and that the original publication in this journal is cited, in accordance with accepted academic practice. No use, distribution or reproduction is permitted which does not comply with these terms.
*Correspondence: Conor Haney, Y29ub3Iuby5oYW5leUBuYXNhLmdvdg==