 Alexei Lyapustin
 Feng Zhao
 Yujie Wang
- 1NASA Goddard Space Flight Center, Greenbelt, MD, United States
- 2MAXAR Technologies, Gaithersburg, MD, United States
- 3University of Maryland Baltimore County, Baltimore, MD, United States
This study presents the first systematic comparison of MAIAC Collection 6 MCD19A1 daily surface reflectance (SR) product with standard MODIS SR (MOD/MYD09). The study was limited to four tiles located in mid-Atlantic United States (H11V05), Canada (H12V03), central Amazon (H11V09), and North-Eastern China (H27V05) and used over 5000 MODIS granules in 2018. Overall, there is a remarkable agreement between the best quality pixels of the two products, in particular in the Red and NIR bands. Over selected tiles, the evaluation found that MAIAC provides from 4 to 25% more high-quality retrievals than MOD09 annually, with the largest difference in tropical regions, confirming results of the previous studies. The comparison of spectral characteristics showed a systematic MAIAC-MOD09 difference increasing from NIR to Blue, typical of biases of a Lambertian assumption in MOD09 algorithm. Over the North-Eastern China, MCD19A1 SR is found more stable at wide range of aerosol optical depth (AOD) variations, whereas MOD09 SR shows a consistent positive bias increasing with AOD and at shorter wavelengths. The observed SR differences can be attributed to differences in cloud detection, aerosol retrieval and in atmospheric correction which is performed using an accurate BRDF-coupled radiative transfer model in MAIAC and a Lambertian surface model in MOD09. While this study is not representative of the global performance because of its limited geographical coverage, it should help the land community to better understand the differences between the two products.
Introduction
Since the launch of Terra in 1999 and Aqua in 2002, the Moderate Resolution Imaging Spectroradiometer (MODIS) instrument aboard the Terra and Aqua satellites has greatly enhanced our understanding of the Earth’s climate and the effects of human activity and natural disasters on ecosystems through a suite of MODIS-based land products, including surface reflectance (SR), vegetation indices (VI), biophysical parameters [e.g., leaf area index (LAI) and fraction of absorbed photosynthetically active radiation (FPAR)], bidirectional reflectance distribution function (BRDF) and albedo and others (e.g., Huete et al., 2002; Myneni et al., 2002; Schaaf et al., 2002; Vermote and Kotchenova, 2008). Among abovementioned MODIS-based land products, SR serves as a primary input to other MODIS-based land products and different applications including crop yield prediction. Thus, the accuracy of atmospheric correction is very important because its uncertainty propagates to the downstream higher-level MODIS land products.
In the current MODIS Collection 6 (C6), two independent SR products are available, MOD09 (Vermote and Kotchenova, 2008) and the Multi-Angle Implementation of Atmospheric Correction (MAIAC) MCD19A1 (Lyapustin et al., 2018). Both are level 2 products derived from MODIS L1B calibrated top of atmosphere (TOA) reflectance though with different cloud/cloud shadow detection, aerosol retrieval and atmospheric correction strategies. The MOD09 is a conventional approach capable of processing a single scene of original swath measurements. It uses standard MODIS cloud mask MOD35 (Ackerman et al., 2008; Frey et al., 2008) augmented with internal cloud tests. The aerosol retrieval relies on empirical spectral surface reflectance ratios. The aerosol optical depth (AOD) is retrieved from 0.47 and 0.67 μm simultaneously with selection of the aerosol model from four generic models (smoke low absorption, smoke high absorption, urban polluted, and urban clean) based on the best fit to the MODIS TOA reflectance at 0.412, 0.443, 0.490 and 2.13 μm. The atmospheric correction uses Lambertian approximation and reports SR in MODIS land bands 1–7. In contrast, MAIAC avoids empirical assumptions: it works with gridded top of atmosphere (TOA) MODIS measurements and uses the time series approach for detailed surface characterization. Accumulation of such information, including spectral BRDF, spatial and thermal contrasts etc. for each 1 km grid cell, helps raise confidence and improve accuracy of cloud and cloud shadow detection, as well as accuracy of snow detection (Cooper et al., 2018). MAIAC aerosol retrieval uses dynamic minimum reflectance method to characterize spectral surface ratios at 1 km resolution and retrieves AOD at 0.47 μm using the regional background aerosol models. The aerosol models were developed for 8 regions over global land based on climatological analysis of AERONET observations (Holben et al., 1998; Giles et al., 2019; Sinyuk et al., 2020). Finally, MAIAC uses the high accuracy semi-analytical Green’s function formulation for the TOA reflectance as a function of surface BRDF (Lyapustin and Knyazikhin, 2001; Lyapustin et al., 2012) to derive the bidirectional reflectance factors (BRF). The BRF is reported for the MODIS land bands 1-7, and for the unsaturated ocean bands 8–11. To implement the operational time series analysis, MAIAC adopted a moving window algorithm storing up to 16 days of the gridded MODIS TOA reflectance (Lyapustin et al., 2012; 2018). MAIAC reaches its top performance once initialized, which may take up to several months depending on cloudiness and snow cover. Un-initialized, MAIAC shows a rather average performance and is not useful for processing of a single scene. The operational Collection 6 MODIS processing by the MODAPS (MODIS Adaptive Processing System) used a buffer 1-year period to initialize MAIAC, and then process the entire MODIS Terra and Aqua record starting in year 2000.
The atmospheric suite of MAIAC products (MCD19A2) has been extensively validated in both regional and global analyses [e.g., column water vapor (Martins et al., 2018)]. The high spatial resolution (1 km) MAIAC aerosol optical depth (AOD) is the most extensively studied and validated product by the Air Quality and, recently, by the climate modeling community. Numerous regional and global validation studies show a high quality of MAIAC AOD product generally on par or exceeding performance of the standard operational aerosol algorithms (e.g., Martins et al., 2017; Lyapustin et al., 2018; Jethva et al., 2019; Mhawish et al., 2019; Tao et al., 2019; Hammer et al., 2020; Schutgens et al., 2020).
Since its introduction in 2011–2012, MAIAC SR product has been used in land science applications, in particular over highly cloudy tropical regions where MAIAC offers more high quality pixels for vegetation trend and change analysis (e.g. Hilker et al., 2012, 2014, 2015, 2017; Bi et al., 2015; Guan et al., 2015; Saleska et al., 2016; Wu et al., 2018; Yang et al., 2018; Ploton et al., 2020). In a limited study using seven MODIS tiles over the North and South American continents in 2002, Chen et al. (2017) demonstrated an improvement in the MODIS standard LAI/FPAR retrievals when the algorithm used MAIAC SR input instead of MOD09.
Despite a significant body of evaluation of MAIAC MCD19A1 SR product, previous studies have been primarily limited to the tropical forest ecosystems analyzing derived VIs. A comparison of the SR between MCD19A1 and MOD09 over a larger range of ecosystems, which is required for a better understanding of the product differences, has been missing. This study provides such comparison for four different regions of the world. Specifically, we 1) give analysis of the quality assurance (QA) flags and the number of cloud-free retrievals, 2) compare spectral reflectance in the Blue—NIR region, most affected by atmospheric aerosol, and 3) analyze sensitivity of the two products to AOD variations. While this study is limited geographically, it should be useful to the land community to help understand the differences between the two products.
For convenience, both MOD09 Lambertian SR and MAIAC BRF products are called surface reflectance throughout this paper.
Data and Methods
Study Area
Four MODIS tiles (H11V05, H11V09, H12V03 and H27V05), encompassing a wide range of climate and terrestrial ecosystems, were selected for this analysis (Figure 1). These MODIS tiles cover four primary terrestrial biomes, including tropical, temperate and boreal forests and agricultural crops along with urban/residential areas.
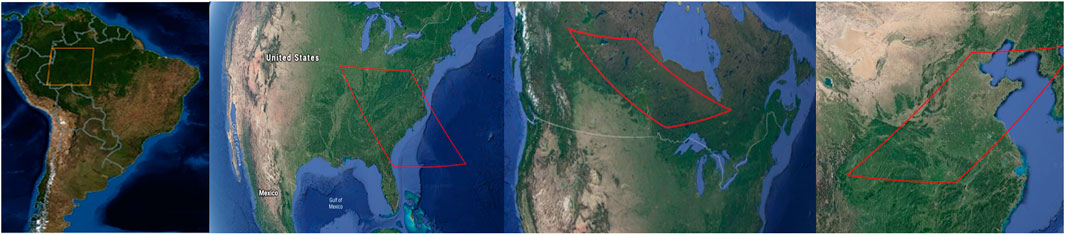
FIGURE 1. Location of four MODIS tiles (from left to right: H11V09, H11V05, H12V03 and H27v05).
MODIS tile H11V09 is located in central Amazonia where pristine terra firme rainforest is dominant (Nepstad et al., 1994). Amazonia is important for the Earth climate with its significant contribution to the global water, energy and carbon fluxes and rich biological diversity. High cloud cover during the wet season and high aerosol concentration from biomass burning during the dry season are factors complicating the remote sensing studies in this region. MODIS tile H11v05 covers the mid-Atlantic region of the United States with abundant evergreen coniferous and broadleaf forests. More clouds can be found over forest and crop-forest boundary due to mesoscale forest-breeze circulation (Gambill and Mecikalski, 2011). MODIS tile H12V03 located at northern latitudes in Canada is one of the active areas in atmospheric aerosol formation driven by the biogenic volatile organic emission from vegetation and increasingly high rate of fire events. Hence, this tile can serve as a good case study area for evaluating the impact of snow, clouds and aerosol on the boreal forest. Northern China with its wide aerosol variations from clear to extremely polluted in a course of 7–10 days due to synoptic cold fronts from the north (Streets et al., 2007) is an ideal natural laboratory to test sensitivity of atmospheric correction to AOD variations. We selected MODIS tile H27V05, which also shows a large diversity of the land cover types and urbanization.
MCD19A1 and MOD/MYD09 SR Products
MAIAC provides a suite of atmospheric and surface products in HDF4 format, including: 1) daily MCD19A1 (spectral bidirectional reflectance factor (BRF), or surface reflectance at 1 km and 500 m; sub-pixel snow fraction and snow grain size for detected snow at 1 km), 2) daily MCD19A2 (atmospheric properties, including column water vapor (CWV), cloud mask, aerosol optical depth (AOD) and wildfire smoke injection height), and 3) 8-day MCD19A3 (spectral BRDF/albedo). These products are generated on a 1 km sinusoidal grid in different 1200 km tiles. For each tile, the daily data are organized as separate layers representing different orbits. MCD19A1 also provides quality assurance (QA) flags helping select cloud-free pixels with the highest quality for subsequent analysis (Table 1). Detailed description of QA can be found in the MODIS MAIAC Data User’s Guide (https://modis-land.gsfc.nasa.gov/pdf/MCD19_UserGuide_final_Feb-6-2018.pdf).
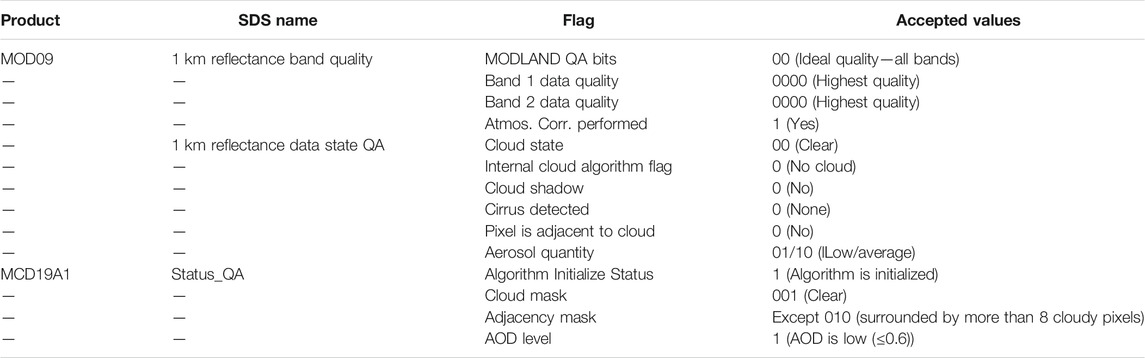
TABLE 1. Quality Assurance (QA) flags of the MOD09 product and MCD19A1 products.
The MOD09 SR product is a swath product representing original (not gridded) MODIS measurements. After re-projection to the global Sinusoidal grid, the MOD09 SR is also available as a separate gridded product (e.g., MOD/MYD09GA). The QA information from the 1 km Reflectance Data State QA and 1 km Reflectance Band Quality is the basis for the level 3 gridded composite products (Table 1). Both QAs are 16-bit layers providing quality flags related to cloud state, cloud shadow, aerosol loading and basic land cover characteristics, such as the land/water, snow and detected fire.
Of importance to this study is the MOD09 aerosol quantity flag (bits 6–7) that can take one of four values - “Climatology” (00), “Low” (01), “Average” (10) or “High” (11). The “Low” aerosol values refer to Aerosol Optical Thickness (AOT) at 550 nm less than 0.2, the “Average” is between 0.2 and 0.5, and “High” is greater than 0.5. “Climatology” is used when AOT is not retrieved, commonly due to the presence of clouds, snow or thick haze. In this study, we initially used “climatology/low” flag but found a significant cloud leak through the “Climatology” value. The analysis below follows Samanta et al. (2010) and Xu et al. (2011) and uses the “low/average” flags. This increases the quality of MOD09 SR but may decrease the number of high quality retrievals.
To match the swath MOD09 SR product with the gridded MCD19A1 SR, the respective MOD09 SR granules were reprojected to MAIAC’s 1 km global Sinusoidal grid. To confirm the results, we also made a reverse analysis where MAIAC data were sampled to match the original MOD09 swath data in order to ensure the equal number of pixels in the comparison from both algorithms.
As Terra is an older satellite with higher calibration degradation (Toller et al., 2013; Lyapustin et al., 2014), we used the MODIS Aqua data for 2018 in this study. Thus, all references to the standard MODIS algorithm (MOD09) below imply the MODIS Aqua (MYD09) dataset. Spectrally, we limited our analysis to four 1 km bands most commonly used in the land studies: band 3 (Blue: 459–479 nm), band 4 (Green: 545–565 nm), band 1 (Red: 620–670 nm) and band 2 (Near Infrared: 841–876 nm).
MCD19A1 product for four MODIS tiles in 2018 and corresponding MYD09 granules were obtained from NASA’s Level 1 and Atmosphere Archive and Distribution System (LAADS Web).
Methods
Even though MCD19A1 SR product has been extensively tested by the land community, prior analysis mostly used VIs derived from MCD19A1 SR. Our study expands the comparison further into the following four aspects: QA filtering analysis in central Amazon, a related analysis of data availability, cross-comparisons of spectral SR across four study regions, and impact of AOD on the two SR products.
The number of good quality pixels depends heavily on the way users apply quality flags. Our analysis took a more careful look into individual quality flags. First, for all MCD19A1/MODY9 scenes collected in 2018, we produced natural color images with QA flags applied consecutively such that the performance of individual flags can be visually assessed. Second, we evaluated the number of cloud-free pixels after each individual quality flag is applied. Further, using the best quality pixels, we generated seasonal and annual histograms of SR in the Blue, Red and NIR bands to study algorithms differences related to cloud detection, adjacency to detected clouds or snow as well as to the AOD level.
Because atmospheric scattering increases at shorter wavelengths, spectral analysis is an important tool to assess the overall accuracy of atmospheric correction. In this study, MCD19A1—MYD09 scatter plots were produced for the Blue-NIR bands for selected MODIS tiles.
Finally, we assessed AOD effects on the accuracy of atmospheric correction for MODIS tile H27V05. Specifically, we evaluated stability of the MCD19A1 and MYD09 SR with AOD variations based on the histogram analysis for low/medium and high AODs, performed AOD validation for both algorithms for the XiangHe and XuZhou-CUMT AERONET (Holben et al., 1998) sites, and obtained statistics of the MCD19-MOD09 difference for four bands from Blue to NIR as a function of AOD. To obtain a broader picture of the aerosol retrieval accuracy of the two algorithms, we added AOD validation for the other AERONET sites located in tiles h11v05, h11v09, and h12v03, respectively.
Results and Discussion
QA Filtering
Compared with MOD09 QA structure using a total of 10 flags, MAIAC MCD19A1 offers a very simple QA with only three values: “AOD level”, “Adjacency Mask” and “Algorithm Initialize Status” (Table 1). As long as cloud detection is reliable, a simple QA has an advantage of transparency and consistency of results, whereas variations in user’s choices in case of complex QA may lead to differences in the final results. It is worth mentioning that MAIAC reports surface reflectance only for the cloud-free pixels (QA flag Cloud Mask = 001) whereas MOD09 reports SR for all pixels including clouds.
To help understand contributions from individual QA flags, we applied the QA flags from Table 1 sequentially. Figure 2 displays a general MOD09 QA filtering process for a sample MODIS scene for tile H11V09. For simplicity, several flags were grouped together (e.g., “cloud state”, “cirrus detected”, and “internal cloud algorithm flag”). Figure 2 shows that cloud flags alone, combining “cirrus detected”, “internal cloud algorithm flag”, “shadow” and “adjacency to cloud” (Figures 2B–D), leave a large number of clouds undetected, consistently with findings of Hilker et al. (2012). The “aerosol quantity” flag cleans the MOD09 SR product significantly but also removes a large proportion of cloud-free pixels (e). Finally, band1 and band2 QA bits were found to have little effect on the final result (f).
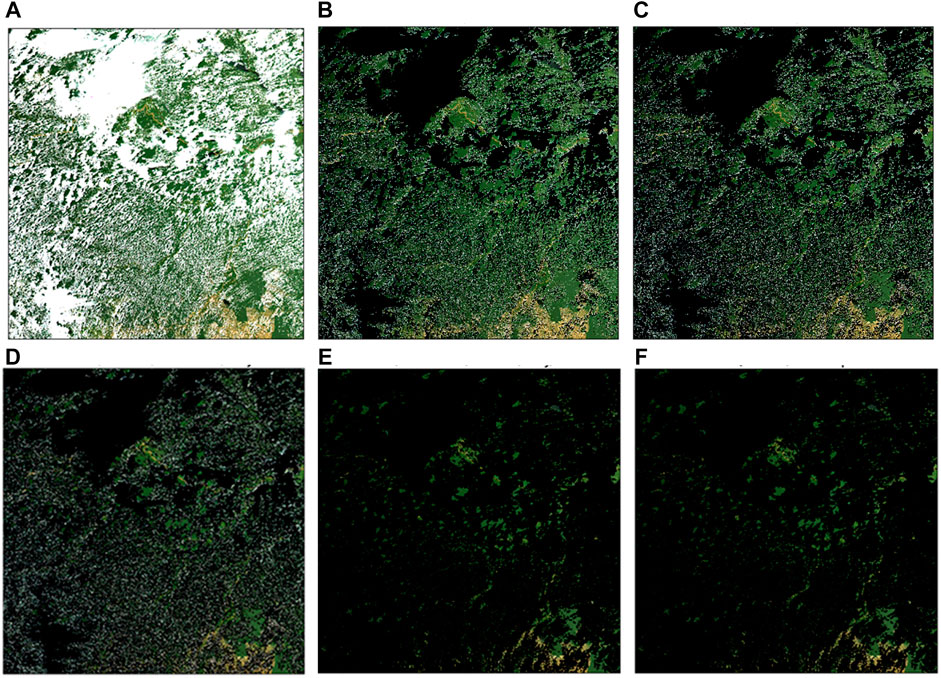
FIGURE 2. Illustration of QA filtering for tile H11V09 acquired in DOY 200, 2018: (A) TOA RGB MODIS image; (B–F) RGB MYD09 SR after incremental application of QA filters: (B) “Cloud state” and “cirrus detected” and “internal cloud algorithm” flags; (C) added “cloud shadow”; (D) added “adjacency to cloud”; (E) added “aerosol quantity”; (F) added “MODLAND QA bits” and “band1 data quality” and “band 2 data quality” and “Atm. Corr. performed”. The black color in images (B–F) shows filtered pixels (fill values).
Figure 3 shows a similar QA filtering of MCD19A1. Plot (a) shows that MAIAC gives a high-quality SR without any QA filtering indicating a reliable cloud detection. Application of “Initialization Status” (b) and “AOD level” (c) filters does not change the result because MAIAC runs in the initialized state, and aerosol loading in Amazon basin during the wet season is low. Of the three QA flags, the “Adjacency Mask” has the largest impact on MCD19A1 SR product. Figure 3D shows that it removes 50.8% of the good quality pixels if we apply the loose threshold of “more than 8 cloudy pixels” in a 5 × 5 window (compare with Figure 2D). The reduction is particularly significant in case of scattered small cumulus clouds where application of adjacency filter may significantly expand the area considered to be affected by the clouds.
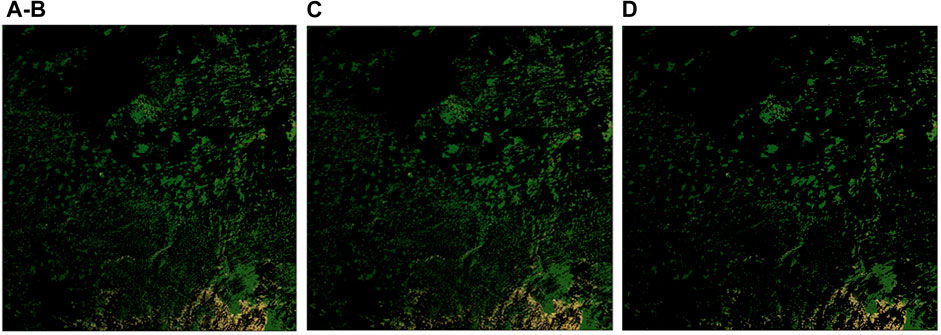
FIGURE 3. MCD19A1 QA filtering for the scene in Figure 2: (A) RGB MCD19A1 SR, no QA; (B) added “Algorithm Initialized Status”; (C) added “AOD level”; (D) added “Adjacency Mask” filter.
To confirm that MAIAC “adjacency” mask removes the good quality pixels, we computed the histograms of surface reflectance with and without “adjacency” filter. The respective histograms shown for the Red and Blue bands in Figure 4 are essentially identical (note the exponential scale of Y axis). The unfiltered MCD19A1 may have added 1-3 partially cloudy pixels to the total of ∼3 × 10⁵ good pixels. One clear outlier is a pixel with high reflectance ∼0.16 in the Blue, and 0.26 in the Red. On the other hand, removal of “Adjacency” filter nearly doubled the number of the high quality pixels available for analysis for this particular scene. This suggests that the “Adjacency Mask” QA in the current Collection 6 MCD19A1 product is largely redundant, and mostly leads to a significant reduction in the number of reported high-quality pixels.
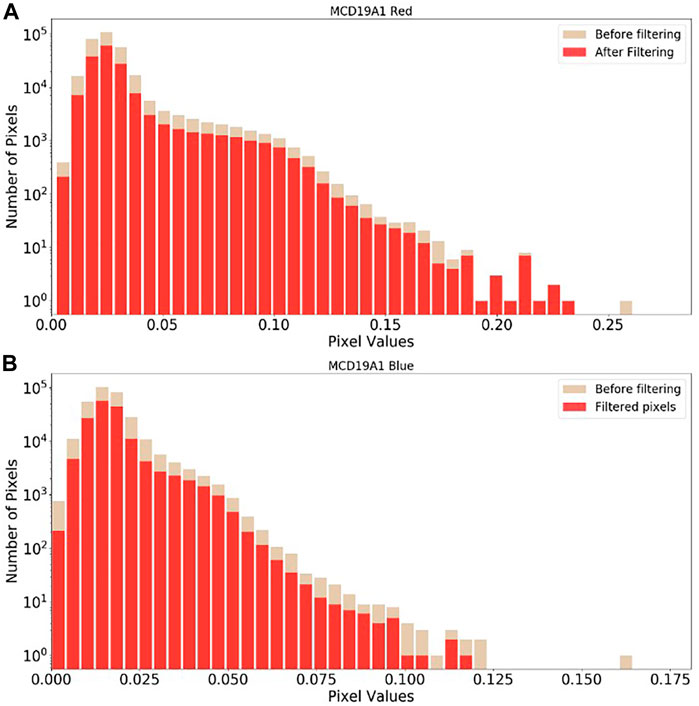
FIGURE 4. MCD19A1 SR histograms of unfiltered and filtered with “Adjacency Mask” QA for the Red (A) and Blue (B) bands for the sample MODIS H11V09 scene of Figure 2.
Whether the “Adjacency Mask” is used or not, MAIAC gives more cloud-free good quality retrievals than MOD09, e.g. from a factor of 1.5 (used) to 3 (not used) for the particular scene of Figures 2, 3. An annual statistics for this tile reported in (Hilker et al., 2015) shows an increase from ∼20% during the dry season to a factor of 2-3 on different months during the wet season (also Bi et al., 2015; Chen et al., 2017).
Presented analysis compared gridded data which involved resampling of MOD09 swath data to MAIAC 1 km grid. Below, we will also conduct analysis using the MOD09 swath data as primary where MAIAC data are resampled to represent the swath pixels.
From the conducted QA analysis illustrated above in one example, we define the best quality pixels that will be used in the comparison study below. Specifically, we use all ten QA flags for MOD09 and four QA flags for MCD19A1 with values specified in the last column of Table 1 (Accepted values). Below, the resulting pixels are interchangeably called as “best” or high” quality pixels. It is worth mentioning that the selected QA filtering for MOD09 agrees with the established community practice (e.g. Samanta et al. (2010); Xu et al. (2011)).
Analysis of High Quality Pixels
To further analyze the MCD19A1 - MOD09 difference in high quality pixels, we generated quarterly SR histograms in bands 1-3 for tile H11V09 considering 3 cases shown in Figure 5. They combine pixels masked according to their quality as: a) “high” by both algorithms (Red lines); b) “high” by MAIAC and “low” by MOD09 (Blue lines); c) “high” by MOD09 and “low” by MAIAC (Black lines). Here, the solid and dashed lines show MAIAC and MOD09 SR, respectively.
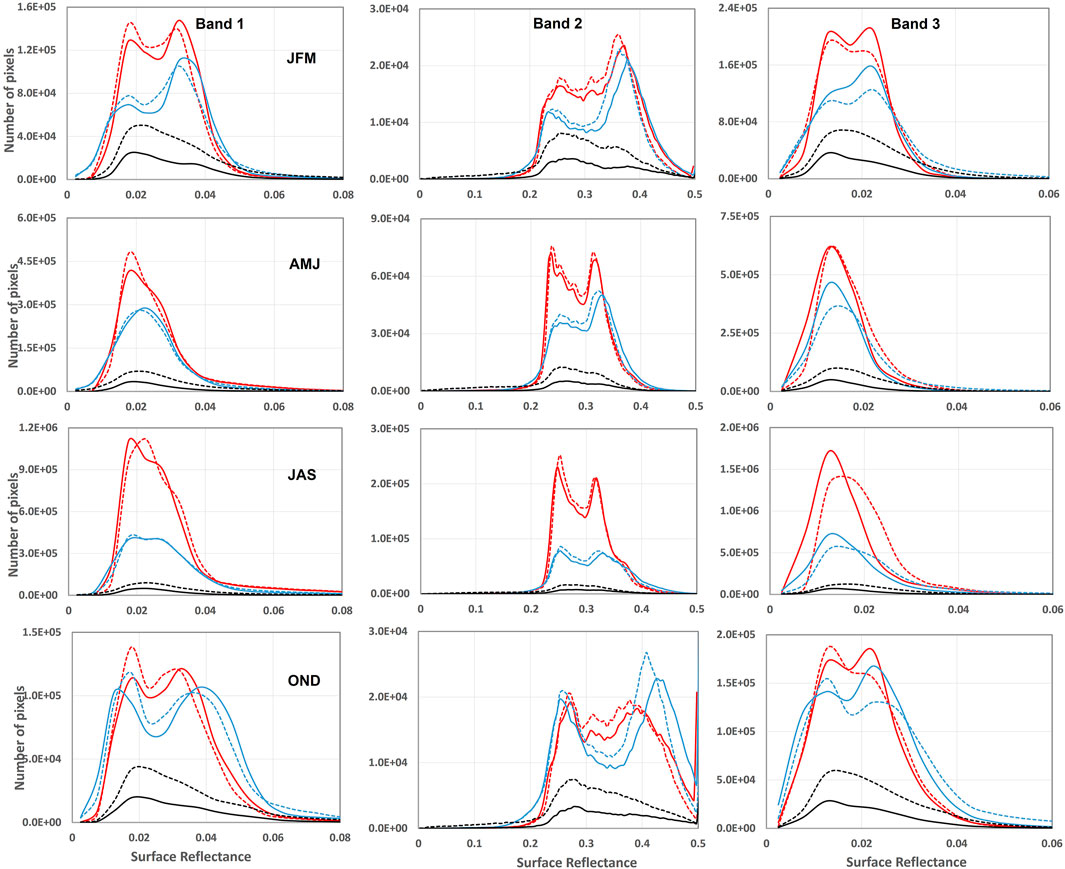
FIGURE 5. Quarterly distributions (rows) of MCD19A1 and MOD09 surface reflectance in bands 1–3 (columns) from high quality pixels over Amazon tile H11V09 for 2018. The pixels are grouped in three categories according to their quality: (A) “high” in both algorithms (Red lines); (B) “high” in MCD19A1 and “low” in MOD09 (Blue lines); (C) “high” in MOD09 (Black line) and “low” in MCD19A1. The solid and dashed lines represent the MCD19A1 and MOD09 SR, respectively.
Figure 5 allows to draw several conclusions. First, histograms of the high quality pixels (red) show a good match. A small difference exists in the Blue band (B3) where MOD09 shows slightly larger values, in particular from July through September. Second, both algorithms are relatively conservative: histograms of rejected pixels (b and c) closely match histogram 1) where both algorithms agreed on high quality. At the same time, MAIAC is less conservative rejecting fewer pixels than MOD09 (compare blue and black lines).
An important feature of Figure 5 is the bi-modal distribution of surface reflectance in all three bands in the 1st and 4th quarters. It relates to the fact that over tropics the MODIS scan geometry aligns with the principal plane in March and October providing observations close to the “dark spot” and to the “hot spot” of BRDF physically representing maximal and minimal shadowing, whereas in other months it moves away ∼20–60° from the principal plane (Bi et al., 2015; Petri et al., 2019). Because the tile H11V09 is mostly homogeneous, the effect of clustering of SR at extreme values manifests the reflectance anisotropy (BRDF).
While the NIR band shows the bi-modal distribution throughout the year, observations in the principal plane in March and October cause a significant broadening of the histogram, in particular from increase of the high values. A comparison of the NIR SR between March (1st quarter) and October (4th quarter) at the high end of reflectance shows an additional increase by 0.02–0.05 in October despite the same (principal plane) view geometry. This increase is manifested much stronger in pixels retained by MAIAC but rejected in MOD09 (blue line). It also translates to the increase in NDVI during the dry season (approximately from September to November) because change of NDVI over dense vegetation is mostly driven by the NIR reflectance. Thus, this simple analysis provides another argument in favor of the increase of photosynthetic activity of the Amazon rainforest during the dry season, a hypothesis originally put forward based on MOD09 data (Huete et al., 2006) and later confirmed with analyses of MAIAC data with BRDF-normalization to a fixed view geometry which removes geometric variability from the seasonal pattern (e.g., Bi et al., 2015; Saleska et al., 2016).
High aerosol concentration from the biomass burning during the dry season is one of compounding factors in studies of the photosynthetic seasonality in Amazonia. In both MAIAC and MOD09, the Blue band, most susceptible to aerosol distortions, shows a good stability during the 4th quarter with only rather marginal increase compared to the other three quarters of the wet season.
Finally, Figure 6 shows the equivalent annual histograms for the three remaining tiles. The MAIAC and MOD09 results are nearly identical in the red and NIR bands 1-2 but MOD09 is lower on average by ∼0.003 in the Blue band for the mid-Atlantic United States (H11V05) and Canada (H12V03) regions with generally low aerosol loading. In north-east China (H27V05), a comparison of cases 1) and 2) shows the difference in cloud masking and QA flags between MOD09 and MCD19A1. For instance, MAIAC adds more retrievals over urbanized areas with higher reflectance in the Blue and Red bands (solid red and blue lines) which are excluded by MOD09 (dashed blue line). The SR histograms remain similar in the NIR (band 2), but the aerosol effect becomes obvious at shorter wavelengths: comparing the matching pixels (red lines) one can see that the MOD09 SR is systematically larger than the MAIAC SR by ∼0.004 in the Red and by 0.01 in the Blue bands. To understand the cause of the discrepancy, we expanded this analysis to pixels corresponding to moderate-to-high AOD (e.g. AOD in MODIS band 3 (0.47 μm) AOD0.47 = 0.6–1.5 in MAIAC). The respective result, magnified by a factor of 2.5 for the convenience of comparison, is presented in green. These data show that MCD19A1 SR is very similar at low AOD (best quality) and at high AOD, including the Blue band, thus indicating a good stability of atmospheric correction at a wide range of AOD variation. At the same time, the MOD09 SR reveals aerosol under-correction resulting in the positive bias which grows at shorter wavelengths where AOD is higher (compare dashed Red and Green lines). While the difference remains minimal in the NIR (B2), the AOD-sensitivity and a bias become significant already in the Red band (B1). The summary statistics for these results (10th and 90th percentiles and the mean SR value) is shown in Table 2 which helps compare metrics for the high quality pixels (e.g., solid red and blue lines for MAIAC in Figure 6) with those at moderate-high AOD (e.g., solid green line for MAIAC in Figure 6). MAIAC results remain the same within 0.001–0.002, while the MOD09 SR increases by ∼0.01 in the Blue and Red bands.
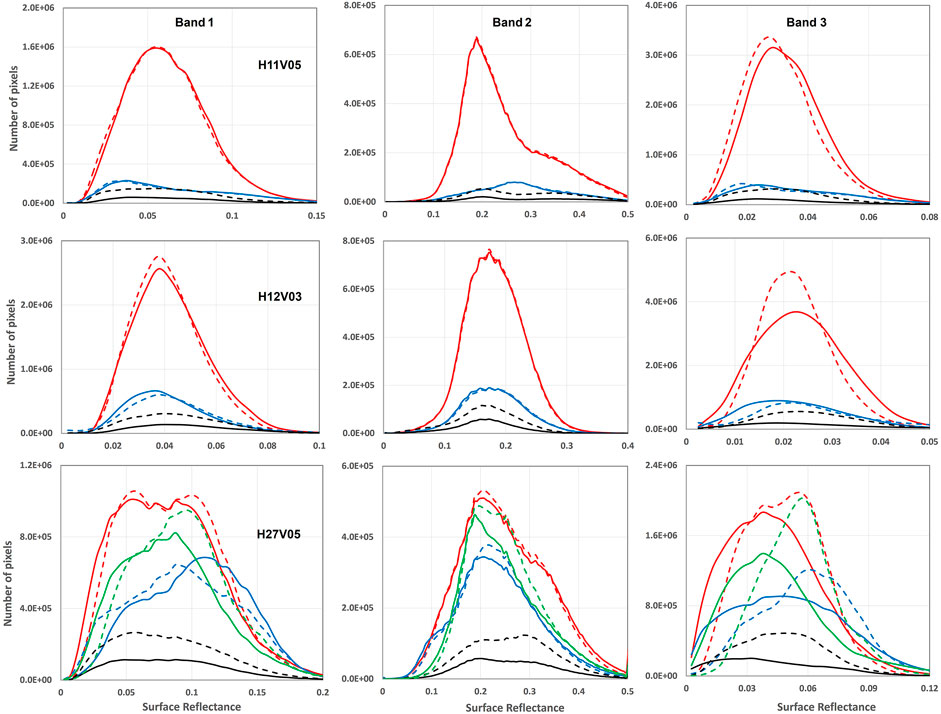
FIGURE 6. Annual histograms of MCD19A1 and MOD09 surface reflectance in bands 1–3 (columns) from high quality pixels over tiles H11V05, H12V03 and H27V05 (rows) for 2018. The red, blue and black lines represent cases (A), (B) and (C) as in Figure 5. The added histograms for H27V05 (green lines, magnified by a factor of 2.5) show the SR distributions at high AOD. The solid and dashed lines stand for the MCD19A1 and MOD09 SR, respectively.
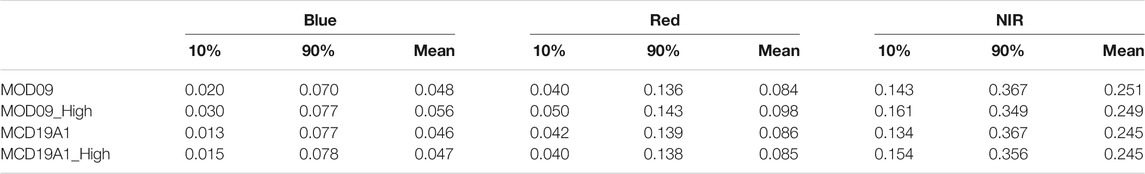
TABLE 2. Comparison of the surface reflectance statistics (10th and 90th percentiles and the mean value) at low and high AOD for MOD09 and MCD19A1. For each product, the top line represents the high quality pixels, and the bottom line represents pixels at moderate-high AOD (MAIAC AOD0.47 = 0.6–1.5) for tile H27V05.
Annually, based on the swath pixel-to-pixel comparison, MAIAC provides 4, 25, 8 and 20% more high quality pixels over mid-Atlantic United States (H11V05), Amazon (H11V09), Canada (H12V03) and Northern China (H27V05) tiles. This result directly follows from the fact that the number of pixels accepted by MAIAC as “high quality” but rejected by MOD09 (blue lines) is always higher than the number of pixels accepted by MOD09 as “high quality” but rejected by MAIAC (black lines). As we discussed above, relaxing MAIAC adjacency criterion, which is currently too conservative, will further increase this difference, in particular in tropics during the wet season. Furthermore, our analysis over the northern China reveals a good stability of MAIAC SR at high AOD values, up to AOD0.47 = 1.5 where MAIAC performs atmospheric correction. The cumulative histograms at high AOD are very similar to those representing the best quality at AOD0.47 ≤ 0.6. Relaxing the AOD cut-off to ∼1.2 would increase the amount of high quality data by another ∼20%. Such increase of AOD threshold makes sense over the north China region where aerosol properties of mainly industrial origin are rather stable with variations of aerosol loading.
Comparison of Spectral Surface Reflectance
While the cumulative histogram analysis reveals many generic features, a more detailed understanding of MOD09-MCD19A1 difference can be gained using a pixel-by-pixel comparison. To avoid errors from re-projection, both MCD19 SR and MOD09 SR data were aggregated to 5 × 5 km2 and only the best quality pixels with >50% coverage were considered. Figure 7 summarizes the analysis for each study area. It shows scatterplots of MOD09 SR (y-axis) vs MCD19A1 SR (x-axis) and provides the intercept and slope of the resulting least squares regression, Pearson’s correlation coefficients, and associated root mean square error and bias.
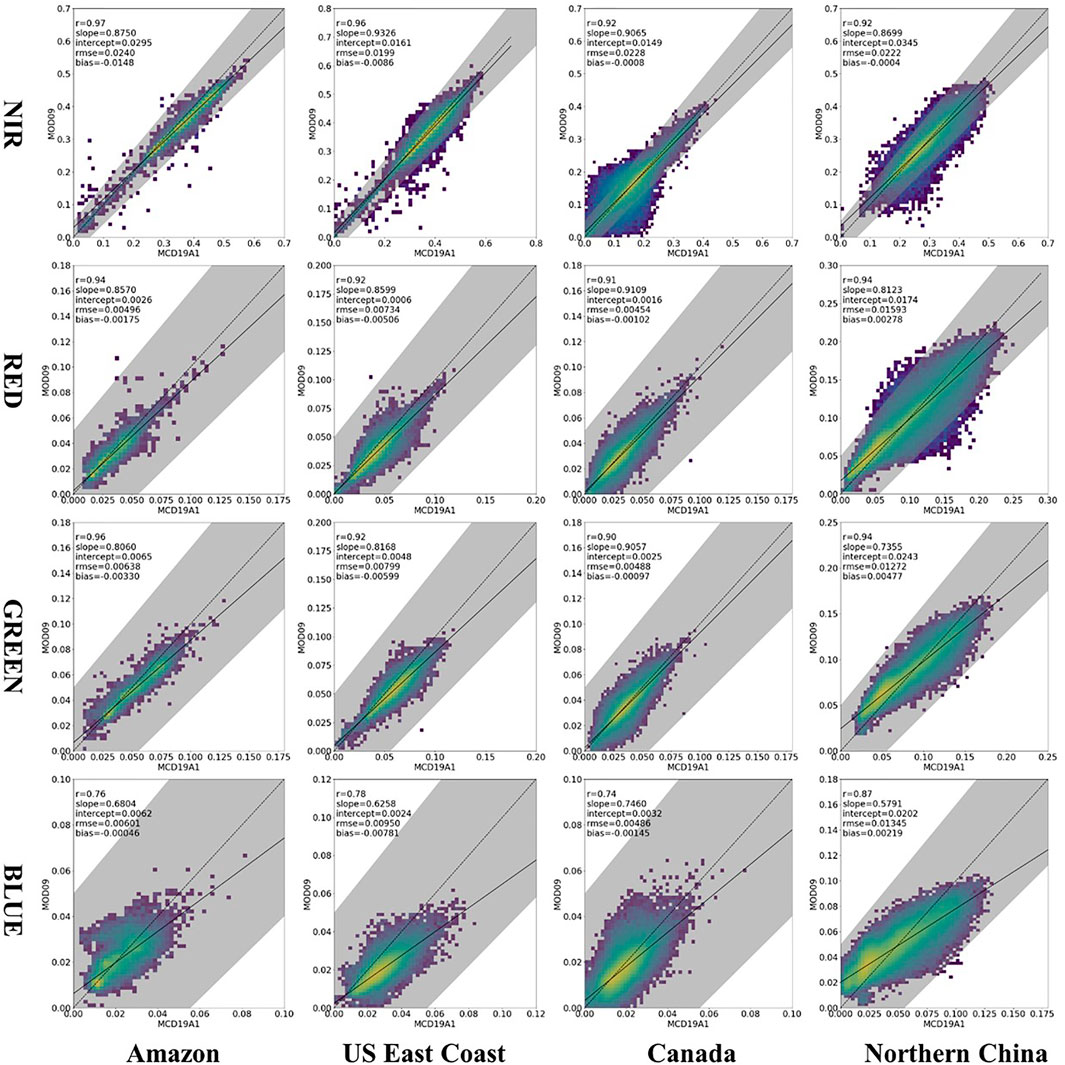
FIGURE 7. MYD09—MCD19A1 surface reflectance scatterplots of the best quality 5 × 5 km2 aggregated pixels in four spectral bands across four study regions.
The pattern revealed in Figure 7 is very consistent across different world regions: it changes systematically from NIR to Blue with both slope and correlation decreasing towards shorter wavelengths. This is particularly obvious for the Northern China tile H27V05 with frequent high aerosol loading. Because decreasing wavelength and increasing AOD both lead to the relative increase of the diffuse (scattered) vs the directly transmitted sunlight, such pattern is indicative of the systematic differences in the radiative transfer model used in atmospheric correction. MAIAC requires prior knowledge of BRDF and computes bidirectional reflectance factor (BRF) using a rigorous semi-analytical Green’s function solution (Lyapustin and Knyazikhin, 2001; Lyapustin et al., 2012; 2018), while MOD09 uses an approximate Lambertian formulation for atmospheric correction. In the latter case, the surface reflectance for the direct Sun beam and for the diffuse sky irradiance is the same regardless of the view geometry, AOD or wavelength.
A systematic study of biases of the Lambertian approximation which grow with the increase of the diffuse (scattered) relative to the directly transmitted radiation was done by Wang et al. (2010). In that study, both Lambertian and accurate BRDF-based atmospheric correction of MODIS Terra observations for 2000–2008 were performed consistently at several AERONET sites using AERONET aerosol and water vapor information. The slope of Lambertian SR vs BRF was found to decrease with the optical path through the atmosphere which increases with solar and view zenith angles, AOD, and at shorter wavelengths. For instance, they observed the range of slopes 0.99–0.88 in NIR, 0.94–0.83 in Red and 0.85–0.64 in Green, which is consistent with the range obtained here, 0.93–0.87 (NIR), 0.92–0.81 (Red) and 0.91–0.74 (Green) (compare Figures 2–5 from Wang et al. (2010) with Figure 7). Figure 7 also illustrates the statement from Wang et al. (2010) that the Lambertian model overestimates the reflectance when BRF is low and underestimates it when BRF is high.
These results are easy to explain considering two components of the surface-reflected signal measured from space. The directly transmitted Sun beam is proportional to the true BRF at a given view geometry. The diffuse term representing sunlight scattered in the atmosphere before and/or after reflection from the surface, is proportional to hemispheric or double hemispheric integrals of BRDF with direct and diffuse or diffuse only sunlight. This term, therefore, is proportional to some average value of the BRDF which changes little with view geometry. The Lambertian model mixes these two contributions: because the diffuse term weighs towards the average reflectance, the Lambertian SR (SRL) is always lower than BRF when BRF is high, and higher than BRF when BRF is low. The relative weight of the diffuse term increases with the atmospheric optical depth and Sun/view zenith angles. In the worst case scenario of a very high AOD and shortest wavelength, SRL will be close to the mean diffuse reflectance and will have minimal variation with the view geometry. On the opposite end, SRL will be close to the true BRF at low AOD and longer wavelengths where Rayleigh optical depth is low.
To illustrate these properties of the Lambertian approximation, we arbitrarily selected a green vegetated pixel and a brown soil pixel on the south of the mid-Atlantic tile. Using MAIAC BRDF, we simulated the TOA reflectance for these pixels for three different AOD levels (AOD0.47 = 0.05, 0.5, 1.5) for all MODIS observations in 2018, and then computed SRL. The result in Figure 8 shows scatterplots of SRL vs exact BRF for the Blue, Green, Red and NIR MODIS bands for the vegetated pixel on the top and soil pixel on the bottom. In each plot, retrievals for very clear (AOD0.47 = 0.05), moderately hazy (AOD0.47 = 0.5) and hazy (AOD0.47 = 1.5) conditions are shown by the black, blue and red colors, respectively. One can see that theoretical Figure 8 essentially reproduces Figure 7 indicating that biases due to the Lambertian surface approximation explain well the main MOD09 - MAIAC difference pattern observed in this work. The different aerosol retrieval accuracy may also be a contributing factor. While the high accuracy of MAIAC AOD (MCD19A2) has been widely documented in numerous local, regional and global studies, with prognostic uncertainty model available for different regions of the world (Lyapustin et al., 2018), such evaluation for the MOD09 AOD is currently missing although AOD uncertainty is one of the major factors in the SR error budget.
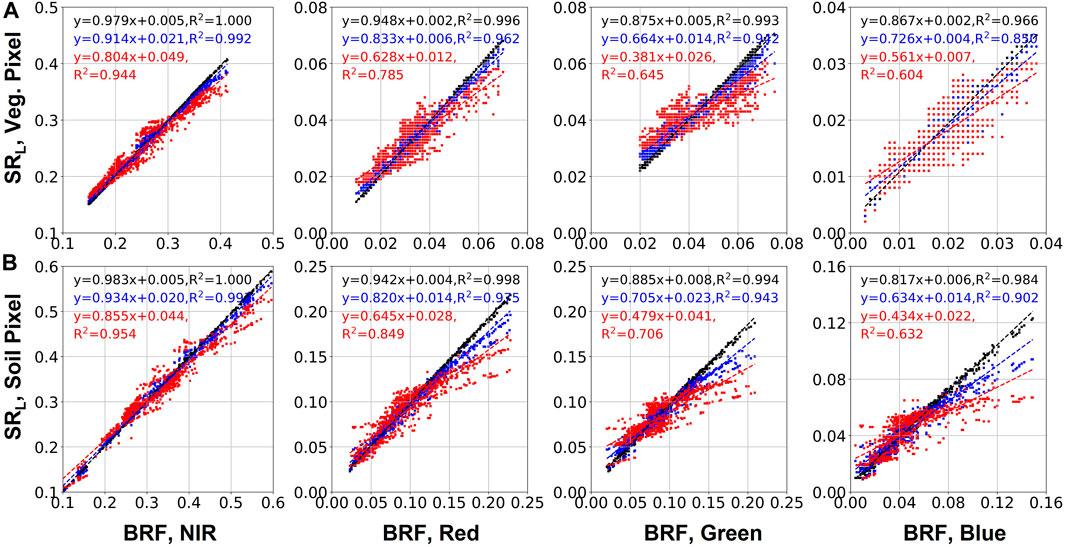
FIGURE 8. Simulated scatterplots of Lambertian SR vs accurate BRF for randomly selected vegetated green pixel (A) and brown soil pixel (B) in tile H11V05 in the vis-NIR bands. The Lambertian SR was computed from the simulated TOA reflectance for all MODIS observations in 2018 using MAIAC BRDF model. The simulations were performed for different levels of atmospheric opacity, including very clear (AOD0.47 = 0.05, black), moderately hazy (AOD0.47 = 0.5, blue) and hazy (AOD0.47 = 1.5, red) conditions.
Effect of AOD on Surface Reflectance
Besides discussed biases due to the Lambertian model, higher AOD levels, usually associated with biomass burning, dust outbreaks or industrial pollution, depending on the world region, often bring higher variability in aerosol properties (e.g., particle size distribution, absorption). This variability works in tandem with the reduction of sensitivity of TOA measurements to the surface reflectance at higher AOD, thus reducing the accuracy of atmospheric correction. Analysis of the retrieval accuracy as a function of AOD has long been an established practice in validation of aerosol retrievals. However, such analysis for the surface reflectance has never been done in the land community.
In general, finding proper conditions for such analysis is not easy because it requires high short-term variability of AOD while surface is stable. The longer-term aerosol variability can be high but it may be accompanied with the seasonal surface changes making it more difficult to untangle atmospheric and surface variations. In this sense, the selected Northern China region represents an ideal natural laboratory providing atmospheric variations from clear to extremely opaque in a matter of 7–10 days when the surface properties remain relatively stable. The variations are caused by passage of the northern cold fronts which initially drive atmospheric pollution 300–400 km south creating low AOD conditions. However, the wind direction gradually changes from the North to the South-West/South, with a simultaneous reduction of wind speed, creating stagnant conditions. This periodic variation gives rise to a saw-tooth pattern of AOD which is superimposed on the local cycle of aerosol emissions (e.g., Streets et al., 2007; Lyapustin et al., 2011).
First, we conducted AOD validation at 0.47 μm for the XiangHe and XuZhou-CUMT AERONET sites located in tile H27V05 for MAIAC AOD reported in MCD19A2 product and for MOD09 AOD reported as part of the MOD09 product suite. The AOD data were averaged within 21 km box and matched to AERONET record within ±30 min interval. The result for 2017 is shown in Figure 9A. The MAIAC AOD offers a higher quality of aerosol retrieval with R2 = 0.873 vs. 0.767, rmse = 0.21 vs. 0.27, and ∼17% overestimation vs. ∼37% underestimation by MOD09. The regional aerosol model over China in C6 MAIAC algorithm was tuned to the AERONET data for the period of 2000–2012. Due to government’s regulations, the pollution level has been declining since about 2008–2010 (e.g., Hammer et al., 2020; Wei et al., 2021) and the aerosol absorption has reduced as well, e.g. (Lyapustin et al., 2011). The reduction of aerosol absorption since 2010 is taken into account in the upcoming MAIAC Collection 6.1 which will remove the small positive bias of MAIAC AOD in this region. The 37% AOD underestimation by MOD09 algorithm is rather significant and systematic, with 96% of data points below the 1:1 line.
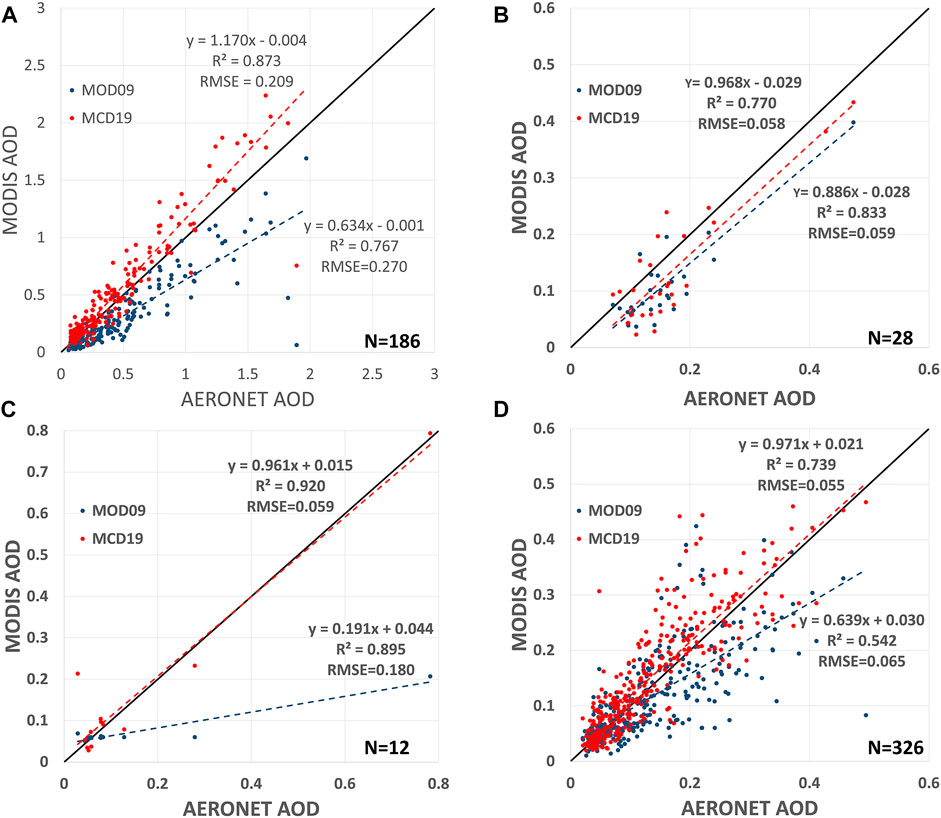
FIGURE 9. AOD0.47 validation for MCD19 and MOD09 for XiangHe, XuZhou-CUMT H27V05 (A), Rio_Branco, H11V09 (B), Pickle_Lake, H12V03 (C) and Appalachian_State, Dayton, EPA-Res_Triangle_Pk, IMPROVE-MammothCave, NASA_LaRC, NEON_MLBS, NEON_SCBI, NEON_ORNL, H11V05 (D) AERONET sites. N gives the total number of AERONET match-up points for each tile. The black line shows a 1:1 correspondence to AERONET.
To gain a broader understanding of the AOD retrieval accuracy, we extended AOD validation to all other AERONET sites located in the tiles of this study and having measurements in 2018. In total, there was one site (Rio_Branco) in tile h11v09, one site (Pickle_Lake) in tile h12v03, and eight sites (Appalachian_State, Dayton, EPA-Res_Triangle_Pk, IMPROVE-MammothCave, NASA_LaRC, NEON_MLBS, NEON_SCBI, NEON_ORNL) in tile h11v05. The cumulative AOD validation results for these tiles are displayed in Figures 9B–D, respectively. The two algorithms have a similar retrieval accuracy at Rio_Branco, with MOD09 showing a slightly higher R2 and MAIAC giving a better regression slope close to one. MAIAC shows a better validation statistics over the mid-Atlantic United States (Figure 9D). While MAIAC accuracy remains consistent across all sites, the MOD09 shows a general underestimation of AOD, and a considerable AOD underestimation at NASA_LaRC (slope 0.3) and at Pickle_Lake (slope 0.19). Presented analysis uses land-only pixels: we removed the coastal and shoreline pixels adjacent to water, to avoid a possible bias of the MOD09 AOD in areas of the land-water transition. In summary, observed low bias of AOD retrieval may affect the accuracy of MOD09 atmospheric correction, in particular at shorter wavelengths.
Figure 10 shows the relative difference between MCD19A1 and MOD09 SR as a function of AOD for the 5 × 5 km2 aggregated pixels of tile H27V05. In this case, we allowed all reported AODs. Given higher quality of aerosol retrieval and a stable performance of MAIAC atmospheric correction with AOD demonstrated above (Figure 6), this figure may be interpreted as the bias of MOD09 SR as a function of AOD. Obtained results fit the previous physical picture uncovered in Figures 6–8 and is explained by the combination of biases from the aerosol retrievals and from Lambertian reflectance model: while the slope of regression line is practically negligible in the NIR where Rayleigh and aerosol optical depth are the lowest, it gradually increases towards the Blue band to 14.6%. Most of the relative difference for all bands stays within 20% which, for the Blue band on average translates to ΔSR∼0.008. Part of the scatter may be due to rather high surface heterogeneity of tile H27V05 and to our criterion of more than 50% coverage if different groups of pixels were selected by the two algorithms in the 5 × 5 km2 aggregate pixels.
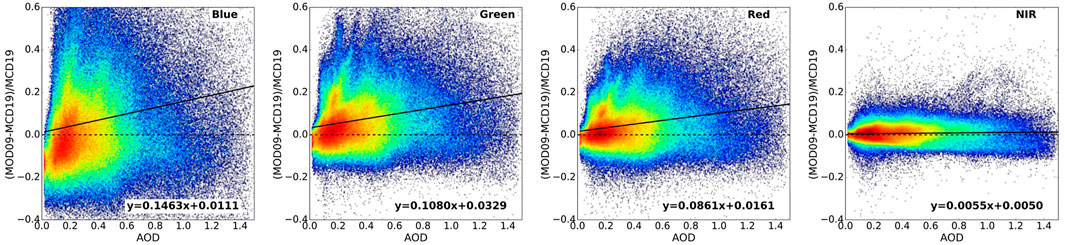
FIGURE 10. A relative difference (MCD19-MOD09)/MCD19 in the Blue, Green, Red and NIR bands as a function of MAIAC AOD0.47 for the Northern China tile H27V05.
Conclusion
This study is the first systematic comparison of MCD19A1 SR product with standard MODIS MOD09 SR over four MODIS tiles located in three different continents. A total of more than 5000 MODIS tiles/granules acquired in 2018 were used for this analysis to obtain representative statistics and ascertain that the results are consistent across primary ecosystems and robust over different world regions. As a main result, we should mention a remarkable agreement between the two products, in particular in the Red and NIR bands mostly used in vegetation analyses. At the same time, there are differences that may be important for the broad range of land research and applications.
This study found that MCD19A1 SR QA is much simpler and user-friendly compared to MOD09. Current MAIAC C6 generates adjacency mask by analyzing cloudiness in the 5 × 5 pixels neighborhood of the central pixel. Given the findings of this work, we will limit adjacency analysis to the immediate neighbors (3 × 3 window) in the upcoming Collection 6.1 MAIAC re-processing. We will also re-structure the QA, e.g., replace the “Algorithm Initialized Status”, which has no practical value in the operational processing, with the “Aerosol Type” mask to indicate wildfire smoke events or dust storms when the accuracy of atmospheric correction may be lower. This should further simplify MAIAC QA and make it more practical as a descriptor of the data quality.
Presented study for four different regions confirms earlier findings that MAIAC offers more high quality pixels for analysis (e.g., Hilker et al., 2012; Bi et al., 2015; Chen et al., 2017). On the annual basis, we found that MAIAC provides 4, 25, 8 and 20% more high quality pixels than MOD09 over mid-Atlantic United States (H11V05), Amazon (H11V09), Canada (H12V03) and Northern China (H27V05) tiles, respectively.
Analysis over the Northern China showed that MAIAC SR has a good stability in the full range of AOD variations (AOD0.47 < 1.5) for which it is reported. In contrast, the MOD09 SR was found to increase with AOD in the Blue - Red range which is related to a systematic underestimation of AOD in this region. The AOD validation over available AERONET sites in the selected tiles shows a uniform good accuracy of MAIAC, and an underestimation of AOD by MOD09 which may affect its SR at RGB wavelengths.
A cross-comparison of spectral SR indicates that the MCD19A1 SR has a slightly larger range of values (both lower and higher) compared to MOD09. The MAIAC-MOD09 difference is lowest in the NIR, and consistently increases towards the Blue band, as well as with the increase of AOD. Such pattern is consistent with biases caused by the Lambertian assumption used in the MOD09 algorithm.
As a final note, we would like to mention that the reported results represent four geographically limited regions, and should not be generalized to the entire globe. Understanding the global differences between the two products will require a much larger effort. Nevertheless, the presented methodological comparison approach, covering data availability according to the product’s QA, analysis of AOD retrieval accuracy and stability of SR with AOD variations, and analysis of the surface model (Lambert vs BRDF-based) used in the atmospheric correction should help the land community to better understand the differences between the MOD09 and MCD19A1 products.
The MCD19 Collection 6 product suite including 1) daily MCD19A1 (spectral SR), 2) daily MCD19A2 (atmospheric properties (including AOD), and 3) 8-days MCD19A3 (spectral BRDF/albedo), is available at https://lpdaac.usgs.gov/data_access/data_pool.
Data Availability Statement
Publicly available datasets were analyzed in this study. This data can be found here: https://e4ftl01.cr.usgs.gov/MOTA/ https://search.earthdata.nasa.gov/search?q = MCD19.
Author Contributions
AL developed the concept; FZ and YW performed data analysis; AL and FZ wrote the paper.
Funding
This research was supported by the NASA MODIS Terra/Aqua and VIIRS SNPP Program (project managers M. Falkowski and H. Margolis).
Conflict of Interest
At the time of this work, author FZ was employed by the Science Systems and Applications Inc., Lanham, MD, USA (SSAI), and currently he is with the MAXAR Technologies.
The remaining authors declare that the research was conducted in the absence of any commercial or financial relationships that could be construed as a potential conflict of interest.
Publisher’s Note
All claims expressed in this article are solely those of the authors and do not necessarily represent those of their affiliated organizations, or those of the publisher, the editors and the reviewers. Any product that may be evaluated in this article, or claim that may be made by its manufacturer, is not guaranteed or endorsed by the publisher.
Acknowledgments
We gratefully acknowledge support of the NASA Center for Climate Simulations (NCCS) and of the MODIS Adaptive Processing System (MODAPS). We also thank AERONET for providing aerosol measurement data.
References
Ackerman, S. A., Holz, R. E., Frey, R., Eloranta, E. W., Maddux, B. C., and McGill, M. (2008). Cloud Detection with MODIS. Part II: Validation. J. Atmos. Oceanic Technol. 25 (7), 1073–1086. doi:10.1175/2007jtecha1053.1
Bi, J., Knyazikhin, Y., Choi, S., Park, T., Barichivich, J., Ciais, P., et al. (2015). Sunlight Mediated Seasonality in Canopy Structure and Photosynthetic Activity of Amazonian Rainforests. Environ. Res. Lett. 10 (6), 064014. doi:10.1088/1748-9326/10/6/064014
Chen, C., Knyazikhin, Y., Park, T., Yan, K., Lyapustin, A., Wang, Y., et al. (2017). Prototyping of LAI and FPAR Retrievals from MODIS Multi-Angle Implementation of Atmospheric Correction (MAIAC) Data. Remote Sensing 9, 370. doi:10.3390/rs9040370
Cooper, M. J., Martin, R. V., Lyapustin, A. I., and McLinden, C. A. (2018). Assessing Snow Extent Data Sets over North America to Inform and Improve Trace Gas Retrievals from Solar Backscatter. Atmos. Meas. Tech. 11, 2983–2994. doi:10.5194/amt-11-2983-2018
Frey, R. A., Ackerman, S. A., Liu, Y., Strabala, K. I., Zhang, H., Key, J. R., et al. (2008). Cloud Detection with MODIS. Part I: Improvements in the MODIS Cloud Mask for Collection 5. J. Atmos. Oceanic Technol. 25 (7), 1057–1072. doi:10.1175/2008jtecha1052.1
Gambill, L. D., and Mecikalski, J. R. (2011). A Satellite-Based Summer Convective Cloud Frequency Analysis over the southeastern United States. J. Appl. Meteorol. Climatol. 50 (8), 1756–1769. doi:10.1175/2010JAMC2559.1
Giles, D. M., Sinyuk, A., Sorokin, M. G., Schafer, J. S., Smirnov, A., Slutsker, I., et al. (2019). Advancements in the Aerosol Robotic Network (AERONET) Version 3 Database - Automated Near-Real-Time Quality Control Algorithm with Improved Cloud Screening for Sun Photometer Aerosol Optical Depth (AOD) Measurements. Atmos. Meas. Tech. 12, 169–209. doi:10.5194/amt-12-169-2019
Guan, K., Pan, M., Li, H., Wolf, A., Wu, J., Medvigy, D., et al. (2015). Photosynthetic Seasonality of Global Tropical Forests Constrained by Hydroclimate. Nat. Geosci 8, 284–289. doi:10.1038/ngeo2382
Hammer, M. S., van Donkelaar, A., Li, C., Lyapustin, A., Sayer, A. M., Hsu, N. C., et al. (2020). Global Estimates and Long-Term Trends of Fine Particulate Matter Concentrations (1998-2018). Environ. Sci. Technol. 54, 7879–7890. 2020-2018. doi:10.1021/acs.est.0c01764)
Hilker, T., Galvão, L. S., Aragão, L. E. O. C., de Moura, Y. M., do Amaral, C. H., Lyapustin, A. I., et al. (2017). Vegetation Chlorophyll Estimates in the Amazon from Multi-Angle MODIS Observations and Canopy Reflectance Model. Int. J. Appl. Earth Observation Geoinformation 58, 278–287. doi:10.1016/j.jag.2017.01.014
Hilker, T., Lyapustin, A. I., Hall, F. G., Myneni, R., Knyazikhin, Y., Wang, Y., et al. (2015). On the Measurability of Change in Amazon Vegetation from MODIS. Remote Sensing Environ. 166, 233–242. doi:10.1016/j.rse.2015.05.020
Hilker, T., Lyapustin, A. I., Tucker, C. J., Hall, F. G., Myneni, R. B., Wang, Y., et al. (2014). Vegetation Dynamics and Rainfall Sensitivity of the Amazon. Proc. Natl. Acad. Sci. USA 111 (45), 16041–16046. doi:10.1073/pnas.1404870111
Hilker, T., Lyapustin, A. I., Tucker, C. J., Sellers, P. J., Hall, F. G., and Wang, Y. (2012). Remote Sensing of Tropical Ecosystems: Atmospheric Correction and Cloud Masking Matter. Remote Sensing Environ. 127, 370–384. doi:10.1016/j.rse.2012.08.035
Holben, B. N., Eck, T. F., Slutsker, I., Tanré, D., Buis, J. P., Setzer, A., et al. (1998). AERONET-A Federated Instrument Network and Data Archive for Aerosol Characterization. Remote Sensing Environ. 66, 1–16. doi:10.1016/s0034-4257(98)00031-5
Huete, A., Didan, K., Miura, T., Rodriguez, E. P., Gao, X., and Ferreira, L. G. (2002). Overview of the Radiometric and Biophysical Performance of the MODIS Vegetation Indices. Remote Sensing Environ. 83, 195–213. doi:10.1016/S0034-4257(02)00096-2
Huete, A. R., Didan, K., Shimabukuro, Y. E., Ratana, P., Saleska, S. R., Hutyra, L. R., et al. (2006). Amazon Rainforests green-up with Sunlight in Dry Season. Geophys. Res. Lett. 33, L06405. doi:10.1029/2005GL025583
Jethva, H., Torres, O., and Yoshida, Y. (2019). Accuracy Assessment of MODIS Land Aerosol Optical Thickness Algorithms Using AERONET Measurements over North America. Atmos. Meas. Tech. 12, 4291–4307. doi:10.5194/amt-12-4291-2019
Lyapustin, A. I., Wang, Y., Laszlo, I., Hilker, T., G.Hall, F., Sellers, P. J., et al. (2012). Multi-angle Implementation of Atmospheric Correction for MODIS (MAIAC): 3. Atmospheric Correction. Remote Sensing Environ. 127, 385–393. doi:10.1016/j.rse.2012.09.002
Lyapustin, A., and Knyazikhin, Y. (2001). Green's Function Method for the Radiative Transfer Problem I Homogeneous Non-lambertian Surface. Appl. Opt. 40, 3495–3501. doi:10.1364/AO.40.003495
Lyapustin, A., Smirnov, A., Holben, B., Chin, M., Streets, D. G., Lu, Z., et al. (2011). Reduction of Aerosol Absorption in Beijing since 2007 from MODIS and AERONET. Geophys. Res. Lett. 38 (10), a–n. doi:10.1029/2011GL047306
Lyapustin, A., Wang, Y., Korkin, S., and Huang, D. (2018). MODIS Collection 6 MAIAC Algorithm. Atmos. Meas. Tech. 11, 5741–5765. doi:10.5194/amt-11-5741-2018
Lyapustin, A., Wang, Y., Xiong, X., Meister, G., Platnick, S., Levy, R., et al. (2014). Scientific Impact of MODIS C5 Calibration Degradation and C6+ Improvements. Atmos. Meas. Tech. 7, 4353–4365. doi:10.5194/amt-7-4353-2014
Martins, V. S., Lyapustin, A., Carvalho, L. A. S., Barbosa, C. C. F., and Novo, E. M. L. M. (2017). Validation of High‐resolution MAIAC Aerosol Product over South America. J. Geophys. Res. Atmos. 122, 7537–7559. doi:10.1002/2016JD026301
Martins, V. S., Lyapustin, A., Wang, Y., Giles, D. M., Smirnov, A., Slutsker, I., et al. (2019). Global Validation of Columnar Water Vapor Derived from EOS MODIS-MAIAC Algorithm against the Ground-Based AERONET Observations. Atmos. Res. 225, 181–192. doi:10.1016/j.atmosres.2019.04.005
Mhawish, A., Banerjee, T., Sorek-Hamer, M., Lyapustin, A., Broday, D. M., and Chatfield, R. (2019). Comparison and Evaluation of MODIS Multi-Angle Implementation of Atmospheric Correction (MAIAC) Aerosol Product over South Asia. Remote Sensing Environ. 224, 12–28. doi:10.1016/j.rse.2019.01.033
Myneni, R. B., Hoffman, S., Knyazikhin, Y., Privette, J. L., Glassy, J., Tian, Y., et al. (2002). Global Products of Vegetation Leaf Area and Fraction Absorbed PAR from Year One of MODIS Data. Remote Sens. Environ. 83 (1-2), 214–231. doi:10.1016/S0034-4257(02)00074-3
Nepstad, D. C., De Carvalho, C. R., Davidson, E. A., Jipp, P. H., Lefebvre, P. A., Negreiros, G. H., et al. (1994). The Role of Deep Roots in the Hydrological and Carbon Cycles of Amazonian Forests and Pastures. Nature 372 (6507), 666–669. doi:10.1038/372666a0
Petri, C. A., Galvão, L. S., and Lyapustin, A. I. (2019). MODIS BRDF Effects over Brazilian Tropical Forests and Savannahs: A Comparative Analysis. Remote Sensing Lett. 10, 95–102. doi:10.1080/2150704x.2018.1526425
Ploton, P., Mortier, F., Réjou-Méchain, M., Barbier, N., Picard, N., Rossi, V., et al. (2020). Spatial Validation Reveals Poor Predictive Performance of Large-Scale Ecological Mapping Models. Nat. Commun. 11, 4540. doi:10.1038/s41467-020-18321-y
Saleska, S. R., Wu, J., Guan, K., Araujo, A. C., Huete, A., Nobre, A. D., et al. (2016). Dry-season Greening of Amazon Forests. Nature 531, E4–E5. doi:10.1038/nature16457
Samanta, A., Ganguly, S., Hashimoto, H., Devadiga, S., Vermote, E., Knyazikhin, Y., et al. (2010). Amazon Forests Did Not green-up during the 2005 Drought. Geophys. Res. Lett. 37, a–n. doi:10.1029/2009GL042154
Schaaf, C. B., Gao, F., Strahler, A. H., Lucht, W., Li, X., Tsang, T., et al. (2002). First Operational BRDF, Albedo Nadir Reflectance Products from MODIS. Remote Sensing Environ. 83, 135–148. doi:10.1016/S0034-4257(02)00091-3
Schutgens, N., Sayer, A. M., Heckel, A., Hsu, C., Jethva, H., de Leeuw, G., et al. (2020). An AeroCom-AeroSat Study: Intercomparison of Satellite AOD Datasets for Aerosol Model Evaluation. Atmos. Chem. Phys. 20, 12431–12457. doi:10.5194/acp-20-12431-2020
Sinyuk, A., Holben, B. N., Eck, T. F., Giles, D. M., Slutsker, I., Korkin, S., et al. (2020). The AERONET Version 3 Aerosol Retrieval Algorithm, Associated Uncertainties and Comparisons to Version 2. Atmos. Meas. Tech. 13, 3375–3411. doi:10.5194/amt-13-3375-2020
Streets, D. G., Fu, J. S., Jang, C. J., Hao, J., He, K., Tang, X., et al. (2007). Air Quality during the 2008 Beijing Olympic Games. Atmos. Environ. 41 (3), 480–492. doi:10.1016/j.atmosenv.2006.08.046
Tao, M., Wang, J., Li, R., Wang, L., Wang, L., Wang, Z., et al. (2019). Performance of MODIS High-Resolution MAIAC Aerosol Algorithm in China: Characterization and Limitation. Atmos. Environ. 213, 159–169. doi:10.1016/j.atmosenv.2019.06.004
Toller, G., Xiong, X., Sun, J., Wenny, B. N., Geng, X., Kuyper, J., et al. (20132013). Terra and Aqua Moderate-Resolution Imaging Spectroradiometer Collection 6 Level 1B Algorithm. J. Appl. Remote Sens 7, 073557. doi:10.1117/1.JRS.7.073557
Vermote, E. F., and Kotchenova, S. (2008). Atmospheric Correction for the Monitoring of Land Surfaces. J. Geophys. Res. 113, D23S901–12. doi:10.1029/2007JD009662
Wang, Y., Lyapustin, A. I., Privette, J. L., Cook, R. B., SanthanaVannan, S. K., Vermote, E. F., et al. (2010). Assessment of Biases in MODIS Surface Reflectance Due to Lambertian Approximation. Remote Sensing Environ. 114, 2791–2801. doi:10.1016/j.rse.2010.06.013
Wei, J., Li, Z., Lyapustin, A., Sun, L., Peng, Y., Xue, W., et al. (2021). Reconstructing 1-Km-Resolution High-Quality PM2.5 Data Records from 2000 to 2018 in China: Spatiotemporal Variations and Policy Implications. Remote Sensing Environ. 252, 112136. doi:10.1016/j.rse.2020.112136
Wu, J., Kobayashi, H., Stark, S. C., Meng, R., Guan, K., Tran, N. N., et al. (2018). Biological Processes Dominate Seasonality of Remotely Sensed Canopy Greenness in an Amazon evergreen forest. New Phytol. 217, 1507–1520. doi:10.1111/nph.14939
Xu, L., Samanta, A., Costa, M. H., Ganguly, S., Nemani, R. R., and Myneni, R. B. (2011). Widespread Decline in Greenness of Amazonian Vegetation Due to the 2010 Drought. Geophys. Res. Lett. 38, a–n. doi:10.1029/2011GL046824
Keywords: MAIAC, surface reflectance, MOD09, MCD19A1, lambertian
Citation: Lyapustin A, Zhao F and Wang Y (2021) A Comparison of Multi-Angle Implementation of Atmospheric Correction and MOD09 Daily Surface Reflectance Products From MODIS. Front. Remote Sens. 2:712093. doi: 10.3389/frsen.2021.712093
Received: 19 May 2021; Accepted: 17 November 2021;
Published: 10 December 2021.
Edited by:
Pavel Lytvynov, Generalized Retrieval of Atmosphere and Surface Properties (GRASP), FranceReviewed by:
Yves Govaerts, Rayference, BelgiumWeile Wang, National Aeronautics and Space Administration (NASA), United States
Copyright © 2021 Lyapustin, Zhao and Wang. This is an open-access article distributed under the terms of the Creative Commons Attribution License (CC BY). The use, distribution or reproduction in other forums is permitted, provided the original author(s) and the copyright owner(s) are credited and that the original publication in this journal is cited, in accordance with accepted academic practice. No use, distribution or reproduction is permitted which does not comply with these terms.
*Correspondence: Alexei Lyapustin, QWxleGVpLkkuTHlhcHVzdGluQG5hc2EuZ292