 Grant E. Gunn
 Benjamin M. Jones
 Rodrigo C. Rangel
95% of researchers rate our articles as excellent or good
Learn more about the work of our research integrity team to safeguard the quality of each article we publish.
Find out more
ORIGINAL RESEARCH article
Front. Remote Sens. , 14 July 2021
Sec. Agro-Environmental Remote Sensing
Volume 2 - 2021 | https://doi.org/10.3389/frsen.2021.675846
This article is part of the Research Topic Innovation and Applications of UAV Remote Sensing in Cryospheric Systems View all 8 articles
The presence and thickness of snow overlying lake ice affects both the timing of melt and ice-free conditions, can contribute to overall ice thickness through its insulative capacity, and fosters the development of variable ice types. The use of UAVs to retrieve snow depths with high spatial resolution is necessary for the next generation of ultra-fine hydrological models, as the direct contribution of water from snow on lake ice is unknown. Such information is critical to the understanding of the physical processes of snow redistribution and capture in catchments on small lakes in the Arctic, which has been historically estimated from its relationship to terrestrial snowpack properties. In this study, we use a quad-copter UAV and SfM principles to retrieve and map snow depth at the winter maximum at high resolution over a the freshwater West Twin Lake on the Arctic Coastal Plain of northern Alaska. The accuracy of the snow depth retrievals is assessed using in-situ observations (n = 1,044), applying corrections to account for the freeboard of floating ice. The average snow depth from in-situ observations was used calculate a correction factor based on the freeboard of the ice to retrieve snow depth from UAV acquisitions (RMSE = 0.06 and 0.07 m for two transects on the lake. The retrieved snow depth map exhibits drift structures that have height deviations with a root mean square (RMS) of 0.08 m (correlation length = 13.8 m) for a transect on the west side of the lake, and an RMS of 0.07 m (correlation length = 18.7 m) on the east. Snow drifts present on the lake also correspond to previous investigations regarding the variability of snow on lakes, with a periodicity (separation) of 20 and 16 m for the west and east side of the lake, respectively. This study represents the first retrieval of snow depth on a frozen lake surface from a UAV using photogrammetry, and promotes the potential for high-resolution snow depth retrieval on small ponds and lakes that comprise a significant portion of landcover in Arctic environments.
The presence and thickness of snow overlying lake ice affects both the timing of melt and ice-free conditions. The albedo of thick snow reduces the insolation of the water as it reflects incoming solar radiation, delaying the timing of ice-off (Jensen et al., 2007; Kouraev et al., 2007; Brown and Duguay, 2010). In the absence of the insulative capacity of snow, ice growth also increases, resulting in later ice off (Kouraev et al., 2007). Snow acts as an insulator to prevent heat loss from the lake to the atmosphere, which reduces bottom ice growth rates (Brown and Duguay, 2010). However, snow can contribute to overall ice thickness through the development of snow ice (Jeffries et al., 2005). In the event that slushing events occur by water seeping up through cracks in the ice, or by the weight of the snow depressing the ice cover below the hydrostatic water level (which causes flooding of the ice surface from the shoreline).
The use of UAVs to retrieve snow depths with high spatial resolution is necessary for the next generation of ultra-fine hydrological models (Clark et al., 2017; Marsh et al., 2020; Parr et al., 2020). These models utilize snow depths to understand water fluxes into and within watersheds, however the direct contribution of water from snow on lake ice is difficult to accurately simulate due to the variability of snow cover on lakes compared to land. The direct measurement of snow depth on freshwater ice from remote sensing observations has not been successful because of the complex physical properties of the snow and ice from the perspective of the sensor. The retrieval of snow properties on freshwater lakes using remote sensing technologies has historically been limited to the observation of the presence or absence of snow, with very limited success in quantifying the influence of snow-on observations. When observing backscatter magnitudes, a drop in overall backscatter has been observed for high frequencies (i.e., Ku-band, 1.74 cm) when removing dense, shallow snow from the ice surface (Gunn et al., 2015a). However, no statistical models for direct retrieval of snow properties from backscatter have been realized operationally, with low cost sensors generally geared toward retrieving ice thickness (Pomerleau et al., 2020).
Methods for snow depth retrievals over sea ice typically utilize LiDAR (ICESat, ICESat-2) and microwave altimetry (Cryosat-2) to observe the height of the air-snow and snow-ice interface relative to a reference ellipsoid, respectively (Kwok and Kacimi, 2018). The limiting factor for applying this method to lake ice is twofold; first, the use of microwave altimetry to retrieve the height of the snow-ice interface relies on a unique reflection from the surface. The higher brine concentration within sea ice, and subsequently higher contrast in permittivity results in a much more defined return signal than from freshwater ice, which transmits much of the incoming signal to reflect off of the underlying ice-water interface. Secondly, the spatial resolution of microwave altimetry data (1.65 x 10 km for Cryosat-2) is much coarser than is required for the observation of the majority of lakes in the Arctic; high densities of small ponds that can comprise up to 40% of the landscape in coastal plains and lowlands. The average size of the approximate 710,000 lakes in latitudes greater than 60° north is 0.96 km2, much smaller than a single Cryosat-2 pixel (Messager et al., 2016).
UAVs can be outfitted with multispectral sensors or LiDAR scanners, however the most common sensors onboard UAVs are high resolution digital cameras that acquire observations in true color wavelengths from 400–700 nm. UAVs observing the visible light range are uniquely suited to acquire observations from the top of the snowpack as dry snow reflects nearly all incoming visible wavelengths, with values of up to 97% in boreal environments (Hannula and Pulliainen, 2019). The snowpack on Arctic lakes also presents the ideal scenario for high reflectance and contrast for extractable features, as the open environment allows for the formation of snow drifts and strastugi that are typically better developed than on land (the result of wind-induced snow redistribution and erosion) (Sturm and Liston, 2003). The erosion processes also cause the snow grains to become rounded and relatively small near the snow-air interface, resulting in greater reflection efficiency (Dozier, 1984; Green et al., 2002).
There are many benefits for the use of UAVs to acquire passive optical observations in the Arctic. For instance, the spatial resolution of stitched imagery can be extremely high (up to 1 cm) and presents the opportunity to observe processes at scales previously unseen by airborne or satellite observations (Harder et al., 2016; Fernandes et al., 2018). UAVs also fly much lower than cloud cover, allowing observations to be acquired regardless of the presence of clouds, although data acquisition during flat light conditions when the surface is snow covered compromises data quality. Finally, the flexibility of flying UAVs allows for the ability to obtain repeat measurements to obtain an understanding of snow and ice dynamics as long as technicians are in the field as weather conditions allow.
Studies that utilize UAVs to retrieve snow depth over glaciers and open natural environments typically report a root mean square error (RMSE) for retrievals of less than 0.3 m (Vander Jagt et al., 2015; De Michele et al., 2016; Gindraux et al., 2017; Avanzi et al., 2018; Harder et al., 2020; Walker et al., 2020). In vegetated areas, the obstruction caused by the canopy results in larger error estimates of snow depth of up to 0.5 m (Bühler et al., 2016; Harder et al., 2020). In open agricultural fields with little micro-topography the maximum uncertainty of snow depth retrievals using Structure from Motion (SfM) principles has been reported to range between 0.02 and 0.11 m, with high uncertainty values associated with melt onset (Fernandes et al., 2018).
UAVs have been utilized for a wide range of applications when monitoring ice, including lake ice phenology, ice jam on rivers (Alfredsen et al., 2018), ice sheet velocity (Chudley et al., 2019), and to monitor methane emissions (Lindgren et al., 2016; Schlobies et al., 2016; Lindgren et al., 2019). The direct observation of snow on ice requires a detailed understanding of the ice dynamics, including the variability in thickness and freeboard to quantify snow depth retrievals accurately, as sea ice features are a complex mix of first year ice, ridges, leads, and hummocky multi-year ice (Tan et al., 2020). In contrast to sea ice, ice on small lakes in the Arctic Coastal Plain (ACP) of northern Alaska is physically less complex because the lakes do not possess the tide, currents, and horizontal flow that affect sea ice development. Compared to other landcover types, the application of SfM to retrieve snow depth on lake ice may be most analogous to studies that have investigated open, relatively flat surfaces (agricultural fields) that are devoid of vegetation or topographical relief (Harder et al., 2016; Fernandes et al., 2018; Harder et al., 2020).
In this study, we use a quad-copter UAV and SfM principles to retrieve and map snow depth at the winter maximum at high resolution over a freshwater lake on the ACP of northern Alaska. Similar to retrievals over sea ice, the freeboard of the floating freshwater ice is accounted for using in-situ observations to improve the overall agreement of the SfM-derived snow depths. The accuracy of the snow depth retrievals is assessed using in-situ observations (n = 1,044). This study represents the first retrieval of snow depths on a frozen lake surface from a UAV using Structure from Motion that the authors are aware of. Study Site introduces the study site, with the data collection procedure and analysis methods presented in Methodology. The snow depth retrieval results and applicability of this method in the future are discussed in Methodology and Results, respectively. The results from this study are useful for developing better spatial representation of snow depth and its role in determining lake ice thickness in the Arctic.
UAV acquisitions and in-situ snow depth observations were collected on West Twin Lake, approximately 9 km southeast of Utqiaġvik (formerly Barrow) in the Barrow Peninsula, Alaska (156.492° W, 71.276° N) (Figure 1). West Twin Lake has a mean elevation of ∼2.2 m above sea level, covers an area of 1.5 km2 and a has mean depth of 1.6 m (Hinkel et al., 2010). The study site is situated in a region of shallow, elongated thermokarst lakes that comprise up to 40% of the coastal plain (Sellmann et al., 1975; Hinkel et al., 2005). The majority of lakes in this region are documented to annually freeze to the bed (Arp et al., 2011; Surdu et al., 2014; Engram et al., 2018), during the prolonged winter.
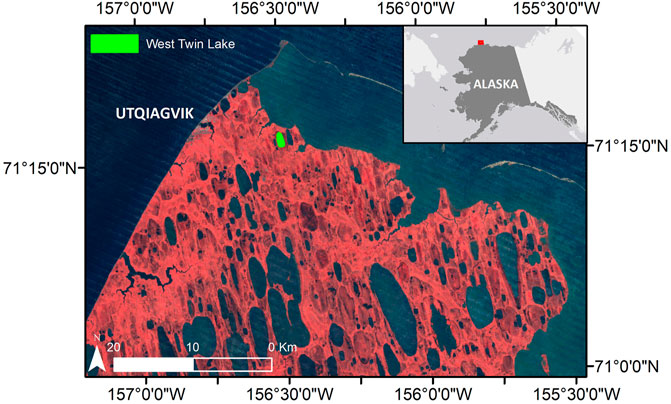
FIGURE 1. Location of the Study Site (West Twin Lake), situated east of Utqiaġvik, Alaska on the Arctic Coastal Plain.
The landscape of the region surrounding Utqiaġvik is typified by little topographic relief, with gentle undulations of low-lying tundra landscape and a polar marine climate with strong sustained wind and cold winter temperatures (Carson and Hussey, 1962; Surdu et al., 2014). The mean annual temperature in the most recent climate normal 1999–2019 is −10°C with a mean winter temperature (December–March) of −24.5°C. The mean annual precipitation is 127 mm (957 mm as snow) (Menne et al., 2012). The prevailing wind direction is generally from the northeast throughout the year with an average wind speed of 12.9 km/h.
In-situ observations of snow depth, density, grain size, and ice thickness were acquired over two, 100 m transects within the UAV acquisition footprint (Figure 2). Each transect had bulk snow density and ice thickness collected every 10 m, totaling 22 observations. Snow density was sampled using a federal snow core, providing a bulk measurement of both the wind slab and depth hoar layers. Ice thicknesses were sampled by drilling into the ice with a gas-powered auger, and measured using an avalanche probe with an attachment to hook on the ice bottom. Snow depths were collected using a ©SnowHydro Magnaprobe (Sturm et al., 2018) every 0.5 m along the transects. The magnaprobe consists of a metal rod probe with a sliding basket that records snow depth and the corresponding GPS location to a Campbell Scientific CR800 data logger. The horizontal precision of the coordinate is approximately +/−2.5 m with a vertical depth precision of 0.03 m. Snow depth was sampled on Transect 2 on either side of the transect line separated by 2 m, collecting a total of 226 observations. Snow depth sampled on Transect 1 had eleven measurements for every survey point (i.e., 0, 0.5, 1.0 m) extending 2.5 m perpendicular from the transect line, collecting a total of 818 observations.
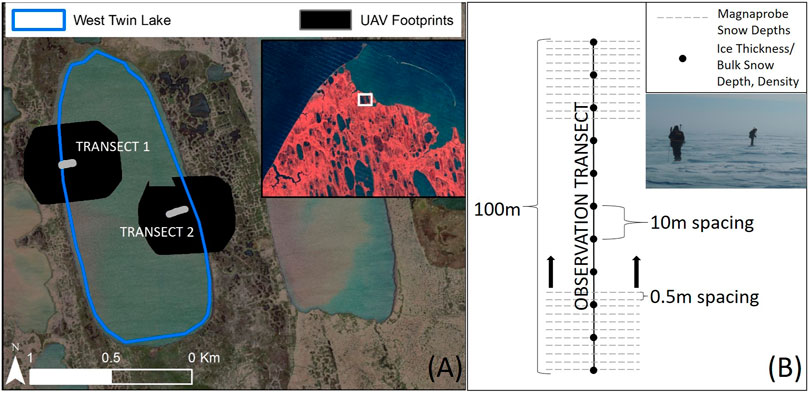
FIGURE 2. Sampling design on West Twin Lake highlighting the location of Transect 1 and 2 in relation to the UAV acquisitions (A). The collection strategy of snow properties on the transects is shown in (B), showing the location of snow depths sampled by magnaprobe (grey dashed line) and the location of bulk density and ice thickness observations (black dots).
Snow depth retrievals are calculated using two separate digital surface models (DSM), one from the UAV acquired at maximum snow depth in April 2019, and the other during the open water season from an airborne LiDAR collected in August 2018 by Quantum Spatial LLC for the United States Geological Survey (OCM Partners, 2021). The 2018 LiDAR was acquired according to QL1 standards with an aggregate nominal pulse density of > = 8.0 points per square meter. The data have a vertical accuracy of 0.04 m and was initially referenced to NAD83 Alaska Zone4 orthometric heights in feet using the Geoid12B model. The data were processed in Quick Terrain Modeler and converted to WGS84 UTM Zone 4N in ellipsoid heights to match the UAV data below. Due to slight windy conditions and turbid lake water on the day of LiDAR acquisition a number of water surface returns were evident in the water classified.las files. All water classified returns from West Twin Lake were extracted and the mean value for the lake surface (0.35 m in WGS84 ellipsoid height) was used to hydroflatten the lake surface prior to further analysis with the UAV snow surface DSM.
A DSM of the snow surface was generated from images acquired using a UAV over two 25 ha study areas on 16 April, 2019 using a Phantom 4 RTK UAV encompassing the in-situ survey transects. The area covering Transect 1 was imaged with 118 photos and the area covering Transect 2 was imaged with 116 photos. Prior to processing the images in Pix4d to create orthophotos and to derive a point cloud, each image location was post-processed using KLAU PPK software and the fixed NGS-CORS station located less than 10 km from the study sites. All images achieved an absolute XYZ accuracy +/−3 cm during post-processing and were registered to WGS84 UTM Zone 4N using the ellipsoid heights reference frame. Post-processed images were analyzed in Pix4D (version 4.3.33) to produce an orthophoto mosaic and a LiDAR-like densified point cloud that was further processed in Quick Terrain Modeler to produce a DSM. The initial resolution of the orthophoto was 0.035 m and of the DSM it was 0.05 m. The DSM was then resampled to a spatial resolution of 1 m to coincide with the spatial resolution of the summertime airborne LiDAR dataset used in the snow depth estimate calculations.
Weather during UAV flights was optimal and in-situ data collection (16/4/2019) with temperatures of −15°C, average wind speed of 11 km/h and no cloud cover. The sustained wind caused minimal blowing snow conditions, allowing the UAV acquisitions to observe the snow surface. Snow depths are derived by subtracting the height of the water surface
where
To assess the variation in ice thickness as a function of snow depth, we conducted a ground penetrating radar (GPR) measurement on Transect 1. We used 800 MHz frequency shielded antennas with a ProEx control unit (MALÅ Geoscience, MALÅ, Sweden) and a Garmin GPS 18. The antennas were arranged in a common-offset configuration with a fixed transmitter-receiver separation of 0.14 m, and each GPR trace was acquired at 1 s spacing with the respective GPS coordinates. The equipment was left in a sled and towed by a snowmachine. The raw GPR data were processed with ReflexW software (Sandmeier, 2020) as follows: 1) time to distance along transect conversion using the GPS coordinates, resulting in a trace spacing of 0.5 m (n = 212), 2) low frequency noise removal (dewow), 3) move start time to airwave arrival, and 4) two-way travel time (TWT) cut to 25 ns. To determine the TWT within the ice layer, we manually picked the snow-ice and the ice-water interface reflections. The following equation to estimate the ice thickness (d):
where
The most likely source of error in snow depth retrievals on floating ice is the freeboard of the ice, which is the distance between the ice surface and the hydrostatic water level caused by the lower density of ice compared to water. To retrieve snow depths on floating lake ice, the freeboard needs to be quantified and a correction factor needs to be applied, or the snow depth retrievals will likely have a positive bias. The relationship between ice thickness and freeboard have been established for sea ice (Nandan et al., 2017), shown in Eq. 2,
where
Rearranging for
The freeboard of the floating ice at the location of each snow depth observation is derived using two different methods to test the agreement of the retrievals. In the first method, the freeboard is calculated using a single averaged value of ice thickness, snow depth, and bulk density for the entire transect, which provides a single average freeboard correction factor for snow depth retrievals (Freeboard1). In the second method the freeboard is calculated using averaged values of ice thickness and bulk density and the in-situ snow depth at each measurement location, resulting in a unique freeboard value for each observation (Freeboard2) (Table 1).

TABLE 1. Freeboard calculation for the Transects on West Twin Lake, with variable notations from Eq. 2, and Eqs. 3. Freeboard1 is a single average freeboard correction factor based on the average ice thickness, snow depth and bulk density for the entire transect. Freeboard2 is a range of correction factors, calculating freeboard based on the average ice thickness and bulk density for the transect but using the local snow depth in the calculation, which produces a range of freeboard estimates.
The root mean square (RMS) of height deviations of the snow depth is calculated from the three dimensional plane fitted to the UAV-derived snow depth using the methodology detailed in Martinez-Agirre et al. (2020). An additional measure of the two-dimensional local variability (n−) is provided through the calculation of variograms constructed using the Scikit GStat library Variography (Mälicke and Schneider, 2021) using 15,000 randomly sampled points from the UAV-derived acquisitions for the west and east portions of the lake.
The distribution and periodicity of snow depth and drifts is of particular interest for studies interested in snow redistribution on the multitude of ponds and lakes on the ACP. The roughness and periodicity of snow drifts on ice has been previously quantified using power spectral density (Sturm and Liston, 2003), and more recently using the metric
Snow depth maps produced from SfM principles for the western and eastern portion of West Twin Lake are shown in Figure 3, highlighting the relative spatial variability of snow depth on the ice as a result of snow drift formation. Snow depth at the shoreline is deeper than on the lake, as expected, as shoreline vegetation traps blowing snow and the lake ice surface that lacks of vegetation has a limited ability to trap blowing snow. Prior to correcting for ice freeboard, the average snow depth on the lake is 66% of snow on land, consistent with Sturm and Liston (2003).

FIGURE 3. Snow depth derived from UAV DSM prior to correction for ice freeboard for Transect 1 (A) and Transect 2 (B). The development of snow drifts are visible oriented in the prevailing wind direction (east to west), as well as the difference in snow depth on lakes compared to land.
The GPR observations (Figure 4) confirm that the variability in ice thickness is sufficient to result in localized freeboard that may impact snow depth retrievals. Within a span of 10 m (between 60 and 70 m distance), the ice thickness is shown to change up to 0.36 m (1.43 at 67 m distance and 1.07 at 60 m distance). Figure 4 also shows the UAV-derived snow depth with freeboard corrections applied using the Freeboard2 correction factor. Deeper (and therefore heavier) snow serves to locally depress the underlying ice column, with the elevation of the ice surface ranging between up to 0.3 m with an interquartile range of 0.06 m. The corrected UAV-derived snow depth and elevation of the ice surface exhibit a negative correlation (R2 = 0.54, p = 0.00), supporting the basis for freeboard correction across the UAV acquisitions.
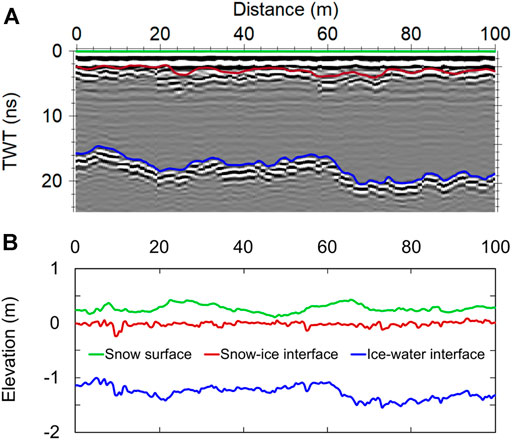
FIGURE 4. GPR observations of the air-snow, snow-ice and ice-water interfaces at Transect 1 represented in two-way-traveltime (A) and relative elevation with the average ice surface located at 0 m (B). Local topography at the ice-snow interface is due to the formation of surface ice types, and depression of the ice by the weight of the snowpack. Note the roughness at the ice-water interface exhibits variability up to 0.36 m across a range of 10 m.
In similar studies that utilize snow depths observed using Magnaprobes to validate UAV-derived snow depths a simple extraction of the UAV snow depth (UAVSD) raster by the point location yielded co-registration errors, as the horizontal accuracy of the Magnaprobe GPS (approximately 2.5 m) is much lower than the UAV (< 0.03 m) (Nolan et al., 2015; Walker et al., 2020). Therefore, to reduce the potential inclusion of erroneous snow depth information, Magnaprobe snow depths (MagnaprobeSD) are validated against the average snow depth extracted from a 5 m buffer surrounding each in-situ observation, which would approximate the spatial accuracy of the GPS location. A 1:1 plot of UAVSD compared to MagnaprobeSD is provided for Transects 1 and 2 in Figure 5. Without correcting for the ice freeboard, the R2 for UAVSD is 0.72 and 0.80 for Transects 1 and 2, respectively. Despite the high correlation values, there is a consistent positive bias in the UAVSD with a Mean Bias Error (MBE) of 0.081 and 0.069 m in Transects 1 and 2, respectively. Positive MBE values for both transects is consistent with the hypothesis that the snow depth would be overestimated because of the freeboard of floating ice. The RMSE for both transects is within the reported error for studies observing UAVSD on terrestrial sites (Walker et al., 2020), however the highly positive MBE indicates that the bias from freeboard can be addressed through the derived freeboard height.
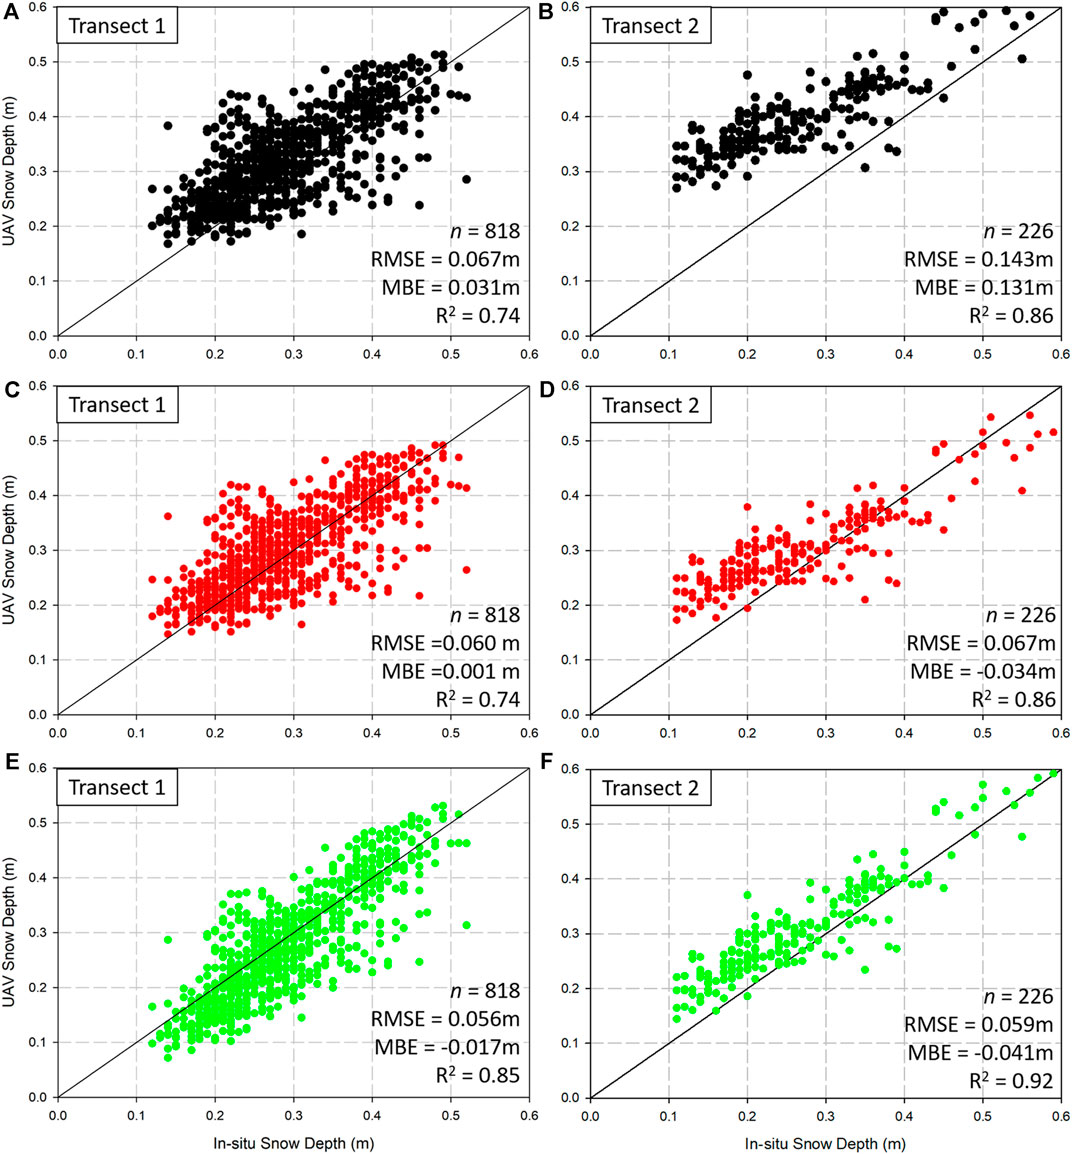
FIGURE 5. UAVSD retrievals compared to MagnaprobeSD observations when freeboard correction factor is not applied [panels (A,B)], with Freeboard1 average correction factor applied [panels (C,D)] and with Freeboard2 correction factor per MagnaprobeSD location [panels (E,F)].
When applying the calculated Freeboard1 correction factor of 0.088 and 0.097 m for Transects 1 and 2 respectively, the RMSE and MBE drops considerably as the spread of UAVSD retrievals more closely approximates the 1:1 relationship, as shown in Table 2. The MBE is almost 0 for both transects, which indicates that the overestimation of snow depths nearly equals the underestimation. When combining the observations at both transects (n = 1,044), the RMSE and MBE is 0.064 and −0.011 m for Freeboard1, and 0.056 and 0.006 m for Freeboard2, respectively.
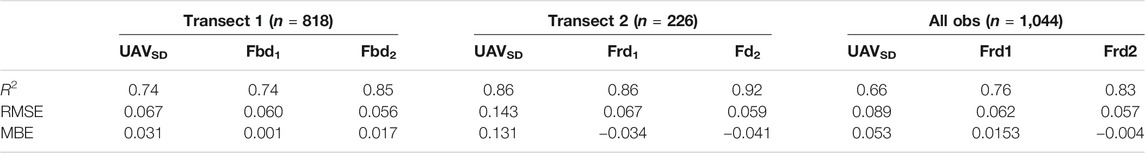
TABLE 2. Improvements of UAVSD when applying Freeboard1 and Freeboard2 correction factors. All R2 coefficients are statistically significant at the 99%.
Figure 6 shows the distribution of residual errors across the range of MagnaprobeSD observations, which visualizes the source of the errors summarized by the RMSE and MBE. When no freeboard correction is applied, the residuals exhibit high overestimation of MagnaprobeSD in both transects, which is reduced when the average freeboard correction factor (Freeboard1) is applied (Figure 6, panels Figures 6C,D). For relatively shallow snow (Q1—Q2) on Transect 1 (Transect 2) the residuals using Freeboard1 are overestimated by a maximum of 0.22 m (0.16 m) within a range of −0.07 and 0.22 m (0.02 and 0.16 m). In areas of deep snow (Q3—Q4) on Transect 1 (Transect 2), the residuals are underestimated by a minimum of −0.15 (−0.15 m), within a range of −0.15 to 0.14 m (−0.15 and 0.06 m). The MBE for Freeboard1 snow depths is nearly zero, however the residuals indicate that the shallow and deep snowpacks are over and under-predicted, respectively.
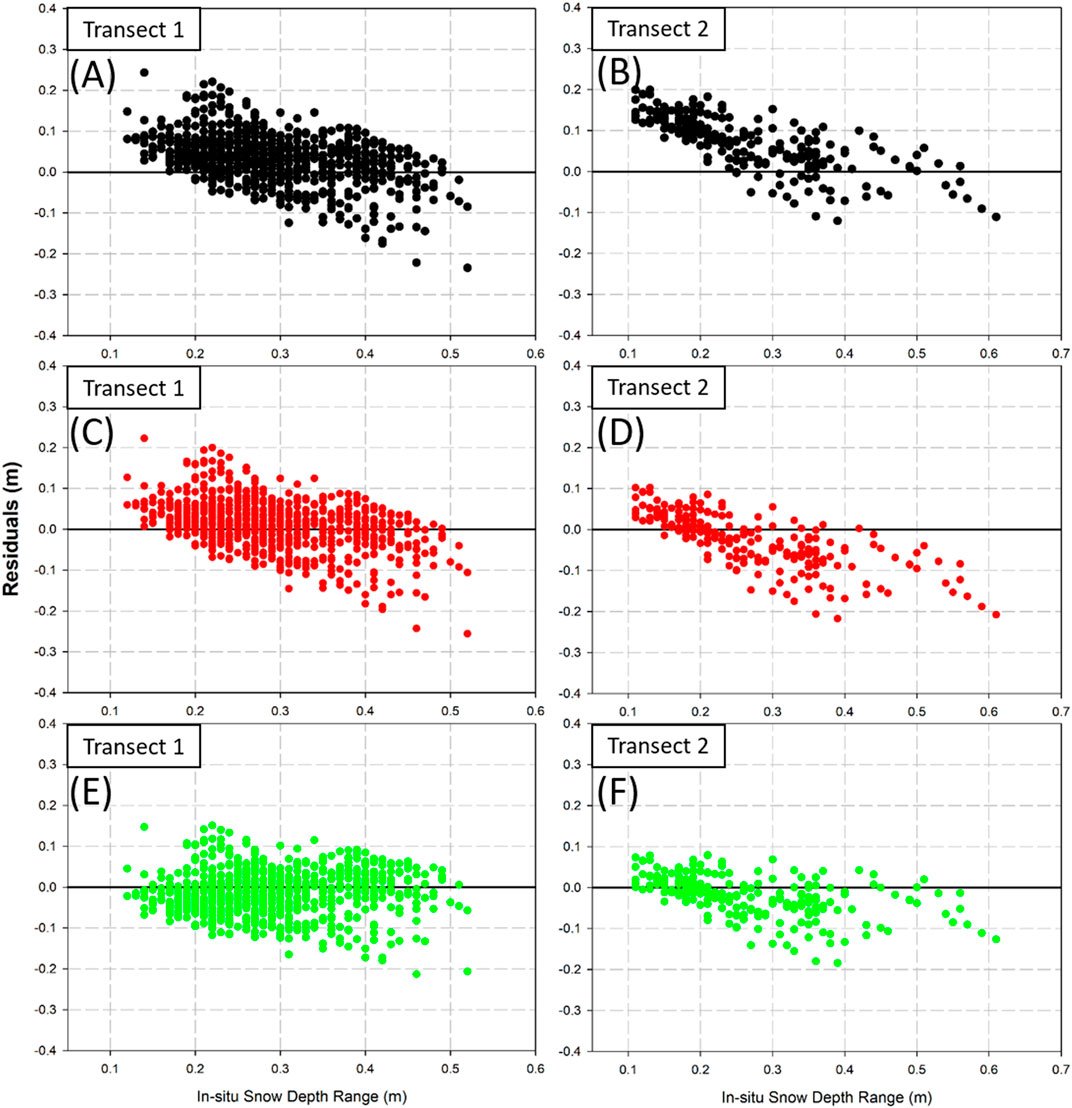
FIGURE 6. Residual errors for UAVSD across the range of MagnaprobeSD observations for no freeboard correction applied [panels (A,B)], average freeboard correction [Freeboard1, panels (C, D)], and freeboard correction per MagnaprobeSD location [Freeboard2, panels (E,F)].
In areas of shallow snow, the combination of two physical processes result in overestimation using the UAVSD and Freeboard1 methods: 1) the shallow snow does not possess the weight to depress the ice, and 2) the lower insulative capacity of shallow snow results in thicker ice formation and therefore greater buoyancy. Both of these factors cause the freeboard to be higher than the average observed, resulting in overestimation of shallow MagnaprobeSD. The situation is opposite for deep snow, which is underestimated when applying the Freeboard1 correction factor. The weight of relatively deep snow depresses floating ice, and has a higher insulative capacity, resulting in thinner ice over the span of the winter season, and shallower freeboard.
The application of the Freeboard2 correction factor reduces the residual errors in shallow and deep snow depths with the incorporation of individual freeboard calculations as opposed to a transect-wide average, reducing the error range (Table 3). Histograms of the distribution of residuals are shown in Figure 7. The majority of large residual errors (negative or positive) occurred for extremely shallow or deep snow depths for both the UAVSD and Freeboard1 scenarios and less-so for the Freeboard2 correction, which is expected as a function of applying an average correction factor. When applying the Freeboard2 correction, the mean residual error for both transects are reduced toward zero (Figure 7) with 50% of corrected snow depth retrievals between −0.02 and 0.06 m for Transect 1 and between 0.04 and 0.08 m for Transect 2. Overall, compared to all in-situ observations 90% of snow depth retrievals are within −0.08–0.11 m using Freeboard1, and −0.12 to 0.10 m using Freeboard2. with an RMSE of 0.062 m and 0.057, respectively.

TABLE 3. Distribution of Residual Errors of derived snow depth when applying Freeboard1 and Freeboard2 correction factors, with values representing the breakpoint between quartiles (Q). Freeboard2 exhibits the narrowest range of errors with Q3 consistently centered at 0 m error.
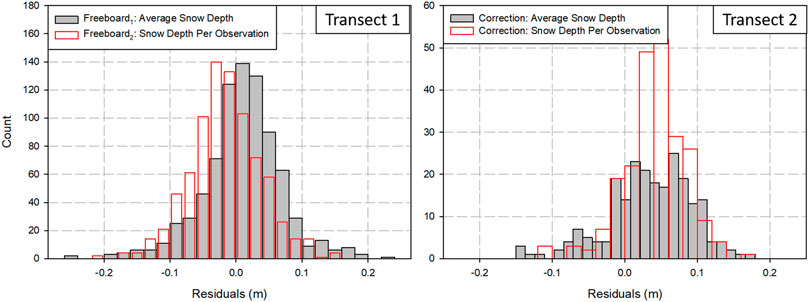
FIGURE 7. Histogram of residual errors when applying Freeboard1 and Freeboard2 correction factors. In both transects the application of Freeboard2 substantially dropped large residuals toward a median error of 0 m.
While the Freeboard2 correction factor provides the most accurate snow depth retrieval, it requires a distribution of snow depth measurements attached to specific locations, which is difficult to generate when correcting for an entire UAVSD scene. Therefore, the Freeboard1 correction factor is applied to the UAVSD scenes for the west and east portion of West Twin Lake, using snow and ice averages derived from Transects 1 and 2, (Figure 8). The distribution of deep snow dunes with intermittent regions of very shallow snow is characteristic of snow distribution on thermokarst lakes on the ACP as discussed in Sturm and Liston (2003).
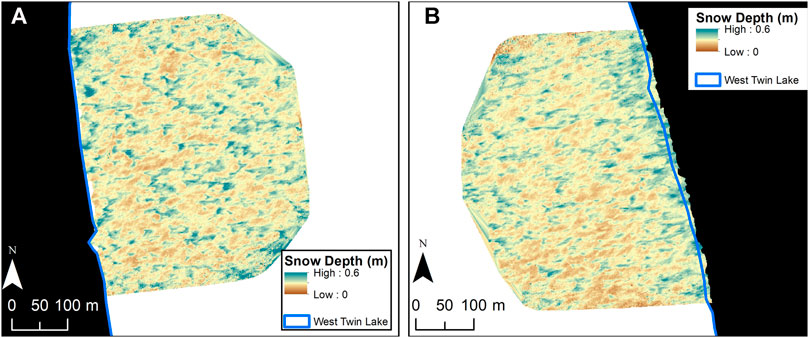
FIGURE 8. Snow depth on the eastern (A) and western (B) portion of West Twin Lake derived by UAV SfM principles with the Freeboard1 correction factor (average observed snow depth, density, and ice thickness).
Variability in retrieved snow depth is clustered regionally in drifts, where differences of up to 0.5 m can occur within less than 10 m. The local-scale variability of snow depths and drifts is supported by literature where the length scale was measured through multiple in-situ transects to be on the order of tens of meters for freshwater lake ice on the ACP (Sturm and Liston, 2003), and sea ice (Iacozza and Barber, 1999; Sturm et al., 2002). The west region of the lake (Transect 1) exhibits RMS height deviations of 0.08 m with a correlation length of 13.8 m, while the east region (Transect 2) has an RMS of 0.07 m with a correlation length of 18.7 m, consistent with roughness and correlation lengths obtained from previous in-situ sampling on transects.
The variograms generated for Transect 1 and 2 exhibit a range of 18.7 and 17.5 m after monotonic increases in semivariance, respectively (Figure 9). This indicates that despite the lack of significant topographical features such as surface rafts or ridges, there is prominent local-scale heterogeneity of snow depth due to wind-redistributed drift development in-line with the 5–20 m periodicity of structures noticed on lakes in the ACP in Sturm and Liston, (2003).
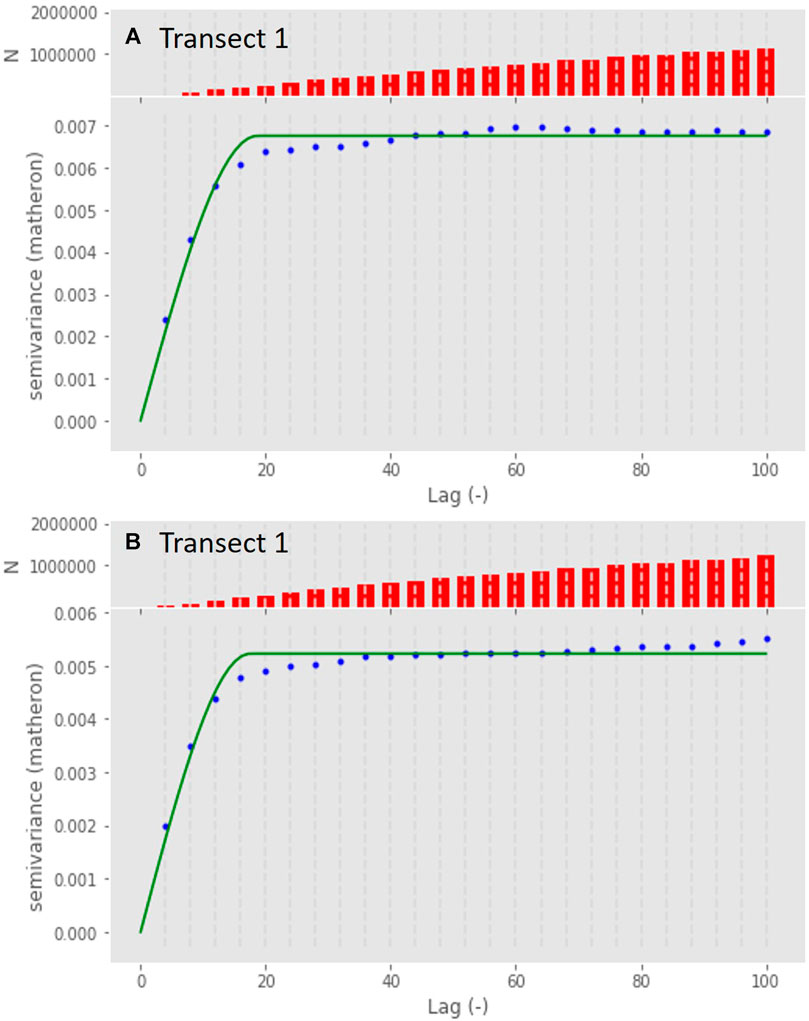
FIGURE 9. Variograms for snow depths on the west (Transect 1) (A) and east (Transect 2) (B) regions of West Twin Lake derived from UAV retrievals. Histograms show the cumulative number of observations considered in the lag distances, shown in meters.
Mean values of
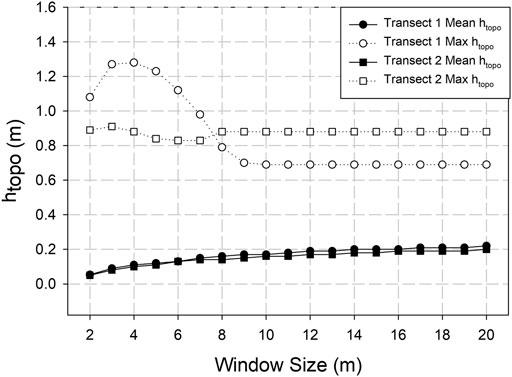
FIGURE 10. Value of htopo for the east (Transect-1) and west (Transect-2) portions of West Twin Lake relative to the size of moving window applied to the snow depth raster. The values of htopo become stable at window sizes of 10 x 10 m for Transect 1 and 8 x 8 m for Transect 2, indicating the snow drift periodicity to be between 16 and 20 m on lake ice.
The retrieval of snow depth over lakes using both Freeboard1 and Freeboard2 correction factors presents similar, and in some cases better accuracies compared to studies that use SfM from UAV acquisitions, that exhibit an overall RMSE of less than 0.3 m (Buler et al., 2017; Nolan et al., 2015; Walker et al., 2020). This study identifies the need to at minimum correct for the freeboard of floating ice using average snow depth, density and ice thickness expected on the lake. While SfM has been used extensively for retrievals of terrestrial snowpacks at the plot (Fernandes et al., 2018) and landscape scales (Walker et al., 2020), this study demonstrates the utility of UAVs to retrieve such data over a small floating lake ice that commonly presents a shallower snowpack.
Using the Freeboard1 correction factor, autocorrelation function indicates that snow depths on the lake become decorrelated at approximately 15 m for Transect1 and 19 m for Transect 2. The autocorrelation for the samples on West Twin Lake are similar in magnitude to the wavelength of snow drift formations (5–20 m) on lakes south of Prudhoe Bay on the Arctic Coastal Plain (Holmgren et al., 1998; Sturm and Liston, 2003). The ability to resolve individual snow drifts presents the opportunity to provide validation and potential improvements to the estimation of tundra meltwater into basins (Parr et al., 2020; Westergaard-Nielsen et al., 2020) or validation for high-resolution snow redistribution models (Li et al., 2018).
The methods presented in this study that the use UAVs for snow depth retrieval on lakes does not preclude the requirement for in-situ observations. Due to the variable nature of snowfall and redistribution, the operational functionality of snow depth retrievals relies on a priori information on the snowpack and ice thickness to produce estimates of ice freeboard. This information may not be readily available, and future research is needed to test the use of modeled snow depth/ice thickness on snow depth retrieval from UAV acquisitions. Snow depths on lakes are typically around 40% less than snow depths at terrestrial sites, and ice thickness can be modeled by thermodynamic ice models forced using weather observations from long-term fixed stations (Duguay and Lafleur, 2003; Gunn et al., 2015b).
Snow depth retrievals also rely on the capability of calculating the freeboard of floating ice. In the ACP it is common for a portion of, or a whole lake to freeze to the bed during the winter season. This study did not investigate the influence of regions of grounded ice on snow depth retrievals, but should be a consideration when scaling up retrievals to a regional scale.
While the large majority of residuals for both Freeboard1 and Freeboard2 exhibit general agreement with 60% of snow depth retrievals within −0.06 and 0.04 m, positive and negative outliers up to 0.2 and −0.3 m are persistent. The derived snow depths using the Freeboard1 correction factor that are > 0.1 m compared to in-situ observations (10 and 14% of observations on Transects 1 and 2, respectively) are shown in Figure 11. The threshold of 0.1 m is chosen to be reflective of the typical snow depth retrieval error presented in terrestrial UAV studies (Vander Jagt et al., 2015; Walker et al., 2020; Jacobs et al., 2021).
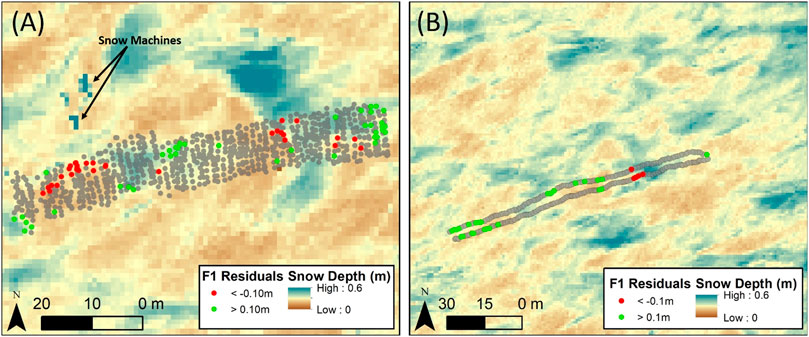
FIGURE 11. Spatial distribution of residual errors greater than 0.1 m using the Freeboard1 correction factor. Note that while the errors are spatially clustered, the sample of in-situ snow depths do not deviate statistically from the distribution. There are two block-like structures that exhibit extremely high snow depths, which are the snow machines adjacent to Transect 1.
The distribution of retrievals with residuals above the threshold of 0.1 m are spatially clustered (Moran’s I z-score = 25.17, p = 0.000), however the sample of in-situ snow depths do not deviate statistically from the distribution. For example, overestimation and underestimation of snow depth > 0.1 m is spatially coincident to shallow and deep snowpack as observed in-situ, respectively. However, in the shallow and deep regions of observed snow depths, the extreme residuals only account for 3.6% of shallow snow and 9% of deep snow observations overall. Therefore, the UAV SfM snow depth retrieval using the Freeboard1 correction factor produces retrievals within an accuracy of < 0.1 m, but not in those specific instances, indicating that an additional physical process could be increasing or decreasing the ice surface heights and introducing error. Possible deformation of the ice surface which increases the surface height of the ice includes ridging or rafting, however these features are less common on small lakes on the ACP. More likely sources of error could be caused by the formation of surface ice types (snow ice, grey ice) caused by flooding and refreezing of the snowpack overlying the ice surface.
The use of an average ice thickness in Freeboard1 calculations is likely to have reduced the accuracy in the regions of highest and lowest snow depth observations. In the region of shallow snow the ice is thicker than the average of the in-situ observations, which would result in a higher freeboard, increasing the retrieved snow depth, and vice versa for areas of deep snow. Therefore, in areas of shallow snow the UAV-derived snow depths present a positive bias toward deeper snowpacks, and in areas of deep snow the UAV-derived snow depths have a negative bias, presenting shallower snow than observed in-situ. To address this limitation, a detailed survey of ice thickness would be required to construct a DEM, which would allow for more accurate dynamic freeboard calculations for each snow depth. The development of ice thickness for small ponds and lakes has not yet been derived from remote sensing observations, and would likely require the collection of a grid of ice observations using in-situ ground penetrating radar (GPR).
The objective requirement for shallow snow depth retrievals in the Arctic from satellites within the Integrated Global Observing Strategy (IGOS) Cryosphere Theme Report is 0.06 m, with a threshold requirement of 0.1 m (Integrated Global Observing Strategy, 2007). The results presented here indicate that UAV-derived snow depth retrievals are within the requirements from the IGOS when corrected for freeboard considerations using lake-wide snow density and ice thickness averages.
This is the first study to present the utility of Structure from Motion from UAV aerial acquisitions to retrieve snow depth over floating freshwater lake ice in the Arctic. When accounting for the freeboard of floating ice on a per-measurement basis, the UAV-derived snow depths retrievals exceed accuracies for similar studies over land, with relatively small error margins of RMSE of 0.05 m and a slight overall bias of 0.04 m. However it is unlikely that technicians would have access to dense in-situ snow depth observations (n = 1,044) to perform this correction, so a nominal average snow depth could be used to apply a correction factor to all snow depth retrievals on a lake, with the knowledge that shallow and deep snow may exhibit higher errors (RMSE = 0.06 and 0.07 m for Transects 1 and 2, respectively).
The high resolution of UAV-derived snow depth maps afford the potential to observe small-scale variations in snow depth across a lake, observing and quantifying the development and periodicity of snow drifts. Such information is critical to the understanding of the physical processes of snow redistribution and capture in catchments on small lakes in the Arctic, which has been historically estimated from its relationship to terrestrial snowpack properties. Additionally, the possibility to retrieve high-resolution snow depth and distribution data on lakes presents an opportunity to include direct meltwater inputs as a component of ultra-fine resolution hydrologic models, which has not previously been considered. Repeat measurements from UAVs can help further validate satellite-based measurements of planned surface mapping missions such as the NASA/ISRO SAR (NISAR) planned for launch in 2022.
The raw data supporting the conclusions of this article will be made available by request to the authors.
GG is responsible for project conceptualization, field data collection, analysis and initial drafting and revision of article. BJ is responsible for field data collection, processing of UAV imagery and development of Digital Surface Models. He contributed to article revision and further data analysis. RR is responsible for field data collection, processing of ground penetrating radar to derive ice thickness and the relative elevation of the snow-ice and ice-water interfaces. He contributed to article revision and further data analysis.
Funding for this project included start-up funds from Michigan State University. BJ was supported by United States National Science Foundation award number OPP-1806213.
The authors declare that the research was conducted in the absence of any commercial or financial relationships that could be construed as a potential conflict of interest.
The authors wish to acknowledge field assistants Kelsey Nyland and Sam Arcand in the collection of ice thickness and snow depth observations in conjunction with GG research campaign surrounding Utqiagvik, Alaska. Field work, logistics for renting snow machines and miscellaneous gear was supported by the Alaska Bureau of Land Management.
Alfredsen, K., Haas, C., Tuthan, J., and Zinke, P. (2018). Brief Communication: Mapping River Ice Using Drones and Structure from Motion. The Cryosphere 12, 1–7. doi:10.5194/tc-12-627-2018
Arp, C. D., Jones, B. M., Urban, F. E., and Grosse, G. (2011). Hydrogeomorphic Processes of Thermokarst Lakes with Grounded-Ice and Floating-Ice Regimes on the Arctic Coastal plain, Alaska. Hydrol. Process. 25 (15), 2422–2438. doi:10.1002/hyp.8019
Avanzi, F., Bianchi, A., Cina, A., De Michele, C., Maschio, P., Pagliari, D., et al. (2018). Centimetric Accuracy in Snow Depth Using Unmanned Aerial System Photogrammetry and a Multistation. Remote Sensing 10 (5), 765–816. doi:10.3390/rs10050765
Brown, L. C., and Duguay, C. R. (2010). The Response and Role of Ice Cover in lake-climate Interactions. Prog. Phys. Geogr. Earth Environ. 34 (5), 671–704. doi:10.1177/0309133310375653
Bühler, Y., Adams, M. S., Bösch, R., and Stoffel, A. (2016). Mapping Snow Depth in alpine Terrain with Unmanned Aerial Systems (UASs): Potential and Limitations. The Cryosphere 10 (3), 1075–1088. doi:10.5194/tc-10-1075-2016
Carson, C. E., and Hussey, K. M. (1962). The Oriented Lakes of Arctic Alaska. J. Geology. 70 (4), 417–439. doi:10.1086/626834
Chudley, T. R., Christoffersen, P., Doyle, S. H., Abellan, A., and Snooke, N. (2019). High-accuracy UAV Photogrammetry of Ice Sheet Dynamics with No Ground Control. The Cryosphere 13, 955–968. doi:10.5194/tc-13-955-2019
Clark, M. P., Bierkens, M. F. P., Samaniego, L., Woods, R. A., Uijlenhoet, R., Bennett, K. E., et al. (2017). The Evolution of Process-Based Hydrologic Models: Historical Challenges and the Collective Quest for Physical Realism. Hydrol. Earth Syst. Sci. 21 (7), 3427–3440. doi:10.5194/hess-21-3427-2017
De Michele, C., Avanzi, F., Passoni, D., Barzaghi, R., Pinto, L., Dosso, P., et al. (2016). Using a Fixed-wing UAS to Map Snow Depth Distribution: An Evaluation at Peak Accumulation. The Cryosphere 10 (2), 511–522. doi:10.5194/tc-10-511-2016
Dozier, J. (1984). Snow Reflectance from Landsat-4 Thematic Mapper. IEEE Trans. Geosci. Remote Sensing GE-22 (3), 323–328. doi:10.1109/tgrs.1984.350628
Duguay, C. R., and Lafleur, P. M. (2003). Determining Depth and Ice Thickness of Shallow Sub-Arctic Lakes Using Space-Borne Optical and SAR Data. Int. J. Remote Sensing 24 (3), 475–489. doi:10.1080/01431160304992
Engram, M., Arp, C. D., Jones, B. M., Ajadi, O. A., and Meyer, F. J. (2018). Analyzing Floating and Bedfast lake Ice Regimes across Arctic Alaska Using 25 Years of Space-Borne SAR Imagery. Remote Sensing Environ. 209, 660–676. doi:10.1016/j.rse.2018.02.022
Fernandes, R., Prevost, C., Canisius, F., Leblanc, S. G., Maloley, M., Oakes, S., et al. (2018). Monitoring Snow Depth Change across a Range of Landscapes with Ephemeral Snowpacks Using Structure from Motion Applied to Lightweight Unmanned Aerial Vehicle Videos. The Cryosphere 12 (11), 3535–3550. doi:10.5194/tc-12-3535-2018
Gindraux, S., Boesch, R., and Farinotti, D. (2017). Accuracy Assessment of Digital Surface Models from Unmanned Aerial Vehicles' Imagery on Glaciers. Remote Sensing 9 (2), 186–215. doi:10.3390/rs9020186
Glen, J. W., and Paren, J. G. (1975). The Electrical Properties of Snow and Ice. J. Glaciol. 15 (73), 15–38. doi:10.3189/S0022143000034249
Green, R. O., Dozier, J., Roberts, D., and Painter, T. (2002). Spectral Snow-Reflectance Models for Grain-Size and Liquid-Water Fraction in Melting Snow for the Solar-Reflected Spectrum. Ann. Glaciol. 34, 71–73. doi:10.3189/172756402781817987
Gunn, G. E., Brogioni, M., Duguay, C., Macelloni, G., Kasurak, A., and King, J. (2015a). Observation and Modeling of X- and Ku-Band Backscatter of Snow-Covered Freshwater Lake Ice. IEEE J. Sel. Top. Appl. Earth Observations Remote Sensing 8 (7), 3629–3642. doi:10.1109/jstars.2015.2420411
Gunn, G. E., Duguay, C. R., Brown, L. C., King, J., Atwood, D., and Kasurak, A. (2015b). Freshwater lake Ice Thickness Derived Using Surface-Based X- and Ku-Band FMCW Scatterometers. Cold Regions Sci. Techn. 120, 115–126. doi:10.1016/j.coldregions.2015.09.012
Hannula, H.-R., and Pulliainen, J. (2019). Spectral Reflectance Behavior of Different Boreal Snow Types. J. Glaciol. 65 (254), 926–939. doi:10.1017/jog.2019.68
Harder, P., Pomeroy, J. W., and Helgason, W. D. (2020). Improving Sub-canopy Snow Depth Mapping with Unmanned Aerial Vehicles: LiDAR versus Structure-From-Motion Techniques. The Cryosphere 14, 1919–1935. doi:10.5194/tc-14-1919-2020
Harder, P., Schirmer, M., Pomeroy, J., and Helgason, W. (2016). Accuracy of Snow Depth Estimation in Mountain and Prairie Environments by an Unmanned Aerial Vehicle. The Cryosphere 10, 2559–2571. Available at: https://tc.copernicus.org/articles/10/545 2559/2016/. doi:10.5194/tc-10-2559-2016
Hinkel, K. M., Eisner, W. R., Beck, R. A., Lenters, J. D., and Sheng, Y. (2010). Water Temperature and Bathymetric Depth Soundings for Lakes on the North Slope of Alaska. Arctic Data Cent. doi:10.5065/D6WW7FS9
Hinkel, K. M., Frohn, R. C., Nelson, F. E., Eisner, W. R., and Beck, R. A. (2005). Morphometric and Spatial Analysis of Thaw Lakes and Drained Thaw lake Basins in the Western Arctic Coastal Plain, Alaska. Permafrost Periglac. Process. 16, 327–341. doi:10.1002/ppp.532
Holmgren, J., Sturm, M., Yankielun, N. E., and Koh, G. (1998). Extensive Measurements of Snow Depth Using FM-CW Radar. Cold Regions Sci. Techn. 27 (1), 17–30. doi:10.1016/s0165-232x(97)00020-7
Iacozza, J., and Barber, D. G. (1999). An Examination of the Distribution of Snow on Sea‐ice. Atmosphere-Ocean 37 (1), 21–51. doi:10.1080/07055900.1999.9649620
Integrated Global Observing Strategy (2007). Cryosphere Theme Report: For the Monitoring of Our Environment from Space and from Earth. Geneva: World Meteorological Organisation. WMO/TD-No. 1405.
Jacobs, J. M., Hunsaker, A. G., Sullivan, F. B., Palace, M., Burakowski, E. A., Herrick, C., et al. (2021). Snow Depth Mapping with Unpiloted Aerial System LiDAR Observations: a Case Study in Durham, New Hampshire, United States. The Cryosphere 15, 1485–1500. doi:10.5194/tc-15-1485-2021
Jeffries, M. O., Morris, K., and Duguay, C. R. (2005). Lake Ice Growth and Decay in central Alaska, USA: Observations and Computer Simulations Compared. Ann. Glaciol. 40, 195–199. doi:10.3189/172756405781813807
Jensen, O. P., Benson, B. J., Magnuson, J. J., Card, V. M., Futter, M. N., Soranno, P. A., et al. (2007). Spatial Analysis of Ice Phenology Trends across the Laurentian Great Lakes Region during a Recent Warming Period. Limnol. Oceanogr. 52 (5), 2013–2026. doi:10.4319/lo.2007.52.5.2013
Kouraev, A. V., Semovski, S. V., Shimaraev, M. N., Mognard, N. M., Legrésy, B., and Rémy, F. (2007). The Ice Regime of Lake Baikal from Historical and Satellite Data: Relationship to Air Temperature, Dynamical, and Other Factors. Limnol. Oceanogr. 52 (3), 1268–1286. doi:10.4319/lo.2007.52.3.1268
Kwok, R., and Kacimi, S. (2018). Three Years of Sea Ice Freeboard, Snow Depth, and Ice Thickness of the Weddell Sea from Operation IceBridge and CryoSat-2. The Cryosphere 12 (8), 2789–2801. doi:10.5194/tc-12-2789-2018
Li, G., Wang, Z. S., and Huang, N. (2018). A Snow Distribution Model Based on Snowfall and Snow Drifting Simulations in Mountain Area. J. Geophys. Res. Atmospheres 123 (14), 7193–7203. doi:10.1029/2018JD028434
Lindgren, P., Grosse, G., Meyer, F., and Anthony, K. (2019). An Object-Based Classification Method to Detect Methane Ebullition Bubbles in Early Winter Lake Ice. Remote Sensing 11 (7), 822. doi:10.3390/rs11070822
Lindgren, P. R., Grosse, G., Walter Anthony, K. M., and Meyer, F. J. (2016). Detection and Spatiotemporal Analysis of Methane Ebullition on Thermokarst lake Ice Using High-Resolution Optical Aerial Imagery. Biogeosciences 13 (1), 27–44. doi:10.5194/bg-13-27-2016
Mälicke, M., and Schneider, H. D. (2021). Variogram.py. Github Repository. Available at: https://github.com/mmaelicke/scikit-gstat/blob/master/skgstat/Variogram.py. doi:10.5194/hess-2021-2-rc2 Accessed Jan 1, 2021.
Marsh, C. B., Pomeroy, J. W., Spiteri, R. J., and Wheater, H. S. (2020). A Finite Volume Blowing Snow Model for Use with Variable Resolution Meshes. Water Resour. Res. 56 (2), e2019WR025307. doi:10.1029/2019wr025307
Martinez‐Agirre, A., Álvarez‐Mozos, J., Milenković, M., Pfeifer, N., Giménez, R., Valle, J. M., et al. (2020). Evaluation of Terrestrial Laser Scanner and Structure from Motion Photogrammetry Techniques for Quantifying Soil Surface Roughness Parameters over Agricultural Soils. Earth Surf. Process. Landforms 45 (3), 605–621. doi:10.1002/esp.4758
Menne, M. J., Durre, I., Korzeniewski, B., McNeal, S., Thomas, K., Yin, X., et al. (2012). Global Historical Climatology Network - Daily (GHCN-Daily), Version 3. Barrow Airport, AK, US: NOAA National Climatic Data Center. doi:10.7289/V5D21VHZ (Accessed 11 26, 2020).
Messager, M. L., Lehner, B., Grill, G., Nedeva, I., and Schmitt, O. (2016). Estimating the Volume and Age of Water Stored in Global Lakes Using a Geo-Statistical Approach. Nat. Commun. 7, 13603. doi:10.1038/ncomms136010.1038/ncomms13603
Nandan, V., Geldsetzer, T., Yackel, J., Mahmud, M., Scharien, R., Howell, S., et al. (2017). Effect of Snow Salinity on CryoSat‐2 Arctic First‐year Sea Ice Freeboard Measurements. Geophys. Res. Lett. 44 (20), 10–419. doi:10.1002/2017gl074506
Newman, T., Farrell, S. L., Richter-Menge, J., Connor, L. N., Kurtz, N. T., Elder, B. C., et al. (2014). Assessment of Radar-Derived Snow Depth over Arctic Sea Ice. J. Geophys. Res. Oceans 119 (12), 8578–8602. doi:10.1002/2014jc010284
Nolan, M., Larsen, C., and Sturm, M. (2015). Mapping Snow Depth from Manned Aircraft on Landscape Scales at Centimeter Resolution Using Structure-From-Motion Photogrammetry. The Cryosphere 9, 1445–1463. doi:10.5194/tc-9-1445-2015
OCM Partners (2021). 2018 USGS LiDAR: North Slope, AK - QL1 from 2010-06-15 to 2010-08-15. Charleston, SC: NOAA National Centers for Environmental Information Available at: https://www.fisheries.noaa.gov/inport/item/63140 (Accessed January 17, 2021).
Parr, C., Sturm, M., and Larsen, C. (2020). Snowdrift Landscape Patterns: An Arctic Investigation. Water Resour. Res. 56 (12), 20. doi:10.1029/2020wr027823
Pomerleau, P., Royer, A., Langlois, A., Cliche, P., Courtemanche, B., Madore, J.-B., et al. (2020). Low Cost and Compact FMCW 24 GHz Radar Applications for Snowpack and Ice Thickness Measurements. Sensors 20 (14), 3909. doi:10.3390/s20143909
Sandmeier, K. J. (2020). ReflexW Version 9.5. Program for Processing of Seismic, Acoustic or Electromagnetic Reflection, Refraction, and Transmission Data. Karlsruhe, Germany: Software Manual, 726.
Schlobies, K., Grosse, G., and Anthony, K. W. (2016). “Structure from Motion (SfM) Orthoimage Generation for Characterizing Methane Ebullition Features in Thermokarst lake Ice,” in XI nternational Conference on Permafrost, Potsdam, Germany, June 20–24, 2016, 725–727.
Sellmann, P. V., Weeks, W. F., and Campbell, W. J. (1975). Use of Sidelooking Airborne Radar to Determine lake Depth on the Alaskan North Slope. CRREL Special Report. Hanover, NH: US Army Cold Regions Research and Engineering Laboratory, 230.
Sturm, M., and Holmgren, J. (2018). An Automatic Snow Depth Probe for Field Validation Campaigns. Water Resour. Res. 54 (11), 9695–9701. doi:10.1029/2018wr023559
Sturm, M., Holmgren, J., and Perovich, D. K. (2002). Winter Snow Cover on the Sea Ice of Arctic Ocean at the Surface Heat Budget of the Arctic Ocean (SHEBA): Temporal Evolution and Spatial Variability. Water Resour. Res. 107 (C10), SHE 23-1–SHE 23-17. doi:10.1029/2000JC000400
Sturm, M., and Liston, G. E. (2003). The Snow Cover on Lakes of the Arctic Coastal Plain of Alaska, U.S.A. J. Glaciol. 49 (166), 370–380. doi:10.3189/172756503781830539
Surdu, C. M., Duguay, C. R., Brown, L. C., and Fernández Prieto, D. (2014). Response of Ice Cover on Shallow Lakes of the North Slope of Alaska to Contemporary Climate Conditions (1950-2011): Radar Remote-Sensing and Numerical Modeling Data Analysis. The Cryosphere 8 (1), 167–180. doi:10.5194/tc-8-167-2014
Tan, A. E.-C., McCulloch, J., Rack, W., Platt, I., and Woodhead, I. (2021). Radar Measurements of Snow Depth Over Sea Ice on an Unmanned Aerial Vehicle. IEEE Trans. Geosci. Remote Sensing 59, 1868–1875. doi:10.1109/tgrs.2020.3006182
Vander Jagt, B., Lucieer, A., Wallace, L., Turner, D., and Durand, M. (2015). Snow Depth Retrieval with UAS Using Photogrammetric Techniques. Geosciences 5 (3), 264–285. doi:10.3390/geosciences5030264
Walker, B., Wilcox, E. J., and Marsh, P. (2020). Accuracy assessment of late winter snow depth mapping for tundra environments using Structure-from-Motion photogrammetry. Arctic Science. doi:10.1139/as-2020-0006
Keywords: UAV (unmanned aerial vehicle), snow depth, lake ice, structure from motion (SFM), freeboard
Citation: Gunn GE, Jones BM and Rangel RC (2021) Unpiloted Aerial Vehicle Retrieval of Snow Depth Over Freshwater Lake Ice Using Structure From Motion. Front. Remote Sens. 2:675846. doi: 10.3389/frsen.2021.675846
Received: 04 March 2021; Accepted: 23 June 2021;
Published: 14 July 2021.
Edited by:
Matt Westoby, Northumbria University, United KingdomReviewed by:
Phillip Harder, University of Saskatchewan, CanadaCopyright © 2021 Gunn, Jones and Rangel. This is an open-access article distributed under the terms of the Creative Commons Attribution License (CC BY). The use, distribution or reproduction in other forums is permitted, provided the original author(s) and the copyright owner(s) are credited and that the original publication in this journal is cited, in accordance with accepted academic practice. No use, distribution or reproduction is permitted which does not comply with these terms.
*Correspondence: Grant E. Gunn, ZzJndW5uQHV3YXRlcmxvby5jYQ==
Disclaimer: All claims expressed in this article are solely those of the authors and do not necessarily represent those of their affiliated organizations, or those of the publisher, the editors and the reviewers. Any product that may be evaluated in this article or claim that may be made by its manufacturer is not guaranteed or endorsed by the publisher.
Research integrity at Frontiers
Learn more about the work of our research integrity team to safeguard the quality of each article we publish.