
94% of researchers rate our articles as excellent or good
Learn more about the work of our research integrity team to safeguard the quality of each article we publish.
Find out more
ORIGINAL RESEARCH article
Front. Rehabil. Sci. , 06 March 2025
Sec. Strengthening Rehabilitation in Health Systems
Volume 6 - 2025 | https://doi.org/10.3389/fresc.2025.1564346
 Anne-Lene Sand-Svartrud1*†
 Hanne Dagfinrud1,†
 Johanne Fossen2Heidi Framstad3,†Eirik Lind Irgens4,†Hild Kristin Morvik5Joseph Sexton6
 Rikke Helene Moe1,†
 Ingvild Kjeken1,†
Introduction: Quality improvement in rehabilitation is needed due to unwarranted variations and suboptimal service coordination. Audit and feedback strategies are commonly used to improve healthcare quality, but evidence of their effectiveness in rehabilitation settings is limited.
Objective: To evaluate the impact of an audit and feedback strategy on rehabilitation quality, as measured by a set of quality indicators (QIs) specifically designed for rehabilitation.
Methods: Interrupted time series analysis was conducted across 16 Norwegian institutions delivering specialized rehabilitation for long-term diseases. Patient-reported rehabilitation quality data was collected continuously before and after a provider feedback intervention, while provider-reported quality was measured once before and after the intervention. We compared 11 pre- and 9 post-intervention observations, each spanning 3 weeks, over a 15-months study period.
Results: The analyses included 2,415 patients, with 1,444 (59.8%) pre-intervention and 971 (40.2%) post-intervention. Mixed model analyses revealed that the mean differences in patient-reported QIs between the pre- and post-intervention phase were small and statistically non-significant. The expected impact model, including a gradually higher quality after the feedback to institution managers and clinical team members, was not confirmed. We observed variations in service quality among institutions, also post-intervention. The lowest pass rates were observed for indicators addressing the follow-up, involvement of external services and next of kin.
Conclusions: In this multicentre study, the audit and feedback intervention did not lead to improvements in the quality of rehabilitation services, as measured by changes in QI pass rates covering health service structures, processes and patient outcomes.
Clinical Trial Registration: ClinicalTrials.gov [NCT03764982].
Rehabilitation services may result in individual and societal benefits for the increasing proportion of people living with disabilities due to long-term diseases (1). The need for such services is substantial and growing (2), yet current evidence on the effectiveness of multidisciplinary, non-pharmacological rehabilitation in improving patient health outcomes remains inconclusive (3–6). Given that some of these outcome variations may relate to differences in professional rehabilitation practice, actions are needed to ensure delivery of high-quality rehabilitation services to all patients (1, 2, 7).
In Norway, secondary healthcare rehabilitation is delivered in hospitals or private rehabilitation institutions, with subsequent follow-up in primary care (8). Public evaluation reports conclude that the quality of rehabilitation services is characterized by unwarranted variations among institutions and services, in terms of fragmented interventions that are insufficiently coordinated across professions, services and healthcare levels, and with a suboptimal level of patient involvement (9, 10). In contrast, high-quality rehabilitation practice should reflect a multi-step process tailored to each individual patient, with coordinated interventions involving different professions and services, often provided along a continuum of care from hospitals or institutions in secondary healthcare to rehabilitation in local municipalities (11). It is essential to find ways to evaluate and improve each step, as well as the process as a whole.
Audit and feedback strategies are widely used to evaluate and improve the quality of healthcare services (12–15). These strategies include systematic assessments of various aspects of healthcare delivery, such as clinical performance in patient treatment, existing procedures, administrative structures, and patient outcomes (12–15). Systematic feedback to health professionals and managers regarding their adherence to established standards, can enable them to pinpoint areas for refinement, address shortcomings, and optimize their services (12–15). The overarching objective of audit and feedback strategies is to motivate clinicians and institution managers to sustain practices aligned with criteria for high-quality care, and, if necessary, to prompt them to identify and carry out actions for improvement in areas of suboptimal care delivery (15).
Quality indicators (QIs) may have a crucial role in audit and feedback strategies, as indicators reflect standards of care based on the best available, scientific evidence, guidelines, recommendations, and expert opinions (16, 17). Utilization of QIs allows the measurement of a set of identifiable events that are expected to occur during delivery of high-quality health services (16–19). When included in audit and feedback strategies, QIs can work as benchmarks for evaluating different dimensions of healthcare quality, including structures, processes of care, and patient outcomes. In a specific QI set developed in 2019 for use in rehabilitation, the structure indicators measure the settings in which the rehabilitation occurs, in terms of available, written procedures defining care intended to be provided (20). The process indicators measure what is actually done in providing and receiving care, and the outcome indicators measure the patient perspective on meaningful improvements in goal-attainment, function, and well-being (20).
Audit and feedback strategies are used in various ways from local initiatives to mandatory assessments initiated by national or international health authorities (15, 21). However, there is a paucity of studies investigating the effectiveness of audit and feedback on quality improvement in rehabilitation services, and previous work has mostly focused on rehabilitation quality in intensive care units (22).
More knowledge is needed on methods for providing feedback on provider performance in rehabilitation services for people with long-term diseases, as well as the impact of audit and feedback strategies in this context. Therefore, the aim of this study was to assess the impact of an audit and feedback strategy targeting healthcare providers on the quality of rehabilitation services, as measured by a QI set designed for use within the field of rehabilitation (20).
This study was part of the longitudinal RehabNytte Cohort (23), from which we included 16 out of 17 Norwegian institutions delivering multidisciplinary rehabilitation services to adults referred to rehabilitation in secondary healthcare due to various long-term diseases. Additional information about the relationship between the current study and the RehabNytte Cohort is given in Textbox 1.

Textbox 1. The relationship between the current study and the RehabNytte Cohort.
In this paper, we refer to audit as the process of using the QI set for rehabilitation (20) as normative criteria for review of clinical practice and as a measure of professional performance, such that pass rates reflect the percentage of indicators that are successfully met (15, 24). We refer to feedback as a subsequent summary of the audit results that is reported back to clinicians and their managers, in terms of both separate data for each participating institution and aggregated data for comparison to other institutions included in the RehabNytte study (15, 24).
Using the QI set for multidisciplinary rehabilitation (20) as audit criteria, we evaluated whether the performance of the rehabilitation institutions and providers met the recommended standard of high level patient involvement throughout the rehabilitation process. It encompassed patient involvement in initial assessments, goal setting, and development of rehabilitation plans, as well as involvement of next of kin and external services. Additionally, it included adjustments of goals or interventions, and evaluation of progress conducted through team meetings and standardized assessment instruments (20). These topics were evaluated by one questionnaire completed by providers (addressing 19 structure indicators) and one completed by patients (addressing 11 process indicators and three outcome indicators) (Table 1). As the content of several of the structure and process indicators are matched, the QI set allows for evaluating and comparing quality from both the provider and the patient perspective (20) (Table 1). The set reflects the general rehabilitation process, making it applicable to programs focusing either physical rehabilitation, management training, psychosocial issues, lifestyle modifications, and patient education, determined by a patient-specific, goal-directed process involving several healthcare professionals over time.
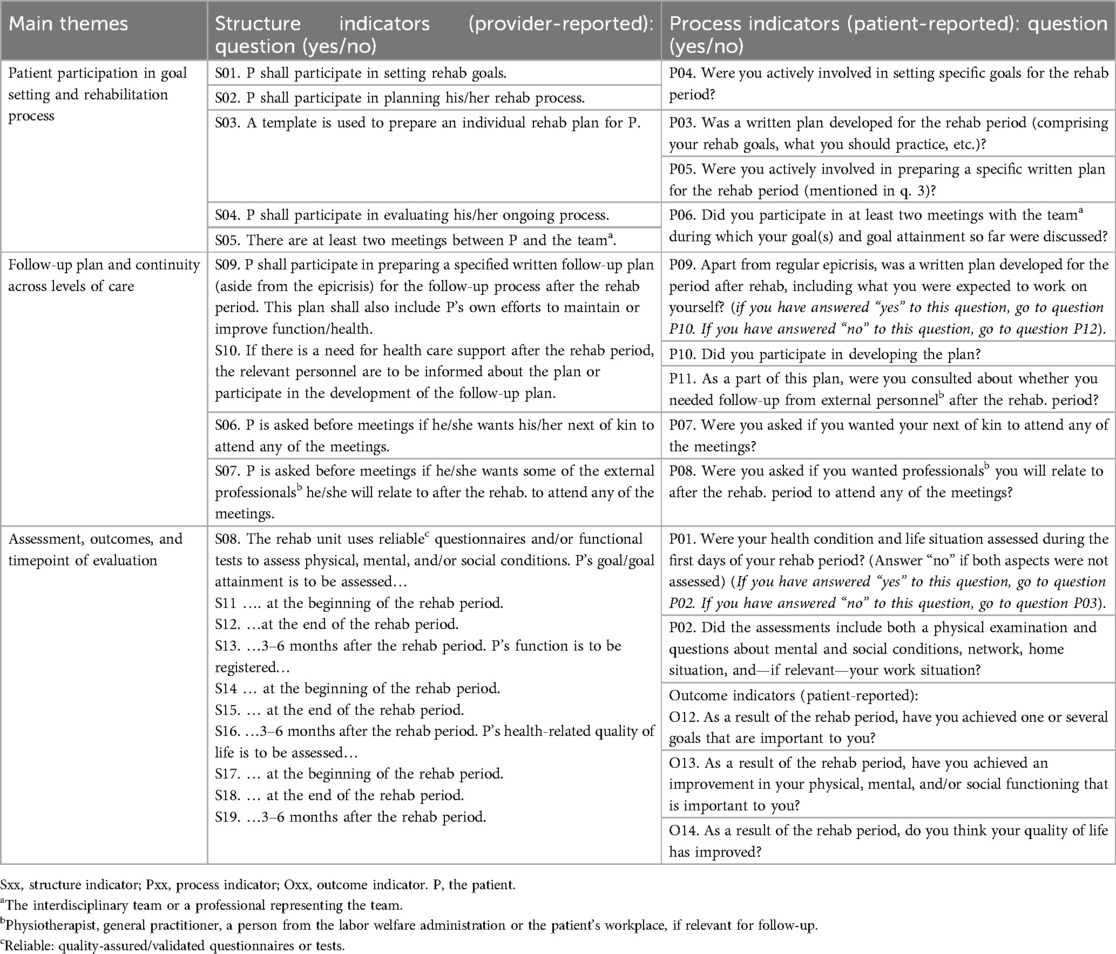
Table 1. The quality indicator set for use in rehabilitation (20).
All indicators are statements or questions requiring a dichotomous “yes” or “no” response, in which “yes” confirms the recommended indicator is fulfilled (“passed”). Summary pass rate for a complete questionnaire is calculated as the total number of indicators passed by each participant (institution or patient), divided by the total number of eligible items in the same questionnaire (20). Pass rate for a single indicator is calculated as the number of passed responses (“yes”) for that specific indicator, divided by the number of participants (institutions or patients) answering “yes” or “no” to the same indicator (20). Responses are reported as pass rates ranging from 0% to 100% (100 = the highest quality). The QI set has demonstrated feasibility, satisfactory face and content validity, and adequate responsiveness in both primary and secondary healthcare settings (20, 25).
We used an interrupted time series (ITS) design (26, 27) and hypothesized that systematic use of rehabilitation QIs and feedback on QI pass rates to providers would lead to better rehabilitation quality over time. The ITS approach was chosen for its suitability in clinical settings, as the quality of rehabilitation could be continuously monitored by collecting responses to the QI set from each patient throughout the study period. The feedback intervention was delivered simultaneously to all participating centres on the same date during the same meeting, making a clear differentiation of the pre- and post-intervention periods.
We defined three phases in the study: A pre-intervention phase (30 weeks), an intervention phase (1 week), and a post-intervention phase (30 weeks). The pre- and post-intervention phases were divided into consecutive 3-weeks intervals, as illustrated in Figure 1. Data on QIs collected from patients included in the first 30 weeks established the pre-intervention trend, while data from patients included in the last 30 weeks informed the post-intervention trend. In study week 31, the institutions received feedback on the QI pass rates. This provided an opportunity for the institutions to implement actions addressing areas in need for quality improvement, and thereby “interrupting” the pre-intervention pass rate trend. To assess the impact of the feedback intervention, we compared the post-intervention trend in QI pass rates with the pre-intervention trend, focusing on changes in both level and slope.
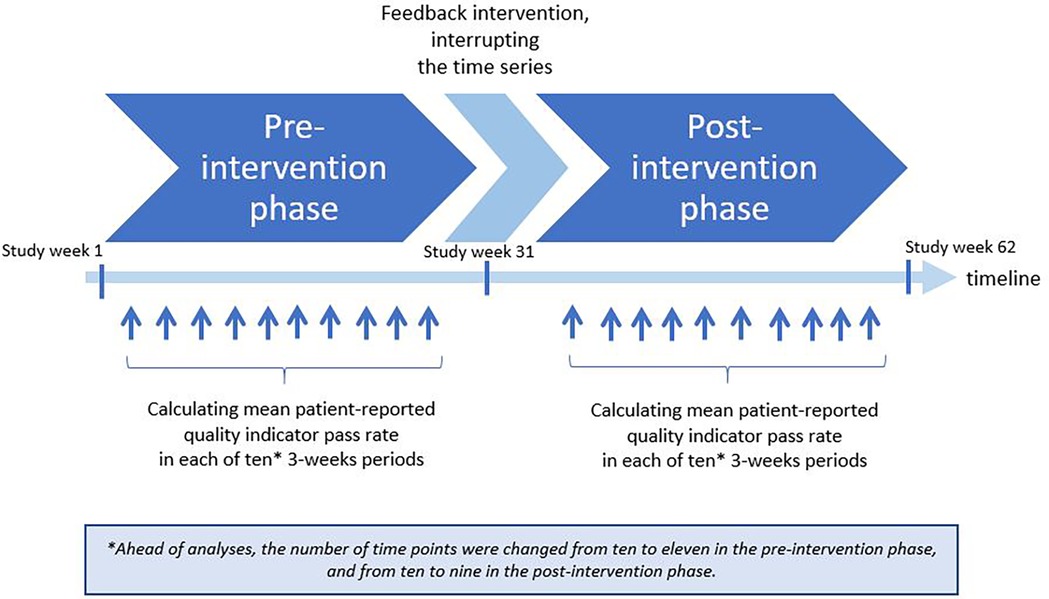
Figure 1. Timeline illustrating the planned interrupted time series design in the current study.
All participants provided written, informed consent before enrolment. Patient research partners and clinician representatives were involved in project development, design, and implementation of RehabNytte. The study was registered in ClinicalTrials.gov (NCT03764982), and recommended by the data protection officer at Diakonhjemmet Hospital (DS-00040, dated 17.10.2018). Approval from the Norwegian Regional Committee for Medical Research Ethics was not required (2018/1645/REK South-East A).
Patient inclusion criteria were age ≥18 years, ability to read and understand questionnaires in Norwegian, access to a personal computer, tablet, or smartphone, and holder of a personal electronic credential for secure identification online. Exclusion criteria were severe cognitive impairment(s) or psychiatric disease(s) influencing the patient's ability to perform repeated self-reported assessments in a digital data base. This was necessary, as data collection in the overall RehabNytte relied on digital responses to patient-reported outcome measures (PROMs) at multiple time points (23).
The audit and feedback intervention targeted the clinical team members and their managers, acknowledging both parties as keys to delivering high-quality rehabilitation practice. The feedback was delivered as a 1-day (3.5 h) session organized by the RehabNytte Research and Development Network, and took place in a social context already known by the participants from earlier meetings in the group. The project leader first presented recommendations for high-quality rehabilitation practice as reflected in the rehabilitation QI set, addressing structures, processes, and patients' rehabilitation outcomes. Thereafter, she presented examples on how pass rate results can be used to identify and target areas in need of quality improvement, followed by suggestions on how to carry out various actions to improve written procedures or clinical delivery of rehabilitation tasks and processes. The participants engaged in successive reflections, discussing potential issues arising from suboptimal pass rates, and shared ideas on how to optimize their structures and clinical processes to address areas in need of improvement. Subsequently, the overall study-specific audit results were presented in plenum, in terms of mean pass rates for summary scores of complete questionnaires and single indicators, respectively. Institution-specific audit results were then conveyed confidentially, with written and graphical reports distributed to each institution. Overall, the institutions were encouraged to autonomously utilize the audit results, resolving and implementing feasible actions aimed at enhancing areas of suboptimal quality and sustaining high-quality areas in the post-intervention phase.
Each participant responded to the process and outcome indicators 3 months after admission to the rehabilitation institution. This approach allowed us to capture their perspectives on rehabilitation quality during rehabilitation in secondary care and the initial stages of the follow-up period at home. It also provided continuous measurement points throughout the pre- and post-intervention phases. Accordingly, a manager or team leader at each institution responded to the structure indicators in study week 5 and study week 46–51, using the QI questionnaire for providers. In this way, we measured the occurrence of written procedures for daily use addressing each step in the rehabilitation process from admission to follow-up, before and after the feedback intervention.
The outcome in our study was change in rehabilitation quality from pre- to post-intervention phase, measured by tracking and comparing the pre-and post- pass rate trends of patient-reported process- and outcome indicators, and comparing provider-reported QI pass rates for structure indicators before and after the feedback intervention.
At admission, the RehabNytte data collection system included sociodemographic variables, such as age, sex, diagnosis, comorbidities, education level, paid work and social security benefits. At admission, discharge, and after 3, 6 and 12 months, the patients responded to PROMs addressing various health aspects. The following variables were used only for analyses in other RehabNytte studies: work ability (using the Work Ability Score from the Work Ability Index) (28–30), pain level (11-point numeric rating scale), distribution of pain, duration of pain (31, 32), change in health status (using the Global Rating of Change Scale) (33), symptom acceptability (using the Patient Acceptable Symptom Scale) (34–36), and health related quality of life (using the EQ-5D-5l questionnaire) (37, 38). The QI questionnaire for process and outcome indicators was included in the data collection system at 3 months, and used as outcome in the current study. Within each 3 weeks period (termed an assessment point), data from individual patients were aggregated into group-level data based on mean pass rate for the patient-reported QIs collected in that period.
The length of the pre-intervention phase was adjusted from 30 to 33 weeks due to final decisions on date for the feedback session, and the length of the post-intervention phase was reduced from 30 to 27 weeks due to actions implemented by the Norwegian Ministries to combat the coronavirus outbreak. Consequently, the final time series consisted of 11 pre- and 9 post-intervention assessment points, numbered 0–10 and 11–19, respectively.
We proposed an a priori impact model having a brief lag immediately after the feedback, followed by a temporary slope change, leading to a level change in rehabilitation quality later in the post-intervention phase (Figure 2). Hence, we expected the post-intervention changes in rehabilitation quality to follow gradually after a delay, as the institutions probably needed some time to respond to the feedback, and since improvements targeting some quality indicators may be easier to implement compared to more complex ones. This potential delay was acknowledged and included in analyses.

Figure 2. Before conducting the analyses, we expected a delayed but gradual improvement in quality following the feedback intervention.
We used mixed effects models to address the hierarchical structure in our data set (having patients clustered in different rehabilitation centres, reporting at different assessment points) and to handle missing response data. Our main model included time as a continuous covariate, an indicator for the intervention period, and an interaction between these two. The random effects included centre specific intercepts and time slopes, and an autoregressive structure was assumed for the residuals. An additional model was used to simulate a potential delay in the intervention effect, using a linear spline at assessment points 12 and 16. Likelihood ratio tests between models with and without the post-intervention indicator variable were used to test a difference between the pre- and post-intervention periods.
The dependent variable in the analyses was the averaged patient-reported pass rate per centre at each assessment point. Analyses based on the pass rate for the complete patient-reported QI questionnaire was followed by separate analyses for the pass rate of the process- and outcome indicators, respectively. To adjust for individual patient attributes, similar mixed model analyses were used, however pass rates were not aggregated across individuals. These individual level analyses were adjusted for age, sex, body mass index, referral diagnosis, degree of comorbidity, smoking and/or snuff use, education level, paid employment, recipients of social security benefits, native language, civil status, caregiver, and annual gross income in the household.
We analysed data in STATA/IC version 16.0 and Microsoft Office Excel 2019. We considered p-values less than 0.05 as statistically significant.
All the participating centres were represented at the feedback intervention session.
In total, 29 managers or team leaders completed responses to the provider-reported questionnaires at the established pre- and post-intervention assessment points. This number was higher than the number of participating centres, as six multi-team centres implemented the audit- and feedback-intervention in more than one section within their institution. The observed summary pass rate (mean) across all centres and teams was 62.6% [95% confidence interval (CI) 54.8, 70.4] in the pre-intervention phase, compared to 69.9% (95% CI 62.2, 77.5) in the post-intervention phase.
Nine teams reported no change in structure indicators (QIs S01–S19), 18 teams reported improvements in 1–4 structure indicators, and two teams reported improvements in 7 and 10 structure indicators, respectively (Figure 3). We observed a large variation (>68 percentage points) in structure quality among centres and teams in both phases (Figure 3).
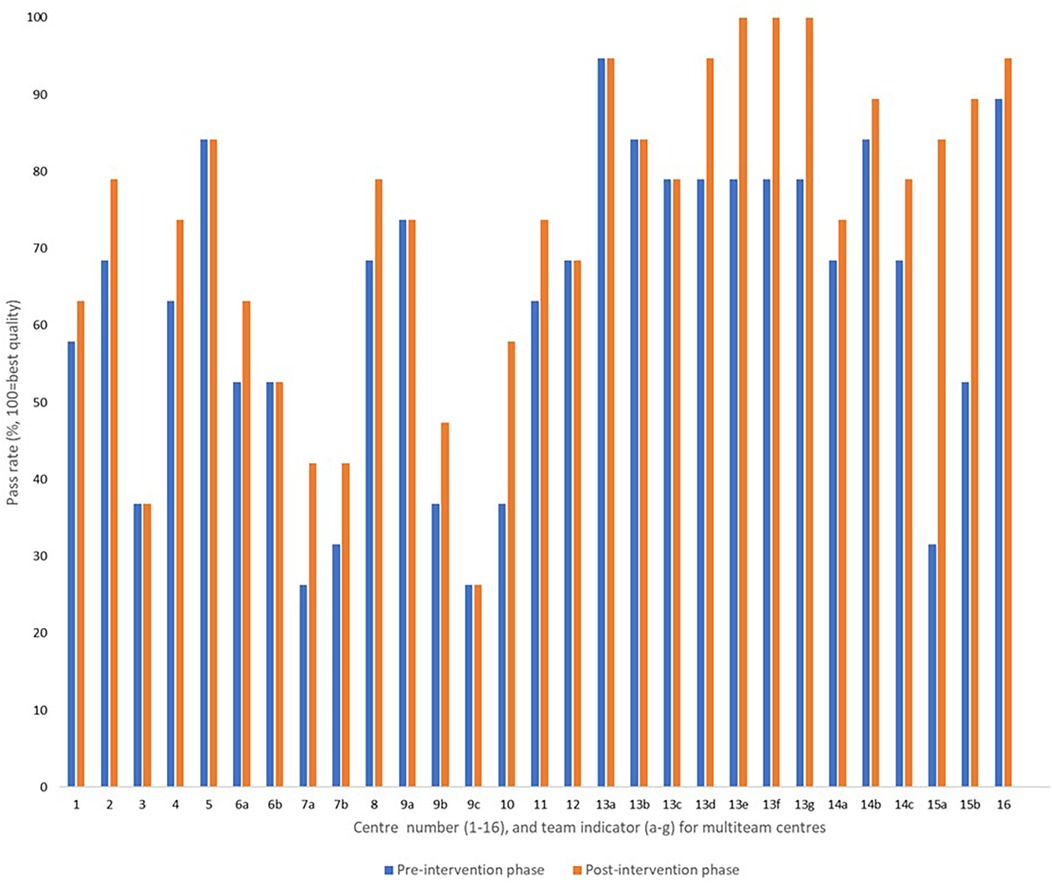
Figure 3. Provider-reported summary pass rates addressing the structure indicators before and after the feedback intervention, reported from 29 rehabilitation teams allocated to 16 institutions.
In total, 2,516 participants were recruited from 16 centres. Before analyses, we excluded participants included in the same week as the feedback intervention (n = 45), and participants included at the start of the pandemic (n = 56). The analyses were based on 2,415 participants distributed as 1,444 participants (59.8%) and 971 participants (40.2%) in the baseline pre- and post-intervention sample, respectively. The mean age of the total study sample was 52.1 years (±14 years), 68.9% were female, 52.3% had a rheumatic or musculoskeletal disease, and 56.3% were fully or partly employed. Baseline participant characteristics for the pre- and post-intervention samples are presented in Table 2.
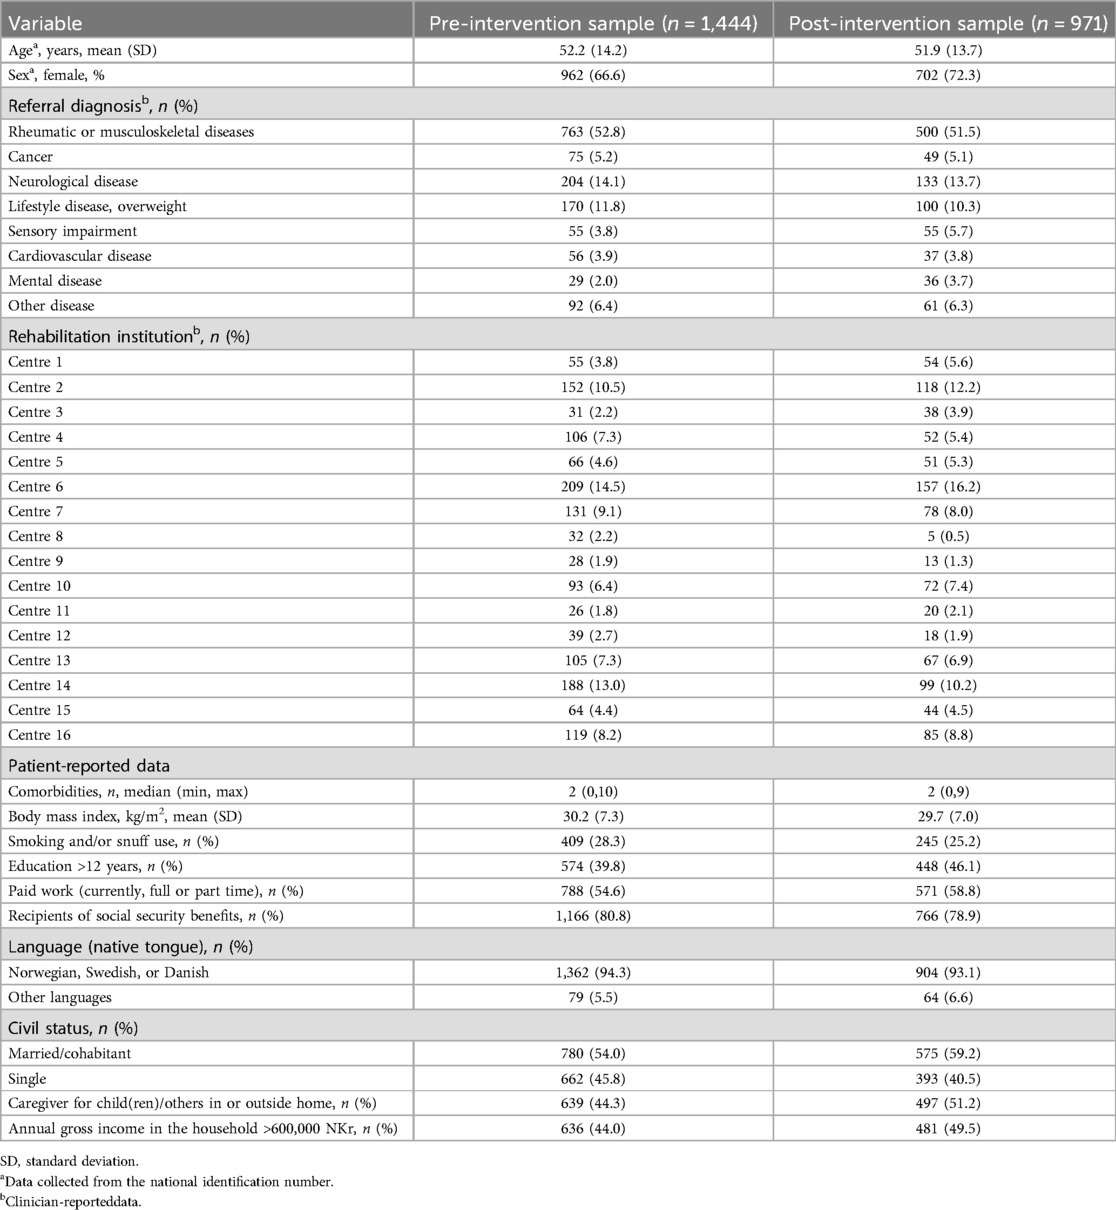
Table 2. Baseline characteristics of participants (n = 2,415) and their allocation across institutions (n = 16).
The total baseline number of participants per assessment point ranged between 57 and 231 during the pre-intervention phase, and between 39 and 142 during the post-intervention phase (Additional file 1, Table A). Among the baseline participants, a total of 1,823/2,415 participants (75.4%) logged into the 3-month measurement time point. Of those, 1,777/1,823 participants (97.5%) answered the QI questionnaire, distributed as 1,078/1,104 (97.6%) participants in the pre-intervention sample, and 699/719 (97.2%) in the post-intervention sample. Among all institutions, the number of missing responses to the QI questionnaire was 2.5%, ranging from 0% to 6.7% (Additional file 1, Table B).
At the individual participant level, the pre-intervention process pass rates ranged from 18.7% to 100%, compared to the range from 37.5% to 90.9% in the post-intervention phase. Outcome pass-rates ranged from 0% to 100% in both phases.
The observed summary pass rate (mean) for the complete patient-reported QI questionnaire was 68.8% in the total pre-intervention sample, compared to 70.7% in the total post-intervention sample. Separate analyses of the process indicators (P01–P11) revealed an observed pre-to-post-increase in pass rate (mean) from 66.7% to 70.4%. For the outcome indicators (O12–O14), the observed pass rate (mean) decreased from 75.2% in the pre-intervention phase to 72.4% post intervention (Figure 4). Estimated values for the complete study population are presented in Table 3, showing a small, statistically significant increase in summary pass rates for the process indicators. Unadjusted pass rates for each participating centre are presented in Additional file 2, showing no statistically significant differences between the pre- and post-intervention phases.
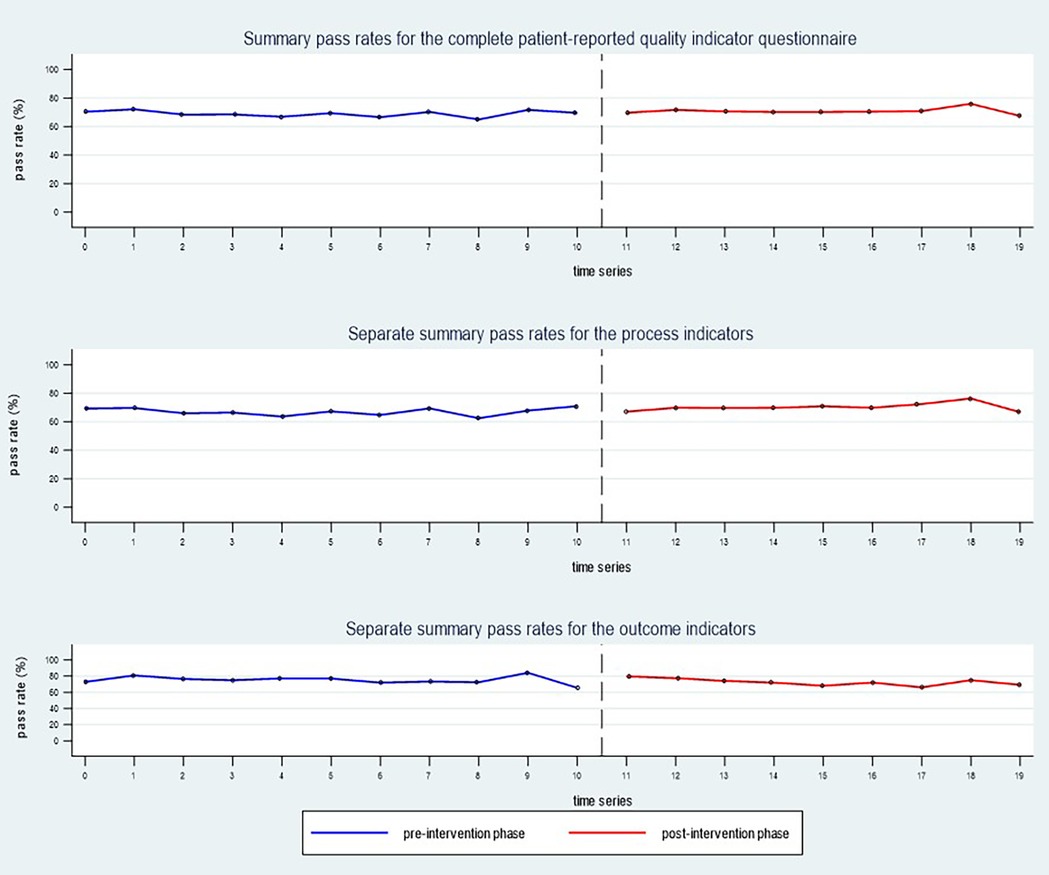
Figure 4. The observed summary pass rates (mean) for the whole study sample (n = 16 rehabilitation centres) during the pre-intervention phase (blue line) compared to the post-intervention phase (red line).
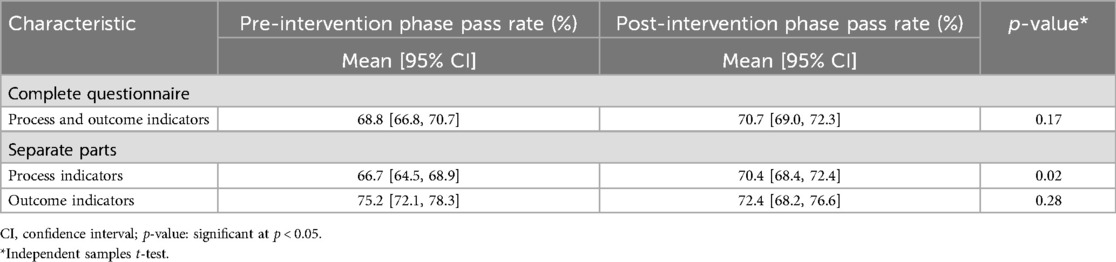
Table 3. Patient-reported pass rate changes from pre- to post-intervention phase, addressing process and/or outcome quality indicators.
In the mixed models analyses, we found that the trend in slope (time variable changes) was stable and almost unchanged, while the trend in intercept (pass rate changes) reflected a small level-change from pre- to post-intervention phase. However, the 95% CIs included the null value, and the adjusted mean differences between the pre- and post-intervention phases were not statistically significant (Table 4).
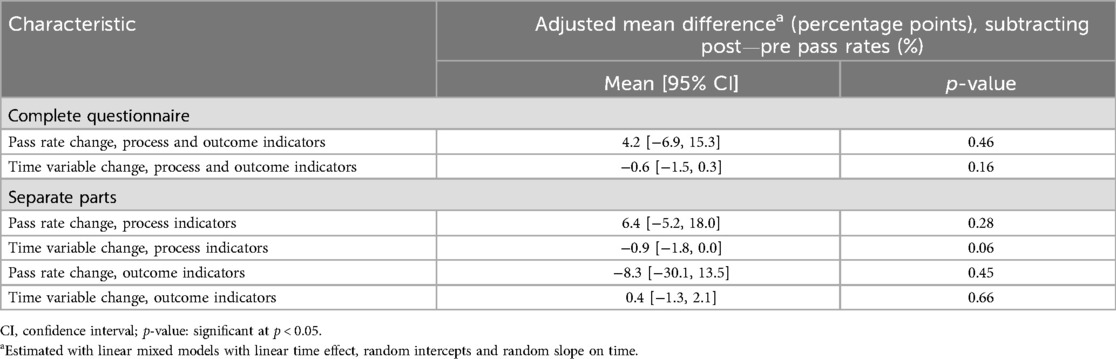
Table 4. Adjusted mean differences in patient-reported pass rate and time variable changes between the pre- and post-intervention phase, addressing process and/or outcome quality indicators.
Results from the fully adjusted individual-level model showed similar small, non-significant results. The change in pass rates (Δ = post-pre) for the complete questionnaire had a mean difference of 2.6 percentage points (95% CI −2.7, 8.1; p = 0.34). For process indicators alone, the mean difference was 2.1 percentage points (95% CI −4.2, 8.3; p = 0.51), while outcome indicators showed a mean difference of −4.3 percentage points (95% CI −6.1, 15.7; p = 0.42).
The first likelihood-ratio test indicated that a random-intercept model, including centre specific intercepts and time slopes, showed a statistically significant improvement over a fixed-effects-only model. However, a more complex intercept-and-slope model did not show a statistically significant improvement compared to the intercept-only model. The next likelihood-ratio test indicated that the model with linear-spline trend, simulating a potential delay in the intervention effect, did not give any better fit to the data. The final likelihood-ratio test including the option for autoregressive errors in the more complex model, gave statistically non-significant results. Hence, the pass rates' intercepts varied from place to place, but the time gradient did not work differently in different institutions. In the complete multicentre study population, the audit and feedback intervention did not lead to any increase in rehabilitation quality over time.
At the level of single indicators, the observed pass rates increased from pre- to post-intervention phase for each of the process indicators (P01–P11), by 0.7–5.2 percentage points. For the single outcome indicators (O12–O14), we observed a reduction in pass rates by 2.3–2.8 percentage points (Figure 5).
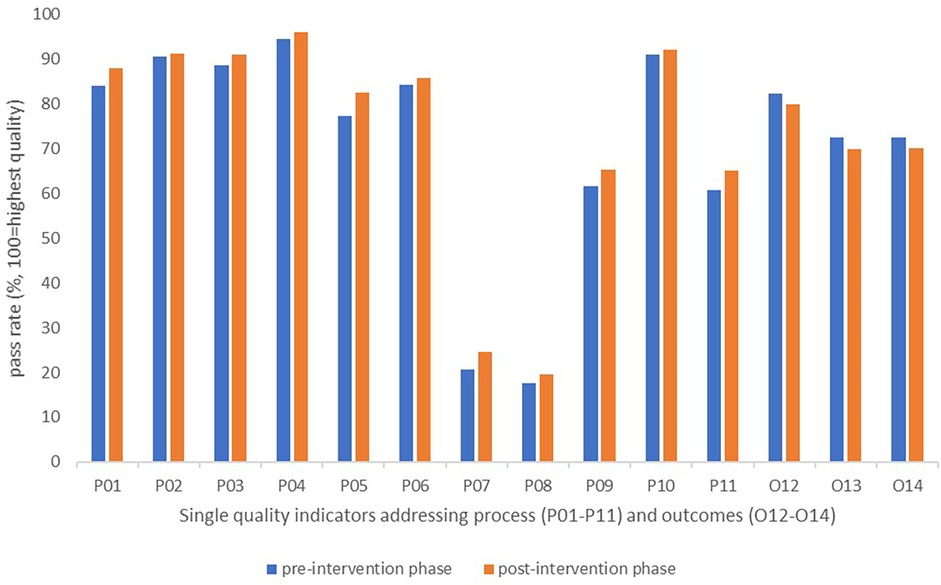
Figure 5. Changes in pass rates for single quality indicators reported by patients during the pre- and post-intervention phases.
Although small improvements occurred for the process dimension, the audit results after feedback remained lowest for process indicators targeting involvement of next of kin and/or external services in meetings with the rehabilitation team (P07 and P08). A persistent potential for improvement was also observed after feedback for the indicators targeting the use of a written plan for follow-up, and the involvement of external services in development of such plans (P09 and P11) (Figure 5).
After feedback, we also observed a persistent need for improvements targeting written procedures, because the pass rates remained low (<45%) for structure indicators targeting involvement of next of kin and/or external services (S06 and S07), and evaluation of progress after 3–6 months on goal attainment, function, and health-related quality of life (S13, S16, S19).
In this multicentre study, the audit and feedback intervention did not increase the quality of rehabilitation services, as measured by changes in quality indicator pass rates encompassing health service structures, processes and patient outcomes. The mixed model analyses revealed that the mean changes in patient-reported QIs between the pre- and post-intervention phase were small and statistically non-significant. The expected impact model, illustrating a gradually higher quality of rehabilitation following a brief lag after the feedback to institution managers and clinical team members, was not confirmed.
We consider the data collection for the audit to be feasible, with all institutions (n = 16) providing required structure indicator data pre- and post the feedback intervention, and over 97% of the participants responding to the process and outcome indicator questionnaire. Consequently, the study gave managers and team members a structured opportunity to critically reflect on their clinical rehabilitation practice, as experienced by their patients, and also to assess whether the intended delivery was clearly outlined in institution-specific written procedures for daily use. The importance of such opportunities to evaluate the quality of underlying structures and current practice performances have also been valued by health professionals in other audit and feedback studies (39, 40). However, gaining insight into their own service quality and benchmarking against relevant others does not guarantee that managers or clinical team members automatically will translate this into targeted quality improvement actions (40, 41). While attention to a discrepancy between actual and recommended performance constitutes the core mechanism of audit and feedback interventions, the subsequent response actions at each centre must align with local context and resources available for quality improvement (15, 39, 41).
The managers and clinical team members in our study were encouraged to autonomously utilize the audit results and implement actions applicable and feasible at each centre. Autonomous feedback response has also been used in previous audit and feedback interventions, without detailed instructions to the recipients of the feedback about how to change their practice (12, 15, 39). Some institutions likely have an established system for continuous learning and quality improvement, enabling them to autonomously develop their feedback responses to target the analysed pass rate results, and implement actionable improvements (42, 43). However, it takes time to build cultures for learning and improvement within the health system, and the field of rehabilitation is encouraged to pay more attention to the quality of care (42, 44). In a large, cluster-randomized trial from The Netherlands, an audit and feedback intervention yielded no improvement of multidisciplinary, clinical performance measured by quality indicators for cardiac rehabilitation (45). This aligns with our findings, although the Dutch audit and feedback intervention included additional components such as outreach visits, repeated feedback reports, and both measurement and adjustment of local goal setting and action plans for quality improvement (46). Presumably, the team members struggled to translate their intentions into concrete actions. Organizational barriers may also have contributed to the ineffectiveness, such as limited organizational readiness for change, insufficient time, competing priorities, and suboptimal local capacity, skills or knowledge on how to improve their service delivery (45, 47–49). In particular when institutions are granted autonomy in responding to feedback, they may need a longer time interval to plan and implement their improvement initiatives (39). This highlights the need for a deeper understanding of how to establish local quality improvement goals, and effectively accomplish the necessary actions to achieve them within a local rehabilitation setting (45, 47).
The lack of improvement observed in our study may also be attributed to the complexity of rehabilitation as an intervention. It has been suggested that audit and feedback tend to be more effective for simpler changes in healthcare performance compared to more complex interventions, such as rehabilitation (12, 15). However, for complex interventions in particular, institutions should identify the distinct interacting components of the entire rehabilitation process, establish written procedures for implementing them within their specific context, and evaluate how health professionals practice the intervention in that clinical setting (50, 51). The QI set used as audit in our study is designed to evaluate the complex rehabilitation intervention through measurable and distinct elements encompassing written procedures, clinical processes, and patient outcomes (20). Indicators related to structures and processes are often more within the control of managers and team members, providing greater opportunities for quality improvement compared to those related to patient outcomes (52–54). Despite this, we observed only modest improvements in structure and process pass rates, and the estimated values of these changes were not statistically significant. Although we did not examine reasons for improvement or lack thereof, it is possible that our feedback recipients perceived the total number of structure and process indicators as overwhelming. Such perceptions may have diminished their motivation to focus on enhancing the quality in fewer, prioritized areas of rehabilitation delivery. Other researchers and behaviour change theories propose that audit and feedback interventions are more likely to be effective when recipients are highly motivated and can identify an appropriate number of achievable targets (12, 15, 52).
Receiving institution-specific audit results, accompanied by benchmark comparisons, was anticipated to improve the institutions' ability to take actionable steps, particularly in cases of low pass rates. Contrary to this assumption, we found no significant improvement in the indicators with the greatest potential for improvement. Although rehabilitation is recognized as a longitudinal trajectory spanning across levels of care, the post-intervention pass rates remained low for indicators related to key aspects of follow-up. These include the development of written plans for follow-up, involvement of next of kin and external services, and the evaluation of progress in patients' goal attainment, functional outcomes, and health-related quality of life during the follow-up period. Our results align with previous research indicating that feedback recipients do not always target indicators with obvious room for improvement (47, 55). In these studies, health professionals overlooked the potential for improvement, either because they considered the pass rates sufficiently high, or they did not regard the indicator as an essential part of rehabilitation quality. Other reported reasons include the perceived infeasibility of improving the indicator, or the lack of organizational support to address the area reflected by the indicator (47, 55). Organizational support is likely to be particularly critical in the area of follow-up, where immediate improvements may be difficult and beyond the control of clinical team members. Instead, progress in this area often depends on decisions made by managers across levels of care.
Participating teams in our study reported a range of outcomes, from minimal or no improvement to more substantial gains in pass rates. This variation may partly be explained by the types of benchmarking used. Previous research suggests that benchmarks, such as the QI set's ideal pass rate of 100% and overall institutional average, may have been too high for some teams with low audit results, particularly those with limited prior experience in quality improvement efforts (56). Conversely, teams with high audit results might have dismissed the feedback if their performance was already at or above the average. For such teams, benchmarking solely against the ideal pass rate of 100% or the top 10% might be more appropriate (56). A review on audit design recommends incorporating tailored feedback messages and setting performance targets at different levels to better address the specific needs of individual institutions in future audit and feedback interventions (56).
Strengths of this study include its robust quasi-experimental ITS design, which is regarded as a valuable tool for quality improvement initiatives (27). The potential of a gradual implementation phase was included in the impact model, as well as in the mixed model analyses (26). The study utilized 20 assessment points, each spanning a 3 weeks interval, deemed sufficient for capturing potential improvements within the predefined data collection period of the RehabNytte project. The study's power may have been limited due to the adjustment in number of assessment points, with 11 conducted before and 9 after the intervention, deviating from the originally planned equal distribution. Additionally, the power may have been further constrained by a final sample size smaller than the planned recruitment target of 4,000 participants, which was intended to ensure a sufficient number of participants per assessment point. Seasonality, indicated by the uneven distribution of spring and summer months before and after the feedback session, along with concurrent events such as the interruption by the COVID-19 pandemic, may have introduced bias into the results (26). Because patient-reported responses to the quality indicators were not assessed at discharge, there is a potential for recall bias. However, the first at-home measurement time point (T3) was preferred, as the indicators addressed not only the inpatient stay but also the use of rehabilitation plans and the involvement of external services during the follow-up period. Finally, although six centres provided data from multiple teams, the patient data were collected only at the centre level, making it challenging to attribute patient data to specific teams. A more thorough planning of this aspect could have improved the study.
Although the QI set is not yet widely adopted, it strengthens the study that this audit tool has been systematically designed for multidisciplinary rehabilitation services, drawing on evidence from the literature and informed by expert consensus (20). We intentionally designed the feedback session to be straightforward and short, allowing participating institutions to integrate their feedback responses into their existing quality improvement routines. Our study did not examine the acceptability of the feedback reports or how the reports were utilized by institution managers and clinical team members, as the available time and funding limited the study's scope. However, incorporating a cyclic and iterative feedback process could have strengthened the intervention in this study (14).
Using the ITS approach, we evaluated an audit and feedback intervention aimed at improving the quality of multidisciplinary rehabilitation services in a heterogeneous secondary healthcare setting in Norway. Despite continuous auditing of quality indicators and providing feedback to participating institutions, the intervention did not result in significant improvements in the structure, process, or outcome dimensions of service quality. Our study revealed variations in service quality across institutions, also during the post-intervention phase. We therefore encourage future research to focus on refining feedback mechanisms and quality improvement processes. In particular, we advocate for deeper exploration into the development of locally defined performance goals, behaviours, and actions to optimize the quality of rehabilitation services.
The datasets presented in this article are not readily available because availability is restricted to parts with permission from the Norwegian Regional Committee of Medical Research Ethics. Requests to access the datasets should be directed to Anne-Lene Sand-Svartrud, YW5uZS1sZW5lLnN2YXJ0cnVkQGRpYWtvbnN5ay5ubw==.
The studies involving humans were approved by Norwegian Regional Committee for Medical Reserach Ethics (2018/1645/REK Sout-East A). The studies were conducted in accordance with the local legislation and institutional requirements. The participants provided their written informed consent to participate in this study.
A-LS-S: Conceptualization, Data curation, Formal analysis, Methodology, Software, Supervision, Validation, Visualization, Writing – original draft, Writing – review & editing. HD: Conceptualization, Methodology, Supervision, Validation, Writing – review & editing. JF: Conceptualization, Investigation, Resources, Validation, Writing – review & editing. HF: Conceptualization, Investigation, Resources, Validation, Writing – review & editing. EI: Conceptualization, Investigation, Resources, Validation, Writing – review & editing. HM: Conceptualization, Investigation, Resources, Validation, Writing – review & editing. JS: Conceptualization, Formal analysis, Methodology, Software, Validation, Writing – review & editing. RM: Conceptualization, Data curation, Funding acquisition, Investigation, Project administration, Supervision, Validation, Writing – review & editing. IK: Conceptualization, Funding acquisition, Project administration, Supervision, Validation, Writing – review & editing.
The author(s) declare financial support was received for the research, authorship, and/or publication of this article. This work was supported by FoU Virke Rehabilitation, and REMEDY - Centre for treatment of Rheumatic and Musculoskeletal Diseases (grant no. 328657). The funder had no role in design of the project, in collection, analysis, or interpretation of data, or in writing the manuscript.
The authors would like to thank all participating patients for their contribution to the original data. Further, we thank the involved patient research partners, as well as the collaborating institutions in the RehabNytte Consortium: CatoSenteret Rehabilitation Centre; Evjeklinikken Rehabilitation Centre; Helsepartner Rehabilitation Centre; Hernes Occupational Rehabilitation Centre; HLF Rehabilitation Centre; Montebello Rehabilitation Centre; Muritunet Rehabilitation Centre; NKS Helsehus Rehabilitation Centre; Ravneberghaugen Rehabilitation Centre; Røde Kors Haugland Rehabilitation Centre; Røysumtunet Rehabilitation Centre; Selli Rehabilitation Centre; Skogli Health- and Rehabilitation Centre; Sørlandet Rehabilitation Centre; Viker Helse; Vikersund Rehabilitation Centre; and Åstveit Rehabilitation Centre. We would like to thank the Norwegian National Centre for Occupational Rehabilitation (NKARR); Regional Centre for Knowledge Translation in Rehabilitation (RKR); Virke Rehab; the Norwegian Federation of Organisations of Disabled People (FFO); the Health Services Research and Innovation Unit at Diakonhjemmet Hospital, and REMEDY - Centre for Treatment of Rheumatic and Musculoskeletal Diseases. Lastly, a warm gratitude to Mari Klokkerud for her pivotal role in establishing the RehabNytte Cohort study and shaping its central research questions.
The authors declare that the research was conducted in the absence of any commercial or financial relationships that could be construed as a potential conflict of interest.
The author(s) declare that no Generative AI was used in the creation of this manuscript.
All claims expressed in this article are solely those of the authors and do not necessarily represent those of their affiliated organizations, or those of the publisher, the editors and the reviewers. Any product that may be evaluated in this article, or claim that may be made by its manufacturer, is not guaranteed or endorsed by the publisher.
The Supplementary Material for this article can be found online at: https://www.frontiersin.org/articles/10.3389/fresc.2025.1564346/full#supplementary-material
QI, quality indicator; T1, at admission; T2, at discharge; T3, 3 months after admission; T4, 6 months after admission; T5, 12 months after admission; S01–S19, structure indicators; P01–P11, process indicators; O12–O14, outcome indicators; ITS, interrupted time series; PROMs, patient-reported outcome measures; CI, confidence interval; SD, standard deviation.
1. World Health Organization, Regional Office for Europe. The need for rehabilitation services in the WHO European Region (2022). World Health Organization. Regional Office for Europe. Copenhagen. Denmark.
2. Jesus TS, Landry MD, Hoenig H. Global need for physical rehabilitation: systematic analysis from the global burden of disease study 2017. Int J Environ Res Public Health. (2019) 16(6):980. doi: 10.3390/ijerph16060980
3. Amatya B, Khan F, Galea M. Effectiveness of rehabilitation interventions for people with multiple sclerosis - a Cochrane review summary with commentary. NeuroRehabilitation. (2019) 45(3):429–31. doi: 10.3233/NRE-189010
4. Loetscher T, Potter KJ, Wong D, das Nair R. Cognitive rehabilitation for attention deficits following stroke. Cochrane Database Syst Rev. (2019) 2019(11):CD002842. doi: 10.1002/14651858.CD002842.pub3
5. Berdal G, Bø I, Dager TN, Dingsør A, Eppeland SG, Hagfors J, et al. Structured goal planning and supportive telephone follow-up in rheumatology care: results from a pragmatic, stepped-wedge, cluster-randomized trial. Arthritis Care Res. (2018) 70(11):1576–86. doi: 10.1002/acr.23520
6. Berdal G, Sand-Svartrud AL, Linge AD, Aasvold AM, Tennebø K, Eppeland SG, et al. Bridging gaps across levels of care in rehabilitation of patients with rheumatic and musculoskeletal diseases: results from a stepped-wedge cluster randomized controlled trial. Clin Rehabil. (2023) 37(9):1153–77. doi: 10.1177/02692155231153341
7. Kamenov K, Mills JA, Chatterji S, Cieza A. Needs and unmet needs for rehabilitation services: a scoping review. Disabil Rehabil. (2019) 41(10):1227–37. doi: 10.1080/09638288.2017.1422036
8. The Norwegian Health Directorate. Helsedirektoratet: Rehabilitering, habilitering, individuell plan og koordinator. Nasjonal veileder. [White paper on rehabilitation, habilitation, individual rehabilitation plan and coordinator, The 92 Norwegian Health Directorate, available in Norwegian: Rehabilitering, habilitering, individuell plan og koordinator - Helsedirektoratet, last updated: July 2, 2020].
9. Prp IS-2975. Evaluering av opptrappingsplan for habilitering og rehabilitering (2017-2019) [Evaluation of the “habilitation and rehabilitation escalation plan”. The Norwegian Directorate of Health] (2020). KPMG on behalf of the Norwegian Directorate of Health.
10. Rapport om HelseOmsorg21. Et kunnskapssystem for bedre helse. Nasjonal forsknings- og innovasjonsstrategi for helse og omsorg. [The health&care21 strategy. Research and innovation in health and care] (2014). Norwegian: Microsoft Word - Corrigendum_21.8._hgn.docx. Available online at: helseomsorg21.no
11. World Health Organization. WHO guidelines approved by the guidelines review committee (2011). In World report on disability 2011. World Health Organization.
12. Ivers NM, Grimshaw JM, Jamtvedt G, Flottorp S, O'Brien MA, French SD, et al. Growing literature, stagnant science? Systematic review, meta-regression and cumulative analysis of audit and feedback interventions in health care. J Gen Intern Med. (2014) 29(11):1534–41. doi: 10.1007/s11606-014-2913-y
13. The Health Foundation. Measuring Patient Experience: Evidence Scan. London: The Health Foundation (2013).
14. Brown B, Gude WT, Blakeman T, van der Veer SN, Ivers N, Francis JJ, et al. Clinical performance feedback intervention theory (CP-FIT): a new theory for designing, implementing, and evaluating feedback in health care based on a systematic review and meta-synthesis of qualitative research. Implement Sci. (2019) 14(1):40. doi: 10.1186/s13012-019-0883-5
15. Jamtvedt G, Flottorp S, Ivers N. Chapter 10: Audit and feedback as a quality strategy. In: Busse R, Klazinga N, Panteli D, Quentin W, editors. Improving Healthcare Quality in Europe: Characteristics, Effectiveness and Implementation of Different Strategies. Copenhagen: European Observatory on Health Systems and Policies (2019).
16. Campbell SM. Improving the quality of health care: research methods used in developing and applying quality indicators in primary care. Br Med J. (2003) 326(7393):816–9. doi: 10.1136/bmj.326.7393.816
17. Mahmood SB, Lesuis NMD, van Tuyl LHDP, van Riel PMDP, Landewé RMDP. Quality in rheumatoid arthritis care. Best Pract Res Clin Rheumatol. (2015) 29(4-5):664–79. doi: 10.1016/j.berh.2015.09.009
18. Mainz J. Defining and classifying clinical indicators for quality improvement. Int J Qual Health Care. (2003) 15(6):523–30. doi: 10.1093/intqhc/mzg081
19. Lawrence M, Olesen F. Indicators of quality in health care. Eur J Gen Pract. (1997) 3(3):103–8. doi: 10.3109/13814789709160336
20. Johansen I, Klokkerud M, Anke A, Børke JB, Glott T, Hauglie U, et al. A quality indicator set for use in rehabilitation team care of people with rheumatic and musculoskeletal diseases; development and pilot testing. BMC Health Serv Res. (2019) 19(1):265. doi: 10.1186/s12913-019-4091-4
21. Gleeson H, Calderon A, Swami V, Deighton J, Wolpert M, Edbrooke-Childs J. Systematic review of approaches to using patient experience data for quality improvement in healthcare settings. BMJ Open. (2016) 6(8):e011907. doi: 10.1136/bmjopen-2016-011907
22. Jesus TS, Papadimitriou C, Pinho CS, Hoenig H. Key characteristics of rehabilitation quality improvement publications: scoping review from 2010 to 2016. Arch Phys Med Rehabil. (2018) 99(6):1141–8.e4. doi: 10.1016/j.apmr.2017.08.491
23. National Library of Medicine (US). RehabNytte – a study of rehabilitation processes in specialized care in Norway (2018) [last updated February 2023]. Available online at: https://www.clinicaltrials.gov/study/NCT03764982?term=rehabNytte&rank=1
24. Bravata DM, Sundaram V, Lewis R, Gienger A, Gould MK, McDonald KM, et al. Closing the quality gap: a critical analysis of quality improvement strategies (vol. 5: asthma care) (2010).
25. Sand-Svartrud AL, Berdal G, Azimi M, Bø I, Dager TN, Eppeland SG, et al. A quality indicator set for rehabilitation services for people with rheumatic and musculoskeletal diseases demonstrates adequate responsiveness in a pre-post evaluation. BMC Health Serv Res. (2021) 21(1):164. doi: 10.1186/s12913-021-06164-2
26. Bernal JL, Cummins S, Gasparrini A. Interrupted time series regression for the evaluation of public health interventions: a tutorial. Int J Epidemiol. (2017) 46(1):348–55. doi: 10.1093/ije/dyw098
27. Hategeka C, Ruton H, Karamouzian M, Lynd LD, Law MR. Use of interrupted time series methods in the evaluation of health system quality improvement interventions: a methodological systematic review. BMJ Glob Health. (2020) 5(10):e003567. doi: 10.1136/bmjgh-2020-003567
28. Ilmarinen J. Work ability–a comprehensive concept for occupational health research and prevention. Scand J Work Environ Health. (2009) 35(1):1–5. doi: 10.5271/sjweh.1304
29. Lundin A, Leijon O, Vaez M, Hallgren M, Torgén M. Predictive validity of the work ability index and its individual items in the general population. Scand J Public Health. (2017) 45(4):350–6. doi: 10.1177/1403494817702759
30. Ahlstrom L, Grimby-Ekman A, Hagberg M, Dellve L. The work ability index and single-item question: associations with sick leave, symptoms, and health–a prospective study of women on long-term sick leave. Scand J Work Environ Health. (2010) 36(5):404–12. doi: 10.5271/sjweh.2917
31. Hawker GA, Mian S, Kendzerska T, French M. Measures of adult pain: visual analog scale for pain (VAS pain), numeric rating scale for pain (NRS pain), mcgill pain questionnaire (MPQ), short-form mcgill pain questionnaire (SF-MPQ), chronic pain grade scale (CPGS), short form-36 bodily pain scale (SF-36 BPS), and measure of intermittent and constant osteoarthritis pain (ICOAP). Arthritis Care Res. (2011) 63(Suppl 11):S240–52. doi: 10.1002/acr.20543
32. Karcioglu O, Topacoglu H, Dikme O, Dikme O. A systematic review of the pain scales in adults: which to use? Am J Emerg Med. (2018) 36(4):707–14. doi: 10.1016/j.ajem.2018.01.008
33. Kamper SJ, Maher CG, Mackay G. Global rating of change scales: a review of strengths and weaknesses and considerations for design. J Man Manip Ther. (2009) 17(3):163–70. doi: 10.1179/jmt.2009.17.3.163
34. Tubach F, Ravaud P, Baron G, Falissard B, Logeart I, Bellamy N, et al. Evaluation of clinically relevant states in patient reported outcomes in knee and hip osteoarthritis: the patient acceptable symptom state. Ann Rheum Dis. (2005) 64(1):34–7. doi: 10.1136/ard.2004.023028
35. Maksymowych WP, Richardson R, Mallon C, van der Heijde D, Boonen A. Evaluation and validation of the patient acceptable symptom state (PASS) in patients with ankylosing spondylitis. Arthritis Rheum. (2007) 57(1):133–9. doi: 10.1002/art.22469
36. Salaffi F, Carotti M, Gutierrez M, Di Carlo M, De Angelis R. Patient acceptable symptom state in self-report questionnaires and composite clinical disease index for assessing rheumatoid arthritis activity: identification of cut-off points for routine care. Biomed Res Int. (2015) 2015:930756. doi: 10.1155/2015/930756
37. EuroQol Office. EQ-5D-5l (2017) [updated 30 November 2021]. Available online at: https://euroqol.org/eq-5d-instruments/eq-5d-5l-about/ (Accessed July 05, 2023).
38. EuroQol_Research_Foundation. EQ-5D-5l user guide 2019 (2019). Available online at: https://euroqol.org/publications/user-guides/ (Accessed July 05, 2023).
39. Parsons JA, Wigle J, Zenlea I, Ivers N, Mukerji G, Landry A, et al. Bridging the gap: a qualitative process evaluation from the perspectives of healthcare professionals of an audit-and-feedback-based intervention to improve transition to adult care for young people living with type 1 diabetes. BMC Health Serv Res. (2024) 24(1):1276. doi: 10.1186/s12913-024-11734-1
40. Scholte M, Neeleman-van der Steen CW, van der Wees PJ, Nijhuis-van der Sanden MW, Braspenning J. The reasons behind the (non)use of feedback reports for quality improvement in physical therapy: a mixed-method study. PLoS One. (2016) 11(8):e0161056. doi: 10.1371/journal.pone.0161056
41. Wells S, Tamir O, Gray J, Naidoo D, Bekhit M, Goldmann D. Are quality improvement collaboratives effective? A systematic review. BMJ Qual Saf. (2018) 27(3):226–40. doi: 10.1136/bmjqs-2017-006926
42. Kruk ME, Gage AD, Arsenault C, Jordan K, Leslie HH, Roder-DeWan S, et al. High-quality health systems in the sustainable development goals era: time for a revolution. Lancet Glob Health. (2018) 6(11):e1196–252. doi: 10.1016/s2214-109x(18)30386-3
43. World Health Organization. Handbook for National Quality Policy and Strategy: A Practical Approach for Developing Policy and Strategy to Improve Quality of Care. Geneva: World Health Organization (2018).
44. Jesus TS, Hoenig H. Crossing the global quality chasm in health care: where does rehabilitation stand? Arch Phys Med Rehabil. (2019) 100(11):2215–7. doi: 10.1016/j.apmr.2019.07.001
45. Gude WT, van Engen-Verheul MM, van der Veer SN, Kemps HM, Jaspers MW, de Keizer NF, et al. Effect of a web-based audit and feedback intervention with outreach visits on the clinical performance of multidisciplinary teams: a cluster-randomized trial in cardiac rehabilitation. Implement Sci. (2016) 11(1):160. doi: 10.1186/s13012-016-0516-1
46. van Engen-Verheul MM, de Keizer NF, van der Veer SN, Kemps HM, Scholte op Reimer WJ, Jaspers MW, et al. Evaluating the effect of a web-based quality improvement system with feedback and outreach visits on guideline concordance in the field of cardiac rehabilitation: rationale and study protocol. Implement Sci. (2014) 9:780. doi: 10.1186/s13012-014-0131-y
47. Gude WT, van Engen-Verheul MM, van der Veer SN, de Keizer NF, Peek N. How does audit and feedback influence intentions of health professionals to improve practice? A laboratory experiment and field study in cardiac rehabilitation. BMJ Qual Saf. (2017) 26(4):279–87. doi: 10.1136/bmjqs-2015-004795
48. Roos-Blom MJ, Gude WT, de Jonge E, Spijkstra JJ, van der Veer SN, Peek N, et al. Impact of audit and feedback with action implementation toolbox on improving ICU pain management: cluster-randomised controlled trial. BMJ Qual Saf. (2019) 28(12):1007–15. doi: 10.1136/bmjqs-2019-009588
49. Gude WT, Roos-Blom MJ, van der Veer SN, Dongelmans DA, de Jonge E, Peek N, et al. Facilitating action planning within audit and feedback interventions: a mixed-methods process evaluation of an action implementation toolbox in intensive care. Implement Sci. (2019) 14(1):90. doi: 10.1186/s13012-019-0937-8
50. Skivington K, Matthews L, Simpson SA, Craig P, Baird J, Blazeby JM, et al. A new framework for developing and evaluating complex interventions: update of medical research council guidance. Br Med J. (2021) 374:n2061. doi: 10.1136/bmj.n2061
51. Sand-Svartrud AL, Berdal G, Aanerud GJ, Azimi M, Bjørnerud AM, Nygaard Dager T, et al. Delivery of a quality improvement program in team-based rehabilitation for patients with rheumatic and musculoskeletal diseases: a mixed methods study. Disabil Rehabil. (2024) 46(8):1602–14. doi: 10.1080/09638288.2023.2204247
52. Brehaut JC, Colquhoun HL, Eva KW, Carroll K, Sales A, Michie S, et al. Practice feedback interventions: 15 suggestions for optimizing effectiveness. Ann Intern Med. (2016) 164(6):435–41. doi: 10.7326/m15-2248
53. van der Veer SN, de Keizer NF, Ravelli AC, Tenkink S, Jager KJ. Improving quality of care. A systematic review on how medical registries provide information feedback to health care providers. Int J Med Inform. (2010) 79(5):305–23. doi: 10.1016/j.ijmedinf.2010.01.011
54. Sand-Svartrud AL, Berdal G, Azimi M, Bø I, Dager TN, Eppeland SG, et al. Associations between quality of health care and clinical outcomes in patients with rheumatic and musculoskeletal diseases: a rehabilitation cohort study. BMC Musculoskelet Disord. (2022) 23(1):357. doi: 10.1186/s12891-022-05271-3
55. Gude WT, van der Veer SN, van Engen-Verheul MM, de Keizer NF, Peek N. Inside the black box of audit and feedback: a laboratory study to explore determinants of improvement target selection by healthcare professionals in cardiac rehabilitation. Stud Health Technol Inform. (2015) 216:424–8.26262085
Keywords: quality of health care, rehabilitation, quality indicators, feedback, clinical audit
Citation: Sand-Svartrud A-L, Dagfinrud H, Fossen J, Framstad H, Irgens EL, Morvik HK, Sexton J, Moe RH and Kjeken I (2025) Impact of provider feedback on quality improvement in rehabilitation services: an interrupted time series analysis. Front. Rehabil. Sci. 6:1564346. doi: 10.3389/fresc.2025.1564346
Received: 21 January 2025; Accepted: 24 February 2025;
Published: 6 March 2025.
Edited by:
Melanie Penner, University of Toronto, CanadaReviewed by:
Alessandro Giustini, University San Raffaele, ItalyCopyright: © 2025 Sand-Svartrud, Dagfinrud, Fossen, Framstad, Irgens, Morvik, Sexton, Moe and Kjeken. This is an open-access article distributed under the terms of the Creative Commons Attribution License (CC BY). The use, distribution or reproduction in other forums is permitted, provided the original author(s) and the copyright owner(s) are credited and that the original publication in this journal is cited, in accordance with accepted academic practice. No use, distribution or reproduction is permitted which does not comply with these terms.
*Correspondence: Anne-Lene Sand-Svartrud, YW5uZS1sZW5lLnN2YXJ0cnVkQGRpYWtvbnN5ay5ubw==
†ORCID:
Anne-Lene Sand-Svartrud
orcid.org/0000-0001-6341-9333
Hanne Dagfinrud
orcid.org/0000-0001-7097-2962
Heidi Framstad
orcid.org/0009-0002-6803-0823
Eirik Lind Irgens
orcid.org/0000-0003-2941-8796
Rikke Helene Moe
orcid.org/0000-0001-7601-5346
Ingvild Kjeken
orcid.org/0000-0002-3971-2852
Disclaimer: All claims expressed in this article are solely those of the authors and do not necessarily represent those of their affiliated organizations, or those of the publisher, the editors and the reviewers. Any product that may be evaluated in this article or claim that may be made by its manufacturer is not guaranteed or endorsed by the publisher.
Research integrity at Frontiers
Learn more about the work of our research integrity team to safeguard the quality of each article we publish.