- University of Montana, The Rural Institute for Inclusive Communities, Missoula, MT, United States
There is a noteworthy gap in the literature regarding disability in rural American Indian/Alaskan Native (AI/AN) communities. This is significant, as many tribal lands are in rural areas and AI/AN individuals experience some of the highest prevalence rates of disability. To address this gap, we used descriptive statistics to examine the intersection of AI/AN and rurality in disability prevalence. Results indicate that rural counties have the highest prevalence of disability for both Whites and AI/ANs and that AI/ANs experience higher prevalence rates than Whites. However, further analysis indicates that county makeup (counties with high prevalence of AI/AN in the general population) moderated this relationship. Specifically, rural counties with populations of at least 5% AI/AN had lower prevalence of AI/AN disability compared to counties with populations with less than 5% AI/AN. Further analysis is needed to unpack this relationship, but results might suggest that AI/AN communities may feature resilient and protective attributes, moderating the amount of disability experienced in rural AI/AN communities.
Introduction
Disabled people1 have historically been stigmatized and marginalized throughout the United States (1). While important legislation such at the Americans with Disabilities Act, the Rehabilitation Act, and the Olmstead Decision have led to significant progress in increasing disability awareness and promoting full inclusion into American society (2), inequities in access and inclusion persist (1, 3). Marginalization is compounded for minoritized groups (e.g., American Indians/Alaskan Natives, Blacks, Hispanics) who also experience disability (4). In fact, data from four national population surveys conducted in 2015 revealed that minoritized individuals—such as individuals of an ethnic or racial minority—report disability at disproportionately higher rates than White individuals (4).
Despite increased disability awareness and literature regarding disparities faced by individuals with disabilities, there is a significant knowledge gap regarding disability among American Indian/Alaskan Natives (AI/ANs), particularly those living in rural areas. U.S. Census data indicate that 16% of AI/ANs report disability across counties, and that prevalence rates increase as counties become more rural (5). This finding aligns with descriptive statistics that show individuals in rural counties have higher prevalence of disability across racial groups, and that the most rural (non-core) counties have higher prevalence of disability, compared to less rural (micropolitan) and urban (metropolitan) counties (5). While the majority (63.5%) of AI/AN individuals reside in urban areas (6), the remaining rural population represents nearly one million (982,517) people with 17% (nearly 170,000) reporting disability (6).
The limited research looking at the intersection of AI/AN identity, disability, and rurality has focused on health outcomes, rather than environmental factors (7). This is problematic because disability is shaped by the interaction between functional limitation (e.g., difficulty walking, grasping, or concentrating) and environmental factors (e.g., community characteristics, access to resources, social stigmatization, and exclusionary policies). While symptoms of specific health conditions can result in a variety of functional limitations, it is the interaction of those limitations with the surrounding environment that produces the incidence and severity of disability (6, 7).
Community characteristics (e.g., sociodemographic and access factors) that rural AI/AN individuals encounter are critical to understanding the disability experience (8), and shape the need for studies examining disability disparity from a community-specific perspective. Of note, Henning-Smith et al. (9) examined premature death rates and the intersection of rurality and race in AI/AN, White, and Black communities from a county-level perspective. The authors found that rural counties with a majority of AI/AN residents experienced significantly higher premature death rates, even after adjusting for community-level covariates. However, disability rates were not examined.
We explored the prevalence of disability for the AI/AN population living in rural communities. Given past findings that AI/AN populations report higher levels of disability and disproportionately live in more rural areas—which also have higher prevalence of disability (5)—we hypothesized that there would be a positive association between AI/AN prevalence and AI/AN disability prevalence rates across geographic locations.
Methods
Sample
The study sample consisted of 3,220 counties across the United States and the unit of analysis was at the county vs. individual level.
Procedure
All data was from the American Community Survey 5-year estimates (2015–2019) (6). The American Community Survey is a cross sectional survey operated by the US Census Bureau. It uses an annual rolling sample, collecting data on 2.5% of the US population per year for an aggregated sample of 12.5% of the US population in the 5-year estimates. A 2015 report found that while there is increased room for estimate error for small geographies, the coefficients of variation for AI/AN communities were similar to others of similar sizes and deemed reliable (10).
Race/ethnicity was defined as the percentage of the county population of each racial category based on ACS data reports. We used AI/AN and White racial categories for these analyses.
We accessed 2018 cartographic boundary shapefiles for geographic analyses (counties, states, and tribal areas) from the US Census Bureau's geography downloads.
We created an AI/AN county makeup variable to analyze AI/AN populations more closely. This was a binary coded variable, such that counties with ≥5% of residents identifying as AI/AN were classified as having “high AI/AN” populations, and the remaining counties were classified as “remaining.”
Disability was defined using the American Community Survey six question set asking about functional ability and supports. If a response was yes to at least one of the following six American Community Survey questions, we classified individuals as having a disability:
1. Are you deaf, or do you have serious difficulty hearing?
2. Are you blind or do you have serious difficulty seeing even when wearing glasses?
3. Because of a physical, mental, or emotional problem, do you have difficulty remembering, concentrating or making decisions?
4. Do you have serious difficulty walking or climbing stairs?
5. Because of a physical, mental, or emotional problem, do you have difficulty dressing or bathing?
6. Because of a physical, mental, or emotional problem, do you have difficulty running errands alone, such as visiting a doctor's office or shopping?
We classified counties as metropolitan, micropolitan, and non-core using the United States Office of Management and Budget (OMB) classification. OMB classifies counties as metropolitan and nonmetropolitan based on population data collected by the U.S. Census Bureau. The OMB defines metropolitan counties as counties with an urban core of over 50,000 people. Metropolitan counties are generally considered to be urban. Non-metropolitan counties are classified into two rural subclassifications: micropolitan counties, with urban populations between 10,000 and 50,000 people, and non-core counties as all remaining counties with urban cores <10,000 (11).
Data analysis
Analyses were conducted in ArcMap, Version 8.1 and IBM SPSS Statistics for Windows, Version 28.0. We used ArcMap to visually examine county-level geographic distribution of AI/AN disability prevalence. We used SPSS to run descriptive statistics, t-tests, and Pearson r correlations to explore the relationship between disability and rurality in AI/AN populations.
Results
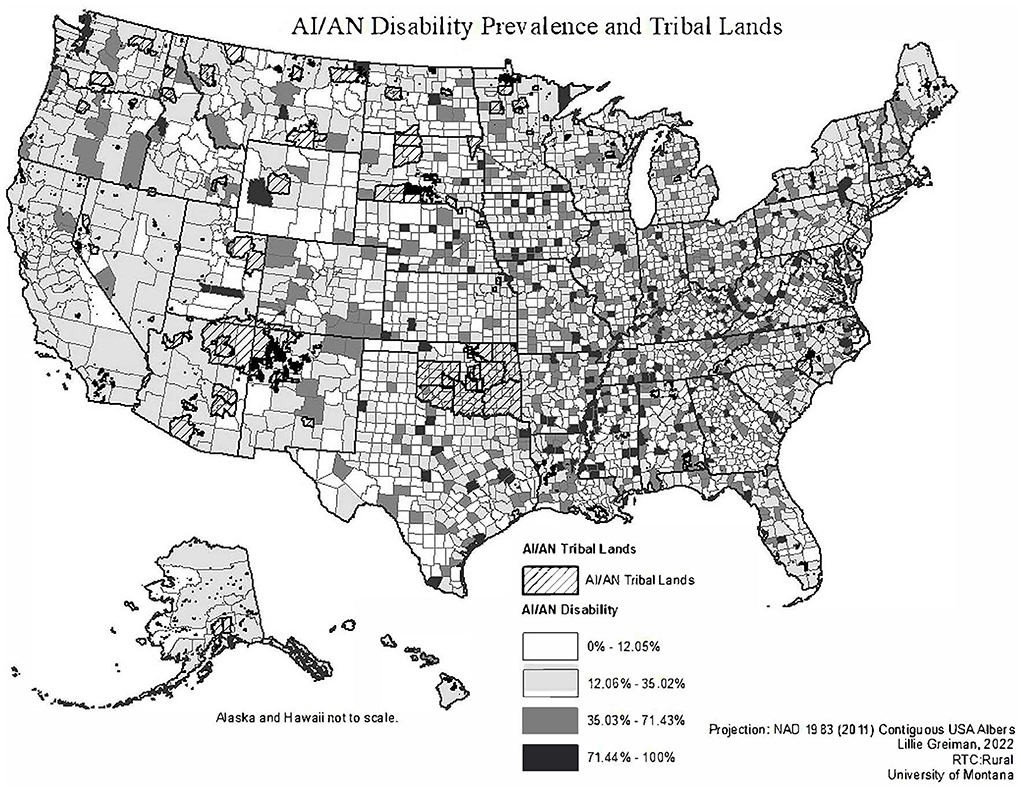
Figure 1 illustrates the geographic variation in AI/AN disability prevalence with an overlay of Tribal Trust and Reservation lands. There does not appear to be any visual correlation or relationship between higher rates of AI/AN disability and counties overlapping tribal lands where a significant proportion of AI/ANs reside.

Figure 1. Map of AI/AN disability prevalence overlayed with AI/AN tribal reservation and trust lands.
A Pearson r correlation analysis of counties revealed a significant negative correlation between the AI/AN concentration in the county population and the AI/AN county disability prevalence, r(3,218) = −0.061, p < 0.001. This finding indicates that higher concentrations of AI/AN in the county population were associated with lower rates of reported disability among AI/AN county residents.
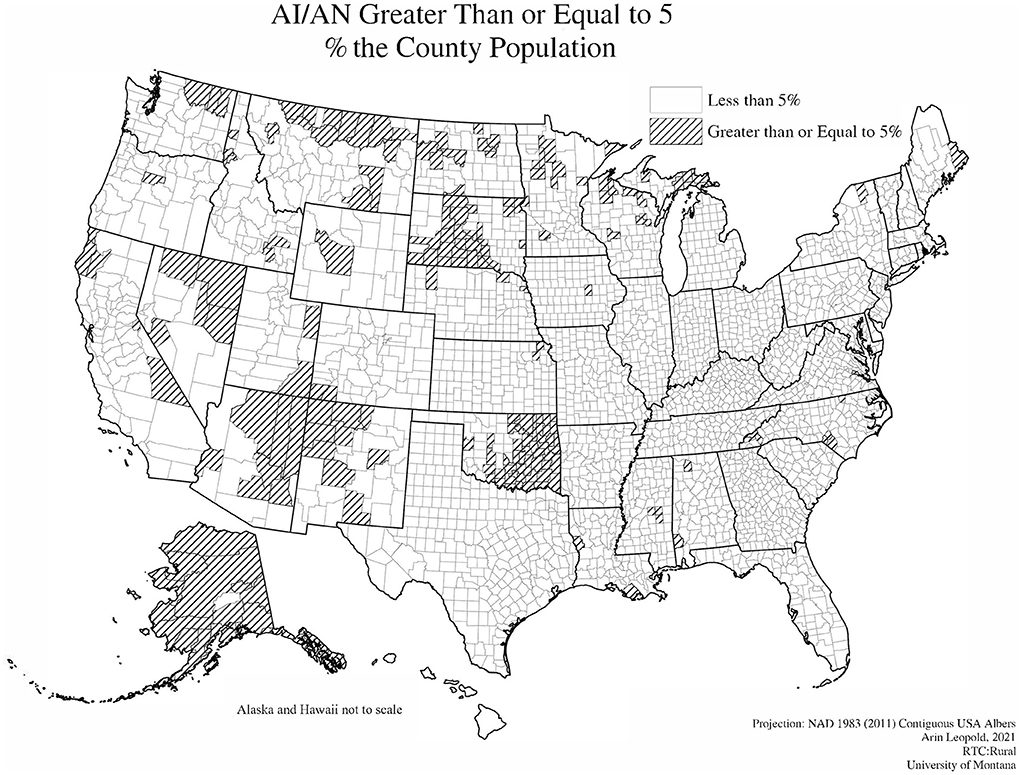
Figure 2 shows a visual map representation of counties with high AI/AN populations. There were 211 counties with AI/AN populations of 5% or more. These counties are located primarily across the western United States with high concentrations in Alaska, Oklahoma, South Dakota, Montana, Arizona, and New Mexico.
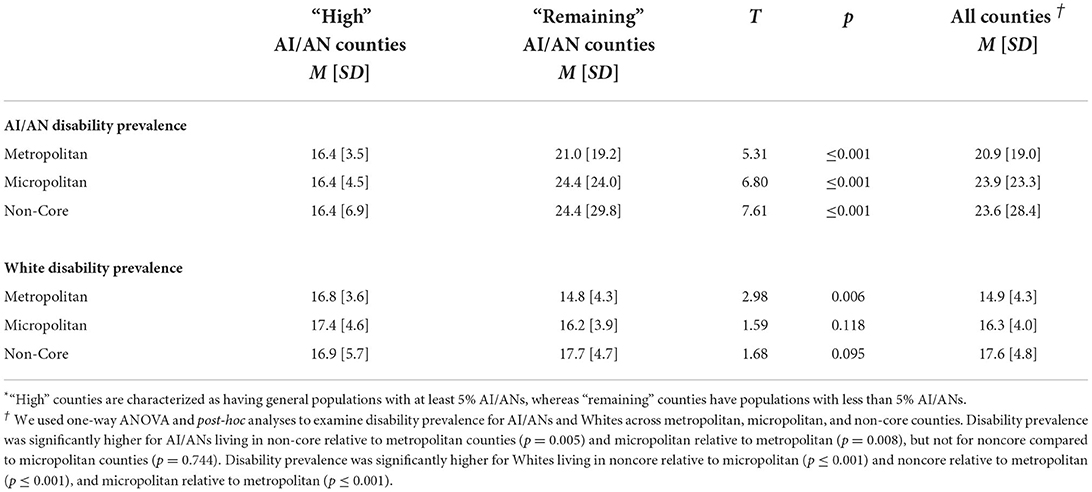
Table 1 compares disability rates between “high” and “remaining” counties using group comparison t-tests based on prevalence of AI/ANs in the general county population. Results indicate that the disability prevalence for AI/ANs in metropolitan, micropolitan, and non-core counties with “high” prevalence of AI/AN populations (5% or more) had significantly lower prevalence of AI/AN disability relative to “remaining” counties. In fact, the prevalence of AI/AN disability in high AI/AN counties is equal to or lower than prevalence of White disability prevalence across metropolitan, micropolitan, and non-core county groups. In contrast, Whites in metropolitan counties with “high” prevalence of AI/AN populations had significantly higher prevalence of disability relative to “remaining” counties. Differences were not statistically significant for differences in micropolitan and non-core counties.

Table 1. T-test comparisons of disability prevalence among AI/ANs and Whites in “high” vs. “remaining” AI/AN counties*.
Table 1 also shows comparison across all counties (without grouping them based on concentration of AI/ANs). We used one-way ANOVA and post-hoc analyses to examine disability prevalence for AI/ANs and Whites across metropolitan, micropolitan, and non-core counties. Disability prevalence was significantly higher for AI/ANs living in non-core relative to metropolitan counties (p = 0.005) and micropolitan relative to metropolitan (p = 0.008), but not for non-core compared to micropolitan counties (p = 0.744). Disability prevalence was significantly higher for Whites living in non-core relative to micropolitan (p ≤ 0.001) and non-core relative to metropolitan (p ≤ 0.001), and micropolitan relative to metropolitan (p ≤ 0.001). We also explored the interaction between county classification and proportions of AI/AN population. We found a statistically significant interaction between non-core and high AI/AN (p = 0.003). This suggests that although non-core counties have higher rates of disability, the interaction of non-core and high AI/AN significantly lowers the disability rate.
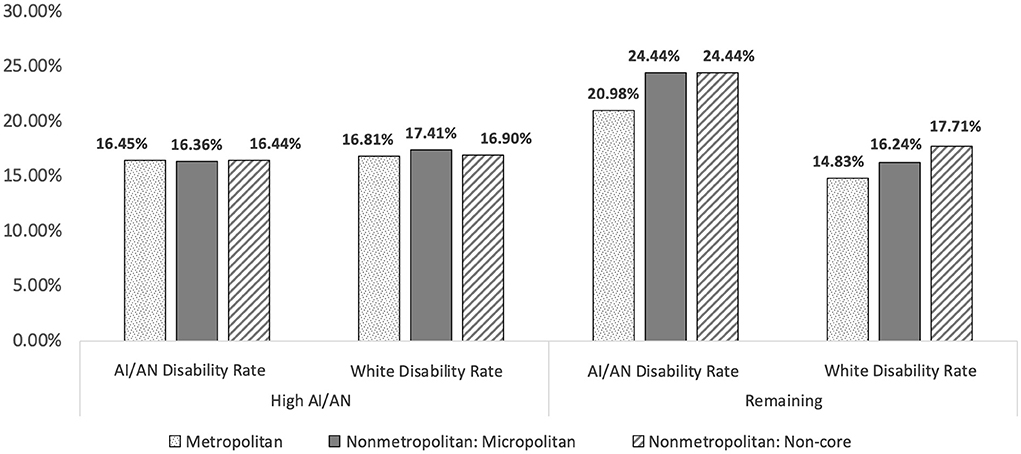
Figure 3 further illustrates Table 1 results in a bar chart format.
Discussion
When examining counties all together, there were notable differences between the prevalence of disability in AI/AN and White racial groups, as AI/ANs reported disability prevalence rates of 20.9, 23.9 and 23.6% and Whites reported rates or 14.9, 16.2, and 17.6% across metropolitan, micropolitan and non-core counties. These data illustrate a common finding that disability rates are high among rural people and for AI/ANs relative to Whites.
However, closer examination of the data (see Table 1; Figure 3) are contrary to our proposed hypothesis and past research (5). Specifically, a different pattern of disability prevalence emerged in counties with higher percentages of AI/ANs in the general population. Across metropolitan, micropolitan, and non-core counties, the disability prevalence in AI/ANs was significantly lower in counties with “high” AI/AN populations (≥5%) relative to counties with lower AI/AN populations (<5%). Additionally, reported disability prevalence rates in “high” AI/AN counties where actually lower for AI/ANs relative to Whites.
This finding may be due to two related hypotheses in the literature: (a) the belongingness hypothesis, which states that strong connections with others have strong effects on individuals, both emotionally and cognitively (12); and (b) cultural protective factors, in which the belonging aspect of being part of a culture and its traditions results in specific protective factors for those that belong, such as emotional wellbeing and resiliency in the face of negative outcomes (13–15). Previous research has found that a sense of belonging mitigates against negative life satisfaction that results from disability-related discrimination (16). In AI/AN communities, cultural traditions are reported to be protective factors because they provide a sense of purpose, a support system, comfort, companionship, and belongingness (17), which may lead to a reduced experiences of environmental barriers for those with health conditions, creating lower prevalence of disability. It is possible that the vehicle through which belongingness contributes to reduced disability prevalence is through mental health. Unfortunately, we were unable to examine the difference between race within specific disability type (e.g., mental illness, mobility difficulties) because we were working with county level prevalence data rather than individual-level data.
Further, the finding that AI/AN individuals living in high AI/AN counties experienced lower prevalence of disability, compared to White individuals, might illustrate that an intersectional protective factor may exist. Again, it should be noted that disability and health are not interchangeable terms. Disability is the interaction of environmental factors (i.e., inaccessible buildings, lack of public transport, exclusionary policies, and practices) and a functional limitation brought on by a health condition which results in disability (18). It is plausible that high AI/AN communities are more attentive to the environmental factors that impact community members with disability, thus creating fewer environmental barriers, and leading to lower prevalence of disability. Given that we did not use inferential statistics or an experimental design, the authors were unable to speak to causation or confounding variables, such as differences in federal- and state-level policies or differences between federal- and state-recognized tribal lands. Future research studies examining a possible protective factor should include these variables to fully examine this relationship.
Findings also suggest the importance of economic resource considerations. Rural counties generally experience sparse economic resources and opportunities (19). This leads to broad, community-wide health disparities due to a lack of funds for insurance, food, and other factors that impact health (3). This is in line with recent data from the U.S. Census Bureau that indicates that while generally, rural Americans experience lower household incomes than urban households, those living in rural areas have lower poverty prevalence than individuals in urban areas (20). Taken together, this suggests a protective factor of living in rural communities despite fewer economic resources. Protective factors may include a greater sense of community connectedness, support, and a lower cost of living in rural areas (21).
Limitations and future research
The present study includes limitations for consideration when interpreting results. First, the study used county level rates which limit the ability to draw conclusions based on individual-level factors. Second, there were few AI/AN individuals represented in several counties, which introduced higher margins of error for interpreting results. However, our findings do have important implications for public health policy. To reduce disability disparity in areas with lower prevalence of AI/AN individuals, economic resources and community factors must be considered alongside individual considerations in future research. Additionally, as disability prevalence rates were higher for rural areas compared to metropolitan and micropolitan areas, disbursement of resources to address environmental factors in rural communities must be considered.
Further, data that does exist is often from an individual and deficit-based perspective, which tends to place blame on AI/AN individuals for health disparities, rather than considering community contextual factors. Data equity should be encouraged by increasing community-focused, asset-based, and culturally responsive data gathering in AI/AN communities. Similarly, additional research is needed to understand the intersectional protective factors that exist for AI/AN individuals residing in counties with high AI/AN populations. Finally, our study could not explore the influence of culturally-specific and culturally safe health care provisions on the prevalence of disability. Future research should aim to examine this in the context of disparities for AI/AN individuals.
Data availability statement
This study used publicly available data. The metadata or the description of how we created variables will be included in ICPSR and will be available upon request.
Ethics statement
We used secondary data analyses from U.S. Census data and was thus exempt from review by the Institutional Review Board.
Author contributions
Data aggregation, data analysis and cleaning for the project was done by LG. The idea for the project was generated by LG and GMM. The writing was done by GMM, ECH, and LG. The tables and figures were done by AJL, LG, GMM, and CI. Critical review of the paper, suggested edits, and review and final edits were done by GMM, ECH, LG, AJL, and CI. All authors contributed to the article and approved the submitted version.
Funding
This work was supported by the Research and Training Center on Disability in Rural Communities (RTC:Rural) under a grant from the National Institute on Disability, Independent Living, and Rehabilitation Research (grant number 90RTCP0002-01-00). NIDILRR is a Center within the Administration for Community Living (ACL), Department of Health and Human Services (HHS). The research does not necessarily represent the policy of NIDILRR, ACL, or HHS and one should not assume endorsement by the federal government. ECH receives/received support from Montana INBRE – an Institutional Development Award from the National Institute of General Medical Sciences of the National Institutes of Health under Award Number P20GM103474.
Acknowledgments
The authors thank the Rural Institute for Inclusive Communities for their support on this project.
Conflict of interest
The authors declare that the research was conducted in the absence of any commercial or financial relationships that could be construed as a potential conflict of interest.
Publisher's note
All claims expressed in this article are solely those of the authors and do not necessarily represent those of their affiliated organizations, or those of the publisher, the editors and the reviewers. Any product that may be evaluated in this article, or claim that may be made by its manufacturer, is not guaranteed or endorsed by the publisher.
Footnotes
1. ^The terms people with disabilities (person first language) and disabled people (identity first language) are used interchangeably to reflect the current preferences of advocates in the disability rights field.
References
1. Wang K, Ashburn-Nardo L. Disability stigma: Causes, consequences, and strategies for change. In: Dunn DS, editor. Disability: Social Psychological Perspectives. New York, NY: Oxford University Press (2019).
2. U.S. Department of Labor. Laws and Regulations. Available online at: https://www.dol.gov/general/topic/disability/laws (accessed February 8, 2022).
3. Committee Committee on Community-Based Solutions to Promote Health Equity in the United States Board Board on Population Health and Public Health Practice Health and Medicine Division National National Academies of Sciences Engineering and Medicine In: Weinstein JN Geller A Negussie Y Baciu A editors. Communities in Action: Pathways to Health Equity. Washington, D.C.: National Academies Press (2017).
4. Goodman N, Morris M, Boston K, Walton D. Financial Inequity: Disability, Race, Poverty in America. National Disability Institute. (2019). Available online at: https://www.nationaldisabilityinstitute.org/wp-content/uploads/2019/02/disability-race-poverty-in-america.pdf (accessed May 19, 2022).
5. Leopold A, Greiman L. America at a Glance: An Update on Rural-Urban Difference in Disability Rates. The University of Montana, Rural Institute for Inclusive Communities (2022). Available online at: https://scholarworks.umt.edu/cgi/viewcontent.cgi?article=1080&context=ruralinst_independent_living_community_participation (accessed June 2, 2022).
6. United States Census Bureau/American FactFinder,. S1810 Disability Characteristics. Washington, D.C.: US Census Bureau's American Community Survey Office (2016). (2012 – 2016 American Community Survey). Available online at: http://factfinder2.census.gov (accessed February 8, 2022).
7. Institute Institute of Medicine Committee Committee on Assessing Rehabilitation Science and Engineering. Disability and the environment. In: Brandt EN Jr, Pope AM, editors. Enabling America: Assessing the Role of Rehabilitation Science and Engineering. Washington, D.C.: National Academies Press (1997). p. 5799.
8. Kauffman and Associates Inc. Long-Term Services and Supports in Indian country: Issues affecting American Indians and Alaska Native Consumers With Disabilities. Centers for Medicare and Medicaid Services (2014).
9. Henning-Smith CE, Hernandez AM, Hardeman RR, Ramirez MR, Kozhimannil KB. Rural counties with majority Black or Indigenous populations suffer the highest rates of premature death in the US. Health Aff . (2019) 38:2019–26. doi: 10.1377/hlthaff.2019.00847
10. United States Census Bureau,. 2015 American Community Survey Research Evaluation Report Memorandum Series #ACS15-RER-01. United States Census Bureau (2015). Available online at: https://www.census.gov/content/dam/Census/library/working-papers/2015/acs/2015_King_01.pdf (accessed May 19, 2022).
11. U.S. Census Bureau. Metropolitan and Micropolitan . Census.gov. (2021). Available online at: https://www.census.gov/programs-surveys/metro-micro/about.html (accessed February 9, 2022).
12. Baumeister RF, Leary MR. The need to belong: desire for interpersonal attachments as a fundamental human motivation. Psychol Bull. (1995) 117:497–529. doi: 10.1037/0033-2909.117.3.497
13. Baumeister RF. Need-to-belong theory. In: Handbook of Theories of Social Psychology. London: SAGE Publications Ltd (2012). p. 121–40. Available online at: http://sk.sagepub.com/reference/hdbk_socialpsychtheories2/n32.xml (accessed February 3, 2022).
14. Burnette CE. Family and cultural protective factors as the bedrock of resilience and growth for Indigenous women who have experienced violence. J Fam Soc Work. (2018) 21:45–62. doi: 10.1080/10522158.2017.1402532
15. Child Welfare Information Gateway,. American Indian Resilience: Culture as a Protective Factor. (2022). Available online at: https://www.childwelfare.gov/topics/systemwide/diverse-populations/americanindian/resilience/ (accessed February 8, 2022).
16. Daley A, Phipps S, Branscombe NR. The social complexities of disability: Discrimination, belonging and life satisfaction among Canadian youth. SSM - Popul Health. (2018) 5:55–63. doi: 10.1016/j.ssmph.2018.05.003
17. Teter T, Chapin J. Culture is our Best Protective Factor Healing Practice. National Indigenous Wimen's Resource Center (2021). Available online at: https://www.niwrc.org/restoration-magazine/june-2021/culture-our-best-protective-factor-and-healing-practice (accessed February 8, 2022).
18. World Health Organization. Disability and Health. (2018). Available online at: https://www.who.int/news-room/fact-sheets/detail/disability-and-health (accessed August 13, 2020).
19. Krause E, Reeves R. Rural Dreams: Upward Mobility in America's Countryside. Center on Children Families at Brookings Institution (2017). Available online at: https://www.brookings.edu/wp-content/uploads/2017/08/es_20170905_ruralmobility.pdf (accessed February 8, 2022).
20. Bishaw A, Posey KG. Incomes Poverty Higher in Urban Areas. U.S. Census Bureau (2017). Available online at: https://www.census.gov/library/stories/2017/11/income-poverty-rural-america.html (accessed February 10, 2022).
Keywords: disability, American Indian/Alaskan Native, rural, health disparities, health equity, social determinants of health
Citation: Mashinchi GM, Hicks EC, Leopold AJ, Greiman L and Ipsen C (2022) The intersection of disability status and rurality in American Indian/Alaskan Native communities. Front. Rehabilit. Sci. 3:875979. doi: 10.3389/fresc.2022.875979
Received: 14 February 2022; Accepted: 12 July 2022;
Published: 02 August 2022.
Edited by:
John W, Lui, University of Wisconsin-Stout Vocational Rehabilitation Institute, United StatesReviewed by:
Kylie Radford, Neuroscience Research Australia, AustraliaHelen Russette, Johns Hopkins University, United States
Copyright © 2022 Mashinchi, Hicks, Leopold, Greiman and Ipsen. This is an open-access article distributed under the terms of the Creative Commons Attribution License (CC BY). The use, distribution or reproduction in other forums is permitted, provided the original author(s) and the copyright owner(s) are credited and that the original publication in this journal is cited, in accordance with accepted academic practice. No use, distribution or reproduction is permitted which does not comply with these terms.
*Correspondence: Genna M. Mashinchi, Z2VubmEubWFzaGluY2hpQHVtb250YW5hLmVkdQ==
 Genna M. Mashinchi
 Emily C. Hicks
 Arin J. Leopold
