 Kaleb Vinehout1
 Kelsey Tynes1
 Miguel R. Sotelo1
 Allison S. Hyngstrom2John R. McGuire3
 Brian D. Schmit1,3*
- 1Department of Biomedical Engineering, Marquette University and the Medical College of Wisconsin, Milwaukee, WI, United States
- 2Department of Physical Therapy, Marquette University, Milwaukee, WI, United States
- 3Department of Physical Medicine and Rehabilitation, Medical College of Wisconsin, Milwaukee, WI, United States
Background: Botulinum NeuroToxin-A (BoNT-A) relieves muscle spasticity and increases range of motion necessary for stroke rehabilitation. Determining the effects of BoNT-A therapy on brain neuroplasticity could help physicians customize its use and predict its outcome.
Objective: The purpose of this study was to investigate the effects of Botulinum Toxin-A therapy for treatment of focal spasticity on brain activation and functional connectivity.
Design: We used functional Magnetic Resonance Imaging (fMRI) to track changes in blood oxygen-level dependent (BOLD) activation and functional connectivity associated with BoNT-A therapy in nine chronic stroke participants, and eight age-matched controls. Scans were acquired before BoNT-A injections (W0) and 6 weeks after the injections (W6). The task fMRI scan consisted of a block design of alternating mass finger flexion and extension. The voxel-level changes in BOLD activation, and pairwise changes in functional connectivity were analyzed for BoNT-A treatment (stroke W0 vs. W6).
Results: BoNT-A injection therapy resulted in significant increases in brain activation in the contralesional premotor cortex, cingulate gyrus, thalamus, superior cerebellum, and in the ipsilesional sensory integration area. Lastly, cerebellar connectivity correlated with the Fugl-Meyer assessment of motor impairment before injection, while premotor connectivity correlated with the Fugl-Meyer score after injection.
Conclusion: BoNT-A therapy for treatment of focal spasticity resulted in increased brain activation in areas associated with motor control, and cerebellar connectivity correlated with motor impairment before injection. These results suggest that neuroplastic effects might take place in response to improvements in focal spasticity.
Introduction
Spasticity occurs in up to 40% of stroke survivors and is associated with functional loss, based on correlations with Barthel scores [see (1, 2) for review]. Botulinum Neurotoxin type A (BoNT-A), which acts by blocking the release of acetylcholine at the neuromuscular junction, temporarily relieves lower limb (3), and upper limb spasticity in patients with stroke (4–6); however, improvements in arm and hand function are not consistently observed across individuals (4, 7). Care and comfort of the hand are consistently improved with BoNT-A injections (8, 9), despite the observation that broader function of the hand is not reliably achieved (9, 10). When outcomes of BoNT-A treatments are considered in terms of passive and active function, passive functional goals are more often met compared to placebo controls, while no differences in active functional goals are observed (11). There is, however, some promise of BoNT-A for targeted improvements in function. A recent titration study demonstrated that increasing the dose of BoNT-A improves the attainment of individual goals (12). With improved goal attainment after BoNT-A treatment, it is possible that there are underlying neuroplastic effects that contribute to functional improvement. Thus, the purpose of the current study was to determine whether there are changes in brain activation or connectivity associated with hand function after BoNT-A that could serve as the basis for restoration of functional movement.
Investigations of brain activation following BoNT-A therapy have produced varying results. In contrast to dominant unilateral activation of motor areas during hand movements in controls, stroke survivors have extensive bilateral activation of primary sensorimotor, premotor and supplementary motor areas during movement of the affected hand (13–15). Changes in brain activity patterns following BoNT-A injections have shown variable results. Some reports indicate a reduction in the bilateral volume of activation in primary motor areas after BoNT-A injections during active (16–18) and imagined (19) movements, demonstrating a localizing and lateralization effect. Other studies have shown increases in activity in similar motor areas after passive wrist movement (20) and arm cycling (21) following BoNT-A therapy. In addition to changes in brain activity patterns after stroke, there are significant alterations in functional connectivity following stroke, including decreases in interhemispheric connections to somatomotor areas and increases in intrahemispheric connections (22–26); however, changes in connectivity with BoNT-A treatments have not been considered, to date.
In this study, we used functional magnetic resonance imaging (fMRI) to investigate the underlying changes in brain activation and connectivity following BoNT-A therapy to relieve upper limb spasticity after stroke. We examined changes in both brain activity and functional connectivity in participants undergoing BoNT-A therapy. To include stroke participants with severe limb spasticity, we developed a wrist-hand device that would allow active finger flexion while passively assisting the fingers to full extension. Note that Bergfeldt et al. (16) and Manganotti et al. (17) also used devices during fMRI measurements to minimize flexor synergies and large synkinetic movements; our device was unique in that it allowed full range-of-motion of finger flexion for stroke participants with mild-to-severe spasticity during fMRI scanning. Our analyses consisted of voxel-based activity measurements and region of interest (ROI) functional connectivity analyses of fMRI data. We hypothesized that BoNT-A's peripheral effects on the affected limb would increase brain activity in higher order motor control centers such as the premotor area and improve global connectivity between motor control centers.
Methods
In this functional MRI study, we obtained blood oxygen level dependent (BOLD) images from a convenience sample of stroke participants undergoing botulinum toxin therapy for arm spasticity. The BoNT-A treatment was part of prescribed clinical care and was not modified for this study. We measured BOLD activation at the time of injection (W0) and 6 weeks (W6) later, at the peak effect of the botulinum toxin on alleviating arm spasticity. We performed voxel-level whole-brain activation and independent component analyses to identify changes in functional activation and connectivity associated with motor recovery due to botulinum toxin therapy. Nine people with chronic stroke were enrolled in the study (5 female; aged 58.2 ± 3.8, range 42–77). Stroke inclusion criteria included: undergoing BoNT-A therapy as part of clinical care; stroke onset more than 6 months prior to the study; wrist/finger impairment as determined by physical examination; no contraindication to MRI. All participants suffered from upper extremity spasticity following stroke and had previously undergone at least one session of BoNT-A treatment. Eight age-matched controls (3 female; aged 56.4 ± 2.2, range 47–70) were enrolled. Control inclusion criteria included: no known neurological or muscular disease and no MRI contraindication. All procedures were approved by the Institutional Review Board (IRB) of the Medical College of Wisconsin (MCW). All participants gave written informed consent to take part in this study and all procedures were conducted in accordance with the Declaration of the World Medical Association.
Study Set-Up
This study consisted of two test sessions scheduled 6 weeks apart for both control and stroke participants. For participants receiving BoNT-A therapy, each session included an MRI scan and a clinical assessment. At least 3 months had passed since the patients' last BoNT-A injection before being enrolled in this study. The first session was conducted 1–4 days before participants received their BoNT-A injection (W0), and the protocol was repeated 6 weeks post-injection in the second session (W6). The control group participated only in the imaging portion of the procedures, with the exception of participants C1 and C5, who did not attend the second session. These controls were used as a comparison to stroke participants. All data were processed with the same analysis, except lesions were identified in stroke participants to aid in registration.
BoNT-A Administration and Clinical Data
Each participant had been treated with BoNT-A 3–4 months prior to the study period as part of their usual standard of care (Table 1). Each participant was prescribed physical therapy following BoNT-A injections; however, only two participants underwent therapy (4 sessions between W0 and W6 in each case: see Table 2). The dosage and muscles injected (Table 2) were determined by the severity of spasticity and the individual's goals for the treatment. EMG guidance was used for all injections. The dose of BoNT-A and muscle injected was not adjusted for study purposes. Summary information of the number of BoNT-A injections, muscles injected, and physical therapy sessions are shown in Table 2.
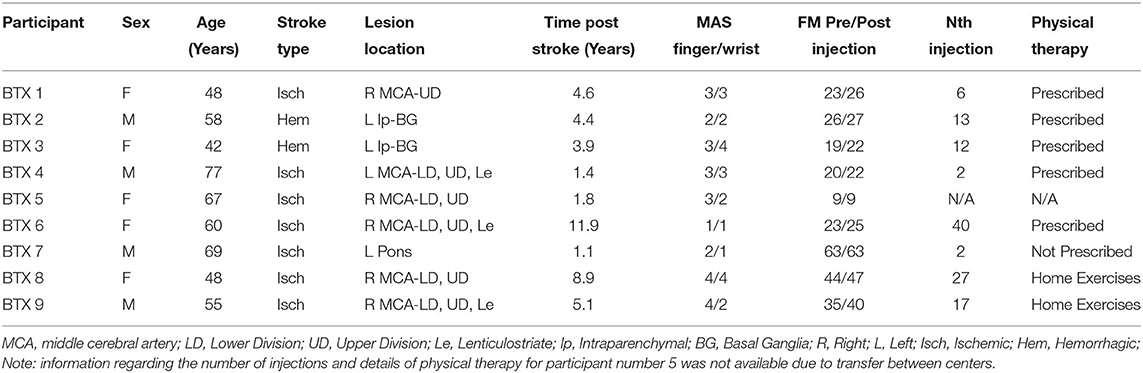
Table 1. Participant demographics and clinical characteristics.
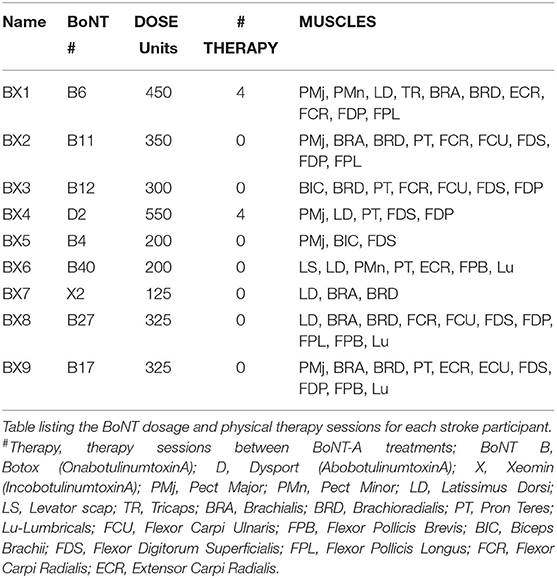
Table 2. Therapy dosage.
All stroke participants' paretic arm motor impairment was assessed using the Fugl-Meyer Assessment (FMA) (27) at time-points W0 and W6. The wrist and finger flexor spastic hypertonia and increased muscle tone were assessed using the Modified Ashworth Scale (MAS) (28) at W0. The MAS has moderate test-retest reliability (29) very good interrater reliability (30), and convergent validity with the FMA, EMG response to a ramp stretch, and the pendulum test (31). The FMA has high test-retest and interrater reliability in people with stroke (32–34). The W0 and W6 FMA scores were checked for non-normality using the Anderson-Darling test and compared for significant changes with a paired t-test. The MAS and FMA measurements were compared with activation volume, activation intensity, and functional connectivity measurements. Comparisons with the FMA scores used a Pearson correlation, while those with the MAS used a Spearman correlation. A Pearson correlation was used for the FMA based on the assumption that the FMA data is measured on an interval scale. In contrast, the MAS was assumed to be an ordinal variable and thus, the Spearman correlation was used. The FMA was collected at both timepoints due to its greater clinical relevance and psychometric properties compared to the MAS (35). Characteristics of the participants in the stroke group are described in Table 1, with further details regarding size and location of the lesions illustrated in Figure 1.
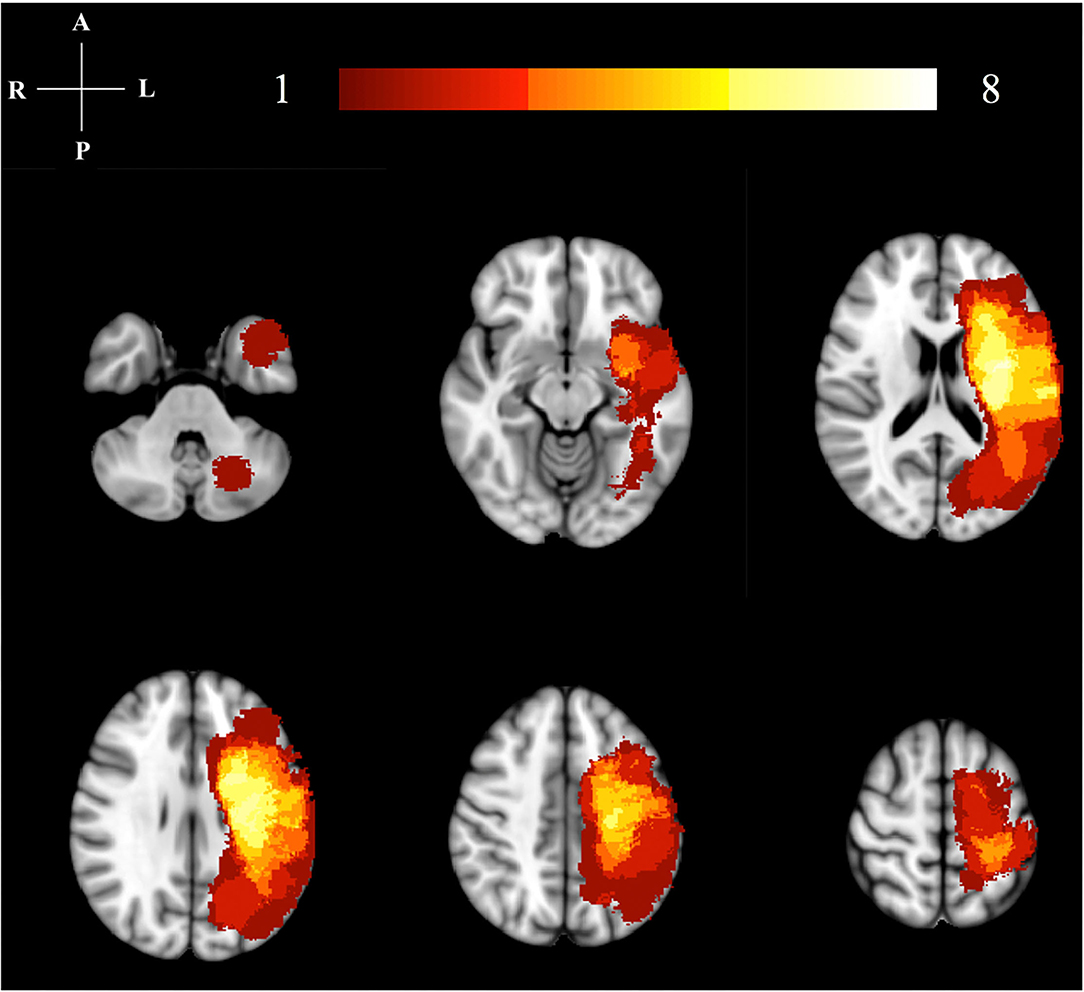
Figure 1. Lesion location map. This image illustrates the lesion distribution for our study. The color bar and numbers represent the number of subjects with a lesion in that area. The highest lesion distribution in shown in bright colors (yellow/white). All right hemisphere lesions have been flipped to the left hemisphere for analysis.
Imaging Data Acquisition
All images were collected using a 3.0T GE Discovery MR750 scanner equipped with a 32-channel head receive coil (MR Instruments, Inc.; Distributed by GE Healthcare; frequency: 127.73 MHz; field: 3T). Anatomical 3D images were collected using the following fast spoiled gradient echo planar imaging (FSPRG-EPI) protocol: Echo Time (TE) = 3.2 ms, Repetition Time (TR) = 8.16 ms, Field of View (FOV) = 240 mm, and 156 × 1 mm slices. Two 6-min trials were conducted for the fMRI, using a GE's gradient echo planar imaging (GRE-EPI) protocol with the following parameters: TE = 25 ms, TR = 2,000 ms, FOV = 224 mm, Matrix: 64 × 64 mm, and 41 × 3.5 mm sagittal slices.
Due to spasticity, some participants with stroke were unable to fully extend the fingers without assistance. To address this issue, a device was created to aid in finger extension and was used by all participants (stroke and control) during the task-based fMRI assessment. The device is described and depicted in Figure 2A. All participants actively flexed against the resistive bands while the device passively extended the fingers. In effect, while this device allowed for all subjects to complete the task, it also resulted in predominantly active finger flexion while producing passive finger extension. In addition, the device allowed testing within the spastic joint range of motion for the fingers (36). The substantial loss of cortical modulation of stretch reflex threshold (37) is likely to impact the extended finger range of motion, especially for the fingers. Since motor learning can be impaired in the spastic joint range of motion (38), the range of motion used for testing in this study was designed to include a pre-injection spastic range of motion that was relieved by BoNT-A injections.
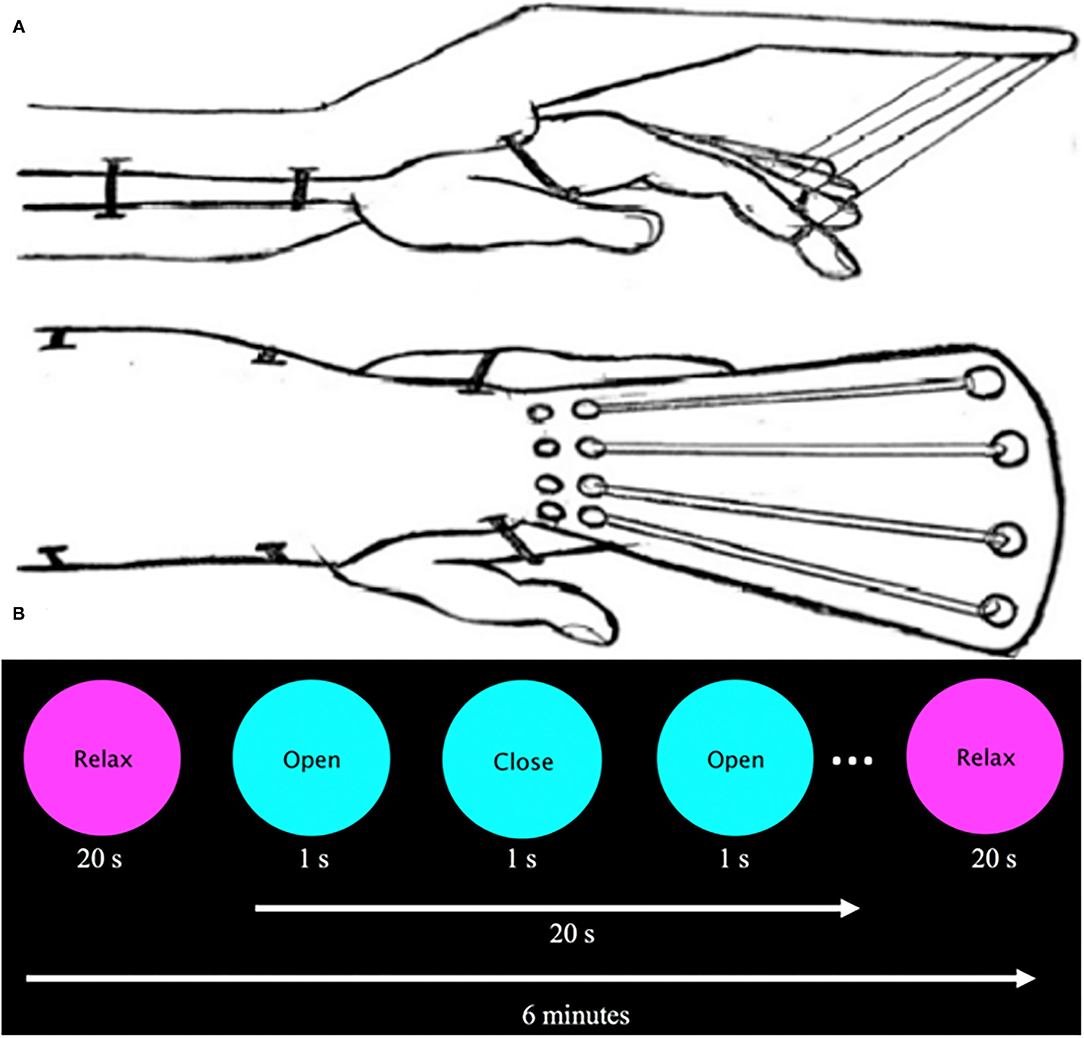
Figure 2. (A) Sketch of assistive finger extension device. This device assists finger extension of stroke participants with spasticity via elastic bands (Theraband: 10.7 N resistance at 100% elongation, 15.1 N at 200%) that are supported by an outrigger on the dorsal part of the hand. Velcro straps attached to the patient's first four digits and were connected to an elastic band. A plastic brace served to stabilize the participant's forearm and wrist as they were instructed to flex and extend the digits. (B) Visual presentation prompt. The visual prompt was presented on a screen inside the bore and read “Relax” centered in a magenta circle (20 s) and “Open/Close” centered on a cyan circle (20 s, 1 Hz) for 6 min.
Participants were scanned while prompted by a visual cue to perform full-hand flexion and extension using the affected (stroke group) or non-dominant (control group) hand. A visual cue was presented in a block paradigm, which alternated rest and hand movement at 20-s intervals for a total of 6 min (Figure 2B). Each participant performed two experimental runs.
Data Pre-processing
The first four TRs were removed from each fMRI trial, and both trials were concatenated (39). Advanced Normalization Tools (ANTs) software (N4BiasFieldCorrection) corrected for bias field inhomogeneities in both anatomical and functional MR images (40). The skull and other non-brain matter were removed from both anatomical and functional MR images using the FMRIB Software Library (FSL) Brain Extraction Tool (bet) (41). Anatomical and functional MR images were flipped in the right-left direction for stroke participants with left hemiparesis and control participants self-identified as right-hand dominant, to standardize brain activation to the left hemisphere. In total, 5 stroke participants and 4 control participants were flipped. Registration to the Montreal Neurological Institute (MNI) 152-subject average brain was performed using ANTs for all images, and a non-linear warp was applied to the functional MR images. Lesion masks obtained from the Lesion Identification with Neighborhood Data Analysis (LINDA) algorithm (42) aided in image registration for stroke participants. Lesion masks and registration were visually inspected for accuracy.
Activity Analysis
FMRI analyses were carried out using the fMRI Expert Analysis Tool (FEAT) Version 5.0, in FSL. First-level FEAT analysis was performed on individual data using a Fixed Effect (FE) analysis (43), which included motion correction, spatial smoothing using a full-width/half-maximum (FWHM) 5 mm Gaussian kernel, temporal high pass filter (0.01 Hz) on the BOLD signal, and prewhitening. A modeled hemodynamic response (HDR) was created by convolving the binary block design with a gamma wave (phase = 0s, std. dev. = 3s, mean lag = 6s), each voxel's timeseries was correlated to the time series model, and the resulting activation images were clustered and thresholded at a Z-value > 2.3 (p < 0.05).
Group analysis was performed using a general linear model (GLM) which categorized individual participants by their group (Stroke/Control) and session (W0/W6). Group mean activation maps were created using non-parametric permutation testing (10,000 permutations) for each group at a threshold Z > 2.3 and cluster significance p < 0.05 with false discovery rate correction.
Regions of Interest for Activation
Within the stroke group, the activation images at time-point W6 were compared to the activation images at time-point W0, and the voxels where W6 was >W0 defined our volume of interest. These regions were further subdivided using the Jülich Histological Atlas for supratentorial regions and the Taliarch Daemon Label Atlas for cerebellar regions, and the number of active voxels and the intensity of each region was recorded.
Regions of Interest for Connectivity
For the connectivity analysis, ROIs were defined using publicly available data. First the ICA of these control data in both resting state and task-based functional connectivity was determined (44) (Figure 3,2A). These processes resulted in 149 sub-components (Figure 3,2B), in which only the gray matter volume was included within region of interest masks for the connectivity analysis. Utilizing these ROIs defined by functional connectivity instead of a priori ROIs allows for detection of the full functional connectivity network for a given region.
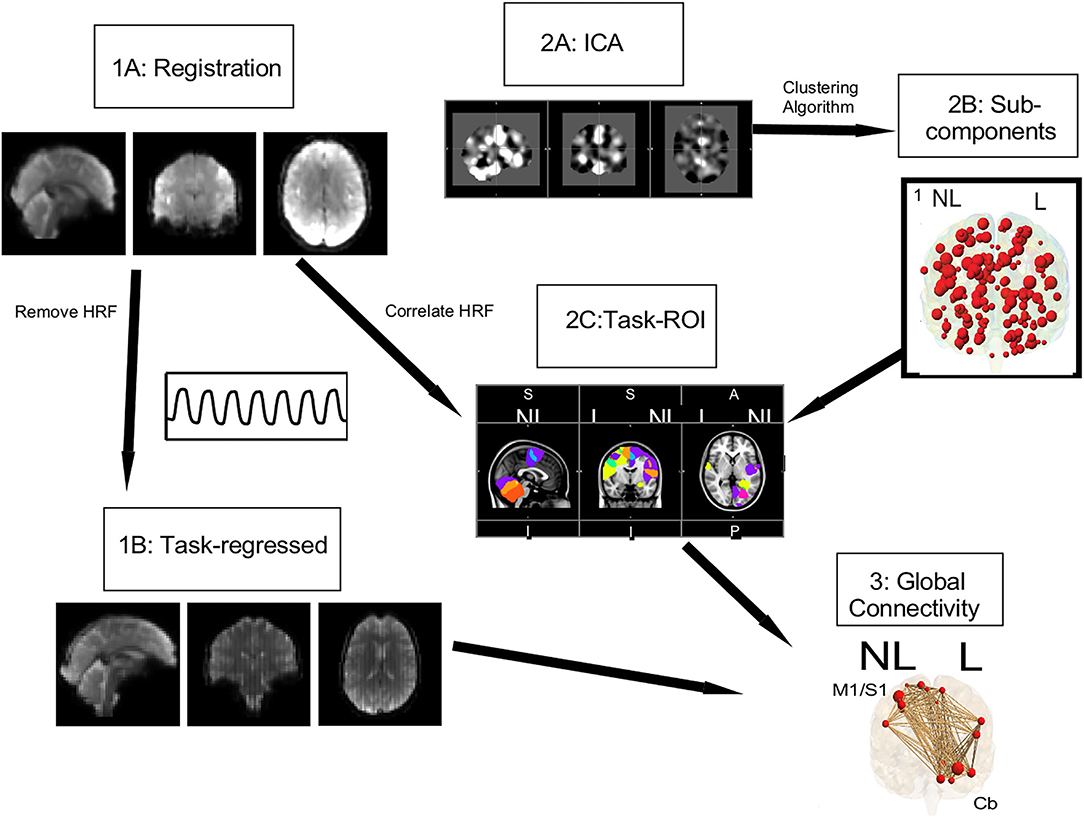
Figure 3. Connectivity pipeline. Registration (1A) and task regression (1B) were performed on the data collected for this study. Using the Smith et al. (44) data, an ICA (2A) and a clustering algorithm were performed to get 149 subcomponents, shown in red circles (2B). From these 149 subcomponents, task ROI (2C) were defined by correlating the HRF with the mean timeseries of our study's data. For these task ROI, shown with red circles the global connectivity (3) strength, shown with brown lines, was calculated.
Using this study's task-based fMRI data, task ROIs were identified by correlating the hemodynamic response function (HRF) with the mean timeseries of each ROI as defined above (Figure 3,2C) [see Vinehout et al. (25) for additional details]. Briefly, subcomponents that were correlated with the HRF (r > 0.2) were considered task regions of interest (task ROIs). This was done across all stroke and control participants so one set of task-ROIs was defined for all participants in this study. See Table 3 for descriptions of the resulting ROIs. These task-ROIs corresponded to the ROIs involved in the finger flexion/extension task. This seed-based functional connectivity approach allows targeted assessment of motor pathways (45–47).
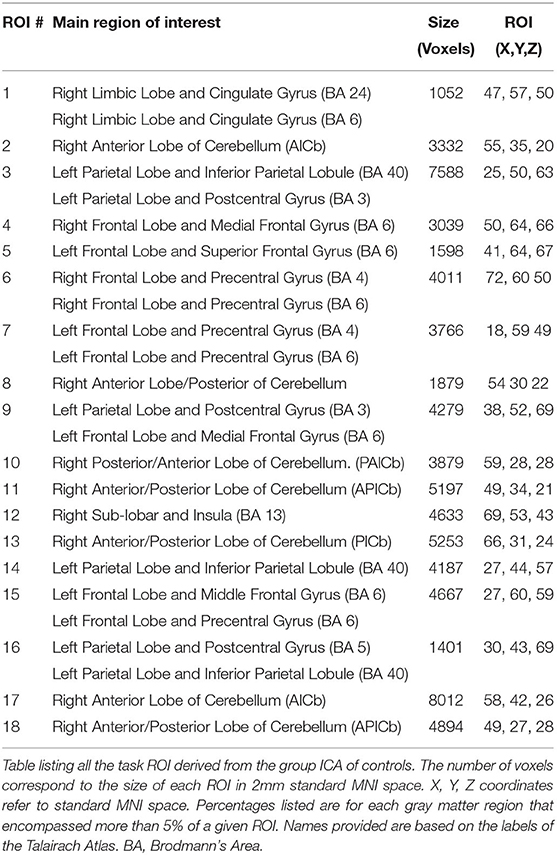
Table 3. Eighteen functional connectivity ROIs.
Functional Connectivity Analysis
After identification of task-ROIs, the HRF of the flexion/extension task was regressed out of the task-based fMRI data. The HRF was removed for task-based functional connectivity to reduce the effect that brain activations have on spurious connectivity measurements (48, 49). For each participant and task, a mean fMRI time series was computed for each of the 18 identified task ROIs (see Table 3 for location of task-ROIs). Pearson correlation coefficients were computed on all pairwise combinations of this mean time series for the 18 task ROIs; Fisher-Z transformations were applied to the Pearson correlation coefficients. These values provided a measure of global connectivity that represented the strength of functional connections between task ROIs (Figure 3,3). The FSL randomize (41) non-parametric permutation test with Bonferroni correction for multiple comparisons was used for comparisons between W0 and W6. These measures provided insight into the strength of the functional connections among task ROIs.
Correlation With Clinical Impairment
Correlations were performed between activation volume, activation intensity, functional connectivity, and clinical measurements, using a Spearman correlation for MAS and a Pearson correlation for FMA. These correlations were performed for W0 and W6 measurements, corrected for multiple comparisons with a False Discovery Rate.
Results
Reduced Motor Impairment Following BoNT-A Therapy
Stroke participants showed a significant increase in FMA motor scores following injections of BoNT-A to the affected arm (p = 0.004; df = 8; t-stat = −3.9194; paired t-test) with a mean increase of 2.1 ± 1.62 (Table 1). Four of nine participants showed improvement in wrist function, and three showed improvements in finger extension. Those that improved in finger extension had the highest MAS scores prior to injection. Other areas of improvement (mass finger extension, forearm pronation/supination, shoulder flexion, and abduction) varied between participants.
Changes in Brain Activity Patterns Following BoNT-A Therapy
We found expected activity patterns and no significant difference between W0 and W6 sessions for controls. Across sessions, controls consistently and significantly activated bilateral primary motor (M1) and ipsilateral cerebellar areas at W0 and W6 (Figure 4) during right-hand movement. In addition to these regions, the ipsilateral premotor and supplementary motor area, bilateral hand portion of the M1, the thalamus and the putamen showed significant task-related activity. Although control participant's activity maps were similar across sessions, stroke participants showed differences between W0 and W6 (Figure 5). At W6 there was more widespread and bilateral activation in the stroke group compared with W0; whereas activation before injection was restricted to the contralesional hemisphere, activation increased in both hemispheres after injection (Figure 5). Activation maps yielded p-values for each voxel; these maps were threshold with p < 0.05 to assess significance. Significant differences (p < 0.05, df = 8; z > 2.3; paired z-test) between W6 and W0 in the stroke group included: (1) contralesional premotor cortex (PMC-R), (2) contralesional cingulate gyrus (CG-R), (3) contralesional thalamus (Th-R), (4) somatosensory and visual integration areas (Sens-IA), and (5) superior cerebellum (S-CB). These regions of activation are further described in Table 4 and illustrated in Figure 5.
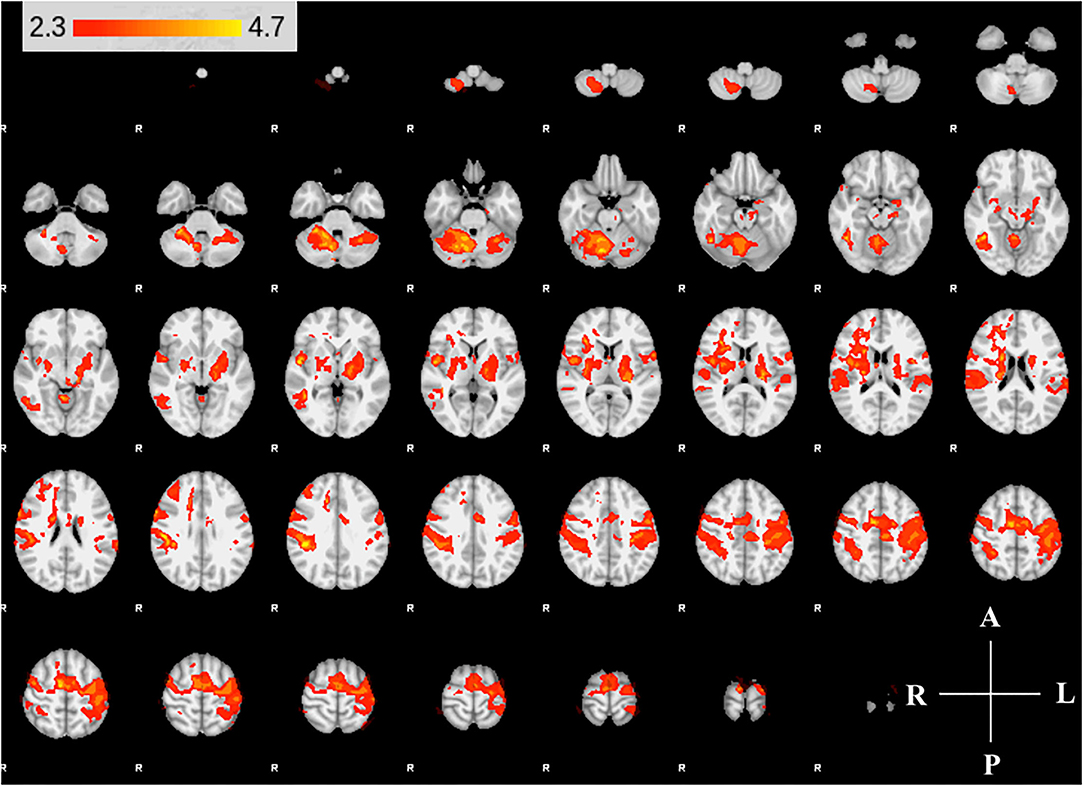
Figure 4. Group activity maps of control participants. The figure shows slices of the MNI template overlaid with z-statistic (Z > 2.3) maps of W0 and W6 average control group activity during non-dominant hand movement. Activity maps indicate volumes in which there was significant (p < 0.05) levels of activity across the group. The right hemisphere of the brain is displayed on the left. Right hemisphere is ipsilateral to the movement arm. No differences were detected between W0 and W6.
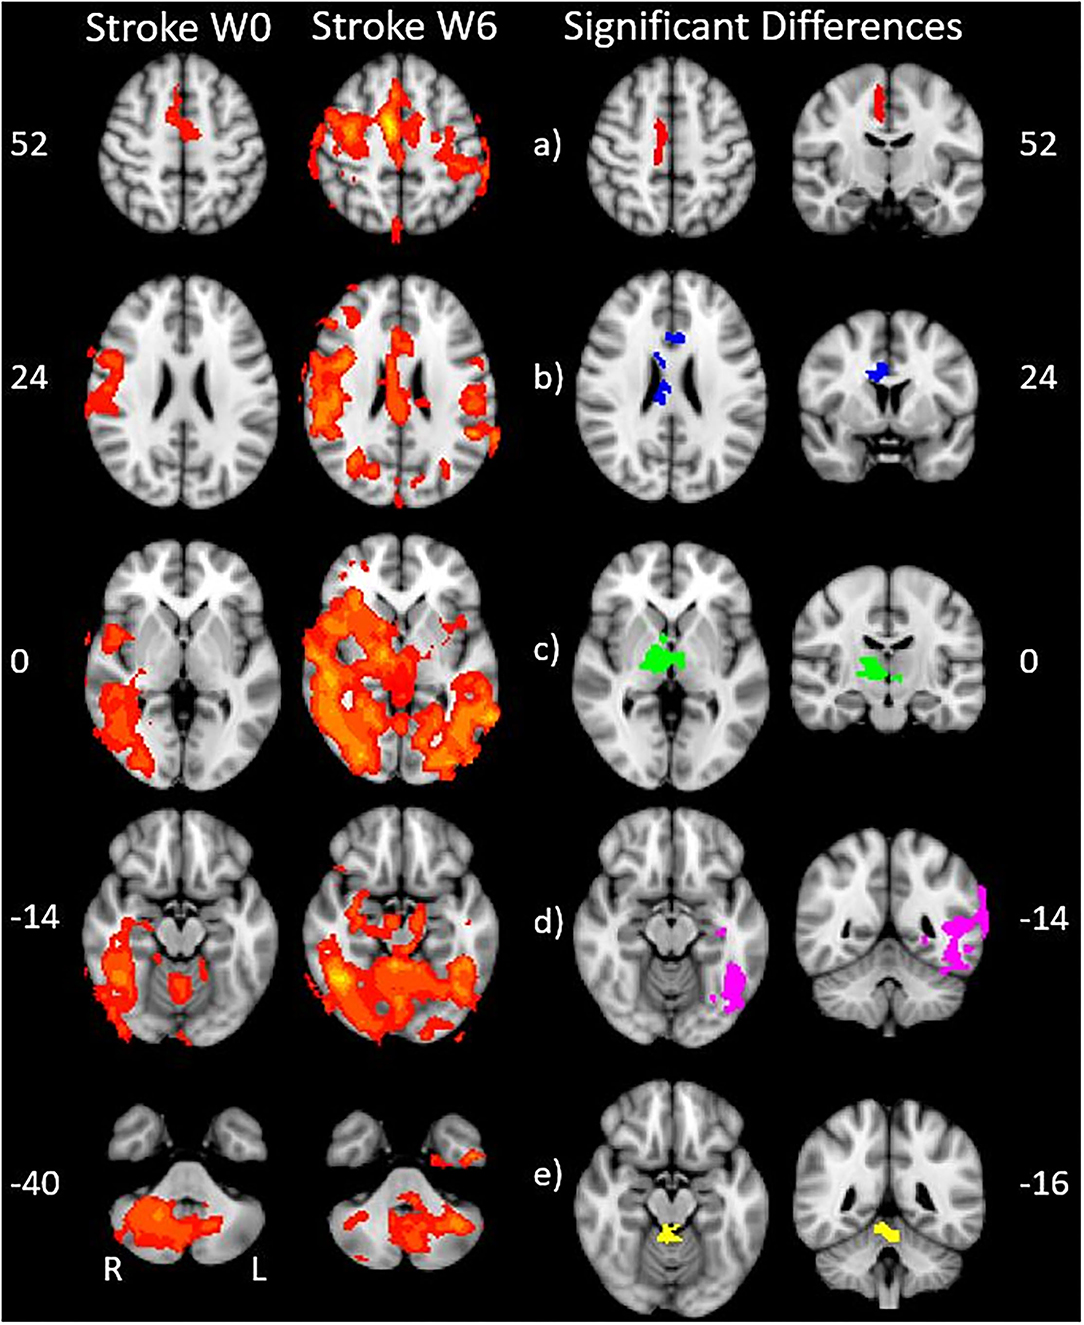
Figure 5. Stroke differences during BoNT-A injections. The first two columns show significant (p < 0.05) levels of activity across the stroke group for W0 (left) and W6 (right). Columns 3 and 4 show the coronal (left) and axial (right) view of significant increase in activity following the BoNT-A intervention, displayed as five regions of interests. These areas are: (a) right premotor cortex (b) right cingulate gyrus (c) right thalamus (d) sensory integration area, (e) superior cerebellum. The physical coordinates of the axial slices are shown to the left or right of axial images, and the coronal views are denoted by the yellow horizontal lines.
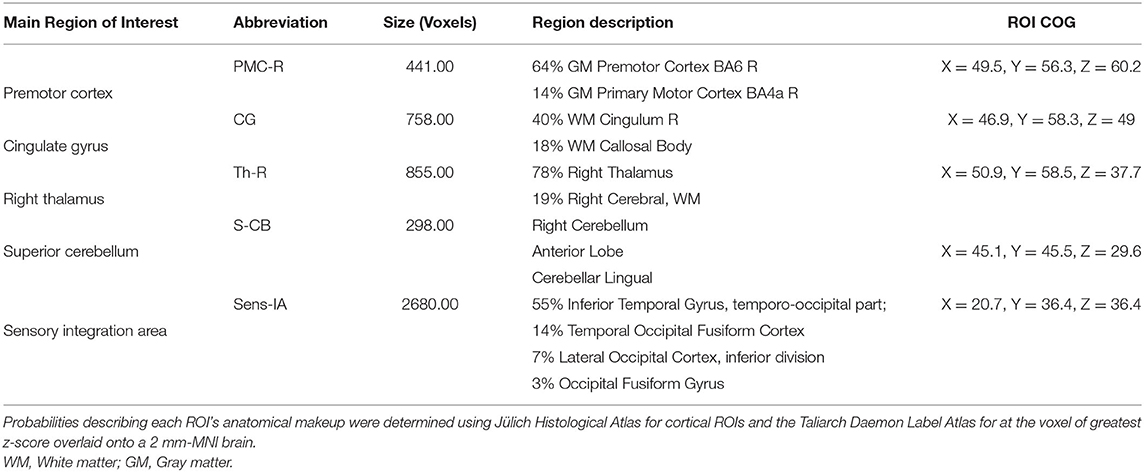
Table 4. Activation ROI characteristics.
The five identified regions of activation were subsequently used as masks to identify the number of active voxels in the given volume for the stroke group at W0 and W6 (Figure 6). Participants with stroke showed a significantly increased number of active voxels in all five regions following BoNT-A injections.
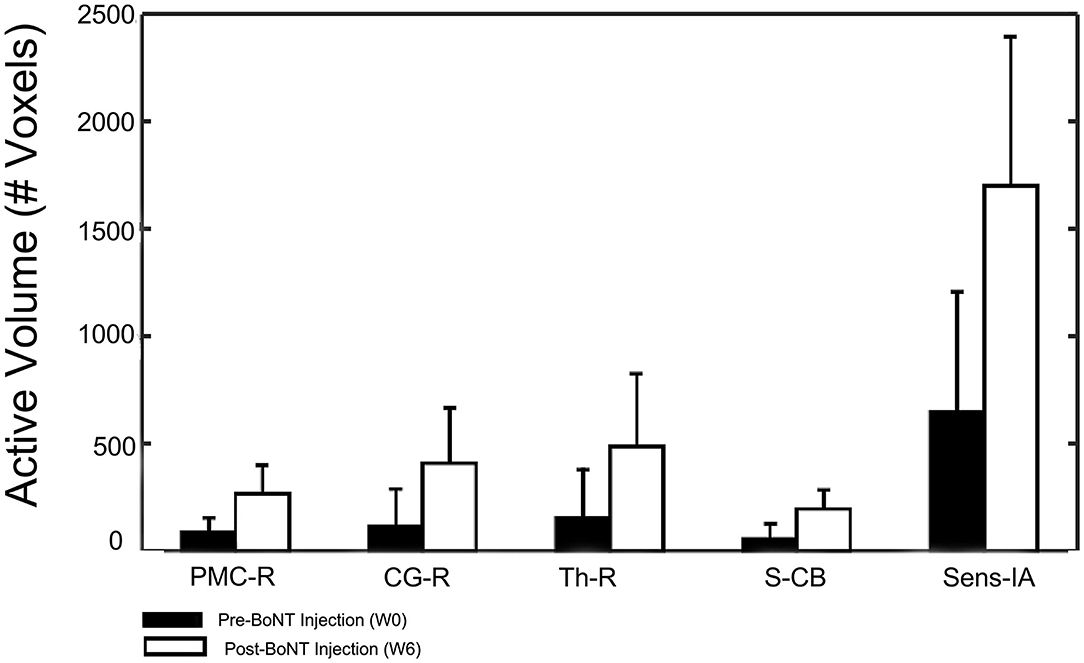
Figure 6. Changes in activation volume following BoNT-A injection therapy. Control group results showed no difference between sessions and are not included in this figure.
Changes in Brain Connectivity Following BoNT-A Therapy
Interestingly, the connectivity analysis did not show significant differences between W0 and W6 in either stroke or control groups after multiple-comparison corrections. Trends of increased functional connectivity after BoNT-A were observed across the 18 task-related ROIs; however, these trends were not significant once corrected for multiple comparisons. The largest connectivity changes were observed in three nodes, the bilateral premotor/motor cortices and the insula of the non-lesioned hemisphere (Figure 7 and Table 3), which showed small p-values but were not statistically significant when the correction for multiple comparisons was applied. In contrast, the control group did not demonstrate trends for increased functional connectivity between W0 and W6. See Figure 7 for visual depiction of trends in stroke participants for these 3 nodes.
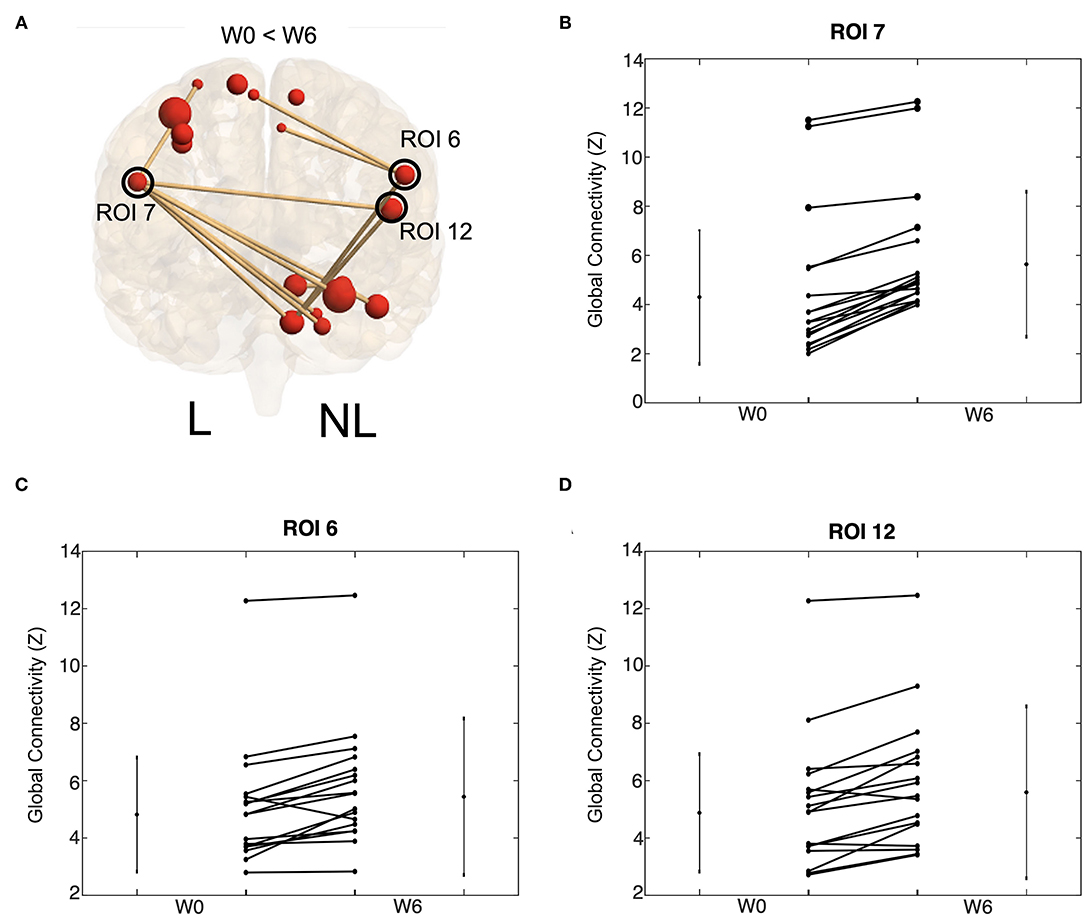
Figure 7. Increases tend in functional connectivity following BoNT-A injection therapy. Global connectivity strength for all task ROIs connected to ROI 7, 6, and 12. Visual depiction of these ROI (A). The size of the red ball represents the size of the ROI and the thickness of the line references the Z-transformed correlation coefficient size. Only significant connections are visualized. Trends of ROI 7 (B), ROI 6 (C), and ROI 12 (D) are shown. These trends are for all task ROI connections to the given ROI; each line represents group average for one connection. Values are shown for W0 and W6 with a line connecting values of the same connection strength. Lines on the side of the graph show the mean and standard deviation of the connection strength across stroke participants.
Clinical Correlations With Activity and Connectivity Values
Correlations were performed between activation volume, activation intensity, functional connectivity, and clinical measurements (MAS and FMA). The correlations between the MAS (W0) and activation volume, activation intensity and functional connectivity were not significant when corrected for multiple comparisons. There were trends between these measurements that had small p-values before multiple comparison correction. A total of 52 correlations had an uncorrected p < 0.05. Three correlations had uncorrected p < 0.01. These trends were W0 functional connectivity measurements that correlated with W0 FMA scores and W6 functional connectivity measurements that correlated with W6 FMA scores, as summarized in Figure 8. At W0, connections between the contralesional anterior cerebellum and the contralesional posterior cerebellum were moderate and positively correlated (R = 0.83 and R = 0.81) with W0 FMA scores. At W6, contralesional and ipsilesional premotor areas were moderate and positively (R = 0.83) correlated with the FMA scores.
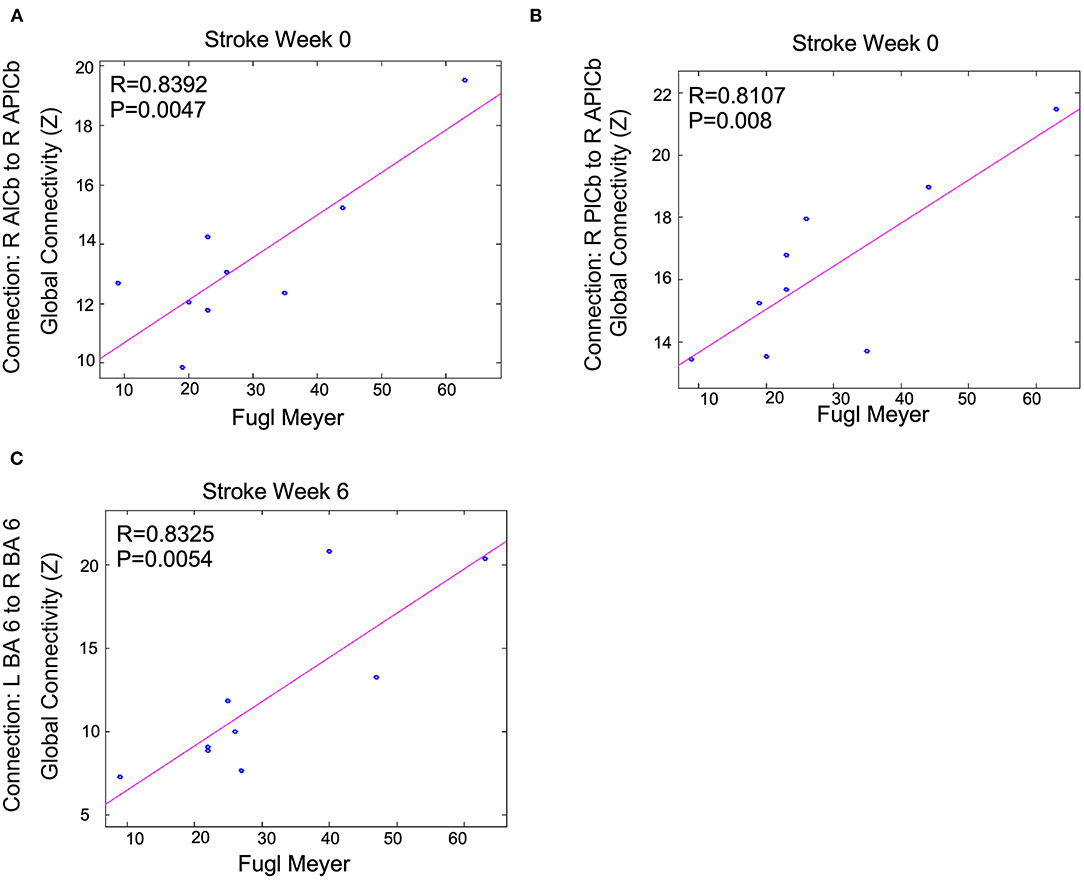
Figure 8. Functional connectivity measurements correlated with FMA scores following BoNT-A injection therapy: trends are shown above. Shown P-values are without correction for multiple comparisons across all tests run for all connections and clinical measurements. We only show the largest trends with these uncorrected p < 0.01. R is the correlation coefficient. R, right; L, left; BA, Brodmann's Area; A, Anterior; P, Posterior; lCb, lobule of the cerebellum. This shows Fugl Meyer scores correlation to (A) the connection between R AlCb to R APlCb, (B) the connection between R PlCb and R APlCb, and (C) the connection between L BA 6 and R BA 6.
Discussion
In this study, we found preliminary evidence of the effects of BoNT-A on higher-order brain activation using fMRI. Following BoNT-A, significant increases in the BOLD signal in the stroke group were observed in the contralesional premotor cortex (PMC-R), cingulate gyrus (CG-R), and motor thalamus (Th-R), ipsilesional sensory integration regions (Sens-IA), and bilateral superior cerebellum (S-CB). These regions showed increased activity, characterized by both larger volume of activation and greater correlation to the HDR. Some connections between these areas were also correlated with the FMA scores. These results suggest that in people with spasticity, BoNT-A enables activation of higher motor centers, possibly associated with renewed access to networks associated with motor planning and control of movement.
Increased Volume of Activation in Higher-Order Brain Regions After BoNT-A Therapy
Our functional activation results showed that BoNT-A therapy increased functional activity in the ipsilesional and contralesional hemispheres during unilateral paretic finger flexion/extension, suggesting BoNT-A therapy promotes neural reorganization. The activation patterns for the control group (Figure 4) were consistent with previous studies, showing activation in the contralateral motor areas in addition to the ipsilateral cerebellum (50–52). Interestingly, the control group also had activation of ipsilateral (right hemisphere) motor areas and bilateral subcortical regions, which have been associated with task precision and movement duration (53–56). In the stroke group, BoNT-A therapy increased the volume of activation in both hemispheres. Prior to injection (W0), stroke participants had activity associated with wrist flexion mainly in the contralesional hemisphere (Figure 5). After injection (W6), the volume of activation encompassed bilateral motor areas, subcortical regions including the thalamus, and the cerebellum, similar to the control group.
There are a limited number of studies on the effects of BoNT-A therapy on brain activation. Contrary to our results, reduced brain activation is observed after BoNT-A therapy for imagined movements (57), finger tapping (19), and mass finger flexion (17). In particular, Manganotti et al. (17) observed decreased BOLD activation following BoNT-A injection therapy, localizing in the ipsilesional motor cortex and contralesional cerebellum. There are two key methodological differences in our study and these prior studies. First, our protocol used a device that passively extended the fingers, which facilitated finger movement through the full range; prior studies involved paced isotonic contractions, which were constrained by an orthosis allowing for 30° range of motion. The second key difference is our protocol aimed to observe the effects of BoNT-A injections on brain activity during the normal course of stroke rehabilitation.
The increase in brain activation following BoNT-A injection therapy in stroke participants might be due to an increased neural drive to flex the fingers through the full range of motion, or, at least in some participants, because physical therapy contributes to the increase in activation. In a similar BoNT-A and fMRI study, Diserens et al. (21) found bilateral increases in BOLD activation in motor regions following BoNT-A injections during passive arm movement, and the BOLD activity increased further following paced repetitive passive movements of the plegic hand and BoNT-A injections. Additionally, Veverka et al. (20) found increased volume of activation in the bilateral cerebellum, contralesional sensorimotor cortex, and the contralesional occipital cortex during passive wrist movements. Thus, reducing spastic hypertonia may increase the afferent feedback from hand movement (20, 21) and allow for greater improvements during physiotherapy (58–60), resulting in increased brain activation.
Another possible reason we saw differences in activation in bilateral brain regions compared to prior studies might be differences in the stroke participant pre-injection function. The participants in our study had heterogeneity of their baseline Fugl-Meyer scores ranging from 9 to 63. The inclusion of high impairment participants is reflected in these participants with lower Fugl-Meyer scores. Stroke survivors have increased activation, particularly in the contralesional hemisphere, during hand movements (13, 61–64). Additionally, it has been reported that therapy increases activity in the ipsilesional hemisphere, lateralizing and localizing activity during paretic hand movement (65–68). Our results included an increased ipsilesional activation following BoNT-A injection therapy, which has been associated with improved motor recovery (69, 70). However, our results also showed increased activation in the contralesional side. It has been suggested that hyper-excitability of the contralesional hemisphere is detrimental to motor recovery following stroke due to interhemispheric inhibition (71). However, recent findings suggest that well-recovered patients have increased contralesional motor activity, which may play a supportive role during rehabilitation (71, 72). This trend might be more apparent in study participants with severe motor deficits (13, 14, 66).
Functional Connectivity in Motor-Related Regions After BoNT-A Therapy
While there were no significant differences in connectivity between W0 and W6 for the stroke or control participants, there was a trend of increased connectivity in the stroke group at W6. A larger sample size might have been able to parse out these differences. Changes in functional connectivity after treatment can be significant (73–75). During W0 we saw correlations between regions of the right cerebellum and FMA score; during W6 we saw correlations in the connectivity between the contralesional and ipsilesional premotor areas and FMA score. Interestingly the areas that overlapped between functional connectivity and activation were areas in which functional connectivity correlated with the FMA score. This further highlights the importance of the cerebellum and contralesional and ipsilesional premotor areas in recovery. The W6 correlations between contralesional and ipsilesional premotor areas suggest that these connections might be more clinically relevant as people with stroke recover. Others have highlighted the clinical importance of these interhemispheric connections (76).
Study Limitations
The study enrollment was small, and it is possible that including more participants would have provided more areas of significant activity and connectivity differences with BoNT-A therapy. However, despite the low sample size, there were consistent patterns within the stroke group. A larger sample size might have provided significant functional connectivity results after correction for multiple comparisons, verifying the observed trends. This sample included a heterogeneous group of stroke patients. Arm therapy decreases brain activation in stroke survivors with high baseline function and increases brain activity in those with low initial function (77), suggesting that the variability of stroke severity in our test group might have limited the statistical significance of group comparisons. In the future, a larger sample size could be collected to assess how stroke severity affects changes in brain activation following BoNT-A therapy.
Another limitation to the present study is the lack of measurement of hand movement while in the scanner. Movement of the target had was observed visually in all participants in the current study during fMRI measurements; however, a real-time measurement of hand movement would provide a measure of the change in movement between W0 and W6, which could have impacted brain activity. The hand apparatus helped to normalize movement across participants and sessions, although differences in movement range were still possible. In addition, measurements of movements would allow for control of mirror movements that are often seen in stroke survivors trying to perform tasks with a significantly impaired limb (78–80). It is possible that activity seen in contralesional motor areas may have resulted from mirror movements of the unaffected hand, though it is unlikely because mirror movements were not observed in the orientation sessions.
Assessments of improvements in spasticity were limited to the MAS and FMA prior to the injection. In addition, MAS is a measurement of spastic muscle tone and does not distinguish active and passive components of hypertonia. A follow-up measure to quantify improvements in spastic hypertonia and impairment would have added to the interpretation of the BoNT-A effects. Additional tests of hand function would have added information on functional ability following BoNT-A therapy. We identified a significant increase of 2.1 FMA points across the group, which is a small increase in the upper extremity FMA, compared to the reported 3.2 minimal detectable change in individual upper extremity score (34). While we saw significant changes in FMA scores pre and post BoNT-A injection (Table 1), these changes were below minimal clinically important differences for this scale (81). Assessments that directly measure the functional goals targeted by the BoNT-A therapy might be more meaningful for future work.
Physical therapy was recommended to patients participating in this study as part of their standard clinical care, with exercises tailored to their specific needs. Physical therapy treatment plans, duration, and frequency were not controlled, but assumed to remain constant over the 6-week period of involvement in the study. For a number of practical reasons, participation in physical therapy sessions was limited (see Table 1 for therapy recommendations and Table 2 for the number of therapy sessions completed by each participant). Thus, the contribution of therapy to the changes in activity and connectivity following BoNT-A injections remains unclear. Injection site and BoNT-A dose were determined by the severity of spasticity and clinical need of each participant. The number of BoNT-A injections that each participant received prior to the study period ranged from 2 to 40. None of these variables correlated with the study outcomes. However, because this study did not include participants after their initial BoNT-A injections the results may not have captured the most significant improvements. Greater improvements in function have been reported following the initial BoNT-A injection (82–84) and subsequent injections are needed to maintain those improvements.
Conclusion
This study showed the effects BoNT-A injection therapy on motor impairment and neuroplasticity. BoNT-A injection therapy produced a significant increase in contralesional activation in stroke survivors after therapy. Additionally, there was a trend of increased interhemispheric and intrahemispheric functional connectivity, most notably to motor/premotor nodes. These neuroplastic changes correlated with motor impairment and limb spasticity; ipsilesional functional connectivity measurements were correlated with the Fugl-Meyer scores, and ipsilesional activation measurements were correlated with the Modified Ashworth Scale. These results suggest that neuroplastic effects take place in response to improvements in focal spasticity and highlight the importance of brain activity and connectivity patterns in rehabilitation.
Data Availability Statement
The raw data supporting the conclusions of this article will be made available by the authors, without undue reservation.
Ethics Statement
The studies involving human participants were reviewed and approved by Medical College of Wisconsin: PRO00027569. The patients/participants provided their written informed consent to participate in this study.
Disclosure
The presented work has not been published prior, although this work constitutes a portion of the Master of Science thesis of KT.
Author Contributions
BS, KT, and AH contributed to the study conception and design. MS and KT contributed to the material preparation and data collection. Analyses were performed by KT and KV. The first draft of the manuscript was written by KT and KV. All authors commented on previous versions of the manuscript, read and approved the final manuscript.
Funding
Funding was provided by the Strategic Fund, a component of the Advancing a Healthier Wisconsin endowment at the Medical College of Wisconsin.
Conflict of Interest
The authors declare that the research was conducted in the absence of any commercial or financial relationships that could be construed as a potential conflict of interest.
Publisher's Note
All claims expressed in this article are solely those of the authors and do not necessarily represent those of their affiliated organizations, or those of the publisher, the editors and the reviewers. Any product that may be evaluated in this article, or claim that may be made by its manufacturer, is not guaranteed or endorsed by the publisher.
References
1. Watkins CL, Leathley MJ, Gregson JM, Moore AP, Smith TL, Sharma AK. Prevalence of spasticity post stroke. Clin Rehabil. (2002) 16:515–22. doi: 10.1191/0269215502cr512oa
2. Wissel J, Manack A, Brainin M. Toward an epidemiology of poststroke spasticity. Neurology. (2013) 80:S13–S19. doi: 10.1212/WNL.0b013e3182762448
3. Esquenazi A, Wein TH, Ward AB, Geis C, Liu C, Dimitrova R. Optimal muscle selection for onabotulinumtoxina injections in poststroke lower-limb spasticity: a randomized trial. Am J Phys Med Rehabil. (2019) 98:360–8. doi: 10.1097/PHM.0000000000001101
4. Slawek J, Bogucki A, Reclawowicz D. Botulinum toxin type A for upper limb spasticity following stroke: an open-label study with individualised, flexible injection regimens. Neurol Sci. (2005) 26:32–9. doi: 10.1007/s10072-005-0379-8
5. Esquenazi A, Albanese A, Chancellor MB, Elovic E, Segal KR, Simpson DM, et al. Evidence-based review and assessment of botulinum neurotoxin for the treatment of adult spasticity in the upper motor neuron syndrome. Toxicon. (2013) 67:115–28. doi: 10.1016/j.toxicon.2012.11.025
6. Pandyan AD, Price CI, Barnes MP, Johnson GR. A biomechanical investigation into the validity of the modified Ashworth Scale as a measure of elbow spasticity. Clin Rehabil. (2003) 17:290–4. doi: 10.1191/0269215503cr610oa
7. Teasell R, Foley N, Pereira S, Sequeira K, Miller T. Evidence to practice: botulinum toxin in the treatment of spasticity post stroke. Top Stroke Rehabil. (2012) 19:115–21. doi: 10.1310/tsr1902-115
8. Bhakta BB, Cozens JA, Bamford JM, Chamberlain MA. Use of botulinum toxin in stroke patients with severe upper limb spasticity. J Neurol Neurosurg Psychiatry. (1996) 61:30–5. doi: 10.1136/jnnp.61.1.30
9. Shaw L, Rodgers H, Price C, van Wijck F, Shackley P, Steen N, et al. BoTULS: a multicentre randomised controlled trial to evaluate the clinical effectiveness and cost-effectiveness of treating upper limb spasticity due to stroke with botulinum toxin type A. Health Technol Assess. (2010) 14:1–113. doi: 10.3310/hta14260
10. Childers MK, Brashear A, Jozefczyk P, Reding M, Alexander D, Good D, et al. Dose-dependent response to intramuscular botulinum toxin type A for upper-limb spasticity in patients after a stroke. Arch Phys Med Rehabil. (2004) 85:1063–9. doi: 10.1016/j.apmr.2003.10.015
11. Ward AB, Wissel J, Borg J, Ertzgaard P, Herrmann C, Kulkarni J, and Best Study Group. Functional goal achievement in post-stroke spasticity patients: the BOTOX® Economic Spasticity Trial (BEST). J Rehabil Med. (2014) 46:504–13. doi: 10.2340/16501977-1817
12. Wissel J, Bensmail D, Ferreira JJ, Molteni F, Satkunam L, Moraleda S, et al. Safety and efficacy of incobotulinumtoxinA doses up to 800 U in limb spasticity: the TOWER study. Neurology. (2017) 88:1321–8. doi: 10.1212/WNL.0000000000003789
13. Cramer SC, Nelles G, Benson RR, Kaplan JD, Parker RA, Kwong KK, et al. A functional MRI study of subjects recovered from hemiparetic stroke. Stroke. (1997) 28:2518–27. doi: 10.1161/01.STR.28.12.2518
14. Ward NS, Brown MM, Thompson AJ, Frackowiak R. Neural correlates of outcome after stroke: a crossl correlat fMRI study. Brain. (2003) 126:1430–48 doi: 10.1093/brain/awg145
15. Rehme AK, Fink GR, von Cramon DY, Grefkes C. The role of the contralesional motor cortex for motor recovery in the early days after stroke assessed with longitudinal FMRI. Cereb Cortex. (2011) 21:756–68. doi: 10.1093/cercor/bhq140
16. Bergfeldt U, Jonsson T, Bergfeldt L, Julin P. Cortical activation changes and improved motor function in stroke patients after focal spasticity therapy–an interventional study applying repeated fMRI. BMC Neurol. (2015) 15:52. doi: 10.1186/s12883-015-0306-4
17. Manganotti P, Acler M, Fiaschi A, Formaggio E, Mucelli RP, Cerini R, et al. Changes in cerebral activity after decreased upper-limb hypertonus: an EMG-fMRI study. Magn Reson Imaging. (2010) 28:646–52. doi: 10.1016/j.mri.2009.12.023
18. Tomášová Z, Hluštík P, Král M, Otruba P, Herzig R, Krobot A, et al. Cortical activation changes in patients suffering from postical ac arm spasticity and treated with botulinum toxin A. J Neuroimaging. (2013) 23:337–44. doi: 10.1111/j.1552-6569.2011.00682.x
19. Veverka T, Hluštík P, Hok P, Otruba P, Tüdös Z, Zapletalová J, et al. Cortical activity modulation by botulinum toxin type A in patients with post-stroke arm spasticity: real and imagined hand movement. J Neurol Sci. (2014) 346:276–83. doi: 10.1016/j.jns.2014.09.009
20. Veverka T, Hluštík P, Hok P, Otruba P, Zapletalová J, Tüdös Z, et al. Sensorimotor modulation by botulinum toxin A in post-stroke arm spasticity: passive hand movement. J Neurol Sci. (2016) 362:14–20 doi: 10.1016/j.jns.2015.12.049
21. Diserens K, Ruegg D, Kleiser R, Hyde S, Perret N, Vuadens P, et al. Effect of repetitive arm cycling following botulinum toxin injection for poststroke spasticity: evidence from fMRI. Neurorehabil Neural Repair. (2010) 24:753–62 doi: 10.1177/1545968310372138
22. Carter AR, Patel KR, Astafiev SV, Snyder AZ, Rengachary J, Strube MJ, et al. Upstream dysfunction of somatomotor functional connectivity after corticospinal damage in stroke. Neurorehabil Neural Repair. (2012) 26:7–19. doi: 10.1177/1545968311411054
23. Kalinosky BT, Berrios Barillas R, Schmit BD. Structurofunctional resting-state networks correlate with motor function in chronic stroke. Neuroimage Clin. (2017) 16:610–23. doi: 10.1016/j.nicl.2017.07.002
24. Kalinosky BT, Vinehout K, Sotelo MR, Hyngstrom AS, Schmit BD. Tasked-based functional brain connectivity in multisensory control of wrist movement after stroke. Front Neurol. (2019) 10:609. doi: 10.3389/fneur.2019.00609
25. Vinehout K, Schmit BD, Schindler-Ivens S. Lower limb task-based functional connectivity is altered in stroke. Brain Connect. (2019) 9:365–77. doi: 10.1089/brain.2018.0640
26. Westlake KP, Nagarajan SS. Functional connectivity in relation to motor performance and recovery after stroke. Front Syst Neurosci. (2011) 5:8. doi: 10.3389/fnsys.2011.00008
27. Fugl-Meyer AR, Jääskö L, Leyman I, Olsson S, Steglind S. The post-stroke hemiplegic patient. 1. a method for evaluation of physical performance. Scand J Rehabil Med. (1975) 7:13–31.
28. Bohannon RW, Smith MB. Interrater reliability of a modified ashworth scale of muscle spasticity. Phys Ther. (1987) 67:206–7. doi: 10.1093/ptj/67.2.206
29. Gregson JM, Leathley MJ, Moore AP, Smith TL, Sharma AK, Watkins CL. Reliability of measurements of muscle tone and muscle power in stroke patients. Age Ageing. (2000) 29:223–8. doi: 10.1093/ageing/29.3.223
30. Kaya T, Karatepe AG, Gunaydin R, Koc A, Ercan UA. Inter-rater reliability of the Modified Ashworth Scale and modified Modified Ashworth Scale in assessing poststroke elbow flexor spasticity. Int J Rehabil Res. (2011) 34:59–64. doi: 10.1097/MRR.0b013e32833d6cdf
31. Katz RT, Rove GP, Brait C, Rymer WZ. Objective quantification of spastic hypertonia: correlation with clinical findings. Arch Phys Med Rehabil. (1992) 73:339–47. doi: 10.1016/0003-9993(92)90007-J
32. Duncan PW, Propst M, Nelson SG. Reliability of the Fugl-Meyer assessment of sensorimotor recovery following cerebrovascular accident. Phys Ther. (1983) 63:1606–10. doi: 10.1093/ptj/63.10.1606
33. Sullivan KJ, Tilson JK, Cen SY, Rose DK, Hershberg J, Correa A, et al. Fugl-Meyer assessment of sensorimotor function after stroke: standardized training procedure for clinical practice and clinical trials. Stroke. (2011) 42:427–32. doi: 10.1161/STROKEAHA.110.592766
34. See J, Dodakian L, Chou C, Chan V, McKenzie A, Reinkensmeyer DJ, et al. A standardized approach to the Fugl-Meyer assessment and its implications for clinical trials. Neurorehabil Neural Repair. (2013) 27:732–41. doi: 10.1177/1545968313491000
35. Murphy MA, Resteghini C, Feys P, Lamers I. An overview of systematic reviews on upper extremity outcome measures after stroke. BMC Neurol. (2015) 15:29. doi: 10.1186/s12883-015-0292-6
36. Kamper DG, Schmit BD, Rymer WZ. Effect of muscle biomeckamhanics on the quantification of spasticity. Ann Biomed Eng. (2001) 29:1122–34. doi: 10.1114/1.1424918
37. Piscitelli D, Turpin NA, Subramanian SK, Feldman AG, Levin MF. Deficits in corticospinal control of stretch reflex thresholds in stroke: implications for motor impairment. Clin Neurophysiol. (2020) 131:2067–78. doi: 10.1016/j.clinph.2020.05.030
38. Subramanian SK, Feldman AG, Levin MF. Spasticity may obscure motor learning ability after stroke. J Neurophysiol. (2018) 119:5–20. doi: 10.1152/jn.00362.2017
39. Diedrichsen J, Shadmehr R. Detecting and adjusting for artifacts in fMRI time series data. Neuroimage. (2005) 27:624–34. doi: 10.1016/j.neuroimage.2005.04.039
40. Avants BB, Tustison N, Song G, Cook PA, Klein A, Gee JC. A reproducible evaluation of ANTs similarity metric performance in brain image registration. Neuroimage. (2011) 54:2033–44. doi: 10.1016/j.neuroimage.2010.09.025
41. Jenkinson M, Beckmann CF, Behrens TEJ, Woolrich MW, Smith SM. FSL. Neuroimage. (2012) 62:782–90. doi: 10.1016/j.neuroimage.2011.09.015
42. Pustina D, Coslett HB, Turkeltaub PE, Tustison N, Schwartz MF, Avants B. Automated segmentation of chronic stroke lesions using LINDA: lesion identification with neighborhood data analysis. Hum Brain Mapp. (2016) 37:1405–21. doi: 10.1002/hbm.23110
43. Woolrich MW, Ripley BD, Brady M, Smith SM. Temporal autocorrelation in univariate linear modeling of FMRI data. Neuroimage. (2001) 14:1370–86 doi: 10.1006/nimg.2001.0931
44. Smith SM, Fox PT, Miller KL, Glahn DC, Fox PM, Mackay CE, et al. Correspondence of the brain's functional architecture during activation and rest. Proc Natl Acad Sci. (2009) 106:13040–5. doi: 10.1073/pnas.0905267106
45. Biswal B, Zerrin Yetkin F, Haughton VM, Hyde JS. Functional connectivity in the motor cortex of resting human brain using echotional MRI. Magn Reson Med. (1995) 34:537–41. doi: 10.1002/mrm.1910340409
46. Lee JY, Choi Y, Ahn KJ, Nam Y, Jang JH, Choi HS, et al. Seed-based resting-state functional MRI for presurgical localization of the motor cortex: a task-based functional MRI-determined seed versus an anatomy-determined seed. Korean J Radiol. (2019) 20:171–9. doi: 10.3348/kjr.2018.0004
47. Gandhi TK. Resting state fMRI analysis using seed based and ICA methods. In: 2016 3rd International Conference on Computing for Sustainable Global Development (INDIACom). (2016). p. 2551–4. IEEE.
48. Cole MW, Ito T, Schultz D, Mill R, Chen R, Cocuzza C. Task activations produce spurious but systematic inflation of task functional connectivity estimates. Neuroimage. (2019) 189:1–18. doi: 10.1016/j.neuroimage.2018.12.054
49. Rangaprakash D, Wu GR, Marinazzo D, Hu X, Deshpande G. Hemodynamic Response Function (HRF) variability confounds restingariabi fMRI functional connectivity. Magn Reson Med. (2018) 80:1697–713. doi: 10.1002/mrm.27146
50. Meier JD, Aflalo TN, Kastner S, Graziano MS. Complex organization of human primary motor cortex: a high-resolution fMRI study. J Neurophysiol. (2008) 100:1800–12 doi: 10.1152/jn.90531.2008
51. Olman CA, Pickett KA, Schallmo M, Kimberley TJ. Selective BOLD responses to individual finger movement measured with fMRI at 3T. Hum Brain Mapp. (2012) 33:1594–606 doi: 10.1002/hbm.21310
52. Yoo S, Wei X, Dickey CC, Guttmann CR, Panych LP. Long-term reproducibility analysis of fMRI using hand motor task. Int J Neurosci. (2005) 115:55–77 doi: 10.1080/00207450490512650
53. Bernard RA, Goran DA, Sakai ST, Carr TH, McFarlane D, Nordell B, et al. Cortical activation during rhythmic hand movements performed under three types of control: an fMRI study. Cogn Affect Behav Neurosci. (2002) 2:271–81. doi: 10.3758/CABN.2.3.271
54. Buetefisch CM, Revill KP, Shuster L, Hines B, Parsons M. Motor demand-dependent activation of ipsilateral motor cortex. J Neurophysiol. (2014) 112:999–1009 doi: 10.1152/jn.00110.2014
55. Newton JM, Sunderland A, Gowland PA. fMRI signal decreases in ipsilateral primary motor cortex during unilateral hand movements are related to duration and side of movement. Neuroimage. (2005) 24:1080–7. doi: 10.1016/j.neuroimage.2004.10.003
56. Verstynen T, Diedrichsen J, Albert N, Aparicio P, Ivry RB. Ipsilateral motor cortex activity during unimanual hand movements relates to task complexity. J Neurophysiol. (2005) 93:1209–22. doi: 10.1152/jn.00720.2004
57. Veverka T, Hluštík P, Tomášová Z, Hok P, Otruba P, Král M, et al. BoNT-A related changes of cortical activity in patients suffering from severe hand paralysis with arm spasticity following ischemic stroke. J Neurol Sci. (2012) 319:89–95. doi: 10.1016/j.jns.2012.05.008
58. Gracies J, Elovic E, McGuire J, Simpson D. Traditional pharmacological treatments for spasticity part I: local treatments. Muscle Nerve Suppl. (1997) 20:61–91. doi: 10.1002/(SICI)1097-4598(1997)6+<61::AID-MUS6>3.0.CO;2-H
59. Marciniak CM, Harvey RL, Gagnon CM, Duraski SA, Denby FA, McCarty S, et al. Does botulinum toxin type A decrease pain and lessen disability in hemiplegic survivors of stroke with shoulder pain and spasticity?: a randomized, double-blind, placebo-controlled trial. Am J Phys Med Rehabil. (2012) 91:1007–19. doi: 10.1097/PHM.0b013e31826ecb02
60. Rosales RL, Kong KH, Goh KJ, Kumthornthip W, Mok VC, Delgado-De Los Santos MM, et al. Botulinum toxin injection for hypertonicity of the upper extremity within 12 weeks after stroke: a randomized controlled trial. Neurorehabil Neural Repair. (2012) 26:812–21. doi: 10.1177/1545968311430824
61. Cramer SC, Finklestein SP, Schaechter JD, Bush G, Rosen BR. Activation of distinct motor cortex regions during ipsilateral and contralateral finger movements. J Neurophysiol. (1999) 81:383–7. doi: 10.1152/jn.1999.81.1.383
62. Du J, Hu J, Hu J, Xu Q, Zhang Q, Liu L, et al. Aberrances of cortex excitability and connectivity underlying motor deficit in acute stroke. Neural Plast. (2018) 2018:1318093. doi: 10.1155/2018/1318093
63. Nair DG, Hutchinson S, Fregni F, Alexander M, Pascual-Leone A, Schlaug G. Imaging correlates of motor recovery from cerebral infarction and their physiological significance in well-recovered patients. Neuroimage. (2007) 34:253–63. doi: 10.1016/j.neuroimage.2006.09.010
64. Willer C, Ramsay SC, Wise RJ, Friston KJ, Frackwiak RS. Individual patterns of functional reorganization in the human cerebral cortex after capsular infraction. Ann Neurol. (1993) 33:181–9. doi: 10.1002/ana.410330208
65. Cauraugh JH, Summers JJ. Neural plasticity and bilateral movements: a rehabilitation approach for chronic stroke. Prog Neurobiol. (2005) 75:309–20. doi: 10.1016/j.pneurobio.2005.04.001
66. Johansen-Berg H, Rushworth MFS, Bogdanovic MD, Kischka U, Wimalaratna S, Matthews PM. The role of ipsilateral premotor cortex in hand movement after stroke. Proc Natl Acad Sci USA. (2002) 99:14518–23. doi: 10.1073/pnas.222536799
67. Michielsen ME, Selles RW, van der Geest JN, Eckhardt M, Yavuzer G, Stam HJ, et al. Motor recovery and cortical reorganization after mirror therapy in chronic stroke patients: a phase II randomized controlled trial. Neurorehabil Neural Repair. (2011) 25:223–33. doi: 10.1177/1545968310385127
68. Schaechter JD, Kraft E, Hilliard TS, Dijkhuizen RM, Benner T, Finklestein SP, et al. Motor recovery and cortical reorganization after constraint-induced movement therapy in stroke patients: a preliminary study. Neurorehabil Neural Repair. (2002) 16:326–38. doi: 10.1177/154596830201600403
69. Calautti C, Baron J. Functional neuroimaging studies of motor recovery after stroke in adults: a review. Stroke. (2003) 34:1553–66. doi: 10.1161/01.STR.0000071761.36075.A6
70. Favre I, Zeffiro TA, Detante O, Krainik A, Hommel M, Jaillard A. Upper limb recovery after stroke is associated with ipsilesional primary motor cortical activity: a meta-analysis. Stroke. (2014) 45:1077–83. doi: 10.1161/STROKEAHA.113.003168
71. Dodd KC, Nair VA, Prabhakaran V. Role of the Contralesional vs. Ipsilesional hemisphere in stroke recovery. Front Hum Neurosci. (2017) 11:469. doi: 10.3389/fnhum.2017.00469
72. Buetefisch CM. Role of the contralesional hemisphere in post-stroke recovery of upper extremity motor function. Front Neurol. (2015) 6:214. doi: 10.3389/fneur.2015.00214
73. Zheng X, Sun L, Yin D, Jia J, Zhao Z, Jiang Y, et al. The plasticity of intrinsic functional connectivity patterns associated with rehabilitation intervention in chronic stroke patients. Neuroradiology. (2016) 58:417–27. doi: 10.1007/s00234-016-1647-4
74. Schulz R, Buchholz A, Frey BM, Bönstrup M, Cheng B, Thomalla G, et al. Enhanced effective connectivity between primary motor cortex and intraparietal sulcus in well-recovered stroke patients. Stroke. (2016) 47:482–9. doi: 10.1161/STROKEAHA.115.011641
75. Fan Y, Wu C, Liu H, Lin K, Wai Y, Chen Y. Neuroplastic changes in resting-state functional connectivity after stroke rehabilitation. Front Hum Neurosci. (2015) 9:546. doi: 10.3389/fnhum.2015.00546
76. Carter AR, Astafiev SV, Lang CE, Connor LT, Rengachary J, Strube MJ, et al. Resting interhemispheric functional magnetic resonance imaging connectivity predicts performance after stroke. Ann Neurol. (2010) 67:365–75. doi: 10.1002/ana.21905
77. Pundik S, McCabe JP, Hrovat K, Fredrickson AE, Tatsuoka C, Feng IJ, et al. Recovery of post stroke proximal arm function, driven by complex neuroplastic bilateral brain activation patterns and predicted by baseline motor dysfunction severity. Front Hum Neurosci. (2015) 9:394. doi: 10.3389/fnhum.2015.00394
78. Ohtsuka H, Matsuzawa D, Ishii D, Shimizu E. Longitudinal follow-up of mirror movements after stroke: a case study. Case Rep Neurol Med. (2015) 2015:354134. doi: 10.1155/2015/354134
79. Nelles G, Cramer SC, Schaechter JD, Kaplan JD, Finklestein SP. Quantitative assessment of mirror movements after stroke. Stroke. (1998) 29:1182–7. doi: 10.1161/01.STR.29.6.1182
80. Ejaz N, Xu J, Branscheidt M, Hertler B, Schambra H, Widmer M, et al. Evidence for a subcortical origin of mirror movements after stroke: a longitudinal study. Brain. (2018) 141:837–47. doi: 10.1093/brain/awx384
81. Hiragami S, Inoue Y, Harada K. Minimal clinically important difference for the Fugl-Meyer assessment of the upper extremity in convalescent stroke patients with moderate to severe hemiparesis. J Phys Ther Sci. (2019) 31:917–21. doi: 10.1589/jpts.31.917
82. Hesse S, Reiter F, Konrad M, Jahnke MT. Botulinum toxin type A and short-term electrical stimulation in the treatment of upper limb flexor spasticity after stroke: a randomized, double-blind, placebo-controlled trial. Clin Rehabil. (1998) 12:381–8. doi: 10.1191/026921598668275996
83. Hesse S, Brandl-Hesse B, Bardeleben A, Werner C, Funk M. Botulinum toxin A treatment of adult upper and lower limb spasticity. Drugs Aging. (2001) 18:255–62. doi: 10.2165/00002512-200118040-00003
Keywords: stroke, rehabilitation, BoNT-A, MRI, activation, connectivity
Citation: Vinehout K, Tynes K, Sotelo MR, Hyngstrom AS, McGuire JR and Schmit BD (2021) Changes in Cortical Activity in Stroke Survivors Undergoing Botulinum Neurotoxin Therapy for Treatment of Focal Spasticity. Front. Rehabilit. Sci. 2:735819. doi: 10.3389/fresc.2021.735819
Received: 03 July 2021; Accepted: 25 November 2021;
Published: 16 December 2021.
Edited by:
Igor Lavrov, Mayo Clinic, United StatesReviewed by:
Sandeep K. Subramanian, The University of Texas Health Science Center at San Antonio, United StatesJessica McCabe, Louis Stokes Cleveland VA Medical Center, United States
Copyright © 2021 Vinehout, Tynes, Sotelo, Hyngstrom, McGuire and Schmit. This is an open-access article distributed under the terms of the Creative Commons Attribution License (CC BY). The use, distribution or reproduction in other forums is permitted, provided the original author(s) and the copyright owner(s) are credited and that the original publication in this journal is cited, in accordance with accepted academic practice. No use, distribution or reproduction is permitted which does not comply with these terms.
*Correspondence: Brian D. Schmit, YnJpYW4uc2NobWl0QG1hcnF1ZXR0ZS5lZHU=