 Yuji Hatano1*
 Junya Tanigawa2Akimichi Nakazono2
 Takeharu Sekiguchi1Yuta Kainuma1
 Hiroshi Abe3Shinobu Onoda3
 Takeshi Ohshima3Takayuki Iwasaki1Mutsuko Hatano1
- 1Department of Electrical and Electronic Engineering, School of Engineering, Tokyo Institute of Technology, Meguro City, Japan
- 2Yazaki Research and Technology Center, YAZAKI Corporation, Susono, Japan
- 3Quantum Materials and Applications Research Center (QUARC), National Institutes for Quantum Science and Technology (QST), Takasaki, Japan
Key implementation points for achieving full accuracy in simultaneous temperature and magnetic field measurement and linearity when applying diamond quantum sensors to electric vehicle (EV) battery monitors were investigated. Both the static and busbar current magnetic field are required to be aligned to the NV-axis. If misalignment should exist, the resonance frequency midpoint move in the direction opposite to the temperature change under a large busbar current due to the transverse magnetic field effect. Misalignment could be quantified with an accuracy of ±1° by analysing the resonance frequency midpoint change under a current of ±1,000 A. The transverse magnetic field effects compensation estimated from misalignment, confirmed that the resonance frequency midpoint changed consistently with temperature changes. Furthermore, linearity over a wide dynamic range also improved. Moreover, it will contribute to accurate alignment of the two sensors for differential detection to eliminate external noise as common mode. These are expected to expand the application of diamond sensors for high-precision measurement in a wide dynamic range.
Introduction
A diamond quantum sensor, which utilises the Nitrogen-vacancy (NV) centre in the diamond crystal, has distinctive features of high sensitivity (Acosta et al., 2009; Wolf et al., 2015; Barry et al., 2016; Masuyama et al., 2018; Zhang et al., 2021; Webb et al., 2021; Arai et al., 2022; Graham et al., 2023; Hansen et al., 2023; Alsid et al., 2023; Barry et al., 2023; Sekiguchi et al., 2024), wide dynamic range (Nusran et al., 2012), and multi-modality (Clevenson et al., 2015; Kim et al., 2019; Ibrahim et al., 2021; Hatano et al., 2021; Shim et al., 2022) at room temperature and atmospheric pressure. Exploiting these features, current measurement applications with a wide dynamic range, high precision, and resistance to temperature fluctuations (Hatano et al., 2022; Hatano et al., 2023; Kubota et al., 2023; Zhao et al., 2022; Shi et al., 2023; Liu et al., 2023; Liu et al., 2024), which include an electric vehicle (EV) battery monitor (Hatano et al., 2022; Hatano et al., 2023; Kubota et al., 2023), were extensively studied.
An EV battery monitor is used to measure the charge and discharge currents of the EV battery and estimate its state of charge (SOC) (Figure 1A). The present accuracy of the EV battery monitor limits the accuracy of the SOC estimation and requires a considerable margin between the useable and inhibited regions. A measurable range of several hundred amperes is necessary for covering the rapid charging and rapid acceleration. The accuracy of conventional sensors with such a measurable range is ∼1 A. In contrast, the average current consumption of the EV is ∼10 A. A margin of 10% is required because a sensor with an accuracy of 1 A measures an average current of 10 A. If the accuracy could be improved to 10 mA while keeping the measurable range of several hundred amperes, a 10% margin could be eliminated and the cruising mileage could be increased by 10% for the same battery capacity (Figure 1B). Therefore, we developed a prototype EV battery monitor with a diamond quantum sensor that has both high sensitivity and a wide dynamic range.
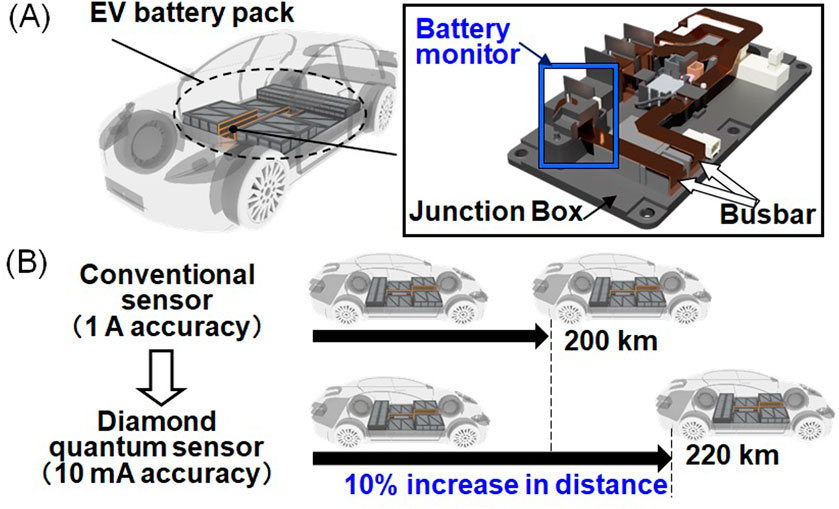
Figure 1. Electric vehicle (EV) battery monitor. (A) Battery monitor in the junction box to measure the current in the busbar from the battery pack. (B) Effect of the battery monitor with enhanced accuracy. Adapted from (Hatano et al., 2022).
The diamond sensor used in this experiment was a high-pressure high-temperature (HPHT) type Ib 2 × 2 × 1 mm3 (111) crystal containing 100 ppm P1 (N atoms). After irradiation with a 2 MeV electron beam of 3 × 1018 cm−2, the crystal was annealed at 1,000°C for 2 h in vacuum; the estimated NV− concentration was 5–6 ppm. The structure of the sensor head is shown in Figure 2A. A 2 × 2 mm2 (111) surface of a diamond sensor was adhered to the top of the multimode fibre with a core diameter of 400 μm and NA of 0.5. Further, a microwave guide connecting the inner and outer conductors of the coaxial cable surrounded the diamond sensor and applied a microwave magnetic field perpendicular to its [111] NV-axis of the diamond sensor. A sensor holder made of Polyetheretherketone (PEEK), which includes the sensor head, was attached to the busbar. The width and thickness of the busbar were 25 and 12 mm, respectively. A pair of sensor holders were placed on the lower and upper sides of the busbar as shown in Figure 2B for differential detection (Acosta et al., 2010; Shin et al., 2012; Blakley et al., 2018; Masuyama et al., 2021) for cancelling the external magnetic field noise as common mode (Figure 2C).
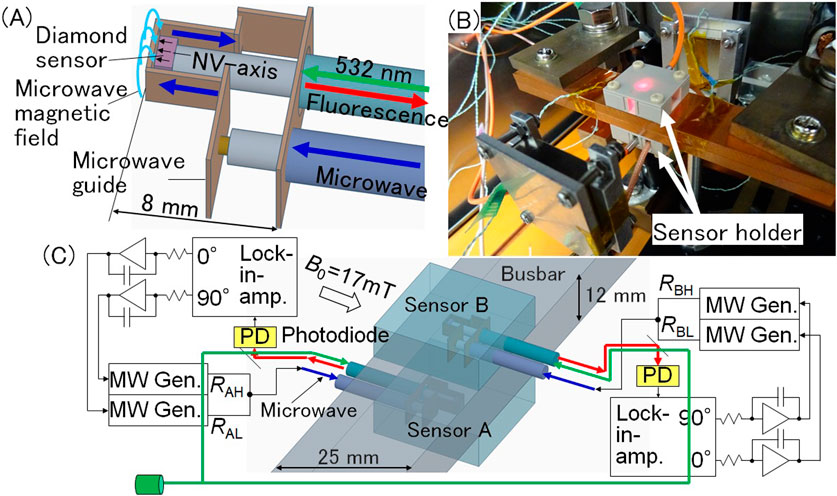
Figure 2. Measurement setup. (A) Sensor head structure including diamond sensor adhered on the fibre top and surrounding microwave guide to provide a microwave magnetic field perpendicular to the [111] NV-axis of the diamond sensor. (B) Sensor holder including the sensor head attached on the busbar. Magnet provides static magnetic field of B0 = 17 mT to sensors A and B. (C) Circuit to trace the resonance frequency difference of sensors A and B, RAH-RAL and RBH-RBL, for differential detection.
In Figure 2C, 0° and 90° quadrature outputs of the lock-in amplifier were fed back to the FM modulation terminals of the two microwave oscillators, which ensures that the two microwave frequencies always follow a set of resonance frequencies (the low- and high-frequency-side resonance frequencies RL and RH) (Hatano et al., 2021; Hatano et al., 2022; Hatano et al., 2023; Kubota et al., 2023). The amplitude and fluctuation of the resonance frequency difference change Δ(RH-RL) as the EV monitor output were measured for the busbar currents of up to 1,000 A (Hatano et al., 2022; Hatano et al., 2023). The results indicated that the amplitude was linear with respect to the busbar current (Figure 3A) and the fluctuation was less than 10 mA/
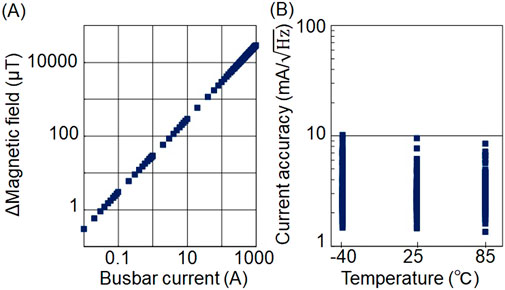
Figure 3. Measurement results of the busbar current monitor. (A) Obtained magnetic field vs current. (B) Noise level for current from 20 to 1,000 A and temperature from −40°C to 85°C. Adapted from (Hatano et al., 2022).
Furthermore, diamond sensors can intrinsically operate from cryogenic temperatures to temperatures as high as 600 K (Batalov et al., 2009; Toyli et al., 2012; Liu et al., 2019; Dong et al., 2021; Lin et al., 2021). Specifically, the normal operation from −150°C to 150°C of the EV battery monitor was verified (Kubota et al., 2023), suggesting that the prototype EV battery monitor may be applicable not only on the ground but also in space and in deep seas with hydrothermal deposits. However, implementation precautions are required to exploit the inherent performance of diamond quantum sensors. In large-current measurements, the effect of the transverse magnetic field (Rondin et al., 2014) can be observed (Hatano et al., 2023) when the alignment between the NV axis and the static and current magnetic fields are imperfect.
The effect of the transverse magnetic field was observed as a discrepancy between the resonance frequency midpoint change Δ(RL + RH)/2 and the temperature when a busbar current of 340 A was applied (Hatano et al., 2023). In the range of 0–340 A, the magnitude of the discrepancy could be observed clearly for sensor A used for differential detection with sensors A and B. On the other hand, it could not be observed clearly for sensor B. It was because the static and current magnetic field in the range of 0–340 A had the same sign for sensor A, thereby resulting in a large absolute value of the sum. For sensor B, the opposite sign was obtained, resulting in a small absolute value of the sum. The effect of the transverse magnetic field was clear for sensor A and not for sensor B. Therefore, the accuracy of misalignment estimation was better for sensor A than for sensor B. Theoretically, misalignment was expected to affect linearity; however, the effect of the misalignment on linearity could not be recognized because of the low misalignment estimation accuracy of sensor B.
In this report, we analyse the resonance frequency midpoint change for current up to ±1,000 A, which is bipolar and larger than +340 A. Both sensors in the differential pair have the static and current magnetic field in the same sign either at +1,000 A or −1,000 A. Therefore, the effect of the transverse magnetic field caused by them would be expected to be more clearly observed if misalignment should exist, which was expected to provide an accurate estimate of the misalignment of both sensors in the differential pair. Then we will investigate if the compensation of the estimated misalignment enables accurate simultaneous temperature and magnetic field measurements with the resonance frequency midpoint changes and also accurate linearity in the wide dynamic range with the resonance frequency difference changes.
Experimental results
In the experiment, the busbar current was varied from 0 to 1,000 A to 0 A and then from 0 A to −1,000 A to 0 A at room temperature of 25°C. A current source (Kikusui PAT20-400) supplied ±1,000 A in 20 A steps with a 2 s width as shown in Figure 4A. The resonance frequency difference change is shown in Figure 4B. The resonance frequency difference change of sensors A and B, as well as their difference, showed a waveform similar to that of the busbar current. The change in the midpoint of the resonance frequency is shown in Figure 4C. Figure 4D shows the measured busbar temperature and estimated temperatures of sensors A and B. To estimate the sensor temperatures, the busbar temperature was assumed to be transferred to the sensors with attenuation and delay caused by the thermal resistance and heat capacity of the sensor holder. The busbar temperature was directly measured using thermocouple. The thermal resistance and heat capacity were estimated from the resonance frequency midpoint changes at 250–590 s and 790–1,000 s, where there was no applied current.
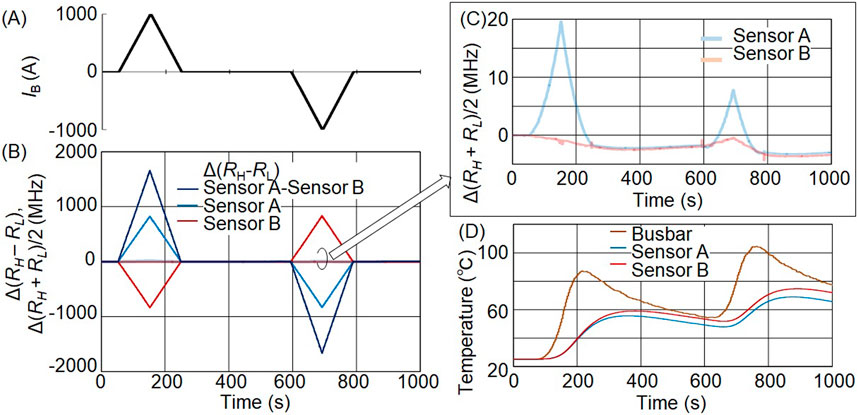
Figure 4. Changes in the resonance frequency and temperature of sensors A and B when ±1,000 A is applied as IB. (A) Busbar current IB waveform provided as 20 A steps and 2 s width. (B) Observed resonance frequency difference change Δ(RH–RL) and resonance frequency midpoint change Δ(RH + RL)/2 of sensors A, sensor B, and sensor A – sensor B. The resonance frequency midpoint change is smaller than the resonance frequency difference change of ±1,600 MHz and shown enlarged in (C), where ∼20 MHz change at the maximum is observed. (D) Busbar temperature measured near the sensor by the thermocouple and estimated temperatures of sensors A and B, where the busbar temperature is assumed to be transferred to the diamond sensor with attenuation and delay because of the thermal resistance and heat capacity of the sensor holder.
In Figure 4C, the resonance frequency midpoint change of sensor A shifts to the high-frequency side when ±1,000 A is applied, clearly showing the opposite direction to the temperature rise and showing the effect of the transverse magnetic field. Likewise, the resonance frequency midpoint of sensor B clearly shifts to the high-frequency side when −1,000 A is applied. However, the shift is not clear when +1,000 A is applied. This is supposed to be due to the smaller misalignment in sensor B.
Let θ and φ be the misalignment between the [111] NV-axis of the diamond sensor and the static and current magnetic field, respectively (Figure 5A). The zero-field frequency is fc, the static magnetic field is B0, and the proportionality coefficient of the magnetic field to the current I is α; the temperature changes affect fc. Then RL and RH are given as:
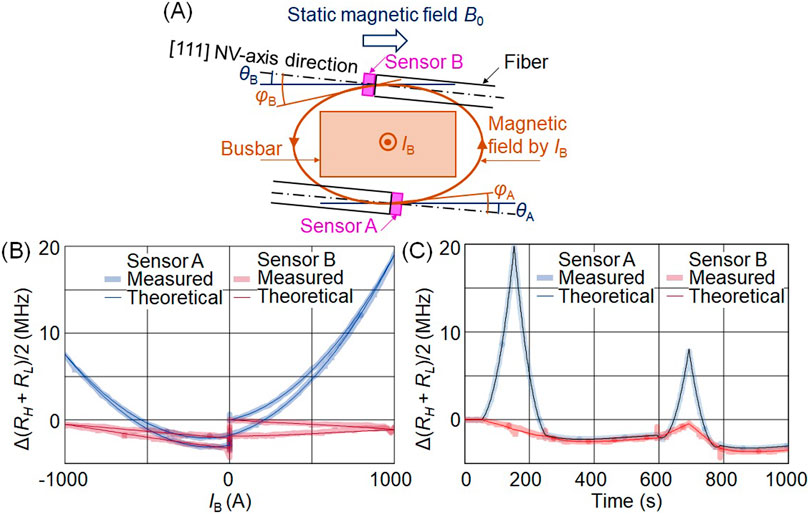
Figure 5. Estimation of the misalignment between the [111] NV-axis and static magnetic field θ and current magnetic field φ, by comparing the measured and theoretical values of resonance frequency midpoint change when the busbar current IB is applied. (A) Illustration of θ and φ for sensors A and B overlapped with the cross-sectional view of the busbar, fiber, and diamond sensor. (B) Coincidence of the measured and theoretical values of resonance frequency midpoint change for horizontal axes as Ib. θA = 3°, φA = 21.5°, θB = 6°, φB = 3°assumed. (C) Ibid for horizontal axes as time. Spikes in the measured occurs in the edge in 20 A steps from the current source.
In Equations 1–4, γ, ω∥, and ω⊥ represent the gyromagnetic ratio, longitudinal magnetic field multiplied by γ, and transverse magnetic field multiplied by γ, respectively. We tried to estimate θ and φ from the observed resonance frequency midpoint changes in Figure 4C and estimated sensor temperature in Figure 4D. The following processes were used.
(i) Assuming θ and φ, three parameters of fc, B0, and α can be theoretically estimated from the changes of RL and RH in the initial current rise-up period from 0 A to +1,000 A.
(ii) Using the fc, B0, and α estimated in (i) as well as assumed θ and φ, the resonance frequency midpoint change in the whole current rise-up and fall-down period is theoretically calculated.
(iii) The measured resonance frequency midpoint change is compared with (ii).
The above (i), (ii), (iii) process are repeated to obtain best θ and φ for coincidence in (iii) with ±1° accuracy.
Thus obtained θ and φ for sensors A and B were:
Using the above misalignments, the obtained theoretical values of the resonance frequency midpoint change are compared with the measured values and shown in Figures 5B, C. In Figure 5B, the horizontal axis is the busbar current IB, and in Figure 5C, the horizontal axis is time. The measured values were in good agreement with the theoretical ones.
Discussions and conclusions
It was shown that misalignment can be estimated with an accuracy of ±1° by measuring transverse magnetic field effects. The coincidence between the theoretical and measured resonance frequency midpoints change in Figure 5B indicates that compensating for transverse magnetic field effects using the estimated misalignment enables accurate simultaneous temperature and magnetic field measurements with the resonance frequency midpoint changes, even when high current is applied.
Now we discuss the resonance frequency difference change affected by the transverse magnetic field. This effect is caused by the difference of the third transverse magnetic field effect term Equations 1, 2. The theoretical effect of the misalignment of (Equation 5) on the resonance frequency difference is shown in Figure 6A. It attains 4 MHz when 1,000 A is applied. This value is smaller than the 20 MHz effect on the resonance frequency midpoint shown in Figure 4C. However, its effect on the linearity of current measurement was investigated. In order to discuss the linearity, we define the normalized gain as follows:
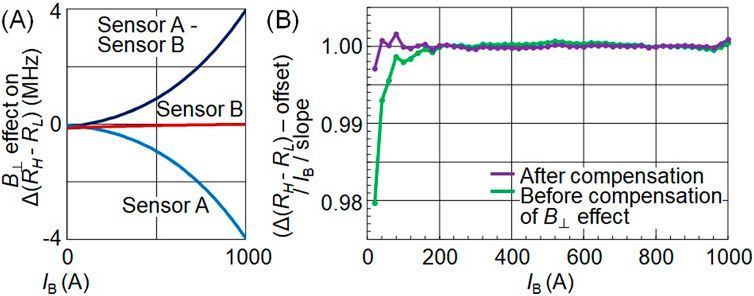
Figure 6. (A) Transverse magnetic field effect on resonance frequency difference change. (B) Improved linearity by the compensation of the transverse magnetic field effect. The horizontal axis is the busbar current IB. The vertical axis is the normalized gain defined as: Normalised gain ≡ ((resonance frequency difference change) – (offset))/ IB/ (slope). The coefficients (slope) and (offset) of Yi = (slope)・Xi + (offset) are obtained by the least-squares fit for the entire 0 → + 1,000 A rise. Yi represents the i-th resonance frequency difference change and Xi represents the busbar current. Then, (Yi - (offset))/ Xi/(slope) is recalculated for each measurement point. The observed linearity error is improved within the current source (Kikusui PAT20-400) accuracy (0.5%) in 20–1,000 A range after compensating for the effect of estimated misalignment between the NV-axis and the static and current magnetic fields on the resonance frequency difference.
The coefficients (slope) and (offset) of Yi = (slope)・Xi + (offset) are obtained by the least-squares fit for the entire 0→+1,000 A rise. Yi represents the i-th resonance frequency difference change and Xi represents the busbar current. Then, (Yi - (offset))/ Xi/(slope) is recalculated for each measurement point.
In Figure 6B, normalised gain obtained by Equation 6 is closer to 1.0 after compensation than before for the effects of transverse magnetic fields. As a result, linearity error of less than ±0.3% was obtained for 20–1,000 A, which is within the accuracy of 0.5% of the current source used. We had tried same investigation with 340 A (Hatano et al., 2023). However, no recognizable improvement in linearity was observed with the compensation of transverse magnetic field effects probably due to the lack of the misalignment estimation accuracy in 340 A measurement.
These results show that compensation of transverse magnetic field effects based on the estimation of ±1° misalignment is effective not only in improving the accuracy of simultaneous temperature and magnetic field measurements, but also in improving linearity over a wide dynamic range. Moreover, understanding misalignment is expected to contribute to accurate alignment of the two sensors used for differential detection. This is important because the [111] NV-axis of the two sensors is expected to be as parallel as possible to eliminate external noise as common mode in differential detection.
Of course, maintaining misalignment under vibration and temperature change in an in-vehicle environment is certainly a technical challenge. Design considerations such as tightly fixing the sensor holder and busbar to prevent mutual movement between them would be necessary.
Summary
We studied key implementation points necessary to achieve the ideal accuracy when applying (111) diamond quantum sensors to EV battery monitors. In the EV battery monitor measurements using diamond sensors, the resonance frequency midpoint exhibited a transition inversely related to the temperature change when high currents were applied. This phenomenon was supposed to be caused by the misalignment between the static and current magnetic fields and the [111] NV-axis.
Analysing the resonance frequency midpoint change when ±1,000 A were applied, we could estimate the static and current magnetic field misalignment with respect to the [111] NV-axis within ±1° accuracy. The resonance frequency midpoint change was found to be consistent with the temperature change by compensating for transverse magnetic field effects. The linearity from 0 to 1,000 A was also improved when the effect of the transverse magnetic field on the resonance frequency difference change estimated from the obtained misalignment was compensated. The remaining error was within the accuracy specifications of the current source.
Now, a method for quantifying the misalignment between the NV-axis of the diamond sensor and the static and current magnetic fields has been developed, and the misalignment can be minimised. This is furthermore expected to contribute to accurate alignment of the two sensors used for differential detection to eliminate external noise as common mode.
Data availability statement
The datasets presented in this article are not readily available because the data that support the findings of this study are available from the corresponding author upon reasonable request. Requests to access the datasets should be directed to aGF0YW5vLnkuYWFAbS50aXRlY2guYWMuanA=.
Author contributions
YH: Conceptualization, Data curation, Investigation, Methodology, Software, Validation, Writing–original draft, Writing–review and editing. JT: Conceptualization, Data curation, Investigation, Methodology, Software, Validation, Writing–review and editing. AN: Conceptualization, Data curation, Investigation, Methodology, Software, Validation, Writing–review and editing. TS: Conceptualization, Data curation, Investigation, Methodology, Software, Validation, Writing–review and editing. YK: Methodology, Validation, Writing–review and editing. HA: Resources, Writing–review and editing. SO: Resources, Writing–review and editing. TO: Resources, Writing–review and editing. TI: Conceptualization, Funding acquisition, Project administration, Supervision, Writing–review and editing. MH: Conceptualization, Funding acquisition, Project administration, Supervision, Writing–review and editing.
Funding
The author(s) declare that financial support was received for the research, authorship, and/or publication of this article. This work was supported by Ministry of Education, Culture, Sports, Science and Technology (MEXT) Q-LEAP (Grant No. JPMXS0118067395).
Conflict of interest
Authors JT and AN were employed by YAZAKI Corporation.
The remaining authors declare that the research was conducted in the absence of any commercial or financial relationships that could be construed as a potential conflict of interest.
The author(s) declared that author TO was an editorial board member of Frontiers, at the time of submission. This had no impact on the peer review process and the final decision.
Publisher’s note
All claims expressed in this article are solely those of the authors and do not necessarily represent those of their affiliated organizations, or those of the publisher, the editors and the reviewers. Any product that may be evaluated in this article, or claim that may be made by its manufacturer, is not guaranteed or endorsed by the publisher.
References
Acosta, V., Bauch, E., Jarmola, A., Zipp, L., Ledbetter, M., and Budker, D. (2010). Broadband magnetometry by infrared-absorption detection of nitrogen-vacancy ensembles in diamond. Appl. Phys. Lett. 97, 174104. doi:10.1063/1.3507884
Acosta, V., Bauch, E., Ledbetter, M., Santori, C., Fu, K., Barclay, P., et al. (2009). Diamonds with a high density of nitrogen-vacancy centers for magnetometry applications. Phys. Rev. B 80, 115202. doi:10.1103/physrevb.80.115202
Alsid, S., Schloss, J., Steinecker, M., Barry, J., Maccabe, A., Wang, G., et al. (2023). Solid-state microwave magnetometer with picotesla-level sensitivity. Phys. Rev. Appl. 19, 054095. doi:10.1103/physrevapplied.19.054095
Arai, K., Kuwahata, A., Nishitani, D., Fujisaki, I., Matsuki, R., Nishio, Y., et al. (2022). Millimetre-scale magnetocardiography of living rats with thoracotomy. Commun. Phys. 5, 200. doi:10.1038/s42005-022-00978-0
Barry, J., Steinecker, M., Alsid, S., Majumder, J., Pham, L., O'Keefe, M., et al. (2023). Sensitive AC and DC magnetometry with nitrogen-vacancy center ensembles in diamond. Available at: https://doi.org/10.48550/arXiv.2305.06269 (Accessed May 10, 2023).
Barry, J., Turner, M., Schloss, J., Glenn, D., Song, Y., Lukin, M., et al. (2016). Optical magnetic detection of single-neuron action potentials using quantum defects in diamond. PNAS 113, 14133–14138. doi:10.1073/pnas.1601513113
Batalov, A., Jacques, V., Kaiser, F., Siyushev, P., Neumann, P., Rogers, L., et al. (2009). Low temperature studies of the excited-state structure of negatively charged nitrogen-vacancy color centers in diamond. Phys. Rev. Lett._ 102, 195506. doi:10.1103/physrevlett.102.195506
Blakley, S., Fedotov, I., Becker, J., and Zheltikov, A. (2018). Quantum stereomagnetometry with a dual-core photonic-crystal fiber. Appl. Phys. Lett. 113, 011112. doi:10.1063/1.5024583
Clevenson, H., Trusheim, M., Teale, C., Schröder, T., Braje, D., and Englund, D. (2015). Broadband magnetometry and temperature sensing with a light-trapping diamond waveguide. Nat. Phys. 11, 393–397. doi:10.1038/nphys3291
Dong, B., Shi, C., Xu, Z., Wang, K., Luo, H., Sun, F., et al. (2021). Temperature dependence of optical centers in Ib diamond characterized by photoluminescence spectra. Diam. Relat. Mater. 116, 108389. doi:10.1016/j.diamond.2021.108389
Graham, S., Rahman, A., Munn, L., Patel, R., Newman, A., Stephen, C., et al. (2023). Fiber-Coupled diamond magnetometry with an unshielded sensitivity of 30 pT/√Hz. Phys. Rev. Appl. 19, 044042. doi:10.1103/physrevapplied.19.044042
Hansen, N., Webb, J., Troise, L., Olsson, C., Tomasevic, L., Brinza, O., et al. (2023). Microscopic-scale magnetic recording of brain neuronal electrical activity using a diamond quantum sensor. Sci. Rep. 13, 12407. doi:10.1038/s41598-023-39539-y
Hatano, Y., Shin, J., Nishitani, D., Iwatsuka, H., Masuyama, Y., Sugiyama, H., et al. (2021). Simultaneous thermometry and magnetometry using a fiber-coupled quantum diamond sensor. Appl. Phys. Lett. 118, 034001. doi:10.1063/5.0031502
Hatano, Y., Shin, J., Tanigawa, J., Shigenobu, Y., Nakazono, A., Sekiguchi, T., et al. (2022). High-precision robust monitoring of charge/discharge current over a wide dynamic range for electric vehicle batteries using diamond quantum sensors. Sci. Rep. 12, 13991. doi:10.1038/s41598-022-18106-x
Hatano, Y., Tanigawa, J., Nakazono, A., Sekiguchi, T., Onoda, S., Ohshima, T., et al. (2023). A wide dynamic range diamond quantum sensor as an electric vehicle battery monitor. Phil. Trans. R. Soc. A 382, 20220312. doi:10.1098/rsta.2022.0312
Ibrahim, M., Foy, C., Englund, D., and Han, R. (2021). High-scalability CMOS quantum magnetometer with spin-state excitation and detection of diamond color centers. IEEE J. Solid-State Circuits 56, 1001–1014. doi:10.1109/jssc.2020.3027056
Kim, D., Ibrahim, M., Foy, C., Trusheim, M., Han, R., and Englund, D. (2019). A CMOS-integrated quantum sensor based on nitrogen–vacancy centres. Nat. Electron. 2, 284–289. doi:10.1038/s41928-019-0275-5
Kubota, K., Hatano, Y., Kainuma, Y., Shin, J., Nishitani, D., Shinei, C., et al. (2023). Wide temperature operation of diamond quantum sensor for electric vehicle battery monitoring. Diam. Relat. Mater. 135, 109853. doi:10.1016/j.diamond.2023.109853
Lin, S., Weng, C., Yang, Y., Zhao, J., Guo, Y., Zhang, J., et al. (2021). Temperature dependent coherence properties of NV ensemble in diamond up to 600K. Phys. Rev. B 104, 155430. doi:10.1103/physrevb.104.155430
Liu, G., Feng, X., Wang, N., Li, Q., and Liu, R. (2019). Coherent quantum control of nitrogen-vacancy center spins near 1000 kelvin. Nat. Commun. 10, 1344. doi:10.1038/s41467-019-09327-2
Liu, Q., Xie, F., Peng, X., Hu, Y., Wang, N., Zhang, Y., et al. (2023). Millimeter-Scale temperature self-calibrated diamond-based quantum sensor for high-precision current sensing. Adv. Quantum Technol. 6, 2300210. doi:10.1002/qute.202300210
Liu, Q., Xie, F., Peng, X., Zhang, Y., Wang, N., Hu, Y., et al. (2024). Closed loop diamond quantum sensor for large range and high precision current measurement. IEEE Sens. J. 24, 4356–4364. doi:10.1109/jsen.2023.3348161
Masuyama, Y., Mizuno, K., Ozawa, H., Ishiwata, H., Hatano, Y., Ohshima, T., et al. (2018). Extending coherence time of macro-scale diamond magnetometer by dynamical decoupling with coplanar waveguide resonator. Rev. Sci. Instrum. 89, 125007. doi:10.1063/1.5047078
Masuyama, Y., Suzuki, K., Hekizono, A., Iwanami, M., Hatano, M., Iwasaki, T., et al. (2021). Gradiometer using separated diamond quantum magnetometers. Sensors 21, 977. doi:10.3390/s21030977
Nusran, N., Momeen, M., and Gurudev Dutt, M. (2012). High-dynamic-range magnetometry with a single electronic spin in diamond. Nat. Nanotechnol. 7, 109–113. doi:10.1038/nnano.2011.225
Rondin, L., Tetienne, J., Hingant, T., Roch, J., Maletinsky, P., and Jacques, V. (2014). Magnetometry with nitrogen-vacancy defects in diamond. Rep. Prog. Phys. 77, 056503. doi:10.1088/0034-4885/77/5/056503
Sekiguchi, N., Fushimi, M., Yoshimura, A., Shinei, C., Miyakawa, M., Taniguchi, T., et al. (2024). Diamond quantum magnetometer with dc sensitivity of < 10 pT Hz-1/2 toward measurement of biomagnetic field. Phys. Rev. Appl. 21, 064010. doi:10.1103/physrevapplied.21.064010
Shi, Z., Gao, W., Wang, Q., Guo, H., Tang, J., Li, Z., et al. (2023). Current sensor based on diamond nitrogen-vacancy color center. Chin. Phys. B 32, 070704. doi:10.1088/1674-1056/acc3fe
Shim, J., Lee, S., Ghimire, S., Hwang, J., Lee, K., Kim, K., et al. (2022). Multiplexed sensing of magnetic field and temperature in real time using a nitrogen-vacancy ensemble in diamond. Phys. Rev. Appl. 17, 014009. doi:10.1103/physrevapplied.17.014009
Shin, C., Avalos, C., Butler, M., Trease, D., Seltzer, S., Mustonen, J., et al. (2012). Room-temperature operation of a radiofrequency diamond magnetometer near the shot-noise limit. J. Appl. Phys. 112, 124519. doi:10.1063/1.4771924
Toyli, D., Christle, D., Alkauskas, A., Buckley, B., Van de Walle, C., and Awschalom, D. (2012). Measurement and control of single nitrogen-vacancy center spins above 600 K. Phys. Rev. X 2, 031001. doi:10.1103/physrevx.2.031001
Webb, J., Troise, L., Hansen, N., Olsson, C., Wojciechowski, A., Achard, J., et al. (2021). Detection of biological signals from a live mammalian muscle using an early stage diamond quantum sensor. Sci. Rep. 11, 2412. doi:10.1038/s41598-021-81828-x
Wolf, T., Neumann, P., Nakamura, K., Sumiya, H., Ohshima, T., Isoya, J., et al. (2015). Subpicotesla diamond magnetometry. Phys. Rev. X 5, 041001. doi:10.1103/physrevx.5.041001
Zhang, C., Shagieva, F., Widmann, M., Kübler, M., Vorobyov, V., Kapitanova, P., et al. (2021). Diamond magnetometry and gradiometry towards subpicotesla dc field measurement. Phys. Rev. Appl. 15, 064075. doi:10.1103/physrevapplied.15.064075
Keywords: diamond, NV-centres, current sensor, battery, electric vehicle
Citation: Hatano Y, Tanigawa J, Nakazono A, Sekiguchi T, Kainuma Y, Abe H, Onoda S, Ohshima T, Iwasaki T and Hatano M (2024) Transverse magnetic field effects on diamond quantum sensor for EV battery monitor. Front. Quantum Sci. Technol. 3:1432096. doi: 10.3389/frqst.2024.1432096
Received: 13 May 2024; Accepted: 15 August 2024;
Published: 03 September 2024.
Edited by:
Adam Gali, Hungarian Academy of Sciences, HungaryReviewed by:
Jonas Nils Becker, Michigan State University, United StatesGuodong Bian, Hungarian Academy of Sciences, Hungary
Copyright © 2024 Hatano, Tanigawa, Nakazono, Sekiguchi, Kainuma, Abe, Onoda, Ohshima, Iwasaki and Hatano. This is an open-access article distributed under the terms of the Creative Commons Attribution License (CC BY). The use, distribution or reproduction in other forums is permitted, provided the original author(s) and the copyright owner(s) are credited and that the original publication in this journal is cited, in accordance with accepted academic practice. No use, distribution or reproduction is permitted which does not comply with these terms.
*Correspondence: Yuji Hatano, aGF0YW5vLnkuYWFAbS50aXRlY2guYWMuanA=