 Kamran Irandoust
 Rajabali Daroudi
 Maryam Tajvar
 Mehdi Yaseri
- 1Department of Health Management, Policy, and Economics, School of Public Health, Tehran University of Medical Sciences, Tehran, Iran
- 2Department of Epidemiology and Biostatistics, School of Public Health, Tehran University of Medical Sciences, Tehran, Iran
Background: The health status of a population is influenced by multiple determinants, including clinical care, health behaviors, the physical environment, and socioeconomic factors. This study examines the impact of these determinants on life expectancy (LE) and health-adjusted life expectancy (HALE) at both regional and global levels using econometric analysis.
Methods: This ecological study included all 194 WHO member countries from 2000 to 2018. The County Health Rankings Model was used to identify key health determinants. Thirty-six indicators were selected to measure these determinants, with data collected from the World Bank, World Health Observatory, Global Health Expenditure Database, Gapminder, United Nations Human Development Reports, and Global Burden of Disease Studies. LE and HALE were used as health status indicators, with data extracted from the Global Burden of Disease Study 2019 database. A multilevel mixed-effects linear regression model was applied for statistical analysis using Stata 16 software.
Results: At the global level, the regression coefficients (β) with LE and HALE were 0.09 and 0.10 for education, −0.04 and −0.10 for injuries, 0.5 and 0.6 for urbanization, 0.10 and 0.8 for access to basic drinking water, −0.5 and −0.4 for drug use, 0.4 and 0.3 for obesity, and −0.15 and −0.16 for sexually transmitted infections, respectively. Sexually transmitted infections (β = −0.25) in the African region, access to basic drinking water (β = 0.30), alcohol consumption (β = −0.06), and drug use (β = −0.02) in the Americas, injuries (β = −0.16), air pollution (β = −0.10), and obesity (β = −0.24) in the Eastern Mediterranean, urbanization (β = 0.08) in Southeast Asia, and education (β = 0.36) and smoking (β = −0.06) in the Western Pacific had the greatest impact on HALE compared to other regions (P < 0.05).
Conclusion: To reduce inequalities, improve public health outcomes, and ensure efficient resource allocation, global and interregional policies should prioritize the determinants with the highest β values for health indicators in each region. These determinants are expected to yield greater marginal health benefits, making investments in them more cost-effective.
1 Introduction
Concepts of health have developed at different stages throughout the history of public health development. In today's world, health is not a unique trait determined by genetic makeup alone. Rather, health is mainly shaped by a set of environmental and social factors that enable the unique expression of the genetic structure (1). Based on socio-ecological thinking, human health and its determinants are related and different determinants of health lead to different patterns in the burden of diseases (2, 3). In fact, the health status of a population can be determined by a combination of health determinants including health care, lifestyle, physical environment and socioeconomic factors (4, 32). These preventable factors influence health opportunities, health-seeking behaviors and lifestyles, as well as disease outcomes (5), and are considered one of the most effective public health strategies to reduce disease and health harms (6).
Advances in public health and rapid advances in socio-economic and medical technologies over the past 30 years have resulted in gains in life and continued improvement in global life expectancy (LE). However, long survival does not equal good quality of life (7, 8). Therefore, healthy life expectancy or health-adjusted life expectancy (HALE) has provided a new perspective to assess quality of life (9). HALE aims to summarize the number of years that a person can expect to live in full health by taking into account years lived in less than full health due to disease and/or injury (4). The World Health Organization (WHO) reported an increase of 6.6 and 5.4 years from 2000 to 2019 in LE and HALE at birth, indicating that longevity and healthy LE may differ (10). However, the correlation between HALE and raw LE indicators is very high and significant (4). LE and HALE have increased in many parts of the world (11). However, these gains in life years and years lived in good health are not equally distributed among all population groups, and there are inequalities according to factors such as socioeconomic status (12). Reports on health equity have shown that differences in health are due to social differences. According to these reports, low social classes have higher mortality rates and more chronic diseases than high social classes (13, 14). The Commission on Social Determinants of Health of the WHO, in one of its final reports on closing the gap and inequality in one generation, concluded that achieving health equity requires action on the conditions in which people are born, grow, work, live, and age. It also confirmed the structural drivers of these conditions at the global, regional, national and local levels (15).
Since understanding the distribution and changes of these inequalities over time is increasingly important for developing policies aimed at advancing health equity and health promotion, as well as prioritizing efficient and effective resource allocation, this study investigates the impact of health determinants on LE and HALE at the global and regional levels. The study is framed within the conceptual framework of socio-ecological models, which suggest that human health is influenced by a wide range of factors across different levels. Using econometric analysis of data from 194 WHO member countries between 2000 and 2018, the study identifies the health determinants that have the greatest impact on health in each region.
2 Methods
The present ecological study is a retrospective descriptive-analytical investigation conducted using data from 2000 to 2018. The study encompassed all 194 WHO Member States as its statistical population. Inclusion in the study was based on a country's WHO membership, while exclusion was determined by non-membership in the WHO. To explore the influence of global and regional determinants on LE and HALE, this research followed an eight- stage process.
Stage 1—Selecting the health determinants model: first, to select the determinants of health, it was necessary to identify them according to a specific framework or model. In this study, considering the nature and requirements of the research, we examined and compared various models and ultimately chose the County Health Rankings & Roadmaps Model to guide this study (see Supplementary Figure 1). According to this model, 13 health determinants can be identified, categorized into four general groups: clinical care, social and economic factors, physical environment, and health behaviors (16, 32).
Stage 2—Selection of indicators according to the model: at this stage, based on the model selected in Stage 1, we explored and identified indicators to measure the variables of the model. To this end, by reviewing similar studies and global databases, 36 indicators were chosen to measure the 13 health determinants, and 2 indicators of LE and HALE were selected to measure health status, as detailed in Table 1.
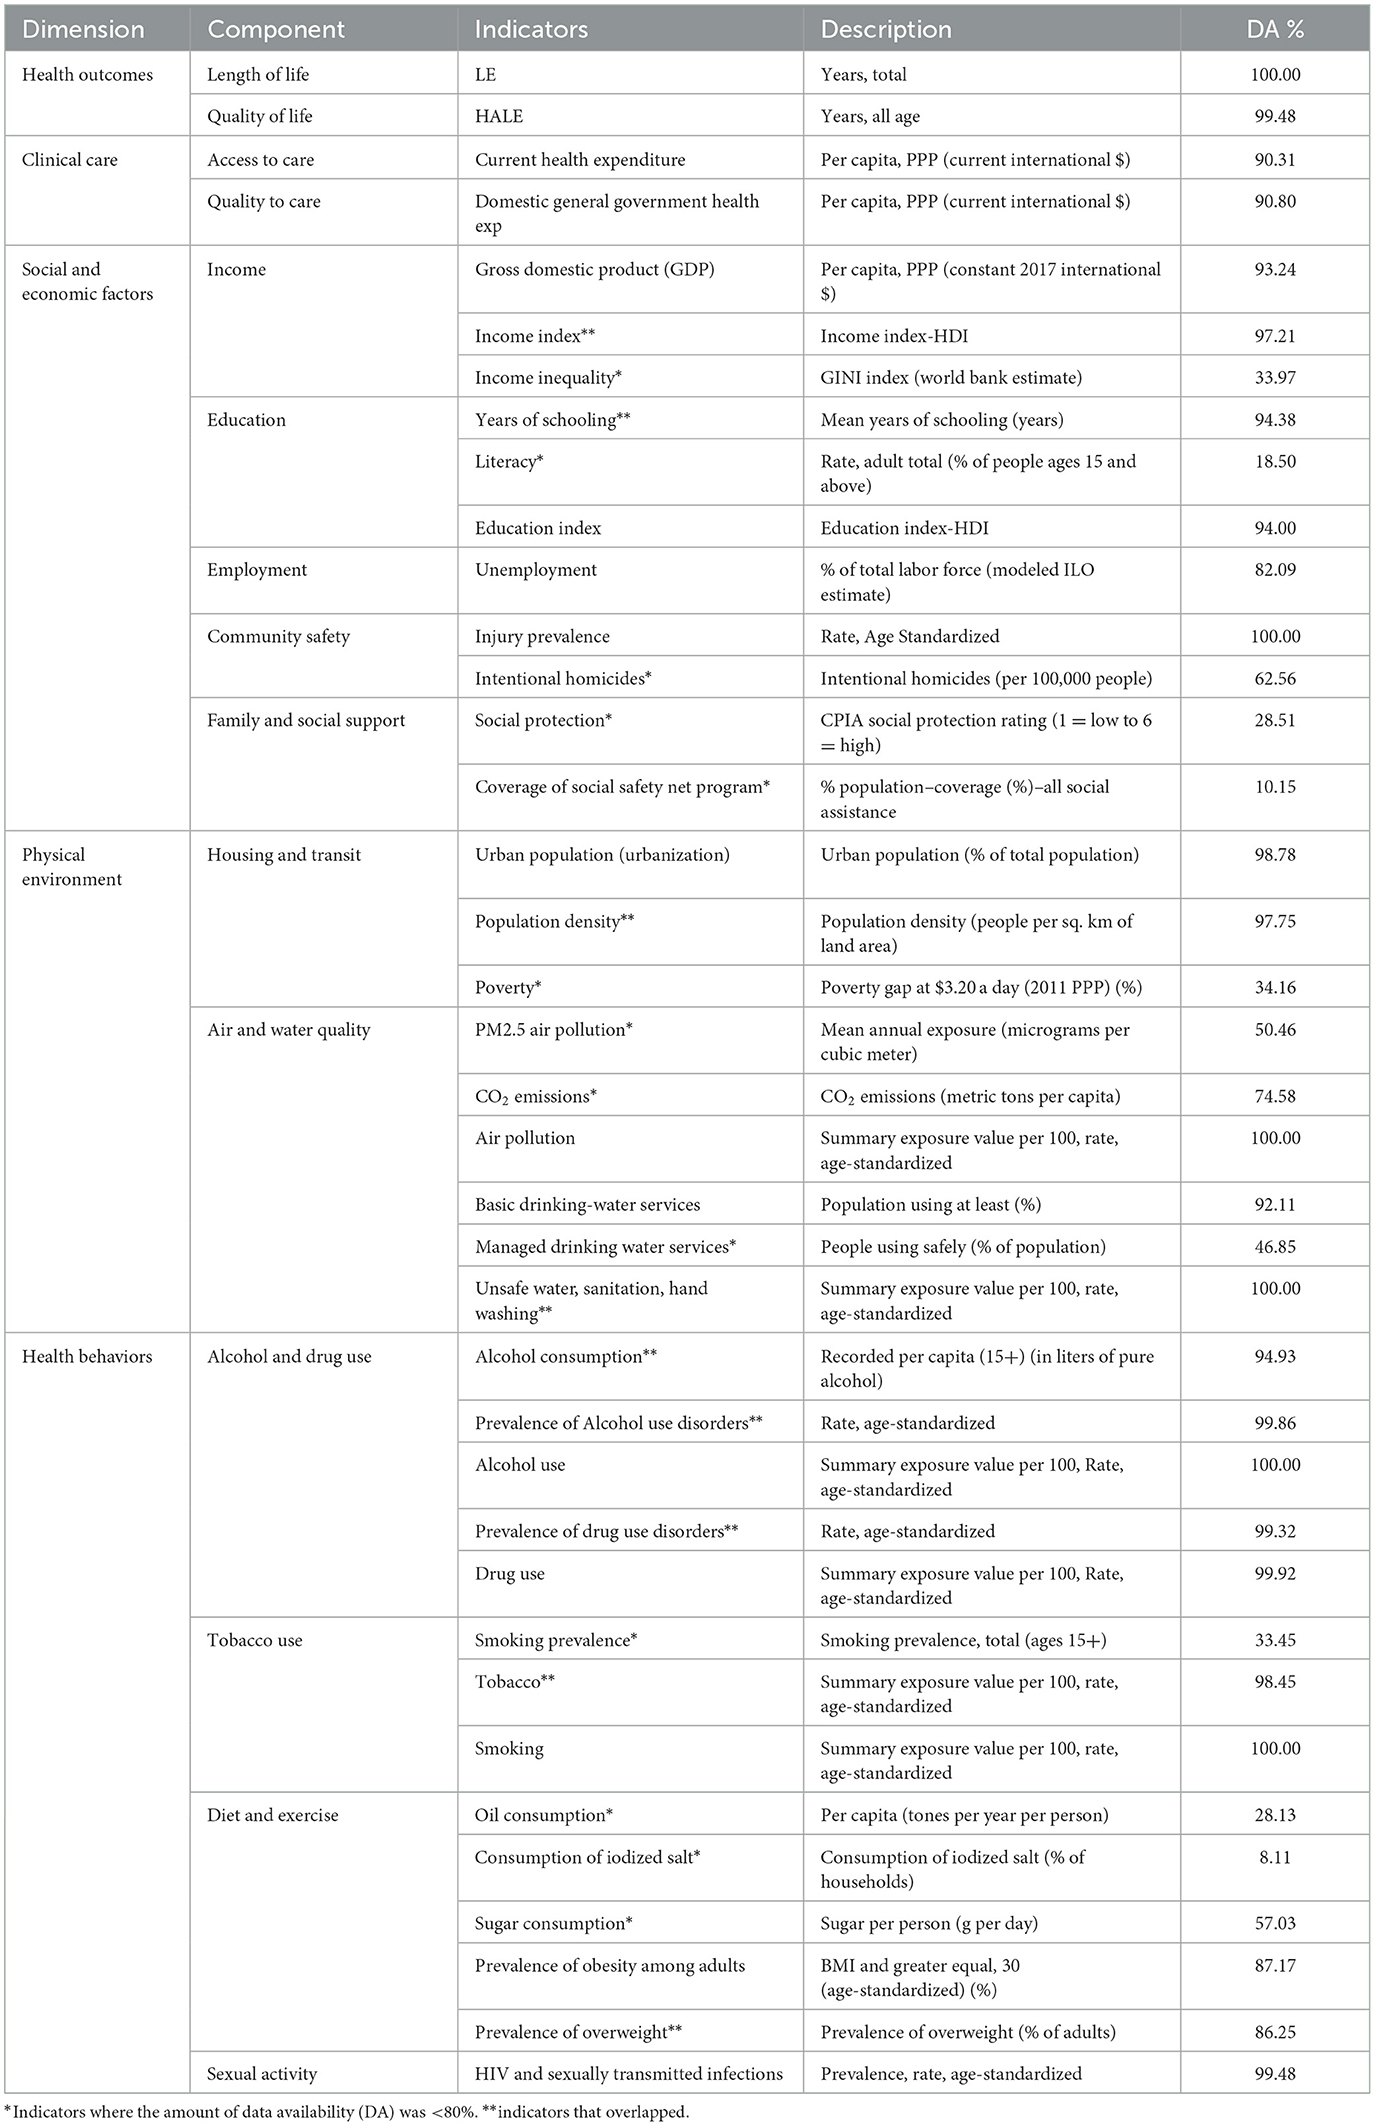
Table 1. Selected indicators to measure health outcomes and health determinants.
Stage 3—Identification and selection of countries by regions: All WHO member countries, totaling 194 countries, were included in the study. The list of these countries, categorized by region, is provided in Supplementary Table 1.
Stage 4—Collecting data for selected indicators and countries: at this stage, data for 36 health determinant indicators were extracted from the databases of the World Bank, World Health Observatory, Global Health Expenditure Database, Gapminder, United Nations Human Development Reports, and Global Burden of Disease Studies. Additionally, data for 2 health status indicators were extracted from the Global Burden of Disease Study 2019 database. It should be noted that for indicators with data available in multiple databases, the database with the most complete data was used. The access links for each of these databases are provided in Supplementary Table 2.
Stage 5—Creating a panel data file: in this study, as the data consists of both time-series data (2000–2018) and cross-sectional data (all WHO member countries), the data is categorized as panel data. Excel 2010 software was used to create a panel data file, which includes 36 health determinant indicators and two health status indicators for 194 countries between 2000 and 2018.
Stage 6—Data refinement: at this stage, we first checked the accuracy of the data and then removed outlier data. Additionally, we calculated the data availability for each of the indicators, as shown in Table 1. The purpose of removing outlier data was to prevent spurious regressions in the statistical analysis.
Stage 7—Finalizing the indicators: to finalize the indicators of the study, we excluded unnecessary indicators through four steps: First, using a multilevel mixed-effects linear regression model, we performed univariate analysis to test the significant relationships between the 36 health determinant indicators and the 2 health status indicators. Since this was a univariate analysis, a separate model was defined for each health determinant, repeated 72 times using Stata software. After performing this test for all variables, we excluded indicators with a p-value above 0.1 (see Supplementary Table 3). Second, indicators with < 80% data availability were excluded from the study (marked with * in Table 1). Third, overlapping indicators were excluded (marked with ** in Table 1). Fourth, using the multilevel mixed-effects linear regression model, we performed multiple analysis for the remaining indicators, entering all health determinant indicators into the model at once. After the multiple analysis, indicators with a p < 0.1 were excluded—this process involved removing the indicator with the highest p-value above 0.1 first, then rerunning the model, and repeating this process until no indicator with a p < 0.1 remained in the final model. After these four steps, 11 indicators were retained to explain LE, and 10 indicators to explain HALE were entered into the final model for statistical analysis (see Supplementary Table 4).
Stage 8—Selection of statistical model and data analysis: at this stage, we transformed both the dependent and independent variables by applying natural logarithms to normalize the data and address any skewness. This transformation was essential to ensure the proper distribution of the variables. We then employed a multilevel mixed-effects linear regression model to analyze the relationship between health determinants (independent variables) and health status (dependent variables), accounting for the hierarchical structure of the data (country-level and time-level).
Based on statistical criteria, the nature of our data, and the study's objectives, we selected a random-effects model. This choice was justified by the significant variation across groups, which allowed us to capture unobserved heterogeneity. Additionally, the random-effects model enabled us to retain time-invariant variables, ensuring a comprehensive analysis.
For data analysis, we used STATA 16 software, and R version 4.0.3 was employed for data visualization.
3 Results
3.1 Global analysis
The analytical findings of the present study at the global level showed that the regression coefficients (β) with LE and HALE were 0.09 and 0.10 for education, −0.04 and −0.10 for injuries, 0.5 and 0.6 for urbanization, 0.10 and 0.8 for drinking water, −0.5 and −0.4 for drugs, 0.4 and 0.3 for obesity, and −0.15 and −0.16 for sexually transmitted infections, respectively. In this way, at the global level, the effect of education, injuries, and urbanization variables on HALE was greater than LE, but the effect of drinking water, drugs, and obesity variables on LE was greater than HALE (P < 0.05; Table 2).
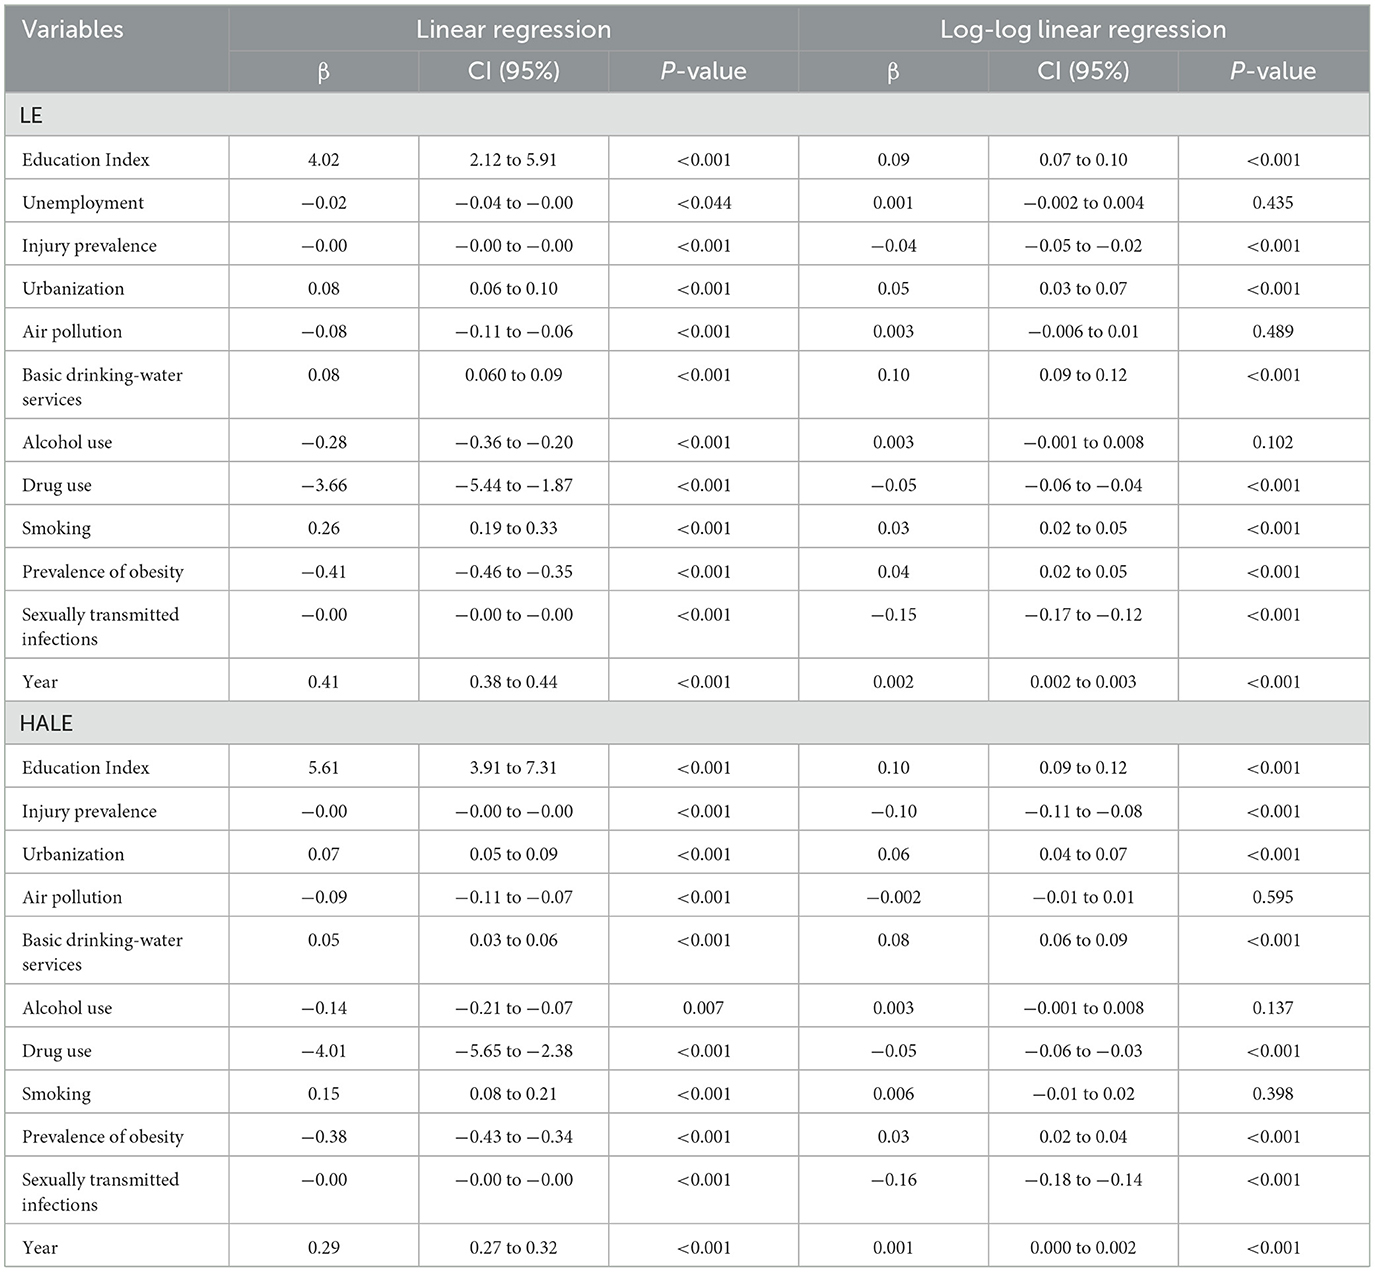
Table 2. Regression analysis results at the global level (2000–2018).
As mentioned in the global findings above, the variables of sexually transmitted infections (β = −0.15), drinking water (β = 0.10), and education (β = 0.09) have the greatest role in explaining LE. In this way, it can be stated that a one-percent increase in sexually transmitted infections is expected to decrease LE by 0.15%. Similarly, a one-percent increase in basic drinking water services and education is expected to increase LE by 0.10% and 0.9%, respectively. The highest correlation with HALE was also related to the variables of sexually transmitted infections (β = −0.16), injury prevalence (β = −0.10), and education (β = 0.10) (P < 0.05; Table 2).
3.2 Regional analysis
The analytical findings of the present study at the regional level showed that the variables of education (β = 0.14), air pollution (β = −0.10), smoking (β = −0.02), and sexually transmitted infections (β = −0.22) in the African region, variables of drinking water (β = 0.30) and alcohol (β = −0.04) in the Americas region, variables of injury (β = −0.17) and obesity (β = −0.20) in the Eastern Mediterranean region, variables of urbanization (β = 0.04) and drugs (β = −0.01) in the European region, and variable of unemployment (β = −0.02) in South-East Asia region had the most significant effects on LE compared to other regions (P < 0.05; Table 3).
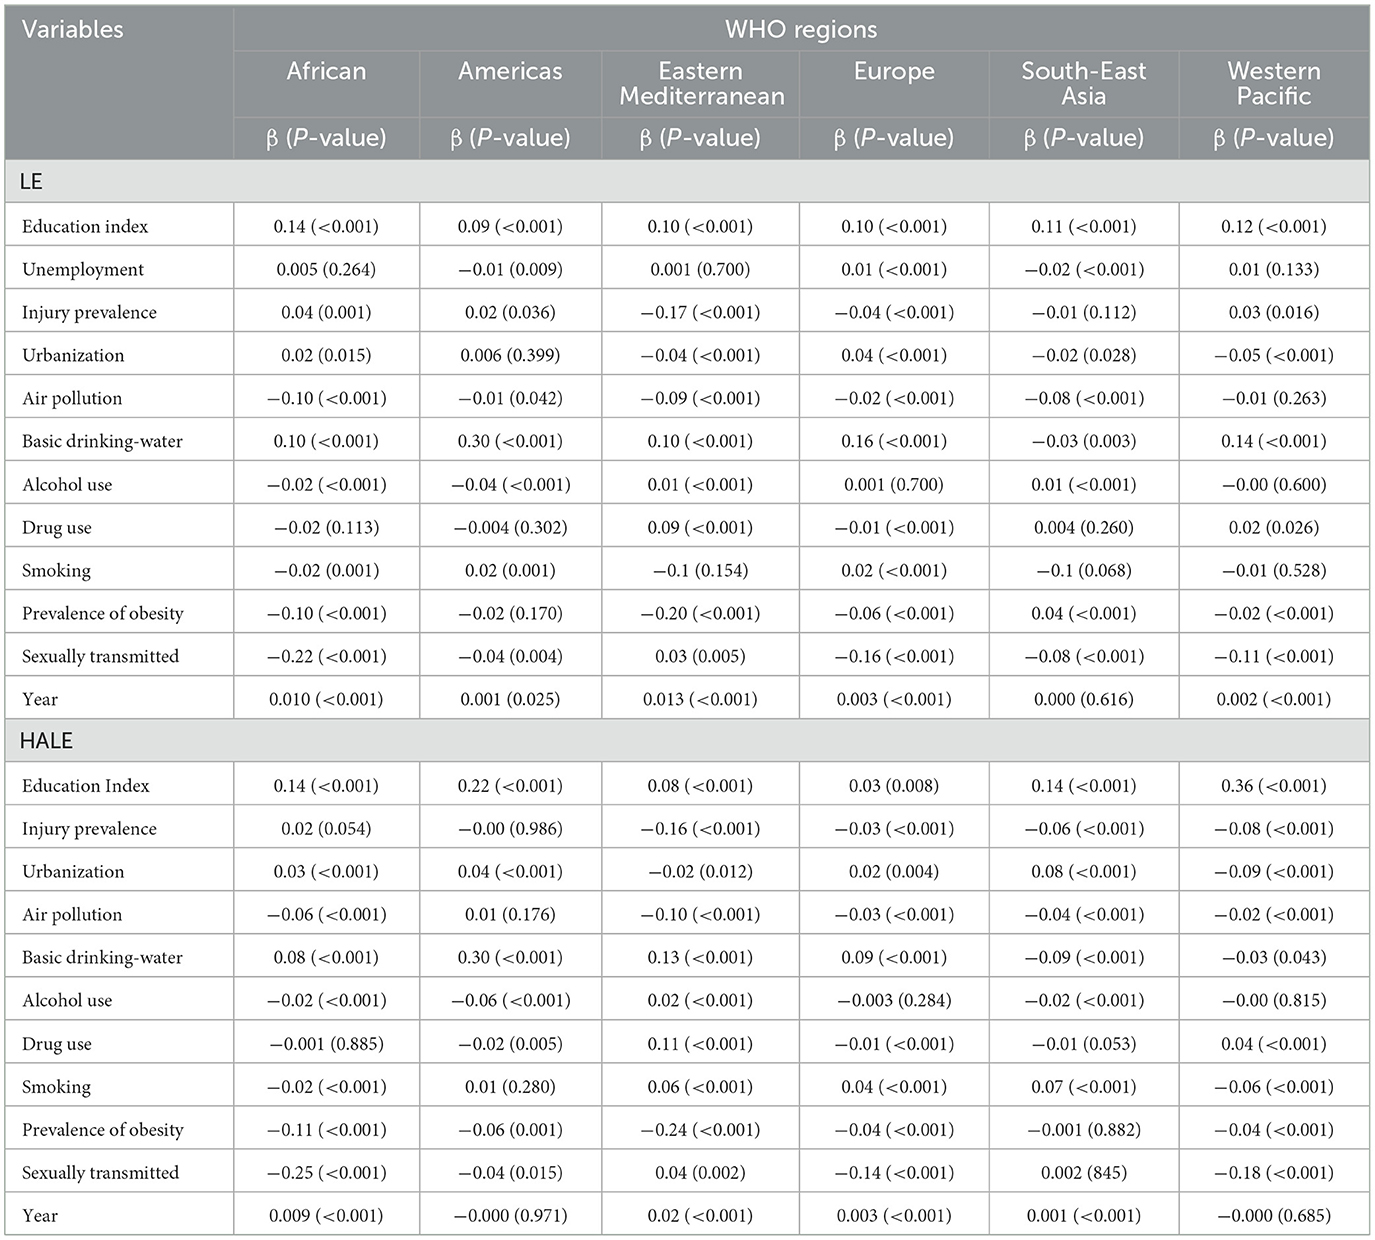
Table 3. Regression analysis results at the regional level (2000–2018).
The analysis based on the HALE also showed that the variables of sexually transmitted infections (β = −0.25) in the African region, drinking water (β = 0.30), alcohol (β = −0.06), and drugs (β = −0.02) in the Americas region, injuries (β = −0.16), air pollution (β = −0.10), and obesity (β = −0.24) in the Eastern Mediterranean region, urbanization (β = 0.08) in the South–East Asia region, and education (β = 0.36) and smoking (β = −0.06) in the Western Pacific region had the most significant effects on HALE compared to other regions (P < 0.05; Table 3).
3.3 Data visualization
The graph in Figure 1 shows that the time trend of the LE between 2000 and 2018 maintained a consistent order for all regions and the global average. This order remained constant throughout the period, with the highest values observed in the regions of Europe, the Americas, Western Pacific, Eastern Mediterranean, the global average, South-East Asia, and Africa, respectively (Figure 1).
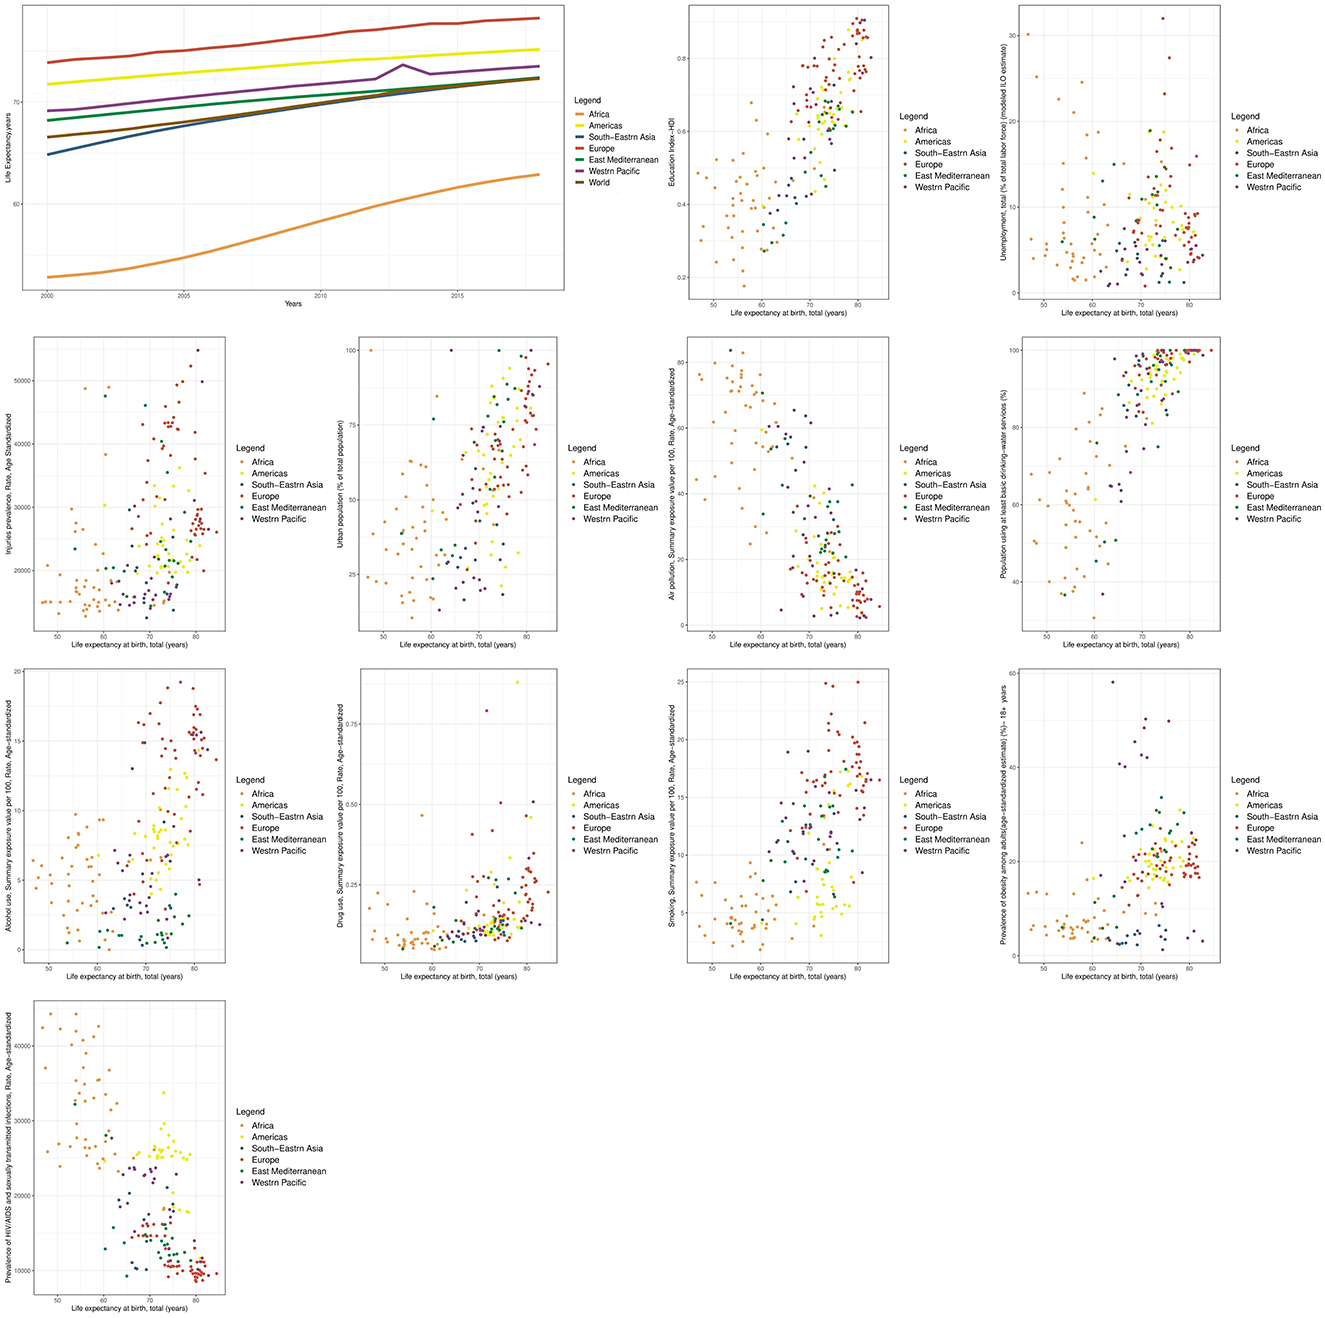
Figure 1. Time trend of LE and scatter plots of its determinants at the global and WHO regional levels.
Between 2000 and 2018, the HALE trend showed that in 2000, the highest value of the HALE indicator was observed in Europe, the Americas, Western Pacific, Eastern Mediterranean, South-East Asia, and Africa, respectively. By 2018, the highest value of this indicator was in Europe, the Americas, South-East Asia, Eastern Mediterranean, Western Pacific, and Africa, respectively. This indicates an improvement in the position of South-East Asia during this time period (Figure 2).
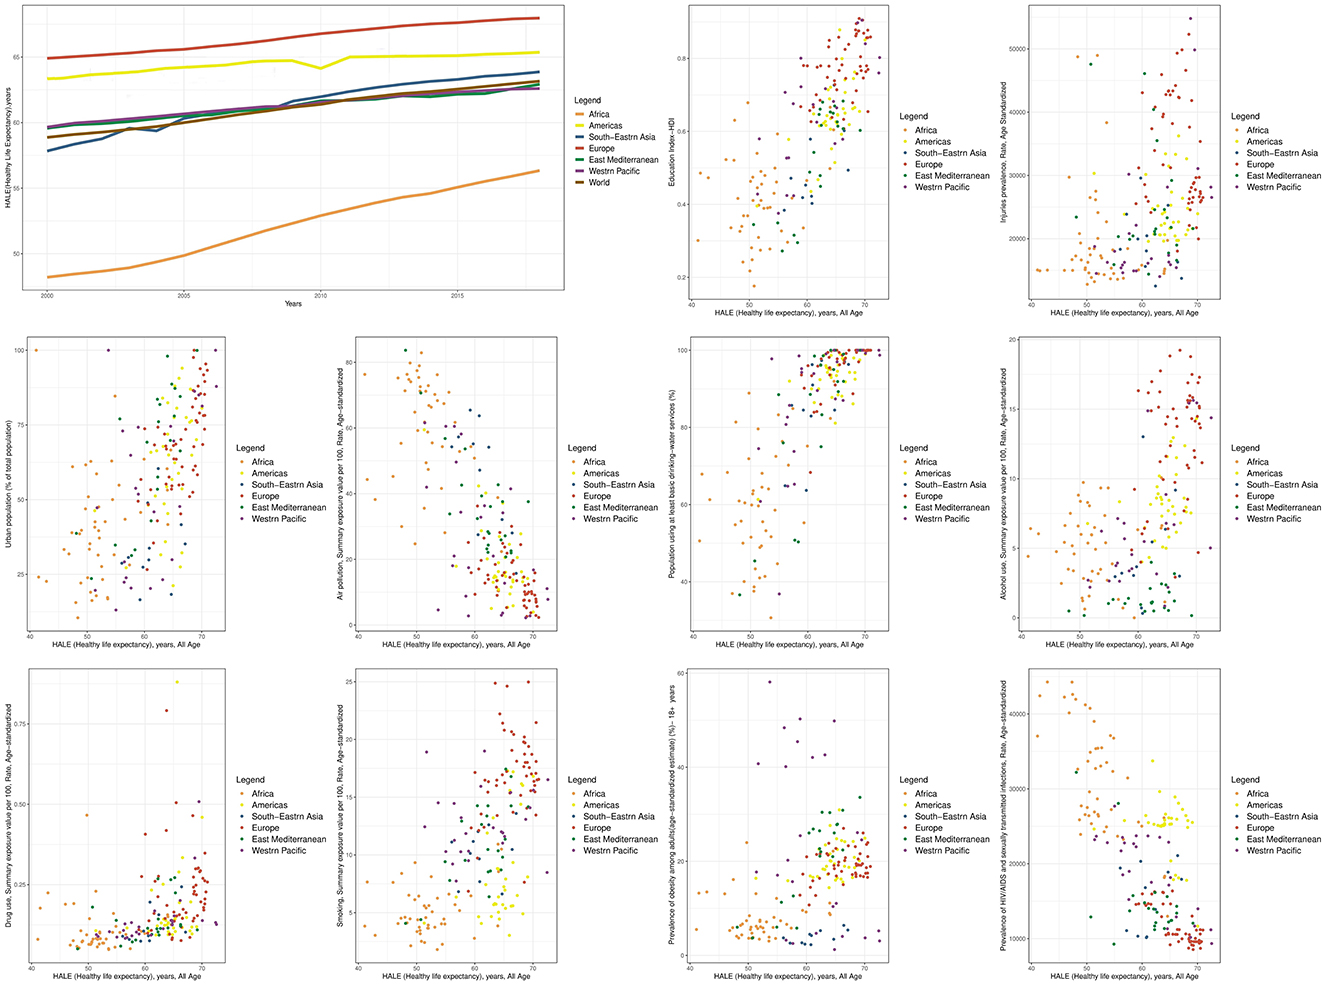
Figure 2. Time trend of HALE and scatter plots of its determinants at the global and WHO regional levels.
Comparing the global HALE with regional data, in 2000, Africa and South-East Asia had worse health situations than the global average. In 2018, South-East Asia improved more than the global trend, while the Western Pacific and Eastern Mediterranean regions improved less than the global trend. As a result, Africa, Western Pacific, and Eastern Mediterranean regions had worse situations compared to the global average in 2018 (Figure 2).
The additional graphs in Figures 1, 2 depict the relationship between the LE and HALE indicators with health determinants, categorized by WHO regions. Each data point on the graph represents the average of these indicators for a country from 2000 to 2018. It's worth noting that all the indicators for which scatter diagrams were created, whether through univariate analysis or multiple analysis at the global level, displayed a significant relationship with both the LE and HALE.
4 Discussion
The study's global findings revealed that education, injuries, and urbanization had a greater impact on HALE compared to LE, while drinking water, drugs, and obesity had a stronger effect on LE than HALE. This suggests that differences between LE and HALE indicators can partly be explained by the varying influence of health determinants on these indicators (10), Therefore, improving the global status of education, reducing injuries, and enhancing urbanization—given their stronger influence on HALE than on LE—could lead to greater improvements in HALE, thereby reducing the gap between the two indicators. Additionally, the study found that sexually transmitted infections, injury prevalence, and education had the highest correlation with HALE, while sexually transmitted infections, drinking water, and education were most strongly associated with LE. The similarity of some of these results may be due to the high and significant correlation between LE and HALE (4).
In the findings of the present study, a negative relationship was observed between obesity and the LE and HALE indicators in all regions, except in the case of LE in South-East Asia. A possible explanation for this finding is that obesity is one side of the double burden of malnutrition, and in every region except South-East Asia, the number of obese individuals exceeds that of underweight individuals (17). Therefore, the different impact of obesity on LE in South-East Asia may be attributed to the fact that underweight, which is more prevalent in this region, has a greater negative effect on health. As shown in the study by Steensma et al., LE and HALE were significantly lower in the underweight and obesity class 2+ categories than in the normal weight category (18). It is also important to note that due to data limitations, this study used obesity as a proxy indicator instead of diet and exercise. However, considering their role in obesity, it is crucial to recognize that diet and exercise are distinct health behaviors, each independently contributing to morbidity and mortality.
The most significant negative effect of sexually transmitted infections on both LE and HALE was observed in the African region. This heightened impact can be explained by the increased prevalence of unprotected sex, which is often linked to poor socioeconomic conditions and gender-based violence (19). Additionally, education, air pollution, and smoking had the highest correlation with LE in the African region compared to other regions. Therefore, when formulating interregional policies, addressing these variables, particularly sexually transmitted infections, is expected to result in a higher marginal health benefit in the African region compared to others. Several studies have highlighted the impact of lower education on LE (20, 21). In the Western Pacific region, the effect of education and smoking on HALE is more pronounced than in other regions. As a result, these two variables are particularly important in the Western Pacific region, in addition to the African region.
The effect of obesity and injury on both LE and HALE was more significant in the Eastern Mediterranean region compared to other regions. Additionally, the effect of air pollution on HALE was stronger in this region than in others. These findings align with other studies showing that low socioeconomic groups tend to experience higher disability-adjusted life years due to air pollution and high body mass index (22). Furthermore, other studies have shown an increased risk of mortality associated with overweight and obesity (23–25).
The highest β values for drinking water and alcohol variables with HALE and LE, as well as the highest β value for the drug variable with the HALE, were observed in the American region. This suggests that investing in these factors in the American region could yield more cost-effective health outcomes compared to other regions. Studies show that contaminated drinking water transmits various diseases that adversely affect LE, particularly through infant mortality (26, 27). One study also found that alcohol abuse is often associated with smoking and illicit drug use, leading to long-term adverse health outcomes (28).
Additionally, the highest β value for drugs with the LE was found in the European region. Therefore, in addition to the American region, addressing drug use in the European region is also of great importance. In the European region, no variable had a greater impact on the HALE compared to other regions, suggesting that the region has effectively responded to health determinants, possibly due to its economic prosperity, which has resulted in fewer health problems associated with poverty and deprivation compared to other regions (15).
The rapid growth of urbanization and the increase in the number of metropolises have led to numerous environmental and social problems that reduce quality of life and create significant challenges and opportunities for sustainable development in the future (29–31). The findings of the present study showed that the effect of urbanization on HALE differs across regions. It has a negative effect in the Eastern Mediterranean and Western Pacific regions but a positive effect in Africa, the Americas, Europe, and Southeast Asia. Southeast Asia and Europe show the most positive impact on HALE and LE indicators, respectively, from urbanization, while the Western Pacific region has the most negative impact on both indicators.
4.1 Limitations
One of the limitations of our study was the incompleteness of data related to certain variables, including family and social support. Consequently, as outlined in the study's methodology, we excluded indicators or variables with < 80% data coverage from the analysis. Additionally, the lack of sufficient data on diet and exercise led to the use of obesity as a proxy indicator, which may overlook the independent effects of these factors. The second limitation arises from the fact that the most recent available data from the Global Burden of Disease (GBD) study at the time of our research was from 2019. As GBD 2021 data had not yet been released at the time of the study, we had to rely on data from 2000 to 2018. This decision is important because, despite significant global changes in recent years, particularly due to the coronavirus disease 2019 (COVID-19) pandemic, these data do not reflect the most recent global health developments. Therefore, the absence of more recent data is a limitation in capturing the full impact of recent events on health determinants and outcomes. The third limitation is associated with the difficulty of comparing various variables within a specific region due to the diverse nature of the indicators. Therefore, in interpreting the findings, we focused on comparing individual variables across regions rather than comparing multiple variables within a single region. The fourth limitation of our study is related to the ecological fallacy inherent in ecological studies, which involves assuming that relationships observed at the overall level apply consistently at the individual level. To mitigate this, we exercised caution when interpreting the results and making inferences at both the global and regional levels, avoiding direct attribution to individual countries or individuals.
5 Conclusion
In order to reduce inequalities and gaps in public health, as well as ensure efficient and effective allocation of resources, it is recommended that global and interregional policies pay special attention to the variables or determinants that had the highest β value with health indicators in each region compared to other regions. This is because these determinants probably have a higher marginal health benefit, and investing in them is expected to be more cost-effective.
Data availability statement
The original contributions presented in the study are included in the article/Supplementary material, further inquiries can be directed to the corresponding authors.
Ethics statement
This study was approved by the Ethics Committee of the School of Public Health, Tehran University of Medical Sciences (Ref: IR.TUMS.SPH.REC.1398.335).
Author contributions
KI: Data curation, Formal analysis, Visualization, Writing – original draft. RD: Conceptualization, Project administration, Supervision, Writing – review & editing. MT: Methodology, Supervision, Writing – review & editing. MY: Formal analysis, Software, Writing – review & editing.
Funding
The author(s) declare that no financial support was received for the research and/or publication of this article.
Acknowledgments
We express our gratitude to the numerous individuals who have contributed to the Global Burden of Disease 2019 study in various capacities, as well as those who have contributed to other databases used in this study.
Conflict of interest
The authors declare that the research was conducted in the absence of any commercial or financial relationships that could be construed as a potential conflict of interest.
Generative AI statement
The author(s) declare that no Gen AI was used in the creation of this manuscript.
Publisher's note
All claims expressed in this article are solely those of the authors and do not necessarily represent those of their affiliated organizations, or those of the publisher, the editors and the reviewers. Any product that may be evaluated in this article, or claim that may be made by its manufacturer, is not guaranteed or endorsed by the publisher.
Supplementary material
The Supplementary Material for this article can be found online at: https://www.frontiersin.org/articles/10.3389/fpubh.2025.1566469/full#supplementary-material
References
1. Bradley KL, Goetz T, Viswanathan S. Toward a contemporary definition of health. Military Med. (2018) 183:204–7. doi: 10.1093/milmed/usy213
2. Li AM. Ecological determinants of health: food and environment on human health. Environ Sci Pollut Res. (2017) 24:9002–15. doi: 10.1007/s11356-015-5707-9
3. Franzini L, Giannoni M. Determinants of health disparities between Italian regions. BMC Public Health. (2010) 10:1–10. doi: 10.1186/1471-2458-10-296
4. Joumard I, André C, Nicq C, Chatal O. Health status determinants: lifestyle, environment, health care resources and efficiency. In: Environment, Health Care Resources and Efficiency (May 27, 2010). OECD Economics Department Working Paper No. 627. Paris: OECD Publishing (2010).
5. Paulik E, Bóka F, Kertész A, Balogh S, Nagymajtényi L. Determinants of health-promoting lifestyle behaviour in the rural areas of Hungary. Health Promot Int. (2010) 25:277–88. doi: 10.1093/heapro/daq025
6. Pourshams A, Sepanlou SG, Ikuta KS, Bisignano C, Safiri S, Roshandel G, et al. The global, regional, and national burden of pancreatic cancer and its attributable risk factors in 195 countries and territories, 1990–2017: a systematic analysis for the Global Burden of Disease Study 2017. Lancet Gastroenterol Hepatol. (2019) 4:934–47. doi: 10.1016/S2468-1253(19)30347-4
7. Menon GR, Singh L, Sharma P, Yadav P, Sharma S, Kalaskar S, et al. National Burden Estimates of healthy life lost in India, 2017: an analysis using direct mortality data and indirect disability data. Lancet Global Health. (2019) 7:e1675–e84. doi: 10.1016/S2214-109X(19)30451-6
8. Wang H, Abbas KM, Abbasifard M, Abbasi-Kangevari M, Abbastabar H, Abd-Allah F, et al. Global age-sex-specific fertility, mortality, healthy life expectancy (HALE), and population estimates in 204 countries and territories, 1950–2019: a comprehensive demographic analysis for the Global Burden of Disease Study 2019. Lancet. (2020) 396:1160–203.
9. Xi JY, Chen YY, Zhang YQ, Ao L, Du ZC, Liang BH, et al. Key social determinants to narrow the gap between health-adjusted life expectancy and life expectancy in megacities. Biomed Environm Sci. (2022) 35:773–81. doi: 10.3967/bes2022.102
10. Li X. Biological Ages: Correlations, Genetic Determinants, and Health Outcomes. Solna: Karolinska Institutet (2021).
11. Collaborators GA. Global, regional, and national burden of diseases and injuries for adults 70 years and older: systematic analysis for the Global Burden of Disease 2019 Study. BMJ. (2022) 376:e06820. doi: 10.1136/bmj-2021-068208
12. Bushnik T, Tjepkema M, Martel L. Socioeconomic disparities in life and health expectancy among the household population in Canada. Health Rep. (2020) 31:3–14. doi: 10.25318/82-003-x202000100001-eng
13. Dalstra JA, Kunst AE, Borrell C, Breeze E, Cambois E, Costa G, et al. Socioeconomic differences in the prevalence of common chronic diseases: an overview of eight European countries. Int J Epidemiol. (2005) 34:316–26. doi: 10.1093/ije/dyh386
14. Huisman M, Kunst AE, Bopp M, Borgan J-K, Borrell C, Costa G, et al. Educational inequalities in cause-specific mortality in middle-aged and older men and women in eight western European populations. Lancet. (2005) 365:493–500. doi: 10.1016/S0140-6736(05)17867-2
15. Jakab Z, Marmot M. Social determinants of health in Europe. Lancet. (2012) 379:103–5. doi: 10.1016/S0140-6736(11)61511-0
16. Remington PL, Catlin BB, Gennuso KP. The county health rankings: rationale and methods. Popul Health Metr. (2015) 13:1–12. doi: 10.1186/s12963-015-0044-2
17. World Health Organization. Obesity. Geneva: WHO. Available online at: https://www.who.int/health-topics/obesity (accessed Mar 26, 2025).
18. Steensma C, Loukine L, Orpana H, Lo E, Choi B, Waters C, et al. Comparing life expectancy and health-adjusted life expectancy by body mass index category in adult Canadians: a descriptive study. Popul Health Metr. (2013) 11:1–12. doi: 10.1186/1478-7954-11-21
19. Martin SL, Curtis S. Gender-based violence and HIV/AIDS: recognising links and acting on evidence. Lancet. (2004) 363:1410–1. doi: 10.1016/S0140-6736(04)16133-3
20. Brønnum-Hansen H, Baadsgaard M. Widening social inequality in life expectancy in Denmark. A register-based study on social composition and mortality trends for the Danish population. BMC Public Health. (2012) 12:1–7. doi: 10.1186/1471-2458-12-994
21. Renard F, Devleesschauwer B, Van Oyen H, Gadeyne S, Deboosere P. Evolution of educational inequalities in life and health expectancies at 25 years in Belgium between 2001 and 2011: a census-based study. Arch Public Health. (2019) 77:1–10. doi: 10.1186/s13690-019-0330-8
22. Pu H, Wang S, Wang Z, Ran Z, Jiang M. Non-linear relations between life expectancy, socio-economic, and air pollution factors: a global assessment with spatial disparities. Environ Sci Pollut Res. (2022) 29:53306–18. doi: 10.1007/s11356-022-19644-7
23. Katzmarzyk PT, Reeder BA, Elliott S, Joffres MR, Pahwa P, Raine KD, et al. Body mass index and risk of cardiovascular disease, cancer and all-cause mortality. Can J Public Health. (2012) 103:147–51. doi: 10.1007/BF03404221
24. Berrington de. Gonzalez A, Hartge P, Cerhan JR, Flint AJ, Hannan L, MacInnis RJ, et al. Body-mass index and mortality among 146 million white adults. N Engl J Med. (2010) 363:2211–9. doi: 10.1056/NEJMoa1000367
25. Adams KF, Schatzkin A, Harris TB, Kipnis V, Mouw T, Ballard-Barbash R, et al. Overweight, obesity, and mortality in a large prospective cohort of persons 50 to 71 years old. N Engl J Med. (2006) 355:763–78. doi: 10.1056/NEJMoa055643
26. Rahman MM, Khanam R, Rahman M. Health care expenditure and health outcome nexus: new evidence from the SAARC-ASEAN region. Global Health. (2018) 14:1–11. doi: 10.1186/s12992-018-0430-1
27. Alemu AM. To what extent does access to improved sanitation explain the observed differences in infant mortality in Africa? Afric J Primary Health Care Family Med. (2017) 9:1–9. doi: 10.4102/phcfm.v9i1.1370
28. Sopko J, Kočišová K. Key indicators and determinants in the context of the financial aspects of health systems in selected countries. Adiktologie. (2019) 19:189–202. doi: 10.35198/01-2019-004-0003
29. Liu X, Wang S, Wu P, Feng K, Hubacek K, Li X, et al. Impacts of urban expansion on terrestrial carbon storage in China. Environ Sci Technol. (2019) 53:6834–44. doi: 10.1021/acs.est.9b00103
30. da Encarnação Paiva AC, Nascimento N, Rodriguez DA, Tomasella J, Carriello F, Rezende FS. Urban expansion and its impact on water security: the case of the Paraíba do Sul River Basin, São Paulo, Brazil. Sci Total Environm. (2020) 720:137509. doi: 10.1016/j.scitotenv.2020.137509
31. Hien PD, Men N, Tan P, Hangartner M. Impact of urban expansion on the air pollution landscape: a case study of Hanoi, Vietnam. Sci Total Environm. (2020) 702:134635. doi: 10.1016/j.scitotenv.2019.134635
Keywords: determinants of health, social determinants of health (SDOH), life expectancy (LE), health-adjusted life expectancy (HALE), Global Burden of Disease (GBD)
Citation: Irandoust K, Daroudi R, Tajvar M and Yaseri M (2025) Global and regional impact of health determinants on life expectancy and health-adjusted life expectancy, 2000–2018: an econometric analysis based on the Global Burden of Disease study 2019. Front. Public Health 13:1566469. doi: 10.3389/fpubh.2025.1566469
Received: 24 January 2025; Accepted: 31 March 2025;
Published: 17 April 2025.
Edited by:
David Levine, University of Tennessee at Chattanooga, United StatesReviewed by:
Gregory Wayne Heath, University of Tennessee at Chattanooga, United StatesJun-Yan Xi, Sun Yat-sen University, China
Copyright © 2025 Irandoust, Daroudi, Tajvar and Yaseri. This is an open-access article distributed under the terms of the Creative Commons Attribution License (CC BY). The use, distribution or reproduction in other forums is permitted, provided the original author(s) and the copyright owner(s) are credited and that the original publication in this journal is cited, in accordance with accepted academic practice. No use, distribution or reproduction is permitted which does not comply with these terms.
*Correspondence: Rajabali Daroudi, cmRhcm91ZGlAc2luYS50dW1zLmFjLmly; Kamran Irandoust, aXJhbmRvdXN0LmtAaXVtcy5hYy5pcg==