 Ke Hu
Ke Hu Xing Zhang2†
 Mingyang Yu
- 1Xiamen Haicang Hospital, Xiamen, China
- 2Nanjing Lishui Dongping Street Health Center, Nanjing, China
- 3QianDongNanZhou Center for Disease Control and Prevention, QianDongNanZhou, China
- 4Fuwai Central China Cardiovascular Hospital, Zhengzhou, China
Background: Life expectancy in China has demonstrated a consistent upward trend, yet significant disparities persist across provinces. Addressing these regional imbalances necessitates a comprehensive investigation into the determinants of life expectancy. Previous research has largely overlooked the critical role of spatial heterogeneity, which is essential for understanding the underlying mechanisms driving these disparities. By incorporating spatial analysis, this study aims to identify and address the factors contributing to the uneven distribution of life expectancy across China, thereby providing a more nuanced understanding of regional health inequalities.
Methods: Therefore, this study investigated the spatial distribution characteristics and patterns of life expectancy across 31 provinces in China in 2020 by conducting descriptive and spatial autocorrelation analyses, utilizing life expectancy data alongside key air pollution indicators (PM2.5, SO2, NO2, and PM10). To address spatial heterogeneity, the geographically weighted regression (GWR) model was applied to assess the regional variations in the impact of air pollutants on life expectancy. This approach allows for the incorporation of geographic coordinates into the regression coefficients, capturing localized effects and providing a more nuanced understanding of the relationship between air pollution and life expectancy across different regions.
Results: The findings revealed that in 2020, life expectancy in China exhibited a distinct east-to-west decreasing trend, demonstrating significant spatial autocorrelation that was predominantly characterized by two aggregation patterns: high-high and low-low clusters. The analysis demonstrated that air pollutants, including SO2, NO2, and PM10, exerted significant influences on life expectancy, albeit with regional variations. Specifically, SO2 exhibited a more pronounced negative impact on life expectancy in southern cities, while NO2 demonstrated a stronger effect in northwestern regions. Notably, PM10 showed a significant influence limited to Yunnan Province, highlighting the spatial heterogeneity in the relationship between air pollution and life expectancy across China.
Conclusion: These findings highlight the imperative for local governments to develop and implement region-specific air pollution control measures, taking into account the unique environmental and socio-economic conditions of their respective areas.
1 Introduction
With sustained economic development and advancements in medical care, life expectancy in China has demonstrated a consistent upward trajectory (1–3). Specifically, between 2010 and 2020, the average life expectancy increased from 74.83 to 77.90 years. However, significant regional disparities persist across provinces (4). In 2020, Shanghai recorded the highest life expectancy at 82.55 years, while Tibet had the lowest at 72.19 years, reflecting a notable gap of nearly 10 years. These pronounced variations underscore the necessity of a comprehensive investigation into the determinants of life expectancy in China. Such an exploration is crucial to identifying effective strategies for addressing the disparities in life expectancy between regions.
Numerous studies have established that air pollution significantly impacts life expectancy (5). Exposure to ambient air pollutants, including sulfur dioxide (SO2), fine particulate matter (PM2.5), and nitrogen oxides (NOx), was strongly associated with an elevated risk of various diseases and a marked reduction in life expectancy (6–13). For instance, Wang et al. highlighted that pollutants such as PM10 and SO2 exerted a detrimental effect on life expectancy (14). Specifically, PM10 had been identified as a critical contributor to respiratory diseases, cardiovascular conditions, and hypertension. The long-term exposure of populations to air pollution has been shown to substantially diminish life expectancy. This relationship was particularly evident with SO2, where a 10 ug/m3 increase in concentration had been linked to a 0.35-year reduction in life expectancy (14). These findings underscored the profound public health implications of air pollution and the urgent need for effective mitigation strategies.
In the realm of methodologies for investigating the determinants of life expectancy, earlier studies predominantly utilized regression analyses that overlooked spatial information, such as multiple linear regression. However, these models often suffer from multicollinearity among independent variables and fail to incorporate spatial data (4), leading to suboptimal model fit and residuals that exhibit spatial autocorrelation. In response, recent research has increasingly adopted spatial regression models, including the spatial error model and the spatial lag model (15), to better capture spatial dependencies in life expectancy studies. While these global spatial regression models account for spatial correlations among variables, they do not address the spatial heterogeneity—the varying impact of each factor on life expectancy across different geographic locations. To address this limitation, the geographically weighted regression (GWR) model has been introduced as a local regression approach. GWR integrates the geographic locations of independent variables into the regression coefficients, thereby elucidating how the influence of various factors on life expectancy varies spatially (16, 17).
Our study comprehensively utilize the GWR model to analyze the impact of air pollution on life expectancy in China. Compared to traditional global regression models, the GWR model constructs local regression equations at each spatial location, taking into account the spatial heterogeneity. This allows it to more accurately reflect regional differences in the impact of air pollution on life expectancy. Based on the analysis results of the GWR model, policymakers can more accurately identify regions where air pollution has a significant impact on life expectancy and implement more targeted governance measures in these areas.
Consequently, this study investigated the spatial distribution characteristics and patterns of life expectancy by employing descriptive and spatial autocorrelation analyses. Subsequently, we utilized the GWR model to examine the impact of air pollution factors on life expectancy across 31 regions in China during 2020. The findings offer a robust scientific foundation for optimizing the allocation of healthcare resources and informing region-specific policy formulation.
2 Data and methods
2.1 Variable selection and data sources
To comprehensively investigate the impact of air pollution on life expectancy across Chinese provinces, we selected key variables—PM2.5, SO2, NO2, and PM10—based on their established relevance to life expectancy in prior literature and data availability. The study was conducted at the provincial administrative level, encompassing all 31 mainland Chinese provinces (excluding Hong Kong, Macao, and Taiwan). Life expectancy data for 2020 were sourced from the China Health Statistical Yearbook, while air pollution data (PM2.5, SO2, NO2, and PM10) were obtained from regional ecological and environmental bulletins.
2.2 Statistical methods
2.2.1 Descriptive analyses
The spatial distribution characteristics of life expectancy and air pollution factors across the 31 districts were visualized using thematic maps.
2.2.2 Spatial autocorrelation analysis
This study examined spatial autocorrelation in life expectancy at both global and local scales. At the global level, we employed Global Moran’s I, a statistical index ranging from −1 to 1. Values greater than 0 indicate positive spatial autocorrelation, reflecting clustering of life expectancy; values closer to 0 suggest a random spatial distribution, implying no autocorrelation; and values less than 0 denote negative spatial autocorrelation, signifying a dispersed distribution. The mathematical formulation of Global Moran’s I is as follows (18) (Equation 1):
where xi and xj represent the life expectancy of the i-th region and j-th regions, respectively; denotes the mean life expectancy; Wij is the spatial weight matrix based on contiguity edges corner; n refers to the number of spatial units.The statistical significance of Moran’s I was tested using the Z statistic(Equation 2):
where E(I) and var.(I) represent the expected value and variance of Moran’s I, respectively. At a significance level of 0.05, Z > 1.96 (i.e., p < 0.05) indicates spatial autocorrelation in life expectancy.
At the local level, we utilized Local Moran’s I (LISA) to identify spatial aggregation patterns (e.g., high-high, low-low, high-low, and low-high) in life expectancy across provinces. The calculation formula (Equation 3) for LISA is analogous to that of Global Moran’s I, and the spatial aggregation patterns were visualized using LISA cluster maps.
2.2.3 GWR model
Multicollinearity testing is a critical step in data analysis to ensure the reliability of regression models. In this study, the Variance Inflation Factor (VIF) and the condition number were employed to evaluate multicollinearity among the variables (19). For global multicollinearity assessment, a widely accepted threshold is a VIF value exceeding 7.5, which indicates severe multicollinearity. Variables with VIF values above this threshold are excluded from further analysis to mitigate potential biases.
Additionally, local multicollinearity can introduce instability in GWR estimates (20). The condition number is used to detect local multicollinearity, with values greater than 30 in a specific region suggesting potential unreliability in the model’s fitting results for that area.
2.2.3.1 GWR model setting
The GWR model extends the traditional multiple linear regression framework by incorporating the geographic coordinates of sample data into the regression coefficients, thereby capturing spatial heterogeneity. The general form of the GWR model is expressed as follows (Equation 4):
In this study, Qi is used to denote the life expectancy of the i-th province, while β0 is employed to represent the regression constant for the i-th province. The term (ui,vi) denotes the geographic location of the i-th province, which is determined using the center of mass coordinates of each province in the GWR model. Finally, βk(ui,vi)is used to represent the regression coefficient of the k-th province independent variable for the i-th province, xik represents the observed value of the independent variable xk in the i-th province, and represents the error term for the i-th province (21, 22), where .
Since the regression coefficients in the GWR model vary across provinces, a parameter estimation method was proposed based on Weighted Least Squares (WLS). This approach assigns higher weights to observations that are geographically closer to the target location and lower weights to those that are farther away, reflecting the principle of spatial proximity. For a detailed mathematical representation, refer to Equation 5:
In this formulation, W(ui, vi) is the spatial weight matrix, XT W(ui, vi)X is the geographically weighted variance–covariance matrix, and Q is the vector of dependent variables.
The determination of spatial weights is fundamentally dependent on the choice of the spatial kernel function (23). In this study, the fixed Gaussian function was selected as the spatial kernel function due to its ability to generate a smoother kernel surface and mitigate the risk of data sparsity during the GWR model fitting process. The mathematical expression of the fixed Gaussian function is provided in Equation 6:
In this equation, i denotes a regression point, j denotes a data point, dij represents the Euclidian distance between the two points of i and j, and θ is the bandwidth, which is employed to describe the non-negative decay parameter between the distance and the weights.
The selection of bandwidth plays a critical role in the application of spatial kernel functions, as it directly influences the accuracy and performance of the model. Among the widely used bandwidth optimization techniques, the Corrected Akaike Information Criterion (AICc) is particularly prominent due to its effectiveness in balancing model fit and complexity. The mathematical formulation of the AICc criterion is provided in Equation 7:
In this equation, n denotes the number of sample points, is the standard deviation of the residual term, and tr(S) is the trajectory of the spatial weight matrix. Specifically, the bandwidth associated with the minimum AICc value is identified as the optimal choice.
2.2.3.2 Evaluation of model fitting effectiveness
To assess the goodness-of-fit of the GWR model, this study employed the Multiple Linear Regression (MLR) model as a benchmark for comparative performance evaluation. The MLR model was constructed using the same dataset to ensure consistency in the comparative analysis. The mathematical formulation of the MLR model is presented in Equation 8:
The dependent variable Qi denotes the life expectancy of the i-th province, while β0 represents a constant term. xai denotes the a-th independent variable of the i-th province, βa denotes the coefficient of the a-th independent variable, and the residuals are assumed to be normally distributed.
To evaluate the goodness-of-fit of the GWR model, this study employed three key metrics: R2, Adjusted R2, and the Corrected Akaike Information Criterion (AICc), with the MLR model serving as a benchmark for comparison. It was hypothesized that higher values of R2 and Adjusted R2 indicate a greater proportion of variance explained by the regression equation, thereby reflecting a better model fit.
Furthermore, the AICc serves a dual purpose: it not only facilitates the determination of the optimal bandwidth in GWR but also provides a robust criterion for comparing model superiority. Generally, models with lower AICc values are considered to exhibit superior fit, as they achieve a better balance between model complexity and explanatory power (22).
2.2.4 Analysis software
The MLR model, GWR model, collinearity diagnostics, spatial autocorrelation analysis, and result visualization were performed using ArcGIS 10.2 software (ESRI, Redlands, CA, United States). The electronic maps utilized for spatial analysis and factor characterization were sourced from the National Geomatics Center of China, which provides authoritative geographic information services. In this study, statistical significance was determined using a two-tailed test with a threshold of p < 0.05.
3 Results
3.1 Spatial distribution characteristics and patterns of life expectancy in China
In 2020, the average life expectancy in China was 77.90 years. Utilizing the geographic map of mainland China, we generated a spatial distribution map of life expectancy (Figure 1). The analysis revealed a distinct east-to-west decreasing gradient in life expectancy, with the eastern region exhibiting values exceeding 78 years. Notably, Shanghai, Beijing, and Tianjin emerged as the regions with the highest life expectancy, each surpassing 80 years. In contrast, the central region demonstrated life expectancy values ranging between 76 and 78 years. The western region, encompassing Qinghai, Xinjiang, and 10 other provinces, consistently recorded life expectancy values below the national average. Among these, Tibet had the lowest life expectancy at 72.19 years, closely followed by Qinghai at 73.96 years.
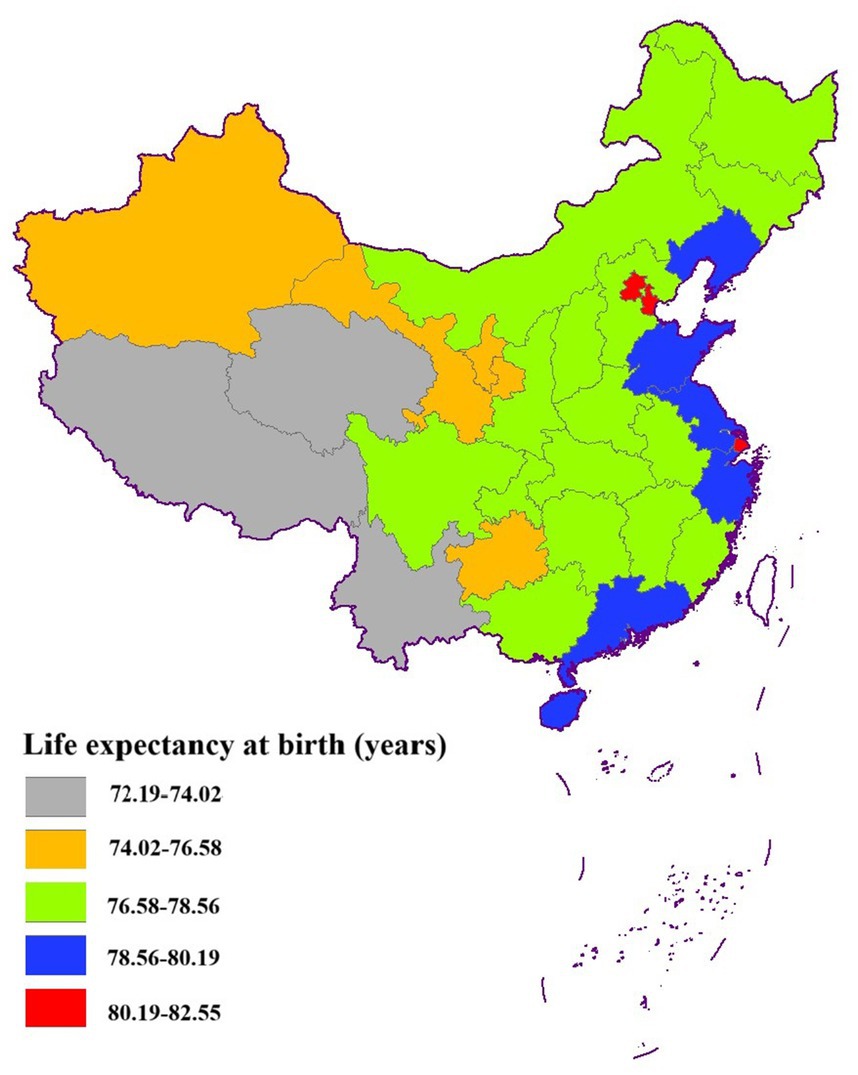
Figure 1. Distribution of life expectancy by province in China in 2020.
The global Moran’s I index was calculated to be 0.534 (p < 0.001), demonstrating significant spatial autocorrelation in life expectancy across China. To further investigate the spatial clustering patterns at the provincial level, we generated LISA cluster maps (Figure 2). The Lisa analysis revealed two dominant spatial clustering patterns: high-high and low-low clusters. The high-high clusters were predominantly concentrated in the economically developed eastern coastal regions, notably encompassing Beijing, Tianjin, and Shanghai, which consistently exhibit life expectancy values exceeding 80 years. Conversely, the low-low clusters were primarily located in the western and southwestern provinces, including Xinjiang, Tibet, Yunnan, and Qinghai.
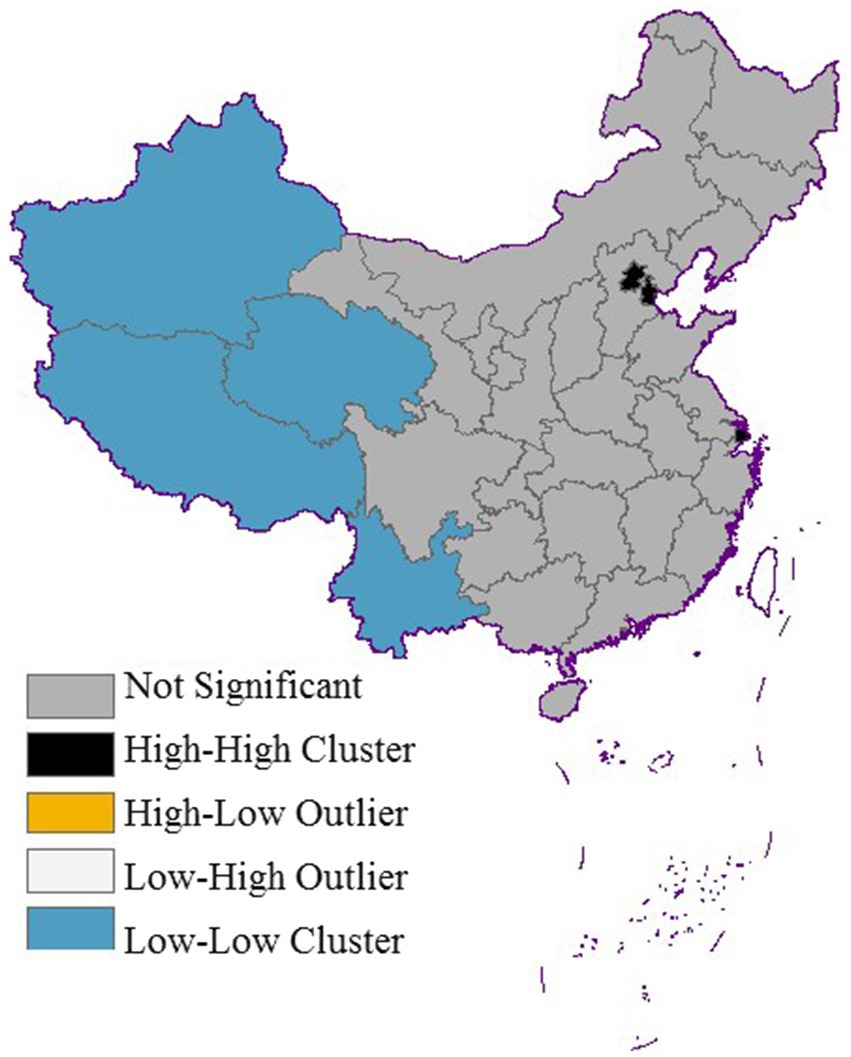
Figure 2. LISA aggregation of life expectancy by province.
3.2 Spatial distribution of air pollution factors
Figures 3–6 illustrate significant spatial variability in the distribution of the four air pollution factors across China. A distinct east-to-west decreasing gradient in air pollution intensity was observed, with the most severe pollution levels concentrated in North China, where industrial activities and urbanization are most intensive. However, Xinjiang exhibited an exception to this trend, with PM2.5 and PM10 concentrations surpassing those in most other provinces. This anomaly might be attributed to local factors such as desert dust emissions, industrial activities, and unique meteorological conditions.
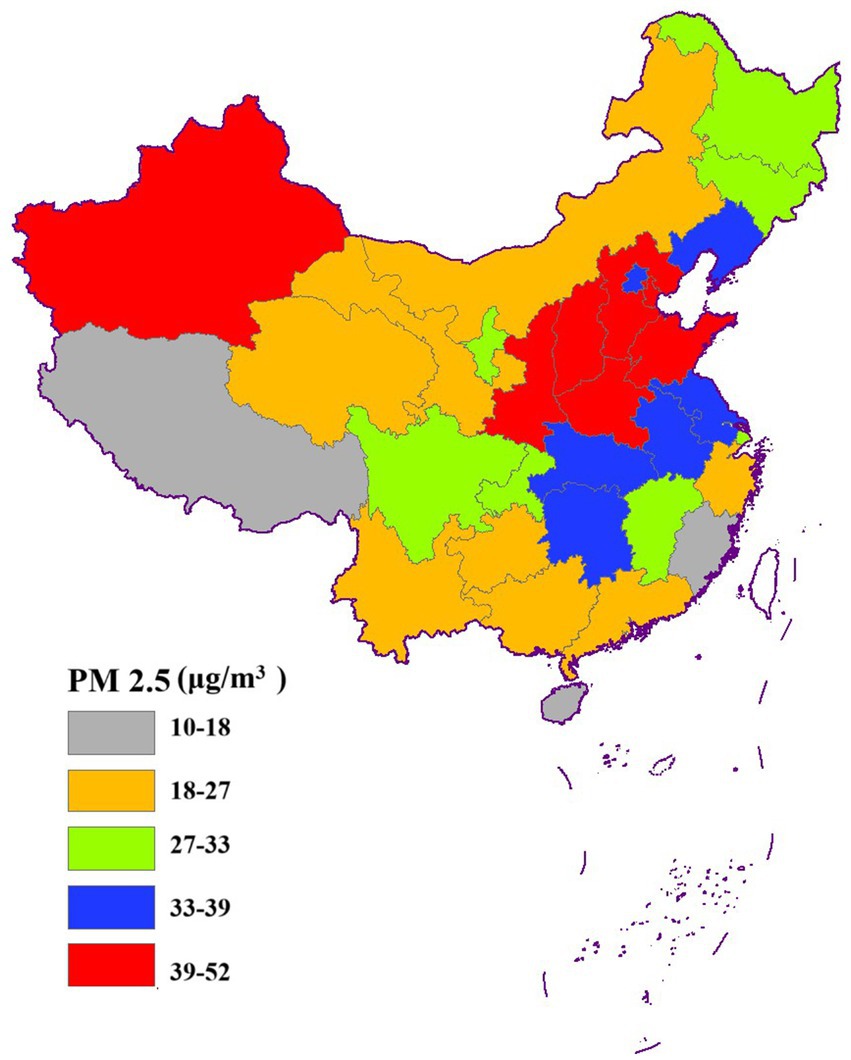
Figure 3. Spatial distribution of PM2.5.
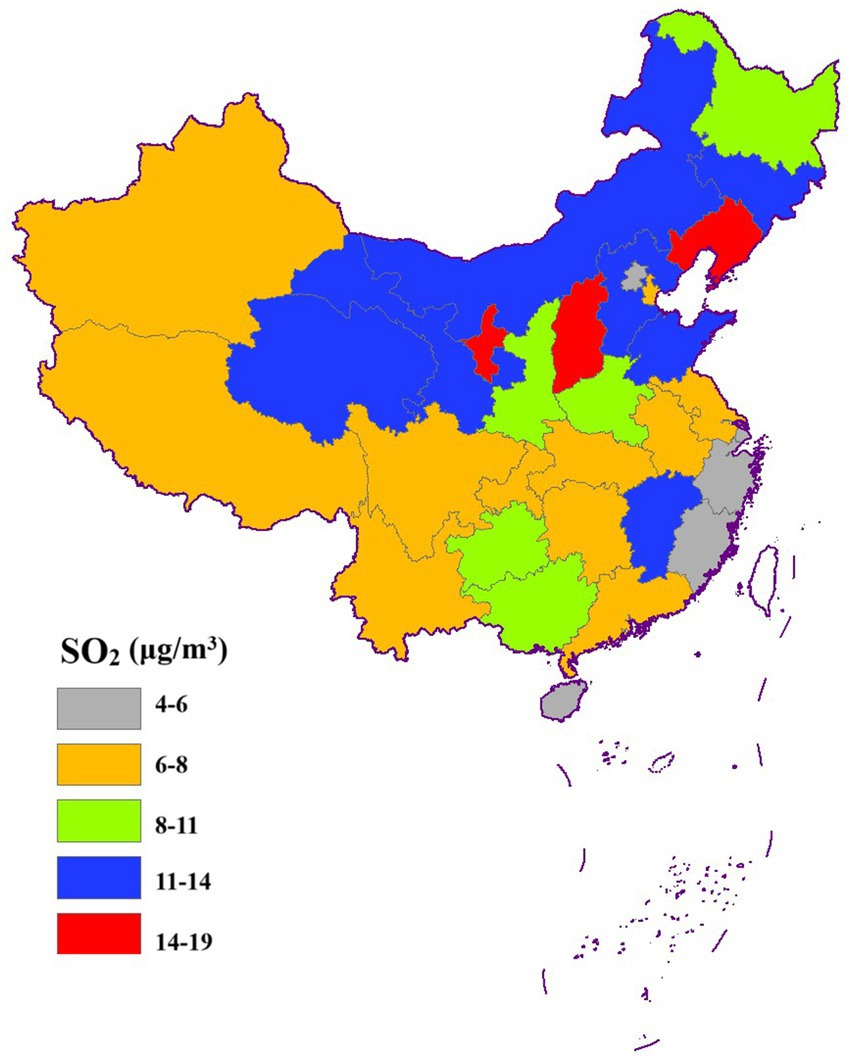
Figure 4. Spatial distribution of SO2.
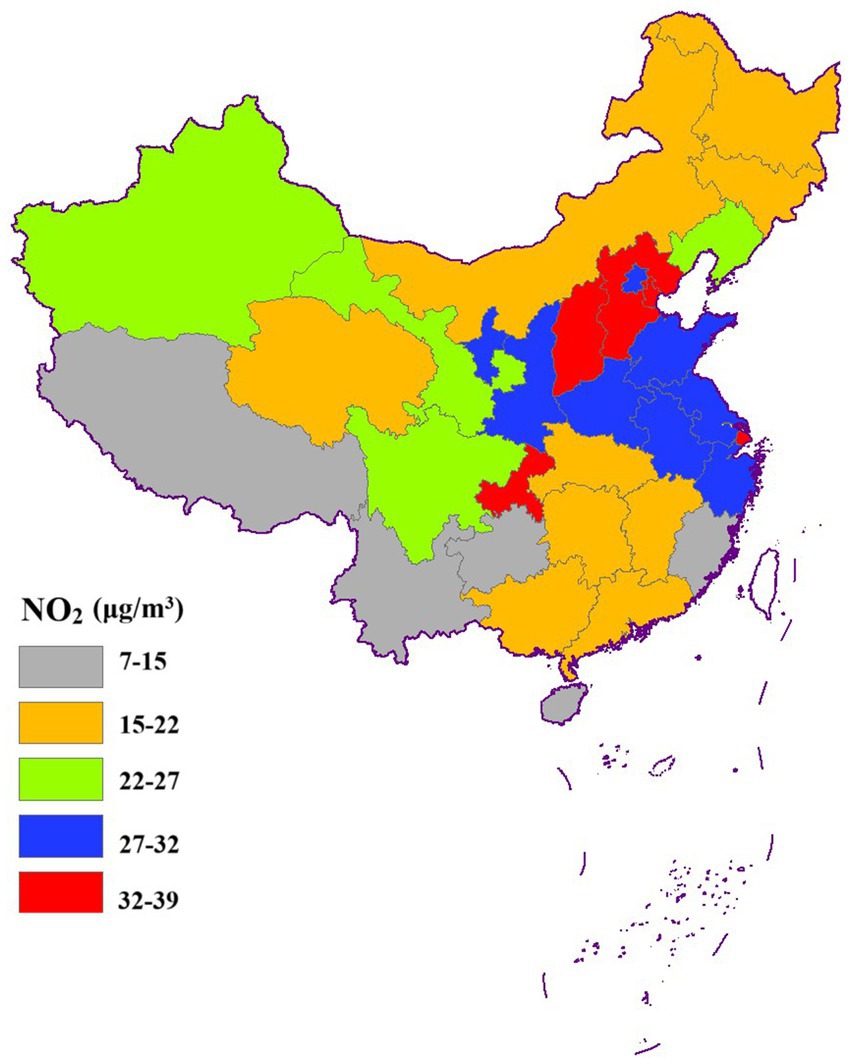
Figure 5. Spatial distribution of NO2.
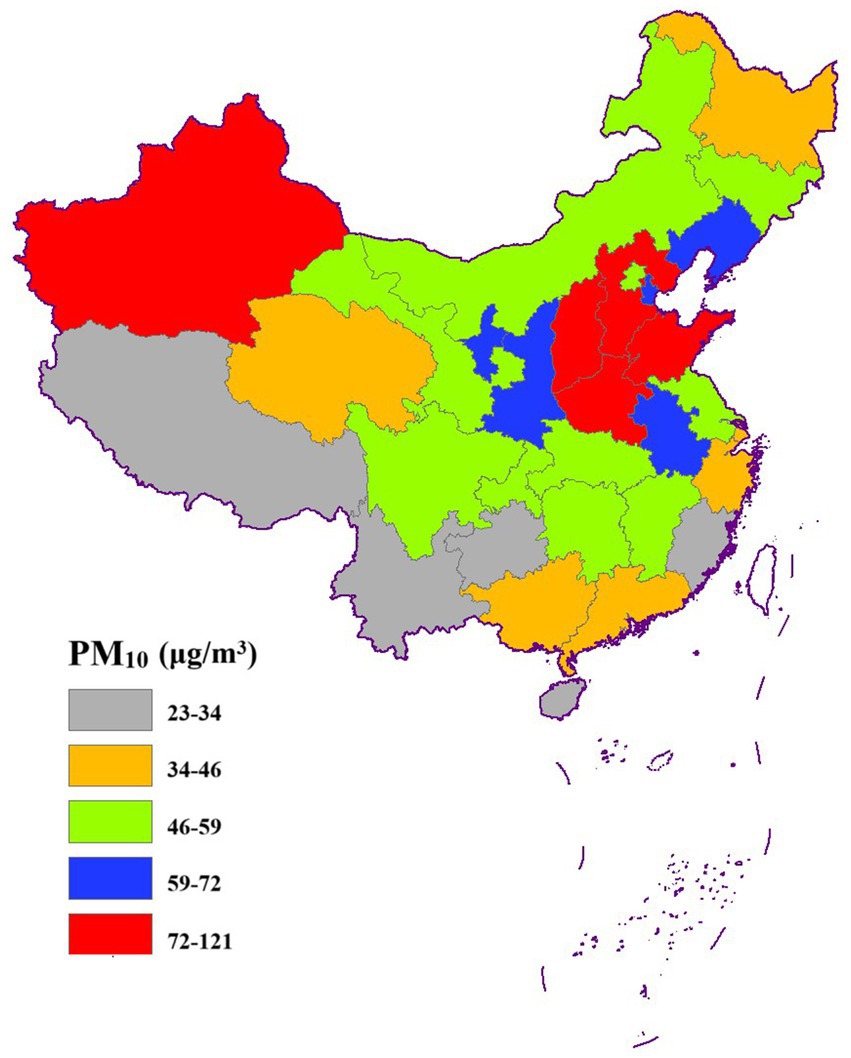
Figure 6. Spatial distribution of PM10.
3.3 GWR model results
3.3.1 Variable multicollinearity test
In this study, VIF values were employed to assess the presence of global multicollinearity among the four variables under investigation. The results of this analysis are summarized in Table 1. The VIF value for PM2.5 exceeded 7.5, suggesting significant collinearity with other variables. Consequently, PM2.5 was excluded from the GWR model to mitigate the impact of multicollinearity on the model’s accuracy and stability.
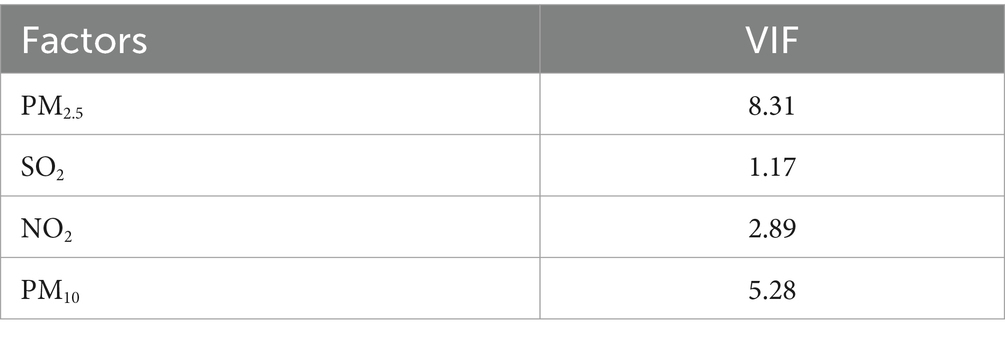
Table 1. Results of multicollinearity test for each variable.
3.3.2 GWR model results
3.3.2.1 Effect of SO2 on life expectancy
The coefficient values of SO2 exhibited a range from −0.18 to −0.42, indicating a consistent negative association with life expectancy. Statistical analysis revealed that the impact of SO2 on life expectancy was significant across the majority of cities studied. However, this relationship was not statistically significant in Xinjiang, Tibet, Heilongjiang, and Jilin, suggesting potential regional variations in the effects of SO2 exposure. This lack of significance in these regions may be attributed to several factors. Firstly, the relatively low population density and sparse industrial distribution in these areas could result in less exposure to SO2 pollution, diminishing its detectable impact on life expectancy (24). Additionally, unique geographical and climatic conditions, such as the high-altitude environment in Tibet or the cold climate in Heilongjiang and Jilin, might influence the dispersion and accumulation of pollutants, thereby altering the observed effects (6). Moreover, the distinct socio-economic structures and varying levels of environmental regulations in these regions could also play a role in mitigating the influence of SO2 on life expectancy (25).
The spatial distribution of the regression coefficients for SO2 exhibited a pronounced south-to-north gradient, with values progressively decreasing from southern to northern regions. Notably, the impact of SO2 on life expectancy was relatively modest in eastern cities, suggesting regional variations in the pollutant’s influence on health outcomes (Figure 7).
3.3.2.2 Effect of NO2 on life expectancy
The regression coefficients for NO2 exhibited a range from 0.094 to 0.33, indicating a consistent positive association with life expectancy across the majority of regions studied. Statistical analysis revealed that the impact of NO2 on life expectancy was significant in most areas, with the exception of Yunnan, Guangxi, and Hainan, where the relationship did not reach statistical significance. A few factors might be responsible for this lack of significance. Firstly, these areas generally had lower NO2 concentrations due to less industrial activity and urbanization, which reduced the potential impact on life expectancy. Secondly, the unique geographical and climatic conditions in these regions, such as the complex terrain in Yunnan and the humid climate in Guangxi and Hainan, might enhance pollutant dispersion and mitigate the health risks associated with NO2 (26).
The spatial distribution of NO2 regression coefficients exhibited a decreasing gradient from the northwest to the southeast. In particular, NO2 had a relatively minor impact on life expectancy in most cities across the southern region (Figure 8).
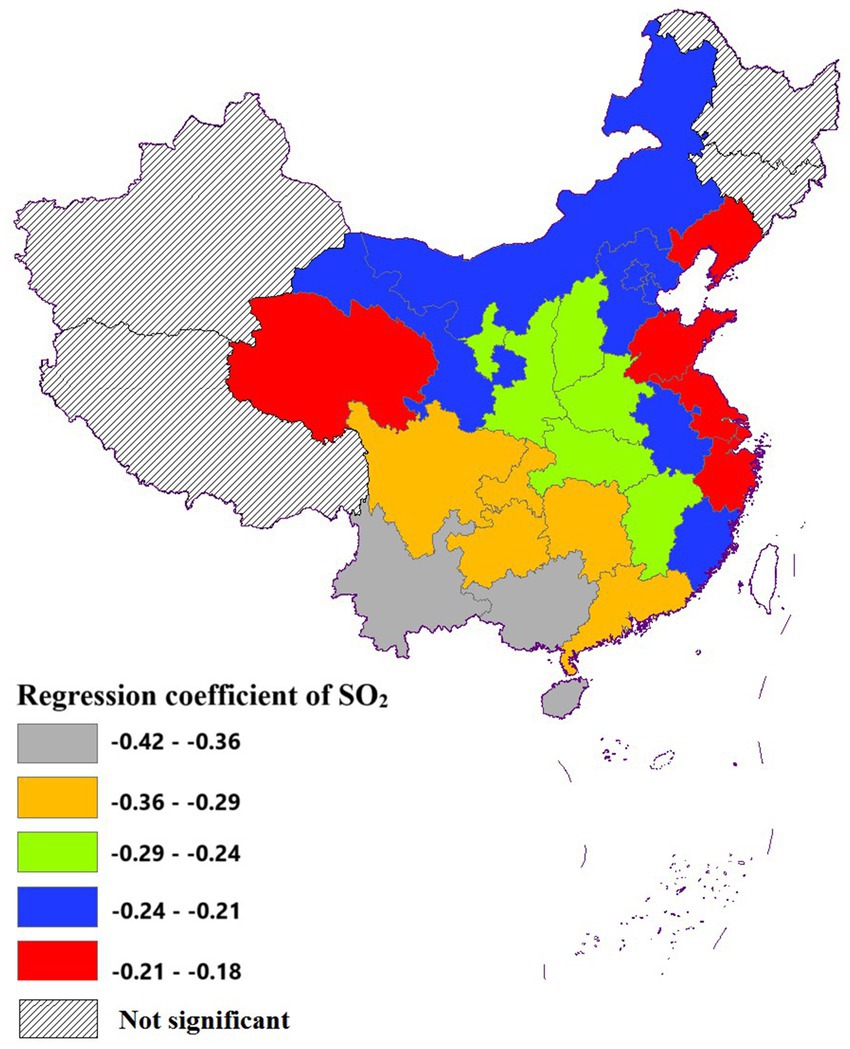
Figure 7. Spatial distribution of the effect of SO2 on life expectancy.
3.3.2.3 Impact of PM10 on life expectancy
PM10 had an effect on life expectancy only in Yunnan Province, and the effect on other regions was not statistically significant. Several factors might contribute to this lack of significant. Firstly, PM10 concentrations in regions outside Yunnan might be relatively higher or more variable, making it difficult to detect a clear correlation with life expectancy (27). Additionally, the unique geographical and climatic conditions in Yunnan, such as its complex terrain and diverse weather patterns, could influence the dispersion and accumulation of PM10, leading to more pronounced health impacts (28). In contrast, other regions might have implemented more effective air quality control measures, reducing the overall impact of PM10 on public health (Figure 9).
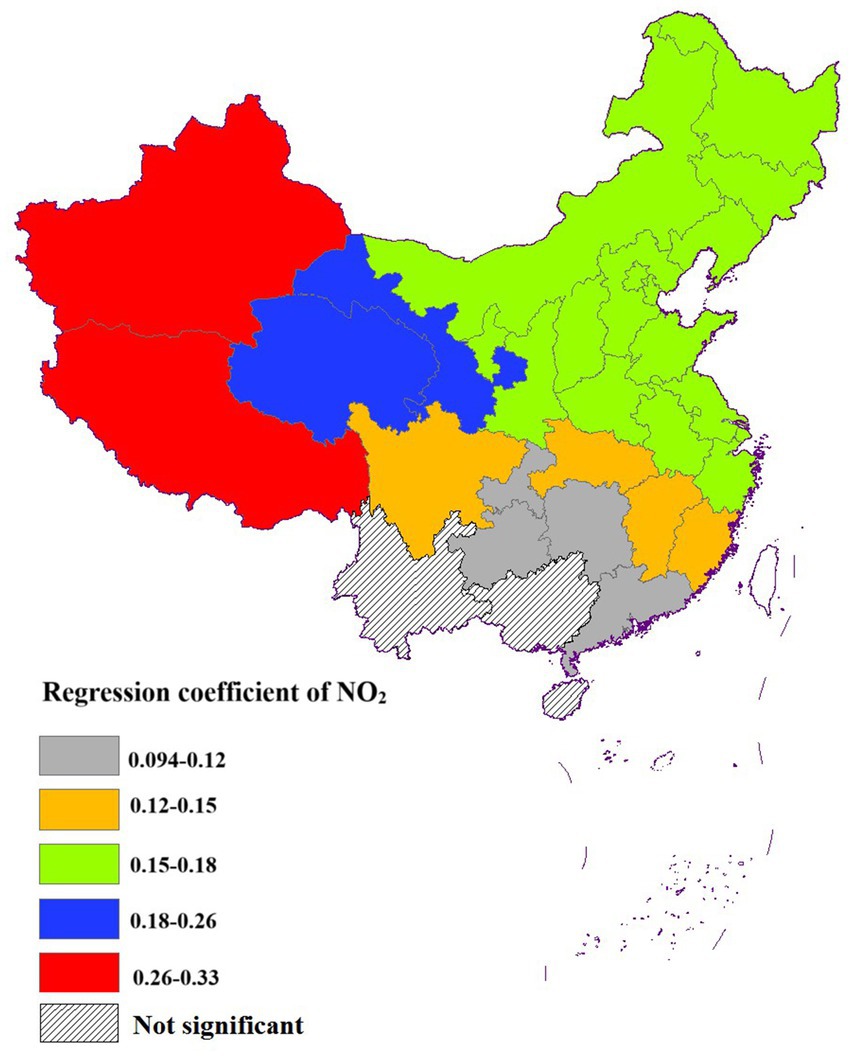
Figure 8. Spatial distribution of the effect of NO2 on life expectancy.
3.3.3 Evaluation of model fitting effectiveness
In the GWR model, the condition numbers for all provinces were consistently below 30, confirming the absence of local multicollinearity within the model. As illustrated in Table 2, among the three examined factors, only SO2 and NO2 exhibited statistically significant impacts on life expectancy in the MLR model, a finding that diverged somewhat from the GWR model results.
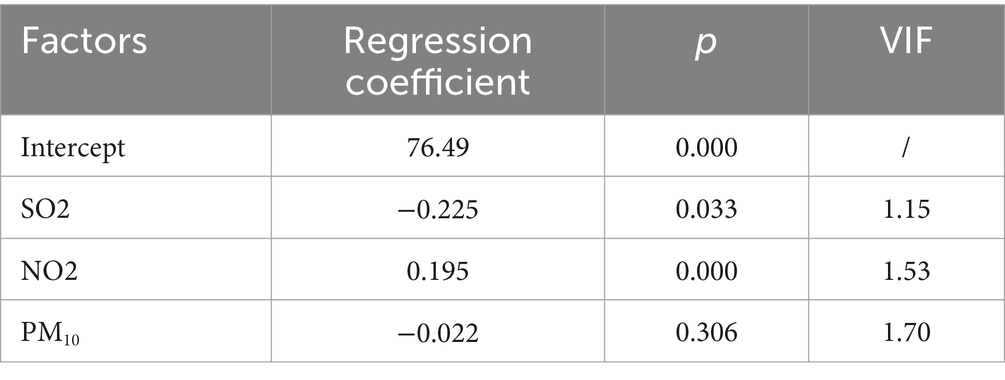
Table 2. MLR model results.
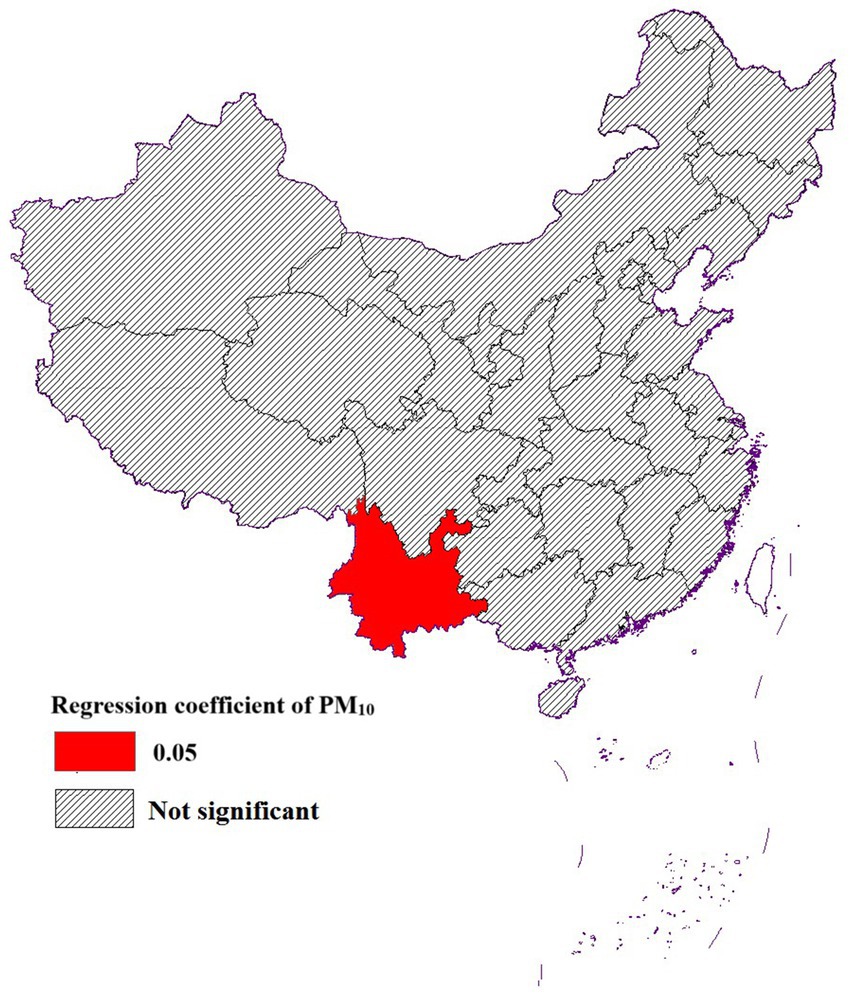
Figure 9. Spatial distribution of the effect of PM10 on life expectancy.
Additionally, the Moran’s I index for the residuals of the MLR model was 0.40 (p = 0.000), whereas for the GWR model, it was 0.026 (p = 0.61), with a p-value exceeding 0.05. This indicated that the residual term displayed no spatial autocorrelation and adhered to a random distribution pattern, suggesting that the GWR model effectively captures the spatial relationships between the dependent and independent variables, thereby outperforming the MLR model in this aspect. Furthermore, as shown in Table 3, the AICc value of the GWR model was lower than that of the MLR model, and both the R2 and Adjusted R2 values were higher, underscoring the superior fitting capability of the GWR model. The local R2 values (Figure 10) revealed that the model fit was particularly robust in the western and northeastern regions of China, where R2 values were notably higher compared to other regions.
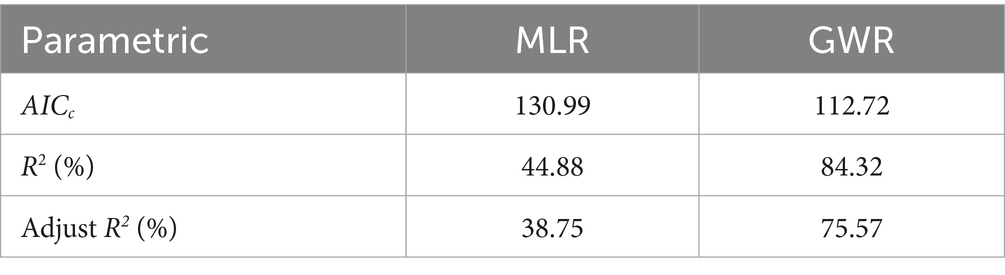
Table 3. Comparison of multiple linear regression model and GWR model fit.
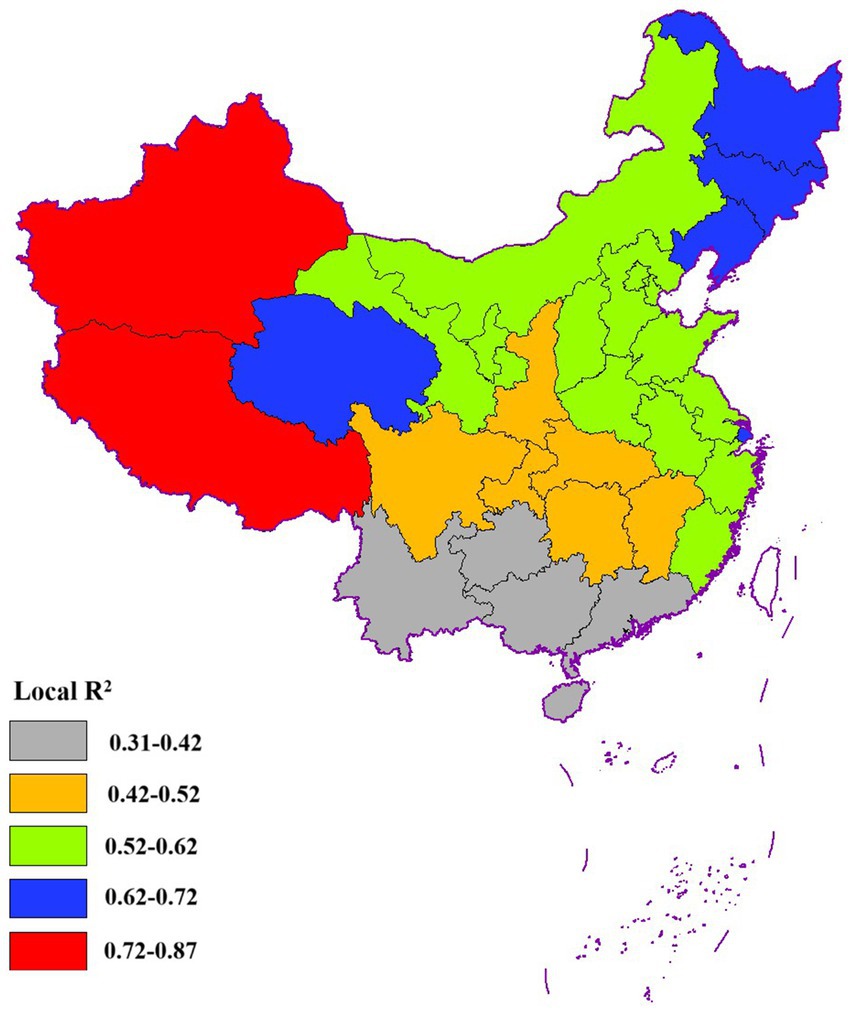
Figure 10. The spatial distribution of local R2.
4 Discussion
Life expectancy serves as a robust and representative indicator of regional health status, capturing the cumulative impact of various socio-economic, environmental, and healthcare factors. This study employed the GWR model to investigate the spatial heterogeneity of air pollution factors influencing life expectancy at the provincial scale, providing insights into localized variations and their implications for public health policy.
The impact of SO2 on life expectancy exhibited a significant negative correlation, indicating that regions with higher SO2 concentrations tend to experience lower life expectancy. Notably, the detrimental effect of SO2 on life expectancy was more pronounced in southern cities compared to their eastern and northern counterparts. Despite the relatively lower SO2 concentrations in southern regions, such as Yunnan, the combined influence of unique geographical features, climatic conditions, and industrial structures might amplify the adverse effects of SO2 on local residents’ life expectancy. For instance, a relatively large amount of sulfur dioxide in the surroundings seeped into the indoor environment (29), and the local population might exhibit heightened sensitivity to pollutants like SO2. Furthermore, the relatively limited access to medical and educational resources in these southern cities might result in reduced awareness and capacity among residents to mitigate the effects of environmental pollution, thereby exacerbating the impact of SO2 on life expectancy (27, 30). In contrast, eastern and northern cities, characterized by more developed economies, diversified industrial structures, comprehensive environmental protection measures, and greater public awareness and ability to counteract environmental pollution, experienced a comparatively smaller impact of SO2 on life expectancy (31).
The analysis revealed a paradoxical positive correlation between NO2 concentrations and life expectancy, suggesting that regions with higher NO2 levels tend to exhibit longer life expectancy. This counterintuitive phenomenon might be attributed to the complex interplay between NO2 sources and regional socio-economic factors. In urban areas, where vehicle emissions constitute the primary source of NO2 (32, 33), the presence of developed transportation infrastructure often coincided with higher economic development, superior healthcare resources, and improved living standards. These factors might collectively mitigate the adverse health effects of NO2 exposure. Furthermore, regions with elevated NO2 concentrations might implement more stringent environmental protection measures, potentially reducing emissions of other harmful pollutants and indirectly benefiting public health. In contrast, economically disadvantaged areas with lower NO2 concentrations might suffer from overall poor environmental quality and inadequate healthcare resources, negating any potential benefits of reduced NO2 exposure (34). However, it was imperative to emphasize that this observed correlation did not imply a beneficial effect of NO2 on health. Substantial evidence from epidemiological studies demonstrated that NO2 exposure was associated with increased risks of cardiovascular diseases, respiratory disorders, and all-cause mortality (35). Therefore, while certain regions might experience higher life expectancy due to favorable socio-economic conditions, these benefits did not outweigh the well-documented detrimental health effects of NO2 exposure.
The impact of nitrogen dioxide (NO2) on life expectancy exhibited notable regional disparities in China, with a more pronounced effect in the northwest compared to the southeast. This spatial heterogeneity could be attributed to several factors. In northwestern regions, the delayed industrialization and urbanization processes had resulted in industrial emissions being concentrated in specific industrial parks, leading to elevated local NO2 concentrations and more severe health impacts on surrounding populations. Additionally, the arid climate and poor atmospheric diffusion conditions in the northwest facilitated the accumulation of pollutants near the ground, exacerbating the adverse health effects of NO2. In contrast, southeastern regions, characterized by developed economies, high urbanization levels, and dense transportation networks, had implemented stricter environmental protection measures and possess more robust medical resources and health protection systems. These factors had collectively mitigated the negative impact of NO2 on life expectancy to a considerable extent (36). Furthermore, the humid climate and superior atmospheric diffusion conditions in the southeast reduced the likelihood of prolonged pollutant retention, thereby diminishing the health risks associated with NO2. The regional differences in the impact of NO2 on life expectancy were not solely determined by pollutant concentrations and sources but were also influenced by a complex interplay of economic development, environmental policies, and climatic conditions. This underscored the importance of region-specific strategies in addressing air pollution and its health implications (37).
The analysis revealed that PM10 exhibited a notable impact on life expectancy exclusively in Yunnan Province, while SO2 also demonstrated a significant influence in the region. These findings underscored the urgent need for Yunnan Province to implement targeted pollution control measures, prioritizing the reduction of PM10 and SO2 levels to mitigate their adverse health effects.
5 Conclusion
In conclusion, this study revealed distinct spatial disparities and autocorrelation of life expectancy across China, highlighting the heterogeneous impacts of air pollution factors on population health. Among the selected pollutants, SO2, NO2, and PM10 exhibited significant but geographically varying effects on life expectancy. Specifically, SO2 demonstrated a more pronounced impact in southern cities, while NO2 showed stronger effects in the northwestern region. Notably, PM10 influence was exclusively observed in Yunnan Province. These regional disparities underscored the necessity for localized air pollution control strategies.
The findings of this study provide critical insights for policymakers aiming to improve public health through air pollution mitigation. Southern provinces should prioritize SO2 emission reduction, whereas northwestern regions should focus on NO2 pollution control. For Yunnan Province, a dual approach targeting both SO2 and PM10 is recommended. Furthermore, given the cross-regional nature of air pollution, inter-provincial collaboration in developing joint prevention and control measures is crucial for effectively enhancing life expectancy across China. Policymakers should also consider integrating health impact assessments into air quality management plans to ensure that pollution control strategies are aligned with public health goals. Additionally, public awareness campaigns and stricter enforcement of environmental regulations could further support these efforts.
While this study provides valuable insights, several limitations should be acknowledged. First, the analysis relied on aggregated data at the provincial level, which may mask finer-scale variations in air pollution exposure and health outcomes. Second, the study focused on a limited set of air pollutants (SO2, NO2, and PM10), and future research could include other pollutants such as ozone (O3) to provide a more comprehensive understanding. Third, the cross-sectional design of the study limits our ability to infer causal relationships between air pollution and life expectancy. Longitudinal studies are needed to better understand the temporal dynamics of these relationships. Finally, unmeasured confounding factors, such as socioeconomic status and healthcare access, may have influenced the results, highlighting the need for more nuanced data in future analyses (38).Despite these limitations, this study contributes to the growing body of evidence on the spatial heterogeneity of air pollution’s health impacts and provides a foundation for targeted policy interventions to improve population health in China.
Data availability statement
The datasets presented in this study can be found in online repositories. The names of the repository/repositories and accession number(s) can be found in the article/Supplementary material.
Ethics statement
Ethical approval was not required for the study in accordance with the local legislation and institutional requirements. Written informed consent to participate in this study was not required from the participants or the participants’ legal guardians/next of kin.
Author contributions
KH: Writing – original draft. XZ: Writing – original draft. XY: Writing – original draft. MY: Writing – review & editing.
Funding
The author(s) declare that no financial support was received for the research and/or publication of this article.
Acknowledgments
Thank National Health Commission of the People’s Republic of China and Department of Ecology and Environment of various regions of China for providing us with data.
Conflict of interest
The authors declare that the research was conducted in the absence of any commercial or financial relationships that could be construed as a potential conflict of interest.
Generative AI statement
The author(s) declare that no Gen AI was used in the creation of this manuscript.
Publisher’s note
All claims expressed in this article are solely those of the authors and do not necessarily represent those of their affiliated organizations, or those of the publisher, the editors and the reviewers. Any product that may be evaluated in this article, or claim that may be made by its manufacturer, is not guaranteed or endorsed by the publisher.
Supplementary material
The Supplementary material for this article can be found online at: https://www.frontiersin.org/articles/10.3389/fpubh.2025.1565744/full#supplementary-material
References
1. Han, Y, Hu, K, Wu, Y, and Fang, Y. Future life expectancy with disability among elderly Chinese individuals: a forecast based on trends in stroke and dementia. Public Health. (2021) 198:62–8. doi: 10.1016/j.puhe.2021.06.013
2. Lopreite, M, and Zhu, Z. The effects of ageing population on health expenditure and economic growth in China: a Bayesian-VAR approach. Soc Sci Med. (2020) 265:113513. doi: 10.1016/j.socscimed.2020.113513
3. Lopreite, M, Misuraca, M, and Puliga, M. An analysis of the thematic evolution of ageing and healthcare expenditure using word embedding: a scoping review of policy implications. Socio Econ Plan Sci. (2023) 87:101600. doi: 10.1016/j.seps.2023.101600
4. Wu, Y, Hu, K, Han, Y, Sheng, Q, and Fang, Y. Spatial characteristics of life expectancy and geographical detection of its influencing factors in China. Int J Environ Res Public Health. (2020) 17:906. doi: 10.3390/ijerph17030906
5. Liu, H, and Zhong, K. Relationship between health spending, life expectancy and renewable energy in China: a new evidence from the VECM approach. Front Public Health. (2022) 10:993546. doi: 10.3389/fpubh.2022.993546
6. Chen, Y, Ebenstein, A, Greenstone, M, and Li, H. Evidence on the impact of sustained exposure to air pollution on life expectancy from China's Huai River policy. Proc Natl Acad Sci USA. (2013) 110:12936–41. doi: 10.1073/pnas.1300018110
7. Cao, J, Yang, C, Li, J, Chen, R, Chen, B, Gu, D, et al. Association between long-term exposure to outdoor air pollution and mortality in China: a cohort study. J Hazard Mater. (2011) 186:1594–600. doi: 10.1016/j.jhazmat.2010.12.036
8. Wang, C, Zhou, X, Chen, R, Duan, X, Kuang, X, and Kan, H. Estimation of the effects of ambient air pollution on life expectancy of urban residents in China. Atmos Environ. (2013) 80:347–51. doi: 10.1016/j.atmosenv.2013.08.018
9. Pope, CA 3rd, Burnett, RT, Thun, MJ, Calle, EE, Krewski, D, Ito, K, et al. Lung cancer, cardiopulmonary mortality, and long-term exposure to fine particulate air pollution. JAMA. (2002) 287:1132–41. doi: 10.1001/jama.287.9.1132
10. Pope, CA 3rd, Burnett, RT, Thurston, GD, Thun, MJ, Calle, EE, Krewski, D, et al. Cardiovascular mortality and long-term exposure to particulate air pollution: epidemiological evidence of general pathophysiological pathways of disease. Circulation. (2004) 109:71–7. doi: 10.1161/01.Cir.0000108927.80044.7f
11. Pope, CA 3rd, Ezzati, M, and Dockery, DW. Fine-particulate air pollution and life expectancy in the United States. N Engl J Med. (2009) 360:376–86. doi: 10.1056/NEJMsa0805646
12. Pope, CA 3rd, Ezzati, M, and Dockery, DW. Fine particulate air pollution and life expectancies in the United States: the role of influential observations. J Air Waste Manage Assoc. (2013) 63:129–32. doi: 10.1080/10962247.2013.760353
13. Lou, C-R, Liu, H-Y, and Li, Y-F. Socioeconomic drivers of PM2.5 in the accumulation phase of air pollution episodes in the Yangtze River Delta of China. Int J Environ Res Public Health. (2016) 13:928. doi: 10.3390/ijerph13100928
14. Wang, L, BingganWei, LY, Li, H, Zhang, F, Rosenberg, M, Yang, L, et al. A study of air pollutants influencing life expectancy and longevity from spatial perspective in China. Sci Total Environ. (2014) 487:57–64. doi: 10.1016/j.scitotenv.2014.03.142
15. Poudyal, NC, Hodges, DG, Bowker, JM, and Cordell, HK. Evaluating natural resource amenities in a human life expectancy production function. J Forest Policy Econ. (2009) 11:253–9. doi: 10.1016/j.forpol.2009.04.007
16. Jiang, J, Luo, L, Xu, P, and Wang, P. How does social development influence life expectancy? A geographically weighted regression analysis in China. Public Health. (2018) 163:95–104. doi: 10.1016/j.puhe.2018.06.003
17. Fu, H, Cui, L, Li, J, Wu, Y, Meng, Y, and Wang, Y. The spatiotemporal variation and key factors of SO2 in 336 cities across China. J Clean Prod. (2019) 210:602–11. doi: 10.1016/j.jclepro.2018.11.062
18. Duque, AM, Peixoto, MV, Lima, SV, Goes, MAO, Santos, AD, Araújo, KCGM, et al. Analysis of the relationship between life expectancy and social determinants in a north-eastern region of Brazil, 2010-2017. Geospatial Health. (2018) 13:702. doi: 10.4081/gh.2018.702,
19. O’brien, RM. A caution regarding rules of thumb for variance inflation factors. Qual Quant. (2007) 41:673–90. doi: 10.1007/s11135-006-9018-6
20. Wheeler, D, Tiefelsdorf, M, and Fischer, MM. Multicollinearity and correlation among local regression coefficients in geographically weighted regression. J Geograp Sys. (2005) 7:161–87. doi: 10.1007/s10109-005-0155-6,
21. Lin, CH, and Wen, TH. Using geographically weighted regression (GWR) to explore spatial varying relationships of immature mosquitoes and human densities with the incidence of dengue. Int J Environ Res Public Health. (2011) 8:2798–815. doi: 10.3390/ijerph8072798
22. Wu, D. Spatially and temporally varying relationships between ecological footprint and influencing factors in China's provinces using geographically weighted regression (GWR). J Clean Prod. (2020) 261:121089. doi: 10.1016/j.jclepro.2020.121089
23. Sun, W, Gong, J, Zhou, J, Zhao, Y, Tan, J, Ibrahim, AN, et al. A spatial, social and environmental study of tuberculosis in China using statistical and GIS technology. Int J Environ Res Public Health. (2015) 12:1425–48. doi: 10.3390/ijerph120201425
24. Pope, CA 3rd, and Dockery, DW. Health effects of fine particulate air pollution: lines that connect. J Air Waste Manage Assoc. (2006) 56:709–42. doi: 10.1080/10473289.2006.10464485
25. Zhang, X, Chen, X, and Zhang, X. The impact of exposure to air pollution on cognitive performance. Proc Natl Acad Sci USA. (2018) 115:9193–7. doi: 10.1073/pnas.1809474115
26. Jerrett, M, Burnett, RT, Pope, CA, Ito, K, Thurston, G, Krewski, D, et al. Long-term ozone exposure and mortality. N Engl J Med. (2009) 360:1085–95. doi: 10.1056/NEJMoa0803894
27. Brauer, M, Freedman, G, Frostad, J, van Donkelaar, A, Martin, RV, Dentener, F, et al. Ambient air pollution exposure estimation for the global burden of disease 2013. Environ Sci Technol. (2016) 50:79–88. doi: 10.1021/acs.est.5b03709
28. Kan, H, Chen, R, and Tong, S. Ambient air pollution, climate change, and population health in China. Environ Int. (2012) 42:10–9. doi: 10.1016/j.envint.2011.03.003
29. Li, J, Wang, Y, Yin, P, Huang, J, Wu, Z, Cao, R, et al. The burden of sulfur dioxide pollution on years of life lost from chronic obstructive pulmonary disease: a nationwide analysis in China. Environ Res. (2021) 194:110503. doi: 10.1016/j.envres.2020.110503
30. Brunekreef, B, and Holgate, ST. Air pollution and health. Lancet (London, England). (2002) 360:1233–42. doi: 10.1016/s0140-6736(02)11274-8
31. Wang, Y, Eriksson, T, and Luo, NJ. The health impacts of two policies regulating SO2 air pollution: evidence from China. China Econ Rev. (2023) 78:101937. doi: 10.1016/j.chieco.2023.101937,
32. Huang, S, Li, H, Wang, M, Qian, Y, Steenland, K, Caudle, WM, et al. Long-term exposure to nitrogen dioxide and mortality: a systematic review and meta-analysis. Sci Total Environ. (2021) 776:145968. doi: 10.1016/j.scitotenv.2021.145968
33. Zhang, Y, Li, Z, Wei, J, Zhan, Y, Liu, L, Yang, Z, et al. Long-term exposure to ambient NO(2) and adult mortality: a nationwide cohort study in China. J Adv Res. (2022) 41:13–22. doi: 10.1016/j.jare.2022.02.007
34. Hoek, G, Krishnan, RM, Beelen, R, Peters, A, Ostro, B, Brunekreef, B, et al. Long-term air pollution exposure and cardio- respiratory mortality: a review. Environ Health: a Global Access Sci Source. (2013) 12:43. doi: 10.1186/1476-069x-12-43
35. Schwartz, JD, Di, Q, Requia, WJ, Dominici, F, and Zanobetti, A. A direct estimate of the impact of PM2.5, NO2, and O3 exposure on life expectancy using propensity scores. Epidemiology. (2021) 32:469–76. doi: 10.1097/ede.0000000000001354
36. Wang, S, and Hao, J. Air quality management in China: issues, challenges, and options. J Environ Sci (China). (2012) 24:2–13. doi: 10.1016/s1001-0742(11)60724-9
37. Wang, Y, Peng, M, Hu, C, Zhan, Y, Yao, Y, Zeng, Y, et al. Excess deaths and loss of life expectancy attributed to long-term NO(2) exposure in the Chinese elderly. Ecotoxicol Environ Saf. (2024) 281:116627. doi: 10.1016/j.ecoenv.2024.116627
Keywords: life expectancy, air pollution, spatial heterogeneity, spatial autocorrelation, geographically weighted regression
Citation: Hu K, Zhang X, Yang X and Yu M (2025) A study on the spatial distribution of life expectancy and its air pollution factors in China based on geographically weighted regression. Front. Public Health. 13:1565744. doi: 10.3389/fpubh.2025.1565744
Edited by:
Pengpeng Ye, Chinese Center For Disease Control and Prevention, ChinaReviewed by:
Milena Lopreite, University of Calabria, ItalyJinmei Wang, Wuhan University of Technology, China
Copyright © 2025 Hu, Zhang, Yang and Yu. This is an open-access article distributed under the terms of the Creative Commons Attribution License (CC BY). The use, distribution or reproduction in other forums is permitted, provided the original author(s) and the copyright owner(s) are credited and that the original publication in this journal is cited, in accordance with accepted academic practice. No use, distribution or reproduction is permitted which does not comply with these terms.
*Correspondence: Mingyang Yu, eXVtaW5neWFuZzIwMTlAMTI2LmNvbQ==
†These authors have contributed equally to this work and share first authorship