 Ying Lu
 Jingwen Wang
 Weihui Dai3*
 Bingxue Zou
- 1School of Resources and Environmental Engineering, Wuhan University of Science and Technology, Wuhan, China
- 2Safety and Emergency Research Institute, Wuhan University of Science and Technology, Wuhan, China
- 3School of Management, Fudan University, Shanghai, China
Introduction: Mass gathering activities are often accompanied by safety risks especially overcrowding, since the characteristics of risk factors may differ under various organizational patterns. However, this issue has not been sufficiently studied, which could lead to cognitive biases in understanding the risks associated with various mass gathering activities, thereby affecting the effectiveness of preventive measures.
Methods: This study investigates the risk factors of human stampede in mass gathering activities, with a particular focus on analyzing the influence of different organizational patterns on these risks and their implications for safety management. By combining Grounded Theory and Iterative Self-Organizing Clustering Algorithm (ISODATA), 209 overcrowding cases were coded to create a dataset containing risk factors.
Result: The organization coefficient was proposed to characterize the degree of risk in different clusters, and the clustering results revealed three types of organizational patterns including organized(
Discussion: The results indicate significant differences between the three organizational patterns in terms of aggregation causes, layout characteristics, and risk levels, which directly impacts the safety of mass gathering activities. Furthermore, similarities are observed in terms of triggering behaviors, knowledge, awareness, and management across the four categories. This study provides theoretical evidence for risk prevention and safety management of human stampede in mass gathering.
1 Introduction
With the recovery of the tourism industry and the diversification of travel destinations, the mobility of tourists has been continuously increasing (1). Popular scenic spots are drawing an increasing number of tourists, especially during holidays and peak seasons, when the influx of tourists becomes particularly obvious (2). Nevertheless, the surge in visitor numbers has also revealed a series of issues, among which the most prominent is overcrowding (3). Against this backdrop, the phenomenon of spontaneous crowd gatherings has been on the rise, particularly evident at large-scale music festivals (1, 4), religious events (5), and street activities (6). While these unplanned activities offer opportunities for free communication and experiences, they also pose safety risks. For instance, on October 29, 2022, a human stampede disaster occurred in Seoul, South Korea, originated from thousands of people crowding into the Itaewon district for the Halloween festivities. The disaster resulted in a total of 158 fatalities and 196 injuries (6), which is a typical overcrowding phenomenon that occurred in a spontaneous activity. Due to the undetermined number of participants, uncertain timing, and unspecified form of gathering, the characteristics of risk factors during spontaneous activities differ from those in traditionally organized activities (7). Therefore, it is of great importance to study the risk characteristics in mass gathering under different organizational patterns.
To examine the influence of organizational patterns on mass gathering activities, it is essential to categorize activities based on their organizational patterns. Previous studies on activities primarily focused on planned rather than unplanned activities, often targeting specific settings or places such as stadiums (8), temples (9, 10), subways (11, 12), schools (13, 14), etc. But in fact, large assemblies can occur spontaneously, or can be organized for specific purposes. By comprehensively considering the possible organizational patterns that various activities may present (15), mass gathering activities are categorized into three types which include the type of organized, applied, and spontaneous. Among them, organized activities are generally hosted by the government, with clear organizers and risk prevention measures (16). These activities often involve structured itineraries, regulated crowd behavior, and better-managed safety infrastructure, which help mitigate risks (13). In these environments, crowd behavior is more standardized and safety measures are more systematically implemented. Applied activities are organized by social organizations, individuals, or scenic spots with government approval and also have organizers. Spontaneous activities are gatherings of people, occurring simultaneously at the same time and in the same place for a specific purpose, with no organizers and relatively weak risk reduction measures (17).
Upon categorizing organizational patterns, it is crucial to understand the factors contributing to the overcrowding and analyze how different organizational patterns impact the risk characteristics of these activities (18). The selection of comprehensive risk factors and the choice of appropriate analytical methods are two important considerations for establishing an accurate risk model to study the mechanism of overcrowding.
As for risk factors, scholars have used various methods such as proportional statistical analysis (11, 12, 19, 20) and Accident Causation Theory (21–24) to analyze these factors through case studies. For instance, Illiyas et al. (20) identified risk factors like crowd density, collapse of temporary structures, rumors, and accidental notifications in 34 religious festival stampede accidents in India. Helbing and Mukerji (23) analyzed the 2010 Germany music festival stampede, attributing it to panic-induced crowding and a domino effect of panic spread. Although methods like HFACS (24, 25), Management Oversight Risk Tree (MORT) (26, 27), and Accident Causation Sequence Theory (28, 29) are increasingly used in research on overcrowding, these frameworks are predefined and often do not consider organizational patterns. Grounded Theory, which uses inductive reasoning based on existing cases (30), is well-suited for exploring new areas of research (31, 32). For example, Xu et al. (33) constructed a conceptual model of risk factors based on 59 air traffic controller accidents. Li et al. (34) used Grounded Theory to examine 135 industrial accidents, uncovering novel structural factors in industrial accidents. Therefore, the Grounded Theory is highly suitable for exploring situations where risk factors are unknown in the context of overcrowding.
In regard to analytical methods, while Grounded Theory proves instrumental in comprehensively exploring risk factors, its limitation lies in its qualitative nature, lacking the ability to quantitatively measure inter-factor correlations. Currently, multi-factor network research methods such as Complex Network Model (35–37), Interpretive Structural Modeling (ISM) (38), Bayesian Network (8, 39, 40) etc. have been used to investigate the correlation among multiple factors in overcrowding. For example, Siyu et al. (41) who utilized ISM analysis, delineated the hierarchical relationships among risk factors. Nonetheless, challenges arise due to subjectivity in assessing the connections between influencing factors. Lu et al. (40) drawing from 46 accident cases, devised a risk analysis model for stadium overcrowding, by leveraging Bayesian networks and triangular fuzzy numbers. They identified 24 risk factors, categorizing them into distinct states. Results indicate that factors such as audience emotions, vulnerable groups, and counterflow crowds are more prone to causing overcrowding incidents. While network modeling research facilitates the quantitative analysis of inter-factor correlations and their impact on the risks of overcrowding, it is predominantly within homogeneous contexts, limiting its capacity for differentiated research on risk factors across diverse organizational patterns.
In fact, addressing the heterogeneity of risk factors for different types of mass gathering stands out as a pivotal concern (42, 43). Some researchers segment cases based on expert experience, but cannot guarantee the grouping of samples from the same type of activities (44). Another portion of studies utilizes specific analytical techniques such as clustering algorithms (45), random parameter fractional logit models (46–48), graph convolutional neural networks GCN algorithm (49), random forests (RF) (50), deep neural networks (DNN) (51), as auxiliary tools for case categorization. Compared with pre-defined classification rules or specific model methods, clustering algorithm can aggregate based on the similarity and difference of data itself, maximize the homogeneity within groups and heterogeneity between groups, reveal potential and undiscovered characteristics or laws, and help to analyze and explain the accident classification problem more comprehensively (52, 53). Therefore, on the base of understanding the risk factors, applying clustering algorithms to analyze the characteristics of risk factors under different organizational patterns in mass gathering activities is applicable.
The Iterative Self-organization Algorithm (ISODATA) is based on the k-means algorithm, with additional operations for “merging” and “splitting” clusters. It also incorporates control parameters to manage the algorithm’s execution, enabling it to handle the clustering needs of high-dimensional, large-scale datasets (52, 54). This algorithm is particularly well-suited for situations with numerous risk factors, high dimensionality, and complexity, such as in mass gathering, as it can effectively identify and manage patterns and structures in high-dimensional data. A key focus is how to integrate grounded theory with ISODATA to establish a risk model. Lu et al. (53) proposed a method that combines iterative self-organizing data analysis (ISODATA) with fuzzy theory to explore the similarities and differences in risk factors for overcrowding cases within different risk level clusters. ISODATA analysis facilitates the effective identification of characteristic information associated with heterogeneity between clusters. However, how to distinguish clusters from the view of organization pattens and determine the heterogeneity of risk characteristics under different mass gathering activities is an unresolved issue.
To address the aforementioned issues, this study introduces a method that integrates Grounded Theory and ISODATA to analyze the characteristics of risk factors for overcrowding under different organizational patterns. The method collects the textual data of 209 overcrowding cases occurring from 2000 to 2020, extracting information to establish a comprehensive dataset delineating the risk factors contributing to overcrowding occurrences. Clustering models and organization coefficients are used to classify three distinct types of mass gathering. Furthermore, the characteristics of risk factor in mass gathering across the three organizational pattens are quantitatively compared and discussed. This research reveals the causative mechanism of overcrowding, contributing to the enhancement of risk prevention measures for sustainable travel.
2 Methodology
2.1 Sample information collection
The keywords “stampede” or “crowded” and “mass gathering” or “overcrowding” are employed for searches across search engines including Google, Bing, or Baidu. A total of 383 investigative reports and related news reports on overcrowding cases worldwide in recent years are collected. The data pertaining to overcrowding cases is authentic, comprehensive, and reflective of current social development and crowd activities. Ultimately, 209 overcrowding cases occurring between 2000 and 2022 are chosen as the samples for this research.
2.2 Identification of risk factors in mass gathering
Grounded Theory refers to the analysis and organization of primary data to establish a theoretical system or obtain conclusions (55). The whole process involves hierarchically coding the collected data and information. First, the open coding phase entails organizing the collected materials into text format and importing them into the software NVivo 11 to create free nodes for words and phrases related to overcrowding cases. Totally, 3,186 reference points are established, and similar concept points were repeatedly compared and combined to form 79 concepts. Secondly, all free nodes were integrated to complete the encoding, and nodes with the same or similar meanings are attributed to a tree node, thus obtaining axial coding. Then, all the tree nodes were further analyzed and generalized to obtain new selection codes and form the structured coding results. Focusing on the logical relationship between preliminary categories, the initial concepts are comprehensively summarized and classified, and finally 15 core categories and 57 spindle codes are extracted. An excerpt of the coding process is shown in Table 1. At the end, a coding saturation test is conducted, in which the findings are determined to be saturated by coding new accident cases on a level-by-level basis, if no new conceptual descriptions or categorized concepts appear in the data (56).
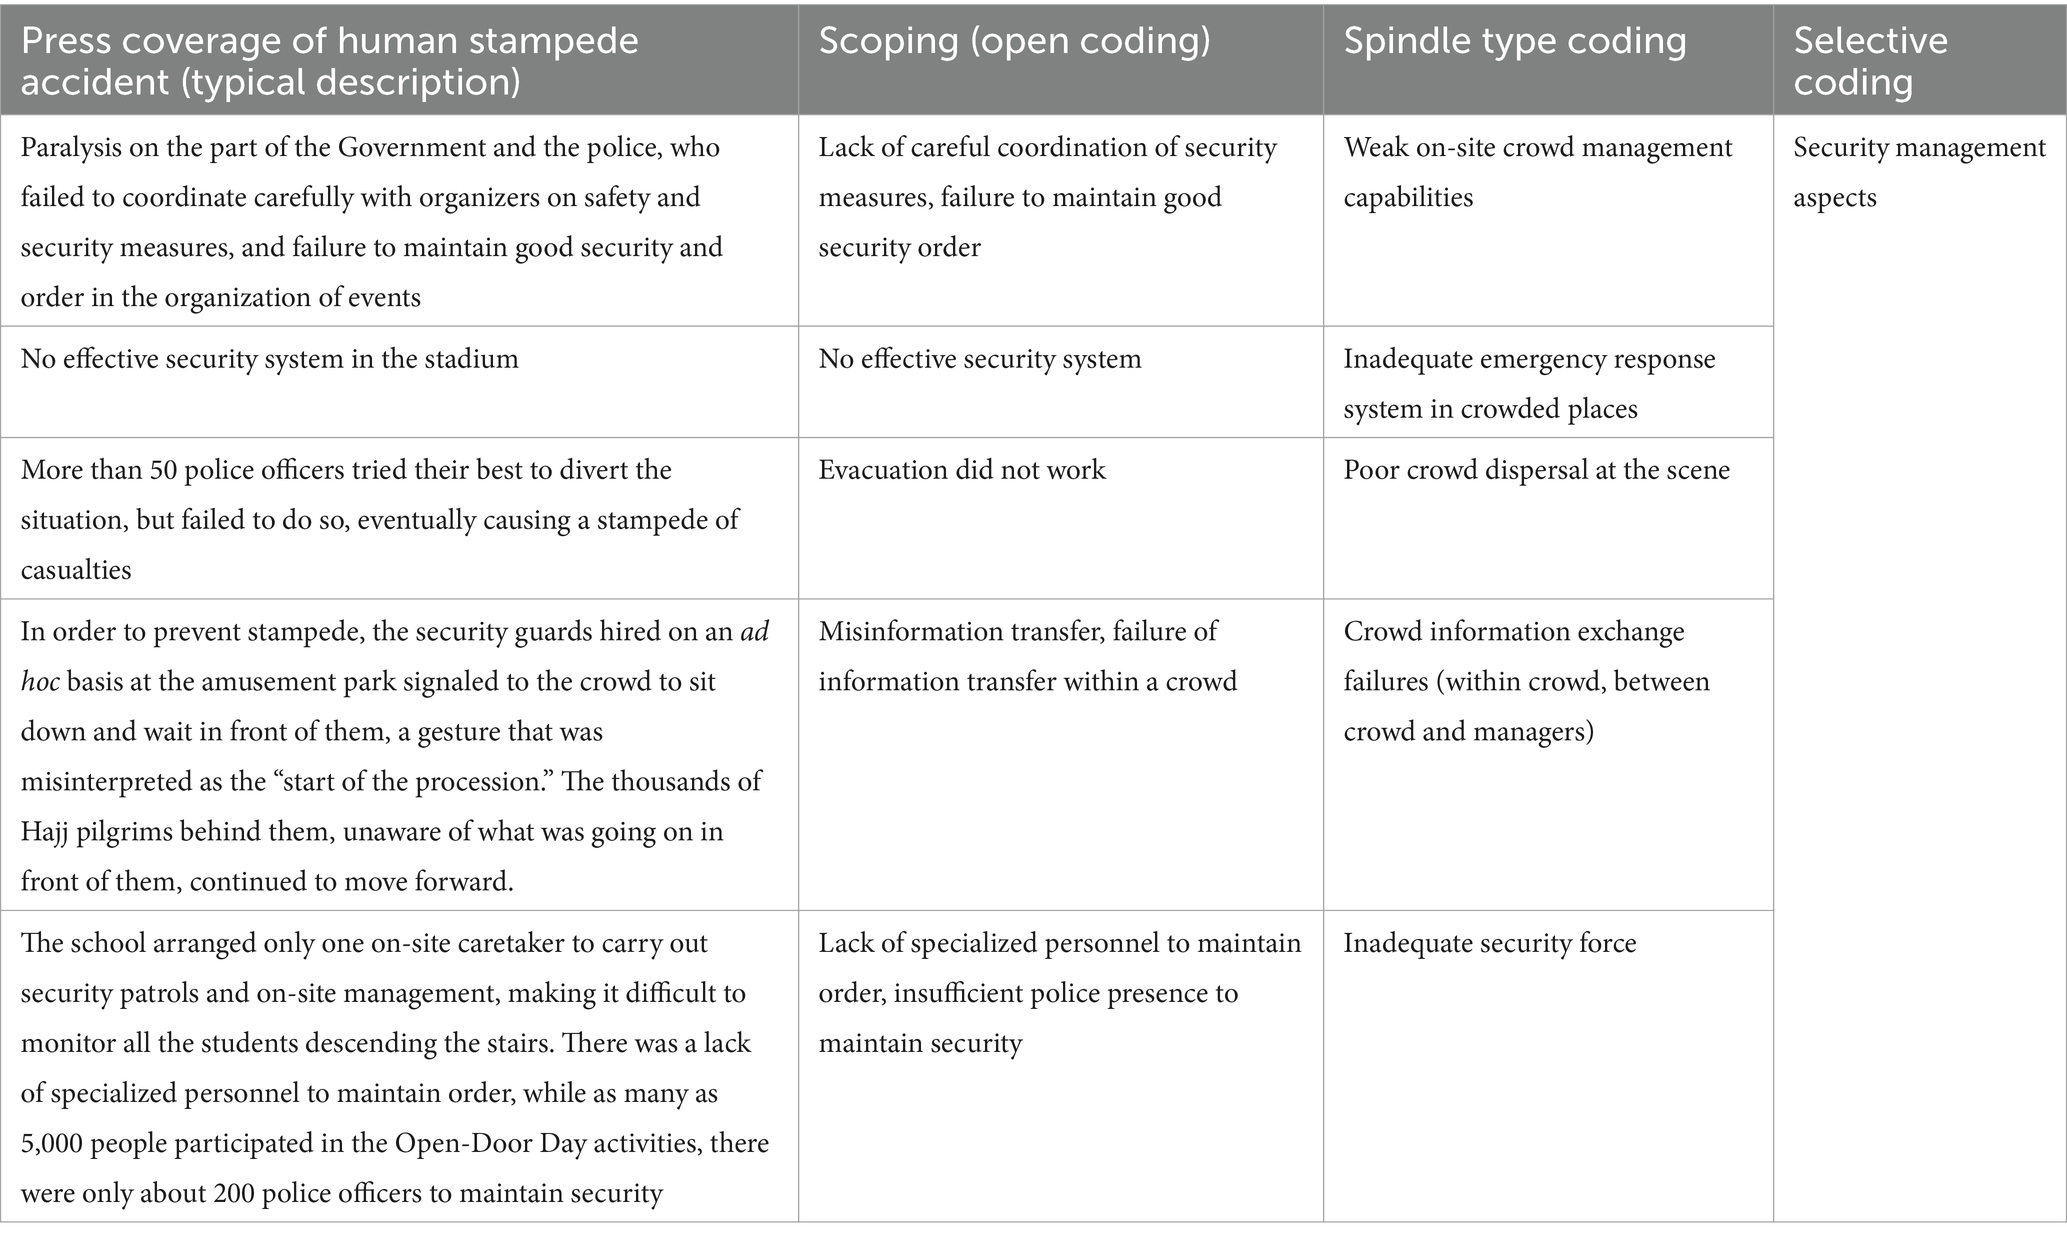
Table 1. Scope formation and implementation coding process (excerpt).
2.3 Structure of feature vectors for human stampede in mass gathering
The core principle underlying cluster analysis involves the comparison of distinct attributes among categorized entities, with the accuracy of clustering outcomes significantly reliant on the eigenvectors. Consequently, the selection of reasonable and representative quantitative indicators stands as a crucial prerequisite for effective clustering. According to the coding results of Grounded Theory analysis, combined with the literature addressing risk factors in human stampede accident (9, 10, 19, 20, 23, 40, 53, 57–59), comprehensive characterization variables are identified to encapsulate facets of accident data, encompassing temporal, spatial, risk factors and organizational patterns. Building upon this, an overcrowding cases dataset was constructed by quantizing the eigenvectors (refer to Table 2), with detailed information available in Appendix A.
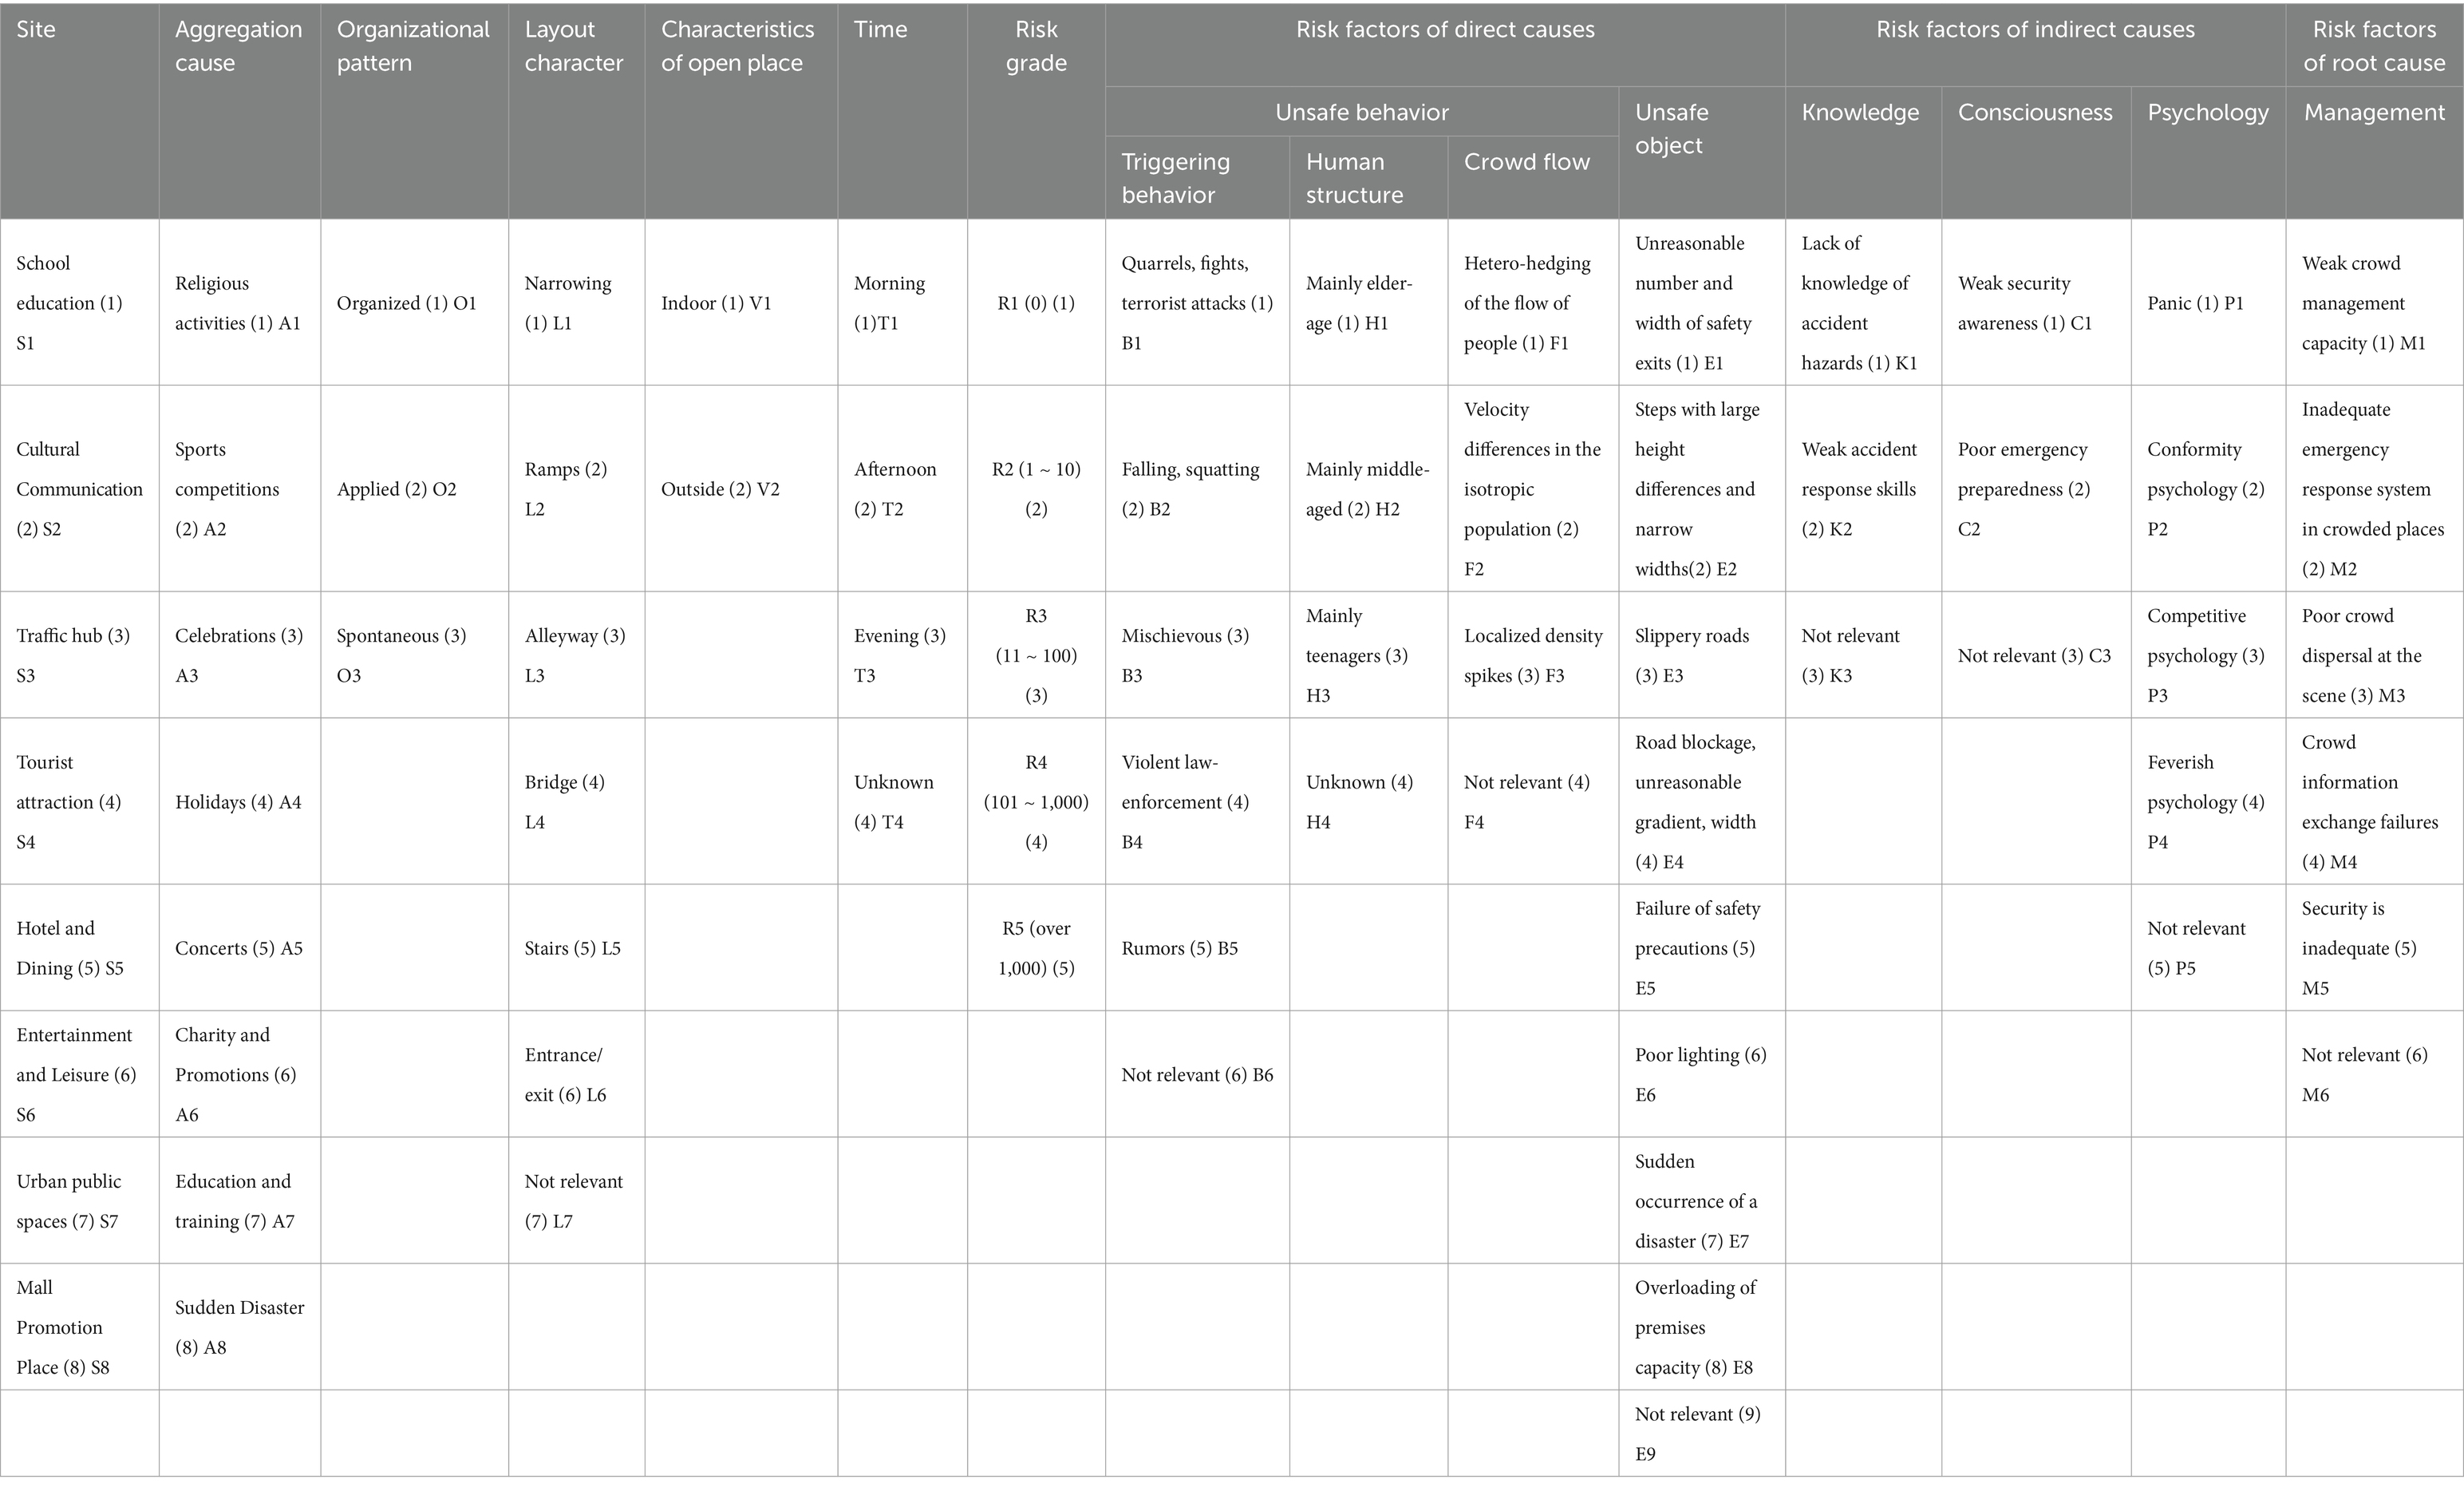
Table 2. Risk factors of human stampede accident eigenvectors and grading.
2.4 Organizational patterns clustering of human stampedes in mass gathering activities
2.4.1 Establish the clustering model for human stampede based on ISODATA
ISODATA is an improved clustering algorithm. Compared with traditional weighted clustering algorithms, which rely heavily on initial values (60), it adds merging and splitting operations on the basis of the traditional weighted clustering algorithm (54). The calculation process can automatically merge and segment clusters, avoiding the impact of unreasonable selection of initial clustering centers on the results. The algorithm rules are clear and easy to implement by computer (61). Therefore, in order to determine the optimal clustering center, the ISODATA clustering algorithm was chosen to cluster the dataset, and the optimal clustering number was selected in comparison.
Step of using ISDODTA to establish the clustering model of human stampede in mass gathering activities.
2.4.1.1 Step 1: initial cluster division
1. Input pattern samples ; preselect initial cluster centers , which may not be equal to the required cluster centers. The initial cluster centers can be arbitrarily selected from the sample. The relevant preselected values are listed in Table 3.
2. Assign pattern samples to the nearest cluster , if , that is the distance of is the smallest. Then .
3. If the number of samples in is , then the sample subset is cancelled, and is reduced by 1.
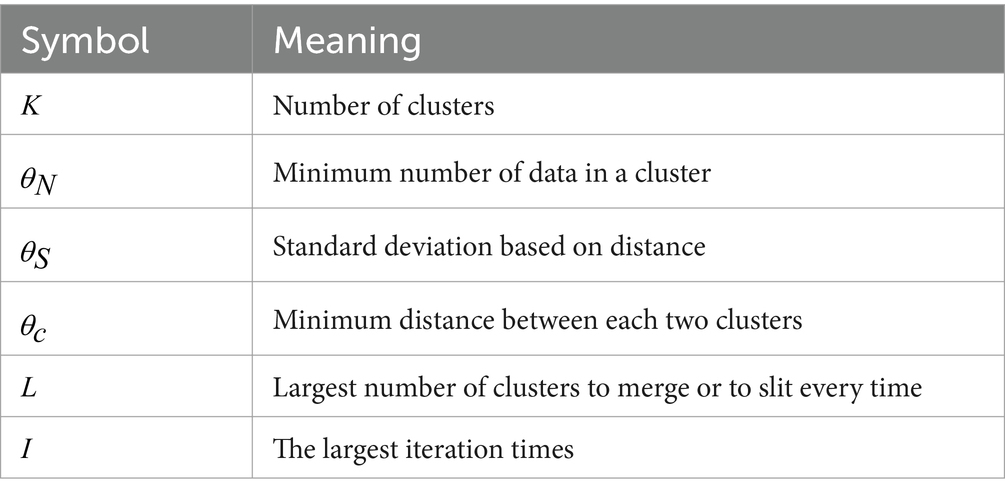
Table 3. Threshold parameters.
2.4.1.2 Step 2: cluster refinement and distance calculation
1. Revise each cluster center the calculation expression of Zj is shown in Equation 1
2. Calculate the average distance between each clustering domain pattern sample and each cluster center Refer to Equation 2 for calculation.
3. Calculate the total average distance between all model samples and their corresponding cluster centers. The specific computational formula adopted here is Equation 3
2.4.1.3 Step 3: discriminate split, merge and iterative operations
1. If the number of iteration operations has reached 1, that is, the last iteration, set , and go to the step 5;
2. If , that is, the number of cluster centers is less than or equal to half of the specified value, go to step 4 to split the existing clusters;
3. If the number of iterative operations is an even number, or , do not split and go to the fifth step; otherwise (it is neither an even number of iterations nor satisfy ), go to the fourth step to split deal with.
2.4.1.4 Step 4: assessing the dispersion of cluster samples
1. Calculate the standard deviation vector of the distance of each cluster sample, where the components of the vector are
In Equation 4, is the dimension of the sample feature vector, is the number of clusters, and is the number of samples in .
2. Find the maximum component in each standard deviation vector , represented by
3. In any maximum component set , if there is , and one of the following two conditions is met at the same time: and , that is, the total number of samples in exceeds the specified value More than doubled; splits into two new cluster centers and they are and , and is increased by 1. The component corresponding to in is added to , and the component corresponding to in is subtracted from . If the split operation is completed in this step, go to 2) of the first step, otherwise continue.
2.4.1.5 Step 5: cluster center distance calculation and merging
1. Calculate the distance of all cluster centers using Equation 5
2. Compare the values of and , and arrange the values of in ascending order of the smallest distance, namely .
Where
3. Combine the two cluster centers and with a distance of , and get the new center as:
In Equation 6, the two merged cluster center vectors are, respectively, weighted by the number of samples in their clustering domain, so that is the average vector of the true proof.
2.4.1.6 Step 6: iteration termination
If it is the first iteration, the algorithm ends; otherwise, change the input parameters and go to (1) of the first step; if the input parameters do not change, go to (2) of the first step, and the number of iteration operations should be increased by each time.
2.4.2 Evaluating clustering effects
To consider the superiority between the two clustering effects and the desirability of -values, the Elbow Rule and Silhouette Coefficient are used to evaluate them. The Elbow Rule’s core idea is that the larger the categorical number is, the finer the sample division will be, the aggregation degree in each category will gradually increase, and sum square error (SSE) will gradually become smaller. By calculating the sum square error under different cluster number to obtain the cluster number comparison graph, observe the trend of the graph, when the value of decreases, the corresponding SSE value will also decrease gradually, when the value of increases gradually, the SSE value also decreases gradually until it tends to be stable, and the whole SSE change curve presents a shape similar to an elbow. To determine the optimal cluster number, it is necessary to find a -value in the graph, when the -value increases with a larger decline in SSE, and after the -value increases the trend of the curve decreases gradually flatten out to find the inflection point in the whole curve, then the corresponding -value is the optimal number of clusters (39).
For a sample set, its Silhouette Coefficient is the average value of all sample Silhouette Coefficients, which takes the value range of [−1,1], the closer the distance of the same feature sample cluster, the further the distance of different sample clusters, the higher the Silhouette Coefficient, the closer the value is to 1, which indicates that the clustering effect is better, on the contrary, the closer the value is to −1, which indicates that the clustering effect is poorer. When the Silhouette Coefficient is 0, it indicates that there are overlapping clusters. Therefore, calculating the sample set Silhouette Coefficient can reflect the clustering effect more accurately.
The Silhouette Coefficient S for a single sample is Si, and the calculation formula for Si is Equation 7:
In Equation 7, where is the average distance of a given sample from all other samples within the same cluster, and is the average distance of a given sample from all samples in the nearest neighboring cluster (i.e., the smallest average distance to samples in another cluster).
The average Silhouette Coefficient SC of the sample set is calculated according to Equation 8 as follows:
where is the total number of samples, and is the Silhouette Coefficient for the -th sample.
2.4.3 Analyzing the organization coefficient for human stampede of mass gathering
In order to explore the influence of the organizational pattern on the risk factors of human stampede in mass gathering activities, the organization coefficient is proposed to characterize the type of organization of the activities in different clusters, using the percentage on the samples in different organizational patterns per cluster and the percentage on the whole dataset as a ratio to indicate the organization type in each cluster for the sample activities, and the size of the samples with different organizational patterns per cluster can be used to indicate the organizational patterns of the activities within that cluster.
where is the organization coefficient of cluster under the organizational pattern . is the organizational patterns number, =1 ~ 3 refers to organized type, applied type and spontaneous type. The higher the , the more obvious the characteristics of the organizational pattern are exhibited in cluster . Based on this, the organization characteristics of the cluster can be judged. is the proportion of samples with different organizational patterns in each cluster. is the proportion of samples with different organizational patterns in the dataset.
3 Result
3.1 Cluster partitioning and clustering effect evaluation
ISODATA algorithm is used for clustering analysis, and MATLAB software is used to process the 209 * 15 eigenvector set. The selection range of clustering centers is =2 ~ 10. The results show that when =8, the contour coefficient of each cluster exceeds 0. However, 6 cases of “no cluster structure” were found, which indicates that the clustering effect is not ideal when using 15 variables, and the number of variables needs to be reduced (62). Therefore, Balbi (63) p proposed a method to eliminate irrelevant variables to reduce the dimension of the database. Consequently, in this study, certain variables pertaining to the human stampede accident context (time period, place layout characteristics, place openness characteristics, and crowd structure characteristics) were excluded. Subsequently, the cluster analysis was rerun, resulting in a notable enhancement of the calculated Silhouette Coefficient for clustering. The data are shown in Table 4, where the maximum Silhouette Coefficient is 0.4235, and the maximum average Silhouette Coefficient is 0.3018.
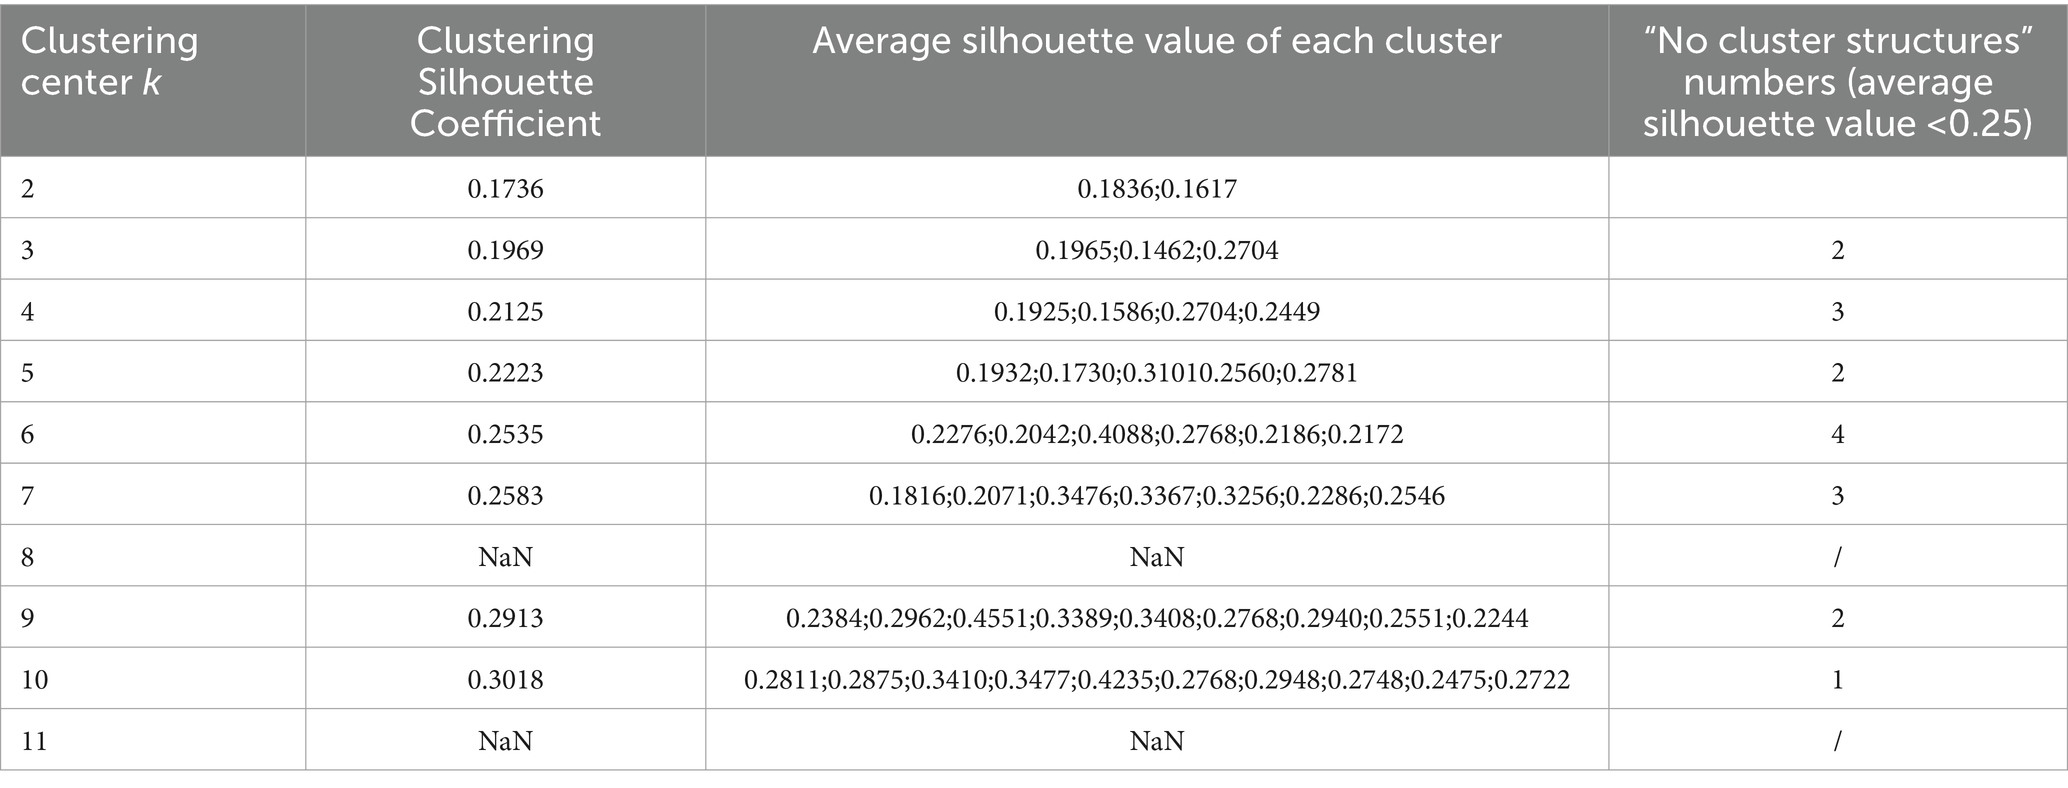
Table 4. Cluster Silhouette Coefficients after ISODATA algorithm dimensionality reduction.
The optimal result was obtained from ISODATA after downscaling, with a cluster center at =10 following dimensionality reduction. Detailed results of the optimal clusters are depicted in Figure 1. This outcome showcases a superior clustering structure characterized by Silhouette Coefficients surpassing 0 within each cluster. Additionally, the significant decrease in cluster-free structures underscores a well-organized clustering arrangement, affirming the effective classification of the dataset.
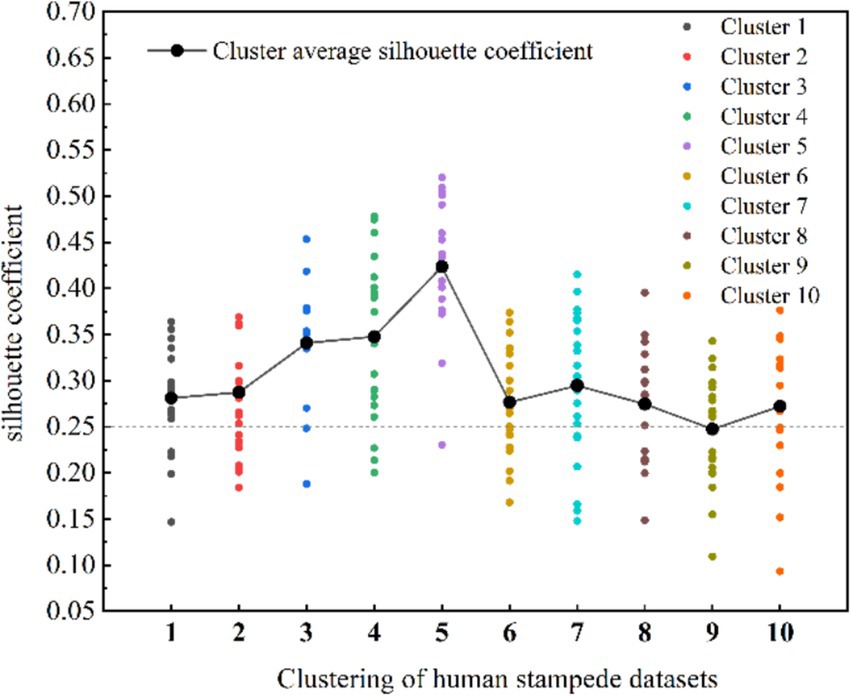
Figure 1. Distribution of Silhouette Coefficients after dimensionality reduction (k = 10).
3.2 Identification of three organizational pattern clusters
Calculate the percentage of different activities organizational pattern in each cluster and the whole dataset for the sample number, according to the Equation 9, the distribution of organization coefficient in 10 clusters is obtained. is the organization coefficient of cluster k under the organizational pattern . Table 5 and Figure 2 shows the results and distribution of respectively.

Table 5. Summary of organization coefficient results.
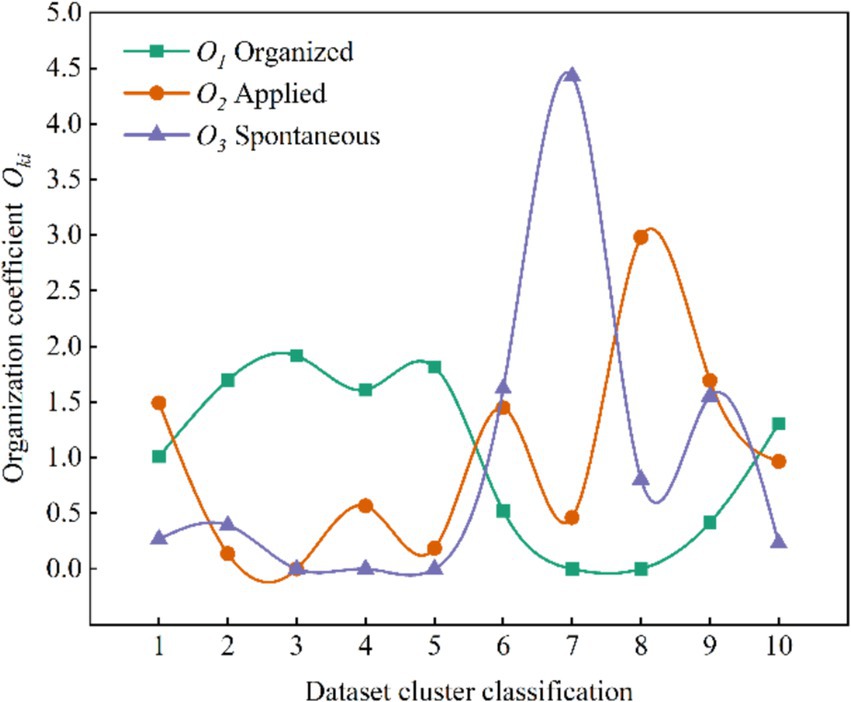
Figure 2. Distribution of results of organization coefficient calculations.
According to Figure 2 and Table 5, Cluster 7 is identified as a prototypical consolidation of spontaneous activities that contribute to human stampede in mass gathering activities. This attribution is reinforced by its possession of the highest organization coefficient ( =4.4327) when the organizational pattern is the spontaneous type ( =3). Cluster 8 is recognized as a representative assembly characterized by the applied type, displaying a relatively higher organization coefficient ( =2.9831) under the applied organizational pattern ( =2). Cluster 3 is identified as organized types. This is evident in their possession of the highest organization coefficients under =1, with =1.91743. Upon consolidating the results, Clusters 3 as organized clusters, Cluster 8 as applied cluster, and Cluster 7 as spontaneous cluster.
3.3 Cluster characteristics for each organizational pattern
3.3.1 Risk characterization of human stampede in the organized activities
Figure 3 illustrates the distribution of the characterization contributing to the risk factors under aggregation causes in organized type of human stampede accidents. The primary cause for crowd gathering in Cluster 3 is “A7 education and training,” constituting 69.21% of events in the cluster. Which is significantly higher than the overall dataset average (Difference > 10%). During the mass gathering activities, the number of tourists motivated by parent–child research, family leisure and cultural experience increased significantly, which prompted more education and training activities to be combined with tourism, forming organized learning exchange and training activity. This phenomenon is particularly obvious in China (64). Similarly, the proportion of “A2 sports events” is 21.89%, which is basically consistent with the results of single factor analysis, indicating that some sports events have organizational characteristics.
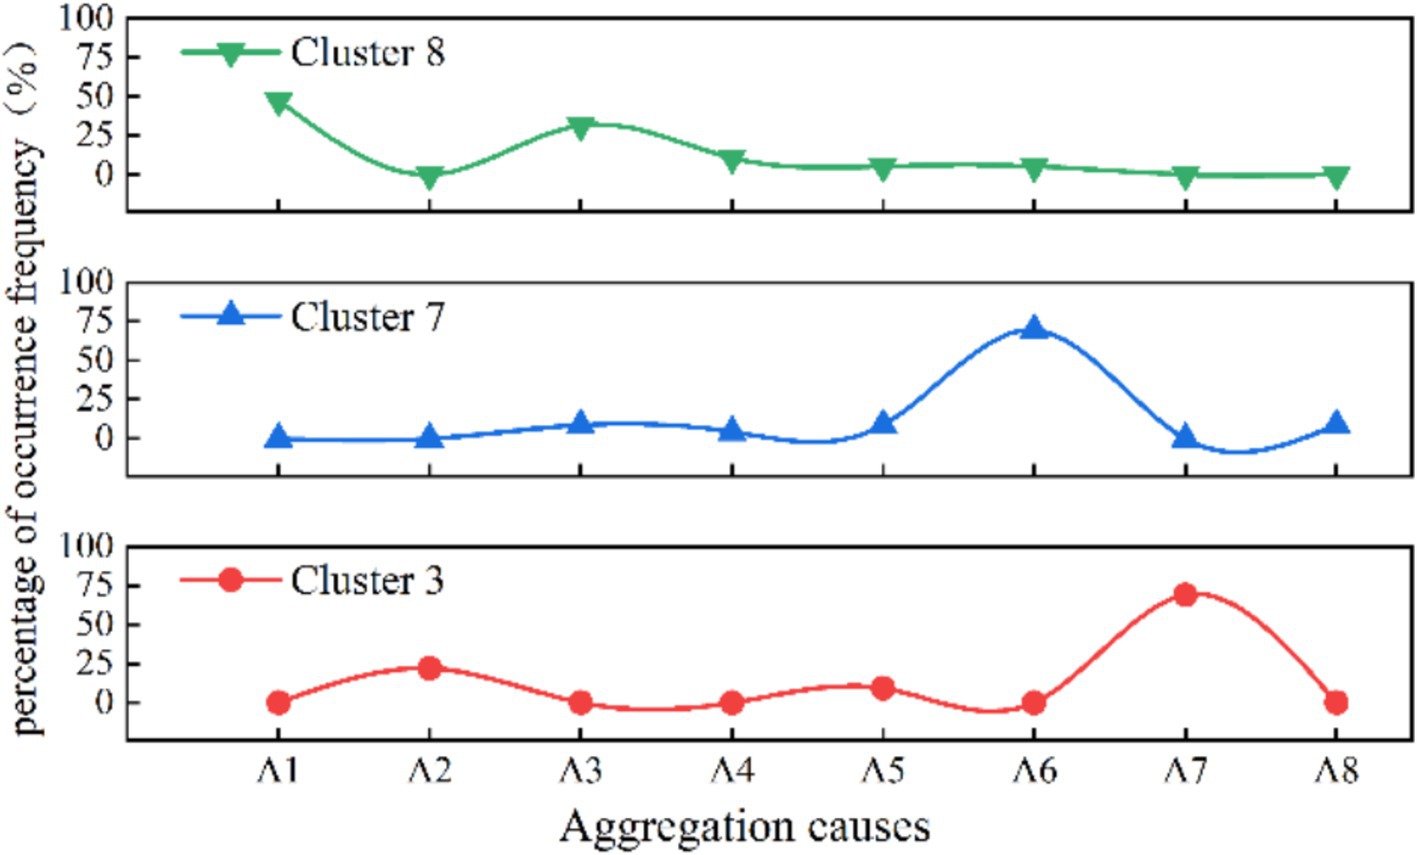
Figure 3. Distribution of the aggregation causes in the three organizational patterns of clusters (%).
Figure 4 shows the risk factors under layout characteristic in organized type of human stampede. It can be seen that in Cluster 3, the predominant layout characteristic of human stampede is concentrated in “L5 stairs” (68.42%), significantly surpassing the corresponding proportion in the overall dataset (17%). Additionally, there is a notable high proportion of the factor “L6 entrance and exit” (26.32%), and the layout characteristics in single factor analysis are mainly entrance and exit, which are consistent.
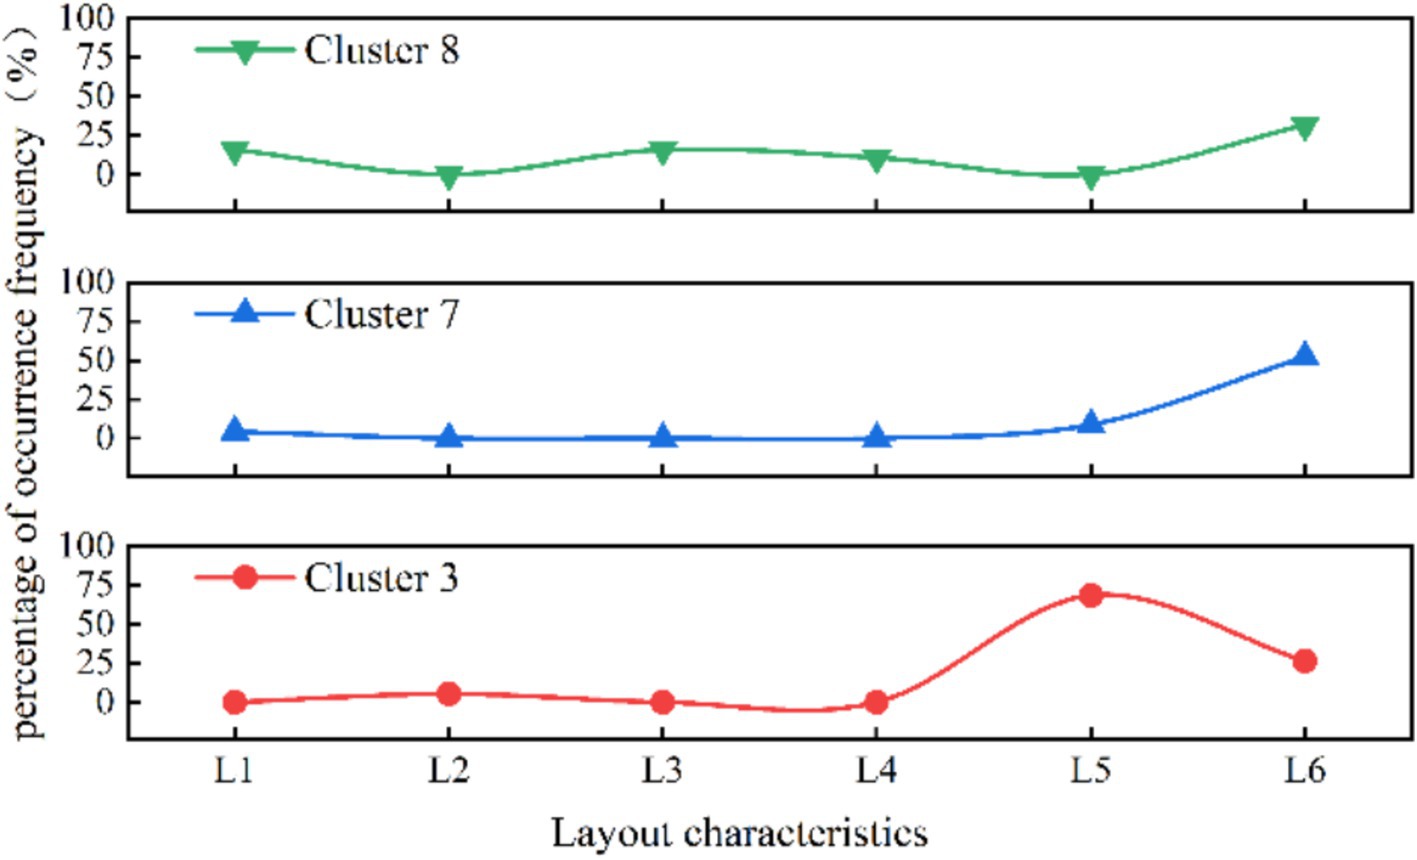
Figure 4. Distribution of layout characteristic in the three organizational patterns of clusters (%).
In the analysis of other risk characteristics for cluster 3 (Figures 5, 6), at the risk factors of direct cause level, the highest proportion of unsafe behaviors in cluster 3 is “crouching, falling” (68.42%), and the highest proportion of unsafe objects are “unreasonable number and width of safety exits” (27.27%) and” sudden disaster accidents “(26.32%) respectively. At the risk factors of indirect causes level, the three aspects of knowledge, awareness, and psychology in Cluster 3 accounted for the highest proportion of “weak emergency response skills in accidents” (36.36%), “poor public safety concepts” (72.72%), and “panic mentality” (9.09%), respectively. At the risk factors of root cause level, “poor crowd dispersal at the scene” constitutes 10% in Cluster 3.
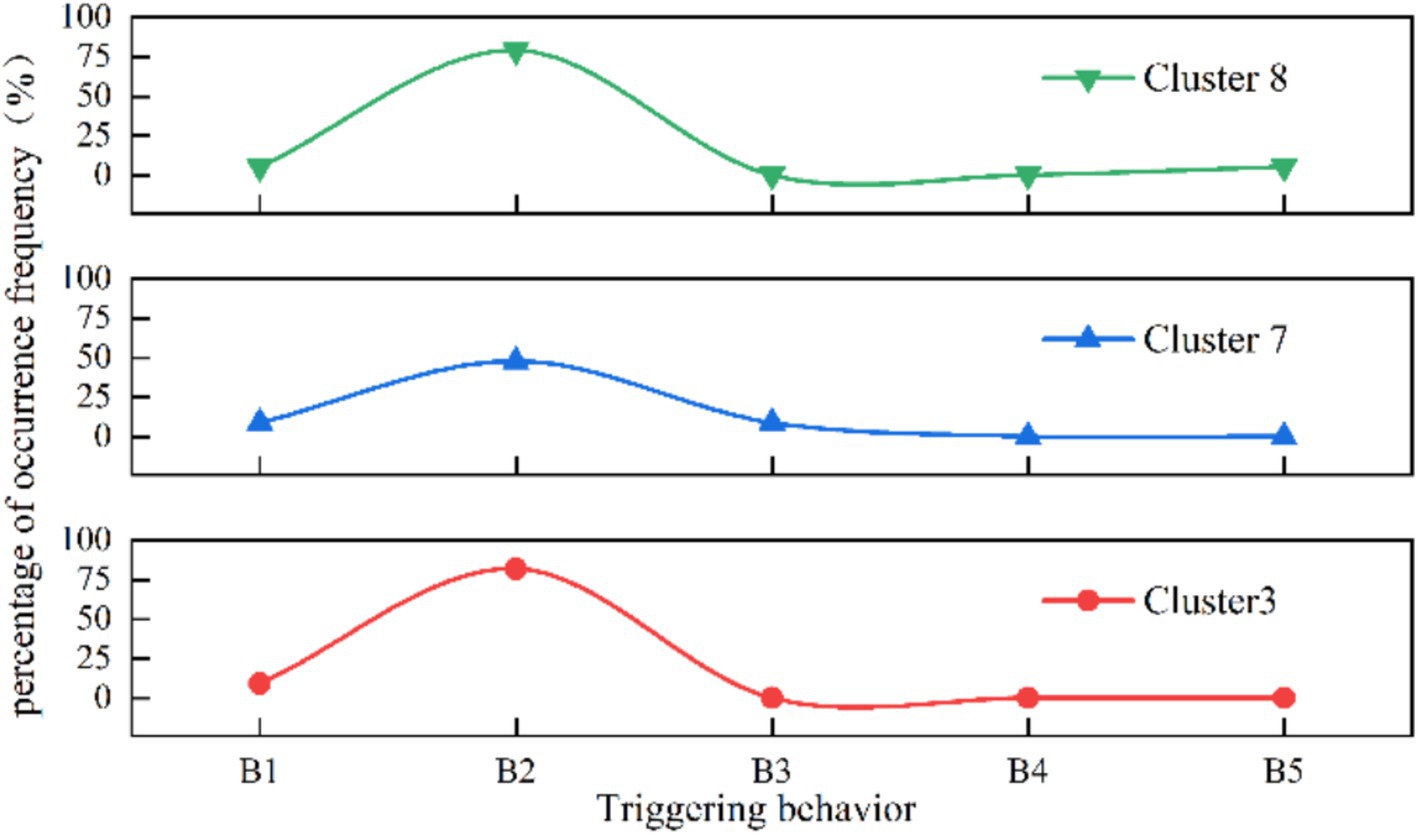
Figure 5. Distribution of triggering behavior in the three organizational patterns of clusters(%).
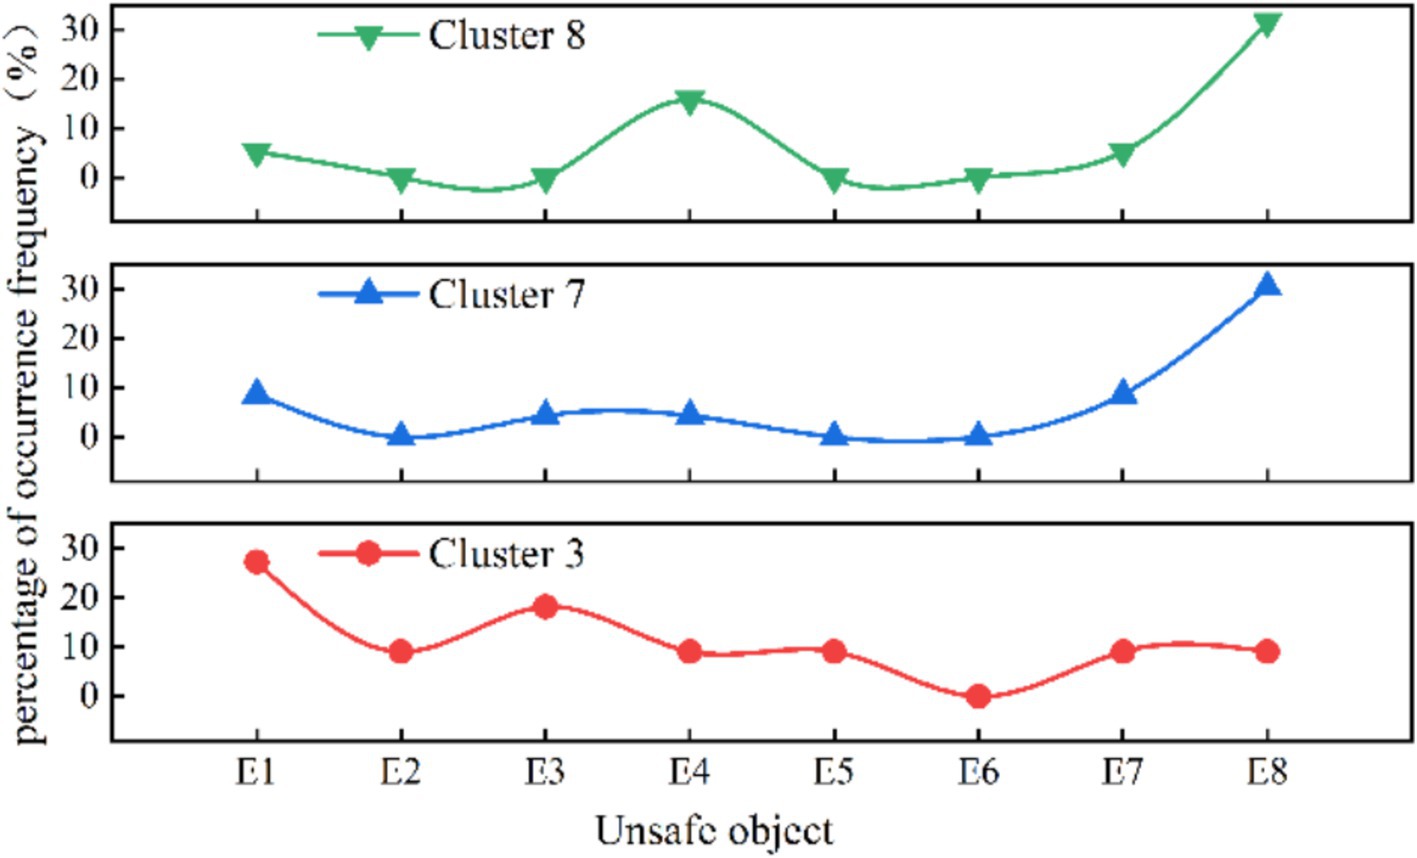
Figure 6. Distribution of unsafe object in the three organizational patterns of clusters (%).
3.3.2 Risk characterization of human stampede in the applied activities
As the applied type of human stampede, Cluster 8 has the primary aggregation causes of “religious activities” (47.37%) and “celebrations” (31.58%), constituting 12 and 16% of the dataset, respectively. In terms of layout characteristics, the predominant factor in Cluster 8 is “entrances and exits” (31.58%), followed by “narrow places” and “alleys,” each accounting for 15.79%.
According to Figures 5, 6, the analysis of other risk characteristics reveals that in Cluster 8, the primary triggering behavior is “falling, squatting” (78.95%), and the most significant unsafe object is “overloading of premises capacity” (15.79%) among the direct cause risk factors. In the analysis at risk factors of indirect causes, the leading knowledge factor is “insufficient awareness of accident hazards” (68.42%), while the dominant awareness factor is “weak public safety awareness” (78.95%). Regarding psychological factors, the factor with the highest proportion is “competitive psychology” (21.05%). At the risk factors of root cause level, the root cause indicates that “weak on-site crowd management” (31.58%) holds the highest share in Cluster 8, which is significantly higher than the overall dataset average (Difference > 10%).
3.3.3 Risk characterization of human stampede in the spontaneous activities
As the spontaneous type of human stampede, the highest proportion of aggregation causes in cluster 7 is “charity promotions” (69.57%), followed by “concerts” and “festivals.” The layout of venue where human stampede occurred is mainly characterized by “entrances and exits” (52.17%). At the risk factors of direct cause level, the triggering behaviors is mainly manifested by “falling and crouching” (47.82%), and the unsafe physical state was manifested by “overload in the place” (30.43%).
At the level of indirect cause risk factors, in terms of knowledge factors, the ratios of “lack of awareness of accident hazards “(47.83%) and “weak accident response skills” (43.48%) are similar and both are higher than the percentage of single factors. In terms of awareness factors, the order is “weak public safety awareness” (69.57%), followed by “poor emergency response” (26.09%). In terms of psychological factors, the proportions of “competitive mentality” (65.22%) and “panic mentality” (21.74%) are relatively high. At the level of root cause risk factors, the factors contributing to the significant proportion were “weak crowd management capacity” (34.78%) and “poor crowd dispersal at the scene” (26.09%).
4 Discussion
4.1 Divergences analysis of mass gathering under different organizational patterns
Among the 15 major categories of risk factors in Table 2, three types of risk factors under aggregation causes, layout characteristics and risk levels exhibit significant differences in various organization situations. Figure 7 illustrates a comparison of the aggregation causes across the three organizational patterns. The proportion of sports events(A2) education and training events (A7) occurring is high in organized clusters, primarily due to many sports events are arranged during holidays to encourage and attract people to participate in large-scale sports events. In addition, the promotion of sports events is often regarded as part of the tourism package, because they can enhance the overall tourism experience. The aggregation causes in applied type predominantly involve religious activities (A1) and celebratory events (A3). In spontaneous type, the prevalence of charity and promotional events (A6) significantly outweighs that of single-dimensional activities.
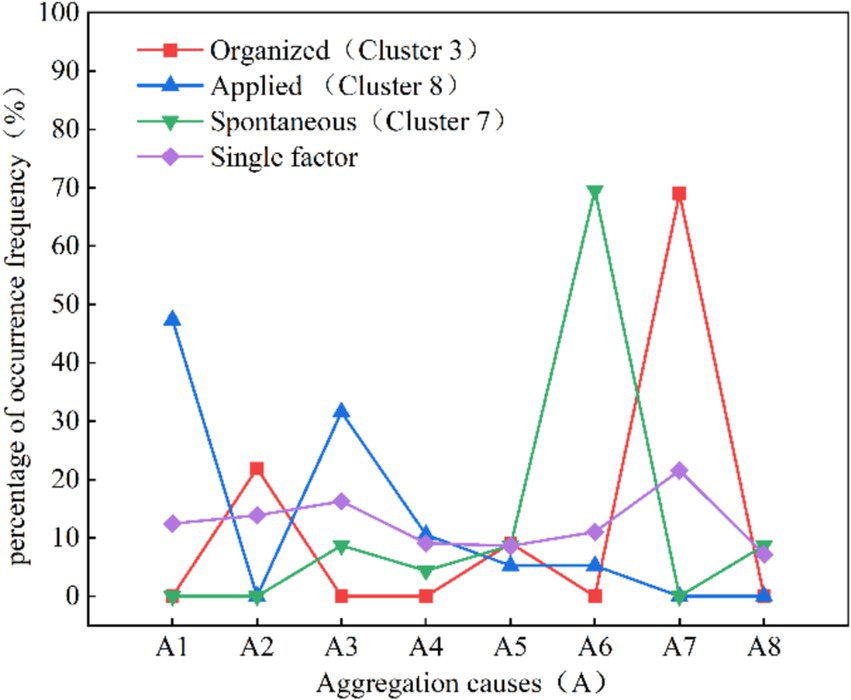
Figure 7. Aggregation causes percentage distribution curve comparison.
The findings indicate that although there is minimal disparity in aggregation causes within the overall sample. However, significant distinctions become apparent when examining different organizational patterns of mass gathering. This variation provides compelling evidence for tailoring preventive measures to address specific types of activities. Although scholars have generally overlooked variations in the causes of aggregation associated with different organizational patterns, certain researchers focus on the analysis of sport events overcrowding cases (8, 13), which is a typical organized type. Conversely, others concentrate on religious activities (20), mostly characterized as an applied type. Furthermore, there are scholars studying specific accidents such as the “Love Parade” in Germany (45, 58, 59), “10.29” Itaewon stampede accident (6, 65), and the “12.31” stampede in Shanghai Bund (15, 66), etc., which are typical examples of spontaneous human stampede accidents. This suggests gatherings motivated by diverse reasons may exhibit distinct risk characteristics in human stampede accidents. The research presented in this article systematically and quantitatively elucidates this distinction, underscoring its empirical validity.
Figure 8 illustrates a comparison of risk factors under layout among the three organizational patterns. It reveals similarities in layout features between the applied and spontaneous types of human stampede in mass gathering activities, yet significant distinctions emerge when compared to the organized type. Human stampede of organized activities typically takes place on stairs (L5). The research findings of pertinent scholars substantiate this assertion (14). Zhang and Zhou (13) observed that stairs and platforms are the most common locations for human stampede accidents, accounting for 92.3% of cases. This congestion is mainly caused by the narrow corners of stairs, which increase the risk of tripping or falling. These incidents often force people to stop or slow down abruptly, disrupting movement and leading to human stampede.
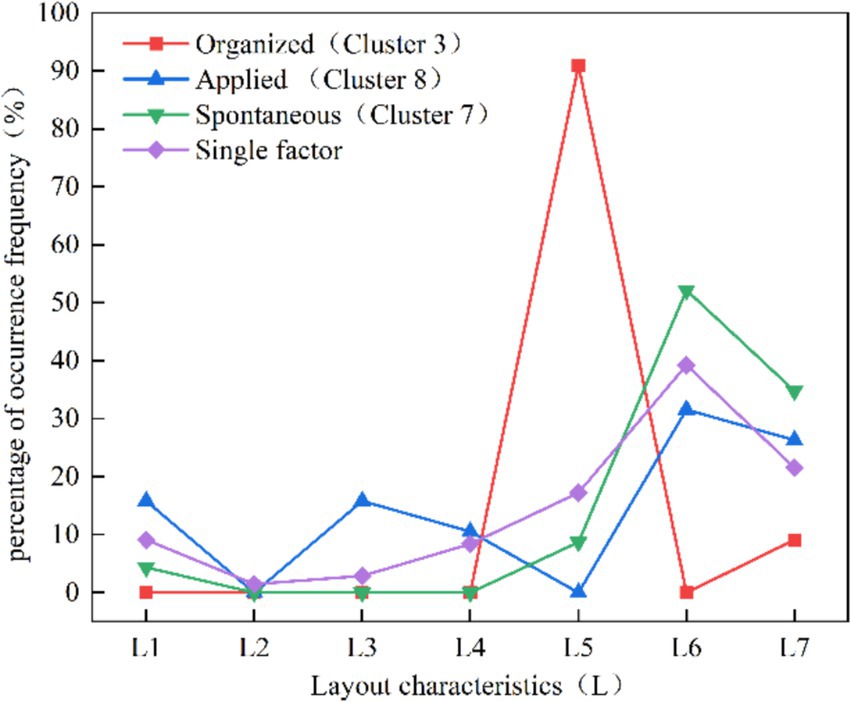
Figure 8. Layout characteristics percentage distribution curve comparison.
The applied and spontaneous types primarily occur at entrances and exits (L6). Illiyas et al. (20) in their analysis of religious activities, identified potential safety hazards in the design of event venues. During the conclusion of events or the onset of surges at the beginning, crowds tend to exit or enter, and the bottlenecked exits intensify congestion, ultimately contributing to accident.
In spontaneous activities, the absence of dedicated organizers and a potential lack of staff near entrances and exits can result in inadequate guidance and increase the risk of human stampede. Helbing et al. (23) identified one of the factors contributing to the accident at the Duisburg Love Parade as tourists using narrow stairs as potential emergency entrances and exits. When tourists attempted to reach these areas, the sudden increase in crowd density triggered a human stampede accident. Moreover, fluctuations in crowd psychology and emotions are particularly concentrated during the entry into and exit from activity areas, inevitably giving rise to anxious or impatient emotions, thereby increasing the likelihood of conflicts.
Figure 9 presents a comparative analysis of human stampede accident consequences across various organizational patterns. The results reveal that the risk levels of the applied type are largely concentrated in R3 (from 10 to 100 people died), indicating that this type of gathering activity is most prone to result in extensive casualties and injuries. The spontaneous type primarily concentrates in R2 (from 0 to 10 people died), while the organized type exhibits distributions in both R1 (none died)and R2.
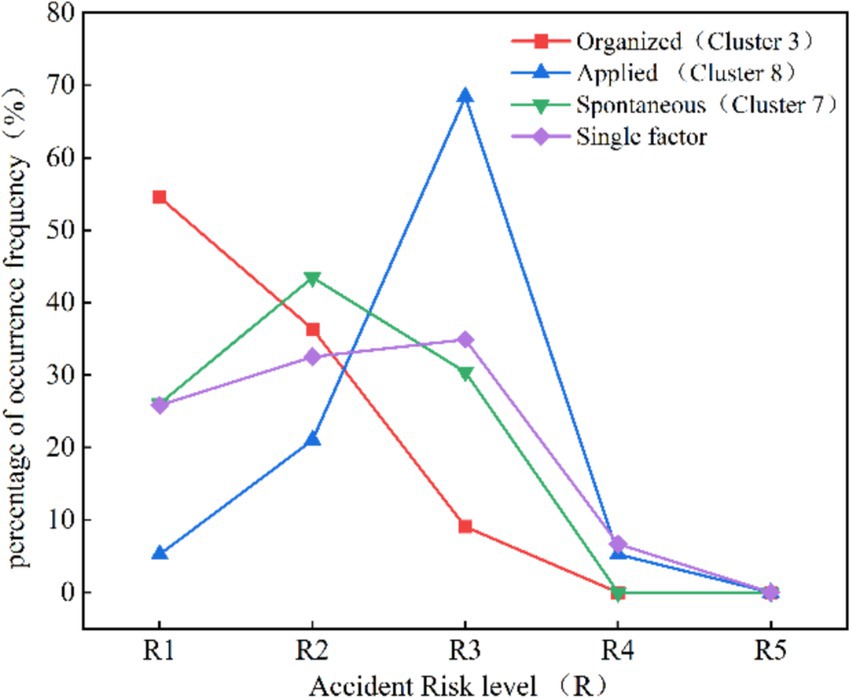
Figure 9. Accident risk level percentage distribution curve comparison.
The elevated risk level associated with the applied type can be attributed to the religious activities of this cluster. The substantial participation in religious events leads to heightened crowd density, increasing the potential for human stampede. Ahmed and Memish (19) notes that, according to a report from the Pew Research Center on the Global Religious Landscape, over 5.8 billion individuals worldwide, including both adults and children, are affiliated with religious beliefs. As event venue expands, security and rescue capabilities in remote areas tend to be relatively inadequate, and rescue and evacuation efforts become significantly challenging (20). Religious crowds often experience drastic emotional shifts, making it easier to lose control and succumb to frenzied or panicked conditions (67). At times, organizational and management capabilities struggle to keep pace with the rapid influx of participants, resulting in insufficient responses and chaotic emergency handling. Furthermore, certain religious doctrines emphasize sacrificing for faith, diminishing the likelihood of individuals taking proactive measures to escape danger. Hence, the intricate psychology of crowds within religious gatherings is a point that requires further research and attention in mass gathering activities involving human stampedes.
The risk level in spontaneous activities is relatively lower compared to the applied type, primarily owing to the diverse demographic composition of participants and the absence of strong shared beliefs and emotional bonds among them. However, group psychological effects within the population can still induce irrational behavior under pressure. Spontaneously assembled crowds demonstrate greater autonomy and randomness, moving according to their own preferences. This randomness implies that participants may struggle to predict the behavior of others, and such unpredictability can potentially trigger panic or dangerous behavior in emergency situations. Additionally, the venues for such activities are typically public spaces, characterized by openness and dispersion, as opposed to the closed and densely areas (24). These spaces may not have taken into account the human stampede in mass gathering activities during the design phase owing to their early construction period.
While various measures can be suggested to enhance the safety management of spontaneous activities, such as improving the safety design of public spaces, disseminating emergency information, and reinforcing public safety education. However, there is a need for more in-depth research on the characteristics and evolutionary mechanism of risk factors in spontaneous activities. This includes exploring the complex factors and coupling mechanisms of spontaneous crowd aggregation, examining the influence of crowd psychology on spontaneous behavior. Furthermore, even in spontaneous activities should encourage clear safety responsibility principles, which is conducive to contributing to the enhancement of safety management and risk prevention measures for sustainable travel.
The risk levels of the organized activities primarily concentrated around R1 and R2. Such activities adhere to explicit organizational disciplines, rules, and regulations, indicating that participants exhibit a high degree of self-discipline in following the commands and instructions provided by the organizers (14). Consequently, the likelihood of extreme emotional responses or destructive behaviors is mitigated. Hence, from an organizational perspective, the risk prevention and control system for such activities appears notably comprehensive. However, unsafe behavior may still occur in specific situations, such as sudden events causing panic or chaos, where participants may instinctively take self-protection actions that could violate established safety rules. Additionally, unclear or untimely communication of instructions and rules may lead to individual participants misunderstanding or not receiving information, resulting in unsafe behavior. Therefore, emergency drills are strongly recommended for spontaneous activities.
4.2 Similarities analysis of mass gathering under different organizational patterns
Figure 10 depicts the distribution of the other six major categories of risk factors contributing to the risk characterization of human stampede in mass gathering activities under the three organizational patterns. The factor codes corresponding to these categories are provided in Table 2.
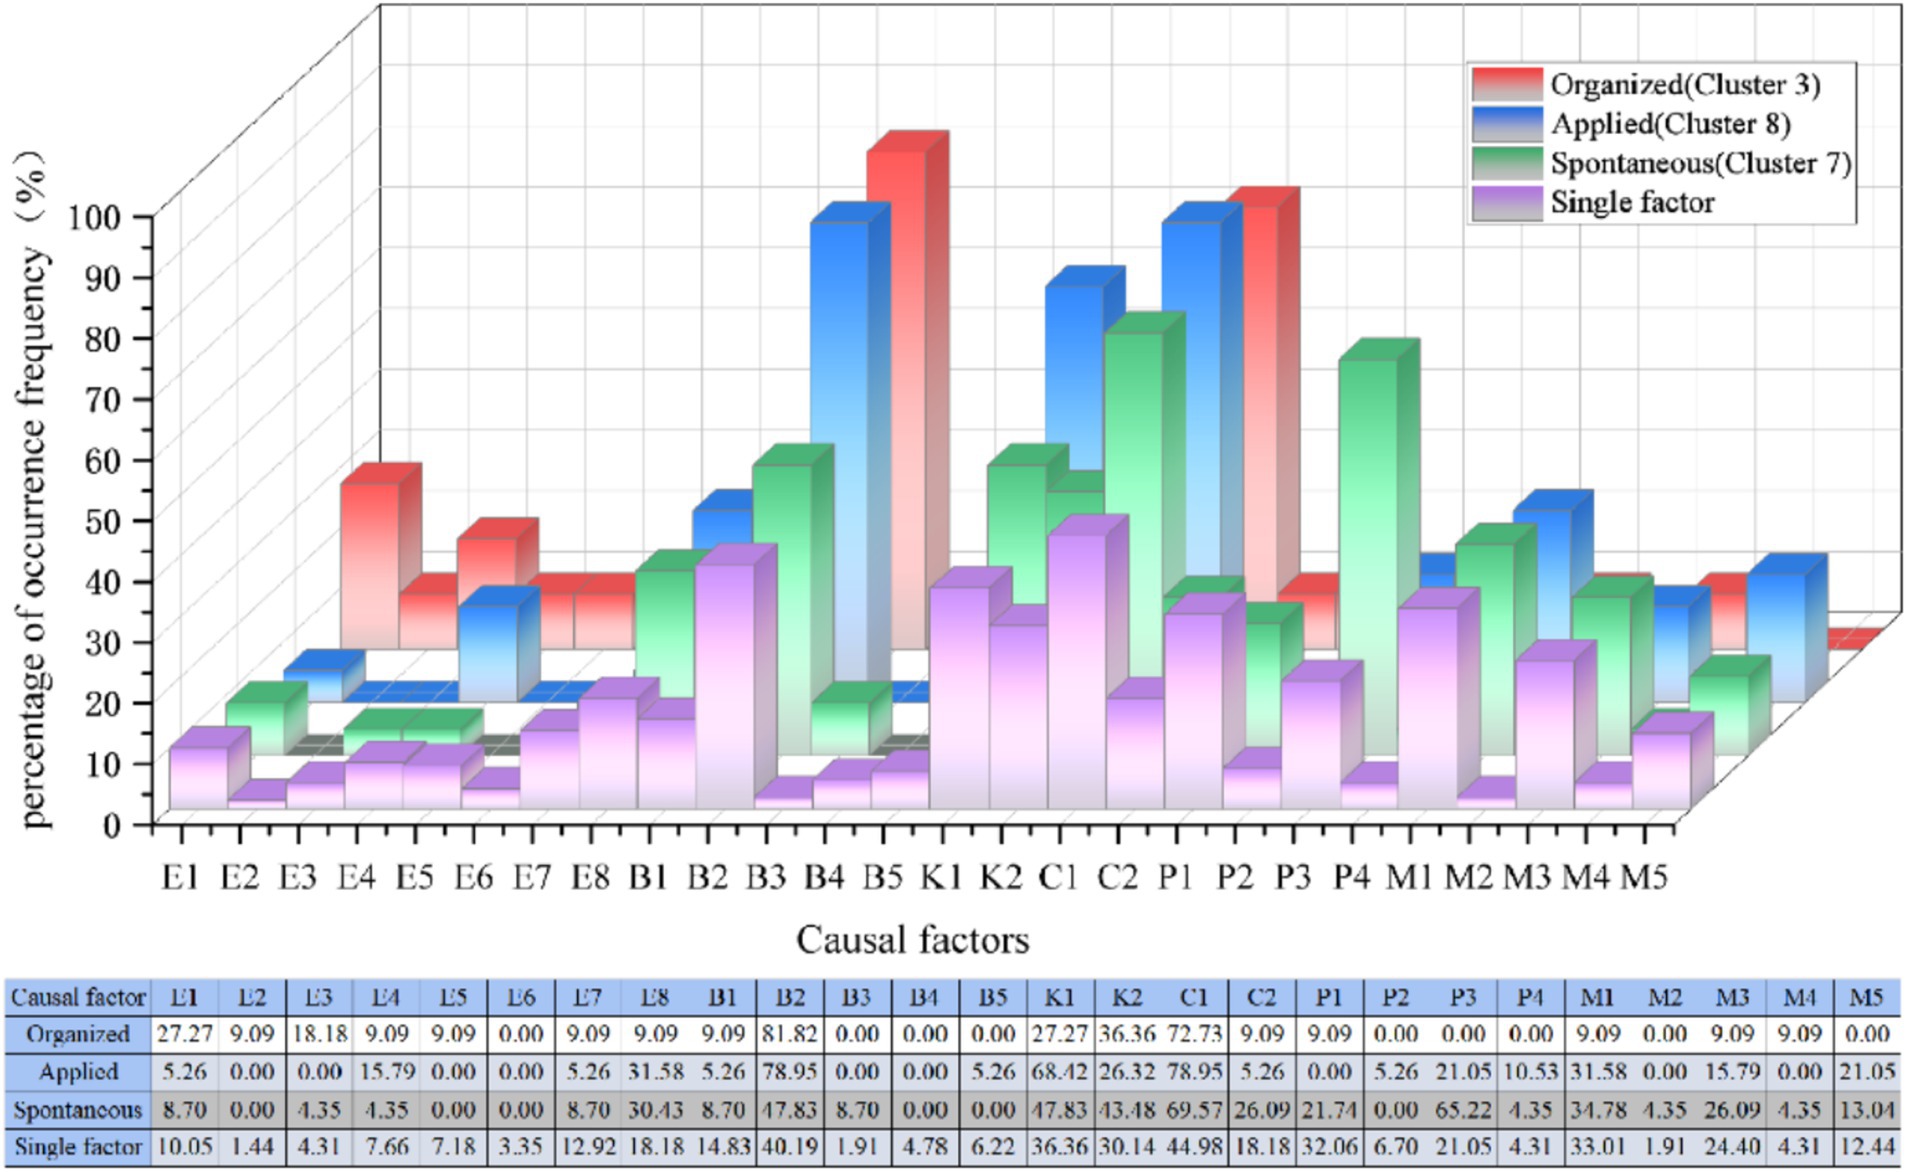
Figure 10. Other six accident cause factors percentage distribution curve comparison.
It is observed that the risk factors of the four categories, namely trigger behavior (B), knowledge (K), consciousness (C) and management (M), exhibit similarities in the distribution of risk characteristics across different organizational patterns. Within the triggering behavior category (B), factors B1 (quarrel, fight and terrorist attack) and B2 (fall) constitute a significant percentage in all clusters. Knowledge factor K2 (weak accident response skills) and consciousness factor C2 (poor emergency preparedness), along with management factors M1 (weak crowd management ability), M3 (poor on-site crowd evaluation), and M5 (insufficient safety measures), demonstrate a relatively high frequency distribution. This indicates that, although the organizational patterns in mass gathering activities may vary, the challenges related to personal characteristics and crowd management are analogous.
We have analyzed the reasons for this phenomenon and posit that conflicts and fights between individuals can arise due to interpersonal conflicts, misunderstandings, or tensions, irrespective of the organizational patterns of activities (68). Such occurrence is notably prevalent in crowded places, where individuals are at an increased risk of getting involved in conflicts, leading to the presence of B1 in all clusters. Additionally, factors such as slippery and uneven terrain can elevate the likelihood of falls (B2), a risk that is not confined to any specific organizational patterns.
The shared existence of factors K2 and C2 in knowledge and awareness underscores the critical role of education and training in individuals’ ability to handle emergencies. Issues may arise in any cluster scenario if individuals lack training in emergency response skills, awareness of emergency preparedness, and necessary self-rescue skills in their daily environment (69). Therefore, prioritizing comprehensive safety training and emergency preparedness education for individuals involved in various activities can effectively prevent overcrowding from turning into stampede accidents.
4.3 Strategies for mass gathering under different organizational patterns
Based on an analysis of the similarities and differences in risk characteristics across different organizational patterns, we developed Figure 11 to illustrate the theoretical foundation for formulating safety strategies for the three types of activities. Figure 11 presents the proportion of risk factors across the three type activities and compares them with those identified in prior studies on crowd gatherings. While previous studies on risk factors in crowd gatherings provide a valuable foundation for developing safety strategies, their selection of risk factors is often activity-specific and fails to account for the influence of organizational patterns. For instance, Almeida et al. (59) focused on the impact of venue design and crowd density in specific religious gatherings, while Illiyas et al. (20) emphasized the role of rumors and temporary structure collapses in religious festival stampedes.
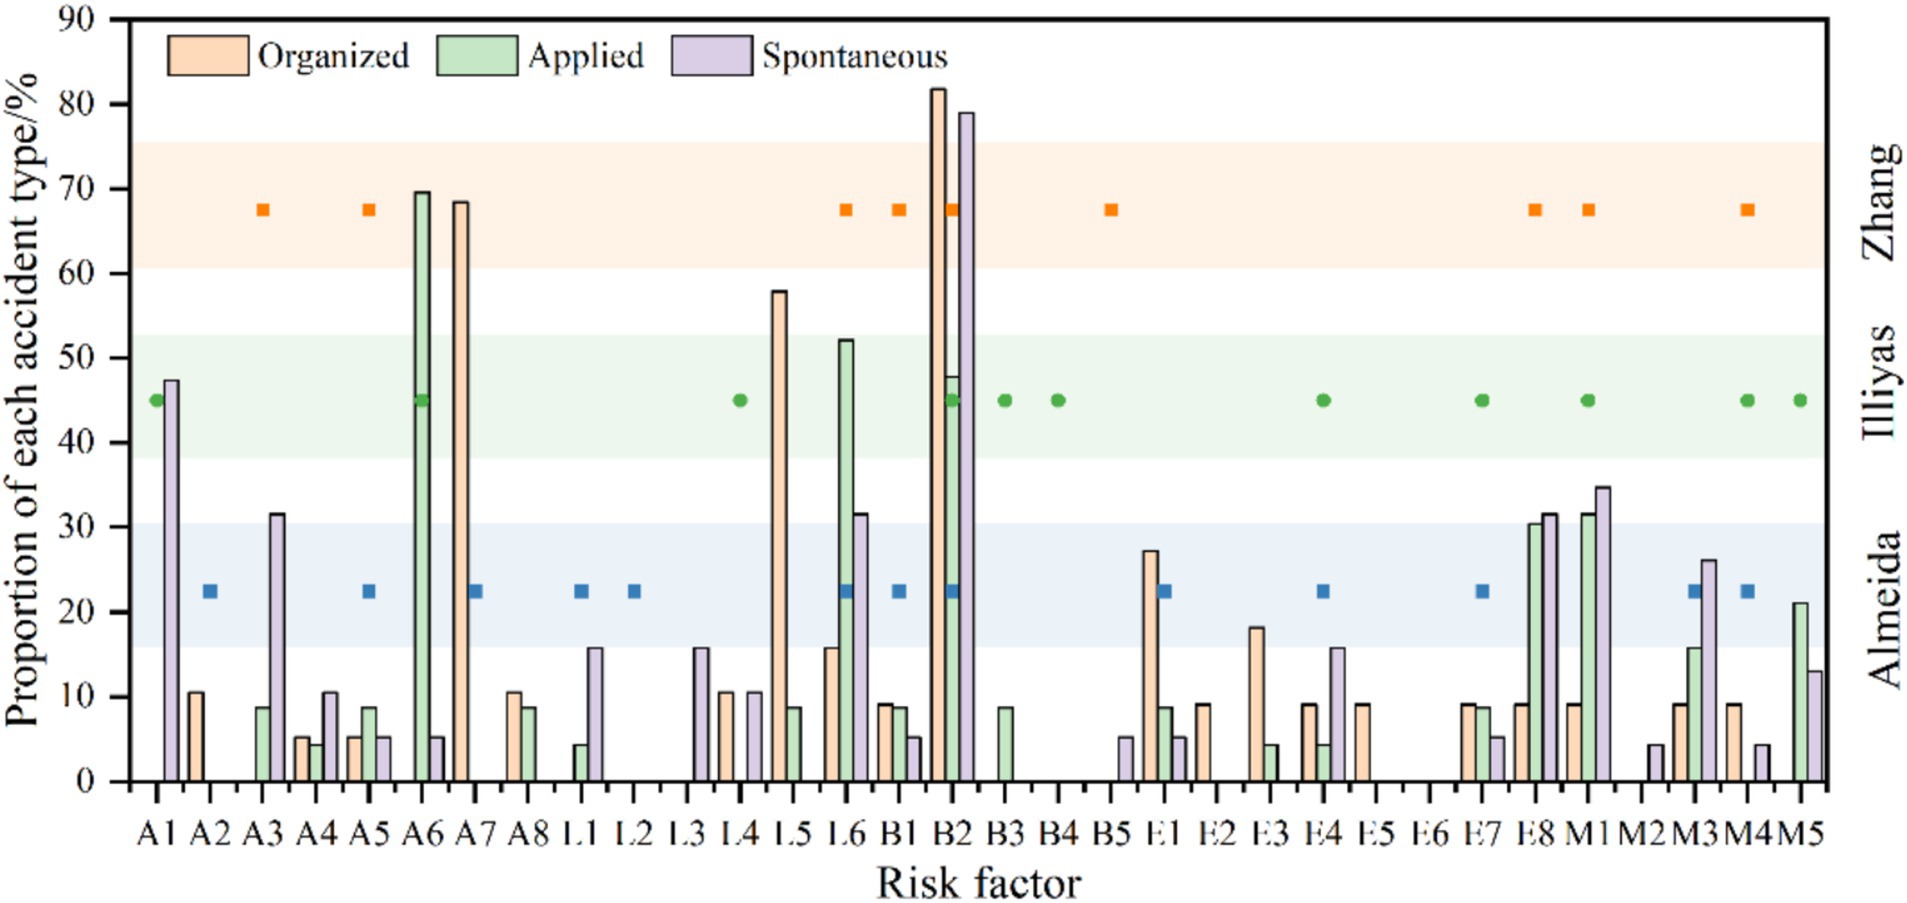
Figure 11. Comparison of risk factor proportions across different studies.
Compared to other studies, our research offers a comprehensive analysis of risk factors across three organizational patterns: organized, applied, and spontaneous activities (Figure 11). For instance, for layout character (L), organized activities predominantly occur on “stairs” (L5; 68.42%), while applied and spontaneous activities primarily occur at “entrances and exits”(L6; 31.58, 52.17%). For triggering behaviors (B), “falling and squatting” (B2) is prominent across all activity types: organized (68.42%), applied (78.95%), and spontaneous (47.82%). For unsafe objects (E), organized activities are characterized by “unreasonable number and width of safety exits” (E1; 27.27%) and “sudden disaster accidents” (E7; 26.32%). Applied activities show “overloading of premises capacity” (E8; 15.79%), while spontaneous activities highlight “overload in the place” (E8; 30.43%), emphasizing overcrowding risks. These findings underscore the varying significance of risk factors across organizational patterns, offering a more nuanced and systematic perspective than the activity-specific focus of earlier research. By integrating Grounded Theory and ISODATA, our study delivers novel insights into risk characteristics across organizational patterns, establishing a foundation for further exploration of safety strategies.
For organized activities, characterized by high-density crowds and specific spatial layouts (e.g., staircases, narrow passages), we recommend employing crowd flow models and simulations to predict and manage density. Venues should incorporate wide staircases, sufficient emergency exits, and clear signage to ensure safe movement. Regular drills and training for staff and participants are also essential for effective emergency response. These recommendations build on the strategies of Ahmed and Memish (19) and Koski et al. (29), offering tailored solutions for organized activities.
For applied activities, such as religious gatherings and celebrations, dynamic crowd management strategies are critical. Real-time monitoring systems (e.g., video surveillance, drones) are recommended to track crowd density and movement. As for spatial layout, our findings reveal that organized activities face higher risks on staircases, while applied and spontaneous activities are more vulnerable at entrances and exits. Therefore, we propose optimizing safety exit layouts to enhance evacuation routes, implementing staggered entry and exit times to reduce congestion, and ensuring security personnel and volunteers are trained in crowd management and emergency response.
For spontaneous activities, defined by their lack of formal organization and inherent unpredictability, flexible emergency response plans and targeted public awareness campaigns are vital. Public awareness initiatives should focus on educating participants about crowd safety protocols and emergency procedures. Emergency response plans must be adaptable to rapidly changing conditions, while designated safe zones should be established to provide refuge during emergencies. These recommendations are targeted at the unique risks associated with spontaneous gatherings, contrasting with prior studies that predominantly focus on planned events.
It is noteworthy that mutual conversion between activity types may occur. Traditional Eastern celebrations, such as religious festivals, temple fairs, and cultural events, often exhibit characteristics of both applied and spontaneous activities. While these activities are typically organized by religious or community groups (aligning with the applied type), they may also attract spontaneous participants who join without formal organization. This dual nature poses unique challenges for safety management, necessitating comprehensive strategies for crowd control, emergency response, and educational training. These findings highlight the importance of developing adaptive safety frameworks that account for the dynamic organizational patterns of mass gatherings. Future research could explore the effectiveness of specific interventions, such as real-time crowd monitoring technologies or targeted public awareness campaigns, in mitigating risks associated with hybrid activity types.
5 Conclusion
This study proposes a method combining Grounded Theory and Unsupervised Clustering Algorithms to explore the impact of organizational pattern on human stampede of mass gathering. In order to break the traditional framework of accident causation analysis and solve the problem that traditional causation analysis methods are not detailed, Grounded Theory was used to code the text, and a comprehensive and detailed accident causal set was constructed with 3,186 sentence descriptions, 15 core categories, and 57 sub-factors extracted from 209 human stampede accident texts. With the purpose to further explore the characteristics of risk factors of human stampede in mass gathering activities under different organizational patterns, the organization coefficient is proposed to classify the organizational patterns in clustering results to determine three types of clusters including organized, applied, and spontaneous, which facilitates to carry out the comparative analysis of the differences in risk factors and safety management across various mass gathering activities.
It is found that there are differences in three organizational patterns of clusters in terms of aggregation reasons, layout and risk level through the comparative analysis of human stampede accidents under different organizational patterns. The findings indicate that while there is minimal variation in aggregation causes across the overall sample, these variations becomes significant under different organizational patterns, particularly in education and training activities, religious events, and celebrations Additionally, the research identified noticeable layout differences in activities of different organizational patterns, such as organized clusters occurring more frequently on staircases, while applied and spontaneous clusters mainly took place at entrance and exit. In terms of risk levels, applied type clusters had a higher risk of accidents, resulting in relatively more casualties. Furthermore, the study recognized commonalities present across different organizational patterns, such as triggering behaviors, knowledge, awareness, and management. This research, by exploring the heterogeneous of organization patterns in mass gathering activities, provides valuable theoretical support for enhancing safety management and risk prevention strategies in mass gathering activities. The results emphasize the importance of tailored safety measures based on the specific characteristics of organizational patterns, ultimately supporting the effective management of crowd safety in mass gathering activities.
Data availability statement
The original contributions presented in the study are included in the article/supplementary material, further inquiries can be directed to the corresponding authors.
Author contributions
YL: Project administration, Methodology, Supervision, Writing – original draft, Writing – review & editing. JW: Methodology, Investigation, Writing – original draft, Writing – review & editing. WD: Supervision, Writing – review & editing. BZ: Investigation, Writing – review & editing. XL: Data curation, Writing – review & editing. WH: Validation, Writing – review & editing.
Funding
The author(s) declare that financial support was received for the research and/or publication of this article. This study was supported by General Project of National Natural Science Foundation of China (51874213); Natural Science Foundation of Hubei Province Youth Project (2018CFB186); Hubei Provincial Emergency Management Department Work Safety Special Project (KJZX201907011).
Acknowledgments
The authors would like to thank all participators who voluntarily contributed to this study.
Conflict of interest
The authors declare that the research was conducted in the absence of any commercial or financial relationships that could be construed as a potential conflict of interest.
Generative AI statement
The author(s) declare that no Gen AI was used in the creation of this manuscript.
Publisher’s note
All claims expressed in this article are solely those of the authors and do not necessarily represent those of their affiliated organizations, or those of the publisher, the editors and the reviewers. Any product that may be evaluated in this article, or claim that may be made by its manufacturer, is not guaranteed or endorsed by the publisher.
References
1. Collins, A, and Potoglou, D. Factors influencing visitor travel to festivals: challenges in encouraging sustainable travel. J Sustain Tour. (2019) 27:668–88. doi: 10.1080/09669582.2019.1604718
2. Cheng, H, Liu, Q, and Bi, J-W. Perceived crowding and festival experience: the moderating effect of visitor-to-visitor interaction. Tour Manag Perspect. (2021) 40:100888. doi: 10.1016/j.tmp.2021.100888
3. Oklevik, O, Gössling, S, Hall, CM, Steen Jacobsen, JK, Grøtte, IP, and McCabe, S. Overtourism, optimisation, and destination performance indicators: a case study of activities in fjord Norway. J Sustain Tour. (2019) 27:1804–24. doi: 10.1080/09669582.2018.1533020
4. Quinn, B. Problematising ‘festival tourism’: arts festivals and sustainable development in Ireland. J Sustain Tour. (2006) 14:288–306. doi: 10.1080/09669580608669060
5. Zhang, Y, Jia, W, Chan, JH, and Sciacca, A. The awe-habitual model: exploring tourists’ pro-environmental behaviors in religious settings. J Sustain Tour. (2024) 32:1–20. doi: 10.1080/09669582.2024.2390579
6. Sharma, A, McCloskey, B, Hui, DS, Rambia, A, Zumla, A, Traore, T, et al. Global mass gathering events and deaths due to crowd surge, stampedes, crush and physical injuries - lessons from the Seoul Halloween and other disasters. Travel Med Infect Dis. (2022) 52:102524. doi: 10.1016/j.tmaid.2022.102524
7. Zhou, M, Wang, M, and Zhang, J. How are risks generated, developed and amplified? Case study of the crowd collapse at Shanghai bund on 31 December 2014. Int J Disaster Risk Reduct. (2017) 24:209–15. doi: 10.1016/j.ijdrr.2017.06.013
8. Hu, X, Zhao, H, Bai, Y, and Wu, J. Risk analysis of stampede in sporting venues based on catastrophe theory and Bayesian network. Int J Disaster Risk Reduct. (2022) 78:103111. doi: 10.1016/j.ijdrr.2022.103111
9. Alaska, YA, Aldawas, AD, Aljerian, NA, Memish, ZA, and Suner, S. The impact of crowd control measures on the occurrence of stampedes during mass gatherings: the hajj experience. Travel Med Infect Dis. (2017) 15:67–70. doi: 10.1016/j.tmaid.2016.09.002
10. Ming, NK, Yan, LW, Aditi, M, Saswata, S, Nobhojit, R, BF, M, et al. Comparing two epidemiologic surveillance methods to assess underestimation of human stampedes in India. PLoS Curr. (2013) 5:ecurrents.dis.ab7f298c89854015b74856232c70b62c. doi: 10.1371/currents.dis.ab7f298c89854015b74856232c70b62c
11. Yan, L, Tong, W, Hui, D, and Zongzhi, W. Research and application on risk assessment Dea model of crowd crushing and trampling accidents in Subway stations. Proc Eng. (2012) 43:494–8. doi: 10.1016/j.proeng.2012.08.085
12. Qiquan, W. Research on intelligent early-warning of crowded stampede accidents vulnerable areas in Subway. China Safety Sci J. (2018) 28:162–7. doi: 10.16265/j.cnki.issn1003-3033.2018.11.026
13. Zhang, Y, and Zhou, X. The occurrence Laws of campus stampede accidents in China and its prevention and control measures. Nat Hazards. (2017) 87:659–73. doi: 10.1007/s11069-017-2785-7
14. Shang, L, Chun, L, Xianqin, W, and Dan, C. Causation analysis of stampede accidents on primary and middle school campus based on the Fta-Ahp method. Safety Environ Eng. (2018) 25:139–45. doi: 10.13578/j.cnki.issn.1671-1556.2018.04.024
15. Shuting, W. Research on the current situation and countermeasures of risk assessment for spontaneous crowd gathering in China. J Hubei Univ Police. (2018) 31:86–92.
16. Boyan, Z, and Yuan, H. Responsibility of government public safety Management in Large-Scale Mass Gathering Activities: genealogy and process based on analysis of legal text and stamped incidents. China Dev. (2019) 19:76–82. doi: 10.15885/j.cnki.cn11-4683/z.2019.05.015
17. Yue, S, and Haifeng, C. Formation path and prevention countermeasures of stampedes caused by spontaneous public gatherings based on a framework for the “three-stage chained process” analysis. J China Emerg Manag Sci. (2023) 6:100–11.
18. Guo, X, Niu, L, and Guan, H. The mechanism of crowd stampede based on case statistics through SNA method. Tehnicki Vjesnik. (2021) 28:44. doi: 10.17559/tv-20200626194044
19. Ahmed, QA, and Memish, ZA. From the "madding crowd" to mass gatherings-religion, sport, culture and public health. Travel Med Infect Dis. (2019) 28:91–7. doi: 10.1016/j.tmaid.2018.06.001
20. Illiyas, FT, Mani, SK, Pradeepkumar, AP, and Mohan, K. Human stampedes during religious festivals: a comparative review of mass gathering emergencies in India. Int J Disaster Risk Reduct. (2013) 5:10–8. doi: 10.1016/j.ijdrr.2013.09.003
21. Weng, W, Wang, J, Shen, L, and Song, Y. Review of analyses on crowd-gathering risk and its evaluation methods. J Safety Sci Resilience. (2023) 4:93–107. doi: 10.1016/j.jnlssr.2022.10.004
22. Qingsong, Z, Jinlan, L, and Guomin, Z. Discussion on cause mechanism of crowd crushing and trampling accident in large-scale public places. J Nat Disasters. (2009) 18:81–6.
23. Helbing, D, and Mukerji, P. Crowd disasters as systemic failures: analysis of the love parade disaster. EPJ Data Sci. (2012) 1:40. doi: 10.1140/epjds7
24. Wenjing, P. Risk assessment of crowded stampede accident in large-scale events in urban public places. J Hubei Univ Police. (2020) 33:22–30. doi: 10.19828/j.issn1673-2391.2020.01.003
25. Miao, D, Wang, W, Lv, Y, Liu, L, Yao, K, and Sui, X. Research on the classification and control of human factor characteristics of coal mine accidents based on K-means clustering analysis. Int J Ind Ergon. (2023) 97:103481. doi: 10.1016/j.ergon.2023.103481
26. Santos-Reyes, J, and Olmos-Peña, S. Analysis of the ‘news divine’ stampede disaster. Saf Sci. (2017) 91:11–23. doi: 10.1016/j.ssci.2016.07.014
27. Jooma, Z, Hutchings, J, and Hoagland, H. The development of questions to determine the effectiveness of the incident investigation process for electrical incidents. IEEE Trans Ind Appl. (2015) 51:4245–54. doi: 10.1109/tia.2015.2431645
28. Mao, Y, Fan, Z, Zhao, J, Zhang, Q, and He, W. An emotional contagion based simulation for emergency evacuation peer behavior decision. Simul Model Pract Theory. (2019) 96:101936. doi: 10.1016/j.simpat.2019.101936
29. Koski, A, Kouvonen, A, and Nordquist, H. Preparedness for mass gatherings: planning elements identified through the Delphi process. Int J Disaster Risk Reduct. (2021) 61:102368. doi: 10.1016/j.ijdrr.2021.102368
30. Walker, D, and Myrick, F. Grounded theory: An exploration of process and procedure. Qual Health Res. (2006) 16:547–59. doi: 10.1177/1049732305285972
32. Lan, H, Ma, X, Qiao, W, and Ma, L. On the causation of seafarers’ unsafe acts using grounded theory and association rule. Reliabil Eng Syst Safety. (2022) 223:108498. doi: 10.1016/j.ress.2022.108498
33. Xu, R, Luo, F, Chen, G, Zhou, F, and Abdulahi, EW. Application of HFACS and grounded theory for identifying risk factors of air traffic controllers’ unsafe acts. Int J Ind Ergon. (2021) 86:103228. doi: 10.1016/j.ergon.2021.103228
34. Li, Z, Mao, R, Meng, QF, Hu, X, and Li, HX. Exploring precursors of construction accidents in China: a grounded theory approach. Int J Environ Res Public Health. (2021) 18:410. doi: 10.3390/ijerph18020410
35. Wu, J, Xing, Y, Bai, Y, Hu, X, and Yuan, S. Risk assessment of large-scale winter sports sites in the context of a natural disaster. J Safety Sci Resilience. (2022) 3:263–76. doi: 10.1016/j.jnlssr.2022.03.006
36. Zhang, H, Liu, Y, Xu, Y, Liu, M, and An, P. An improved convolutional network capturing spatial heterogeneity and correlation for crowd flow prediction. Expert Syst Appl. (2023) 220:119702. doi: 10.1016/j.eswa.2023.119702
37. Zeng, L, Gao, J, Wang, Q, and Chang, L. A risk assessment approach for evaluating the impact of toxic contaminants released indoors by considering various emergency ventilation and evacuation strategies. Risk Anal. (2018) 38:2379–99. doi: 10.1111/risa.13132
38. Liu, Y, Zhang, Z, and Mao, Z. Analysis of influencing factors in pre-evacuation time using interpretive structural modeling. Saf Sci. (2020) 128:104785. doi: 10.1016/j.ssci.2020.104785
39. Xinying, W, Leilei, H, Lan, L, Tuo, X, Zhenyuan, L, and Xu'an, H. Diagnosis model of pitting corrosion at bottom of storage tank based on improved K-means and Cnn. J Safety Sci Technol. (2022) 18:196–201. doi: 10.11731/j.issn.1673-193x.2022.08.028
40. Lu, Y, Shi, X, Jiang, X, and Tang, J. Analyzing dynamic risk of stampede in stadium: a quantitative method considering the various status of risk factors in whole process. Int J Disaster Risk Reduct. (2022) 82:103339. doi: 10.1016/j.ijdrr.2022.103339
41. Siyu, S, Ke, X, Di, S, Bei, Z, and Tianrui, L. Risk analysis of stampede accidents in crowded places based on Haddon matrix and ism. Safety Environ Eng. (2019) 26:150–5. doi: 10.13578/j.cnki.issn.1671-1556.2019.05.022
42. Savolainen, PT, Mannering, FL, Dominique, L, and Quddus, MA. The statistical analysis of highway crash-injury severities: a review and assessment of methodological alternatives. Accid Anal Prev. (2011) 43:1666–76. doi: 10.1016/j.aap.2011.03.025
43. Kim, SH. How heterogeneity has been examined in transportation safety analysis: a review of latent class modeling applications. Anal Methods Accid Res. (2023) 40:100292. doi: 10.1016/j.amar.2023.100292
44. Ona, J, López, G, Mujalli, R, and Calvo, FJ. Analysis of traffic accidents on rural highways using latent class clustering and Bayesian networks. Accid Anal Prev. (2013) 51:1–10. doi: 10.1016/j.aap.2012.10.016
45. Lian, L, Song, W, Richard, YKK, Ma, J, and Telesca, L. Long-range dependence and time-clustering behavior in pedestrian movement patterns in stampedes: the love parade case-study. Phys A Statist Mech Appl. (2017) 469:265–74. doi: 10.1016/j.physa.2016.11.048
46. Feng, S, Li, Z, Ci, Y, and Zhang, G. Risk factors affecting fatal bus accident severity: their impact on different types of bus drivers. Accid Anal Prev. (2016) 86:29–39. doi: 10.1016/j.aap.2015.09.025
47. Chen, Q, Huang, H, Li, Y, Lee, J, Long, K, Gu, R, et al. Modeling accident risks in different lane-changing behavioral patterns. Anal Methods Accid Res. (2021) 30:100159. doi: 10.1016/j.amar.2021.100159
48. Bergsten, EL, Kjeldgård, L, Stigson, H, Farrants, K, and Friberg, E. Fall and collision related injuries among pedestrians, sickness absence and associations with accident type and occupation. J Saf Res. (2023) 86:357–63. doi: 10.1016/j.jsr.2023.07.014
49. Pan, X, Zhong, B, Wang, Y, and Shen, L. Identification of accident-injury type and Bodypart factors from construction accident reports: a graph-based deep learning framework. Adv Eng Inform. (2022) 54:101752. doi: 10.1016/j.aei.2022.101752
50. Kang, K, and Ryu, H. Predicting types of occupational accidents at construction sites in Korea using random Forest model. Saf Sci. (2019) 120:226–36. doi: 10.1016/j.ssci.2019.06.034
51. Yang, Z, Zhang, W, and Feng, J. Predicting multiple types of traffic accident severity with explanations: a multi-task deep learning framework. Saf Sci. (2022) 146:105522. doi: 10.1016/j.ssci.2021.105522
52. Depaire, B, Wets, G, and Vanhoof, K. Traffic accident segmentation by means of latent class clustering. Accid Anal Prev. (2008) 40:1257–66. doi: 10.1016/j.aap.2008.01.007
53. Lu, Y, Qiu, L, Lyu, X, and Jiang, X. Human stampede causative factors and cluster risk: a multi-dimensional analysis based on Isodata and fuzzy theory. Int J Disaster Risk Reduct. (2021) 66:102581. doi: 10.1016/j.ijdrr.2021.102581
54. Dunn, JC. A fuzzy relative of the ISO data process and its use in detecting compact well-separated clusters. J Cybern. (1973) 3:32–57. doi: 10.1080/01969727308546046
55. Liangyun, X. Influencing factors in evolution of major group events —a study based on the grounded theory. J Intelligence. (2012) 31:64–9.
56. Liping, Y, Lidong, Q, and Bo, Z. Concepts and evaluation of saturation in qualitative research. Adv Psychol Sci. (2022) 30:511–21. doi: 10.3724/SP.J.1042.2022.00511
57. Turris, SA, Lund, A, and Bowles, RR. An analysis of mass casualty incidents in the setting of mass gatherings and special events. Disaster Med Public Health Prep. (2014) 8:143–9. doi: 10.1017/dmp.2014.24
58. Dirk Helbing, PM. Crowd disasters as systemic failures: analysis of the love parade disaster. EPJ Data Sci. (2012) 1:1–40. doi: 10.2139/ssrn.2191620
59. de Almeida, MM, and von Schreeb, J. Human stampedes: An updated review of current literature. Prehosp Disaster Med. (2019) 34:82–8. doi: 10.1017/S1049023X18001073
60. Liu, S, and Liu, X. Research on density-based K-means clustering algorithm. J Phys : Conference Series. (2021) 2137:012071. doi: 10.1088/1742-6596/2137/1/012071
61. Liu, Q, Zhao, Z, Li, Y-X, and Li, Y. Feature selection based on sensitivity analysis of fuzzy Isodata. Neurocomputing. (2012) 85:29–37. doi: 10.1016/j.neucom.2012.01.005
62. Wen, L, Zhiyong, Y, Dongjun, L, Shihong, Z, and Dexing, Z. Reliability evaluation of Subway operation based on copula time-dependent model. Sci Technol Eng. (2021) 21:2982–8.
63. Balbi, S. Beyond the curse of multidimensionality: high dimensional clustering in test mining. Statist Appl. (2010) 22:53–63.
64. Li, Z, Arcodia, C, Yang, ECL, and Le, TH. Children's learning processes in family travel: a narrative review through a social cognitive Lens. Tourism management. Perspectives. (2024) 54:101320. doi: 10.1016/j.tmp.2024.101320
65. Qiang, Z. Taking the stampede accident in Itaewon, Seoul, South Korea as an example, this paper introduces the risk prevention practices in places where people gather. Lab Prot. (2023) 1:22–4. doi: 10.3969/j.issn.1000-4335.2023.01.006
66. Dong, YH, Liu, F, Liu, YM, Jiang, XR, and Zhao, ZX. Emergency preparedness for mass gatherings: lessons of "12.31" stampede in Shanghai bund. Chin J Traumatol. (2017) 20:240–2. doi: 10.1016/j.cjtee.2016.08.005
67. Rahman, J, Thu, M, Arshad, N, and Van der Putten, M. Mass gatherings and public health: case studies from the hajj to Mecca. Ann Glob Health. (2017) 83:386–93. doi: 10.1016/j.aogh.2016.12.001
68. Yu, S, Kefan, X, and Benbu, L. Rules and causes of crowd stampede accidents based on co-word and social network analysis. Wuhan Univ Technol. (2019) 32:29–38.
Keywords: mass gathering, organizational pattern, spontaneous gathering, risk factors, unsupervised clustering algorithms
Citation: Lu Y, Wang J, Dai W, Zou B, Lu X and Hong W (2025) Research on risk factors of human stampede in mass gathering activities considering organizational patterns. Front. Public Health. 13:1555735. doi: 10.3389/fpubh.2025.1555735
Edited by:
Jaime Santos-Reyes, National Polytechnic Institute (IPN), MexicoReviewed by:
Weiguo Song, University of Science and Technology of China, ChinaPei-Chun Shao, Ming Chuan University, Taiwan
Copyright © 2025 Lu, Wang, Dai, Zou, Lu and Hong. This is an open-access article distributed under the terms of the Creative Commons Attribution License (CC BY). The use, distribution or reproduction in other forums is permitted, provided the original author(s) and the copyright owner(s) are credited and that the original publication in this journal is cited, in accordance with accepted academic practice. No use, distribution or reproduction is permitted which does not comply with these terms.
*Correspondence: Ying Lu, bHV5aW5nQHd1c3QuZWR1LmNu; Weihui Dai, d2hkYWlAZnVkYW4uZWR1LmNu