
94% of researchers rate our articles as excellent or good
Learn more about the work of our research integrity team to safeguard the quality of each article we publish.
Find out more
ORIGINAL RESEARCH article
Front. Public Health, 12 March 2025
Sec. Digital Public Health
Volume 13 - 2025 | https://doi.org/10.3389/fpubh.2025.1544894
This article is part of the Research TopicDiagnosing and Treating Frailty and Sarcopenia in Middle-aged and Older AdultsView all 7 articles
 Jinsong Du1,2†
 Xinru Tao1†Le Zhu1Heming Wang3Wenhao Qi4Xiaoqiang Min2,5Shujie Wei6Xiaoyan Zhang7Qiang Liu8*
Introduction: The older adult are at high risk of sarcopenia, making early identification and scientific intervention crucial for healthy aging.
Methods: This study utilized data from the China Health and Retirement Longitudinal Study (CHARLS), including a cohort of 2,717 middle-aged and older adult participants. Ten machine learning algorithms, such as CatBoost, XGBoost, and NGBoost, were used to construct predictive models.
Results: Among these algorithms, the XGBoost model performed the best, with an ROC-AUC of 0.7, and was selected as the final predictive model for sarcopenia risk. SHAP technology was used to visualize the prediction results, enhancing the interpretability of the model, and the system was built on a web platform.
Discussion: The system provides the probability of sarcopenia onset within 4 years based on input variables and identifies critical influencing factors. This facilitates understanding and use by medical professionals. The system supports early identification and scientific intervention for sarcopenia in the older adult, offering significant clinical value and application potential.
Sarcopenia has become an important health concern for the older adult, characterized by reduced muscle mass, decreased muscle strength, and gradual physical function decline (1, 2). This degenerative condition severely limits mobility, increases the risk of falls and fractures, and may lead to a decline in quality of life and higher mortality rates (3). In China, with the rapid aging process, the prevalence of sarcopenia remains high, imposing significant burdens on healthcare systems and family care (4). Identifying high-risk individuals promptly and adopting scientific interventions, such as increased protein intake and enhanced physical activity, can help maintain healthy muscle conditions and reduce the risk of sarcopenia (5, 6).
With the rapid development of big data and artificial intelligence, machine learning models based on health data have shown great potential in disease risk assessment (7, 8). These models can mine underlying patterns from large datasets, accurately identify high-risk populations, and analyze critical risk factors for diseases. For instance, Dong et al. developed a predictive model for diabetic nephropathy within 3 years among type 2 diabetes patients based on electronic health records, revealing that high homocysteine levels and poor blood glucose control were significant risk factors (9). Similarly, Wang et al. used six machine learning algorithms to predict all-cause mortality within 3 years for heart failure patients with coronary artery disease, identifying age, occupation, and nitrate use as key factors (10).
However, despite the significant achievements of machine learning in disease risk prediction, research on predicting sarcopenia in the older adult remains in its infancy. Most existing studies are based on cross-sectional data (11–13), limiting their ability to capture the dynamic process and time-dependent risk factors of sarcopenia development. Additionally, current studies primarily focus on model construction without in-depth analysis of the importance of risk indicators or features. The lack of interpretation hinders the comprehensive understanding of key influencing factors. Moreover, these studies have yet to translate their findings into practical tools, such as web-based or application-based sarcopenia assessment platforms, limiting their application in clinical practice and health management.
To address these gaps, this study utilized data from the 2011 and 2015 CHARLS databases to develop a visualized sarcopenia risk assessment system for the older adult. Various machine learning algorithms, including LightGBM, XGBoost, and AdaBoost, were employed to construct the models, with the best-performing model selected for predicting sarcopenia risk within 4 years. To enhance model interpretability, Shapley Additive Explanations (SHAP) were introduced to visualize the contribution of each feature to the prediction, increasing transparency and credibility. Finally, to further enhance the practical application value of this study, the trained model was deployed on a web platform, creating a risk prediction system for sarcopenia in older adults. This system enables medical professionals to quickly identify high-risk individuals and implement personalized prevention and intervention strategies effectively.
This study initially included 17,708 participants. After excluding 14,991 participants based on exclusion criteria, 2,717 participants remained (Figure 1). Among them, 1,397 were male (51.42%), and 1,320 were female (48.58%), with an average age of 66.25 ± 5.37 years (Supplementary Table S1). After a 4-year follow-up, 222 participants were diagnosed with sarcopenia in 2015, yielding a prevalence of 8.17%.
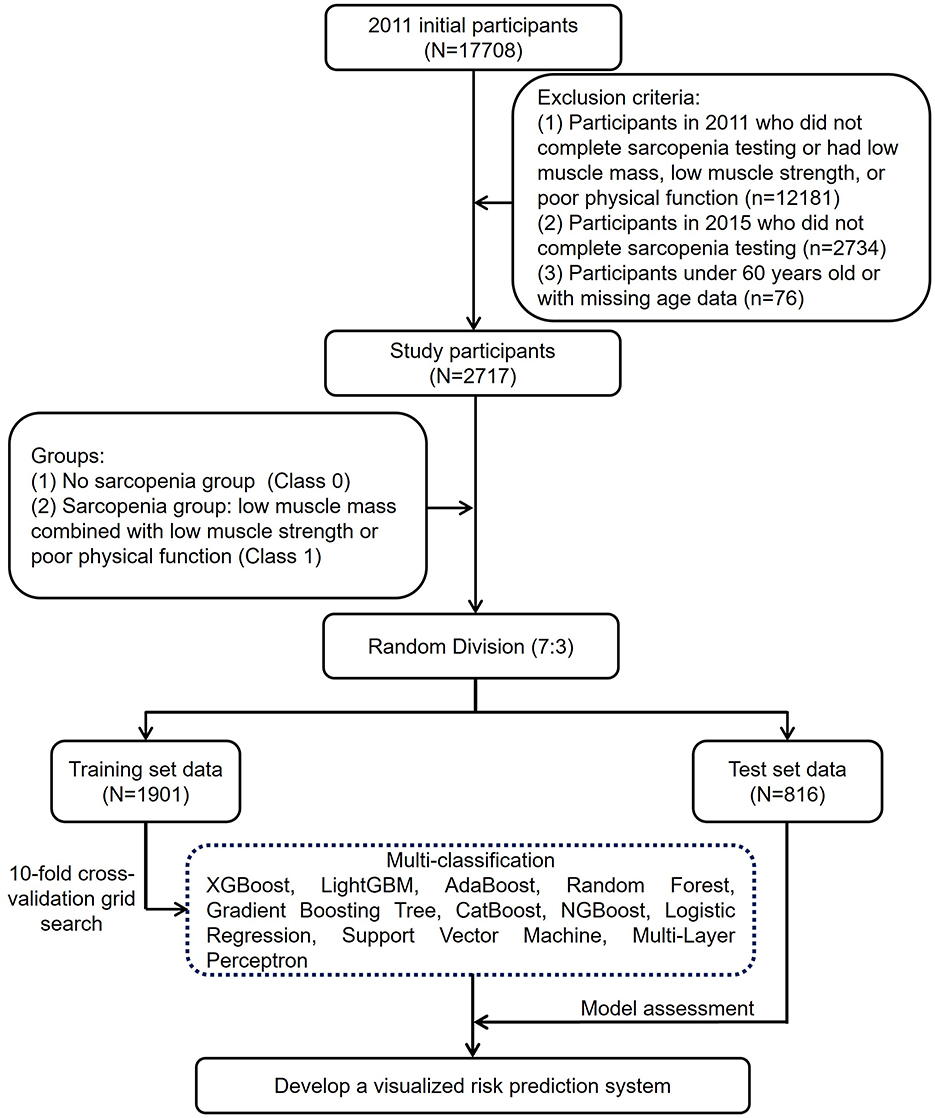
Figure 1. A flowchart describing the general framework of the study.
In this study, we built older adult sarcopenia risk assessment models using 10 algorithms, including XGBoost (XGB), LightGBM (LGBM), AdaBoost (ADA), Random Forest (RF), Gradient Boosting Trees (GBT), CatBoost (CB), NGBoost (NGB), Logistic Regression (LR), Multi-Layer Perceptron (MLP), and Support Vector Machine (SVM). We used accuracy, precision, F1-score, and the area under the receiver operating characteristic curve (ROC-AUC) as evaluation metrics. As shown in Figure 2, the models constructed using XGB, RF, and GBT algorithms showed higher ROC-AUC, possibly because these algorithms enhance model generalization through ensemble learning methods, while also demonstrating strong robustness and interpretability (14). Additionally, the XGB model outperformed other models in terms of F1-score (Supplementary Table S2), and with a ROC-AUC of 0.7, demonstrated significant performance advantages (Supplementary Table S3). This success is due to its highly optimized gradient boosting framework and flexible regularization mechanisms, which effectively mitigate overfitting and enhance the model's ability to capture complex data patterns (15). Based on the above results, the XGB model demonstrated high classification stability and reliability. Therefore, we ultimately selected the model built using the XGB algorithm as the older adult sarcopenia risk prediction model (Supplementary Code S1).
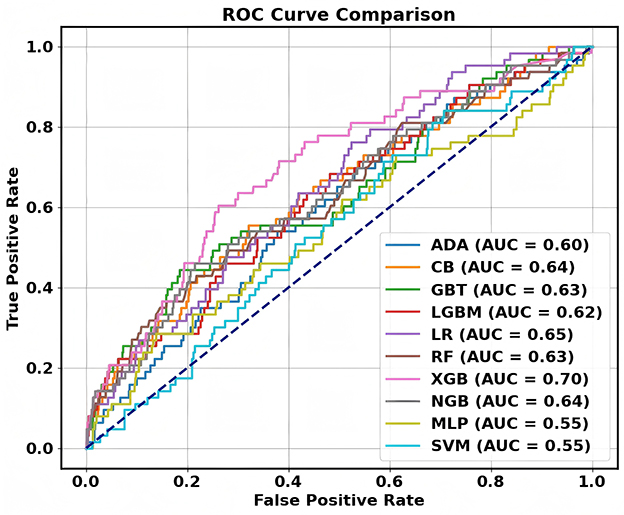
Figure 2. ROC curves for different machine learning models.
We analyzed the sensitivity of the ROC curve for the XGB model across different gender subgroups using the Hanley-McNeil test (Supplementary Figure S1 and Supplementary Code S2). The results showed (Supplementary Table S4) that the differences in ROC-AUC between the Overall Data, Male Subgroup, and Female Subgroup were not statistically significant. This indicates that the XGB model performs consistently across different gender subgroups. We further evaluated the classification performance of the XGB model using the confusion matrix (Supplementary Figure S2). Among the 753 participants who did not develop sarcopenia after 4 years, 73.84% were correctly classified; among the 63 participants who developed sarcopenia, 60.32% were correctly classified. This demonstrates that the XGB model has some sensitivity in predicting whether individuals will develop sarcopenia in the future.
SHAP plots are intuitive tools for interpreting machine learning model outputs, measuring each feature's contribution to predictions (16, 17). SHAP values indicate the direction and magnitude of a feature's influence on predictions: positive values indicate a positive impact, while negative values indicate a negative effect. In the SHAP plot, features are ranked by importance on the vertical axis, and their specific effects on model output are shown on the horizontal axis. Each point represents a sample, with color indicating feature values (red for high values and blue for low values), providing a clear visualization of the relationship between features and prediction outcomes.
In the overall feature importance plot for sarcopenia (Figure 3), the household predictor “Does your residence have running water?” (F3) had the most significant impact, indicating a negative correlation between access to running water and future sarcopenia risk. Demographic predictors such as “Marital Status” (D2) and “Number of living children” (D5), and health predictors like “Have you lost all of your teeth?” (H47) and “The maximum value of the breathing test” (H24), also showed high importance. Participants with the following characteristics were at higher risk of developing sarcopenia: tooth loss (H47), poor self-rated health (H1), low breathing test values (H24), smoking (F2), lower systolic blood pressure (H21), and asthma (H14). These findings highlight the predictive value of living conditions, health status, and behavioral habits, providing a reference for targeted interventions and preventive strategies.
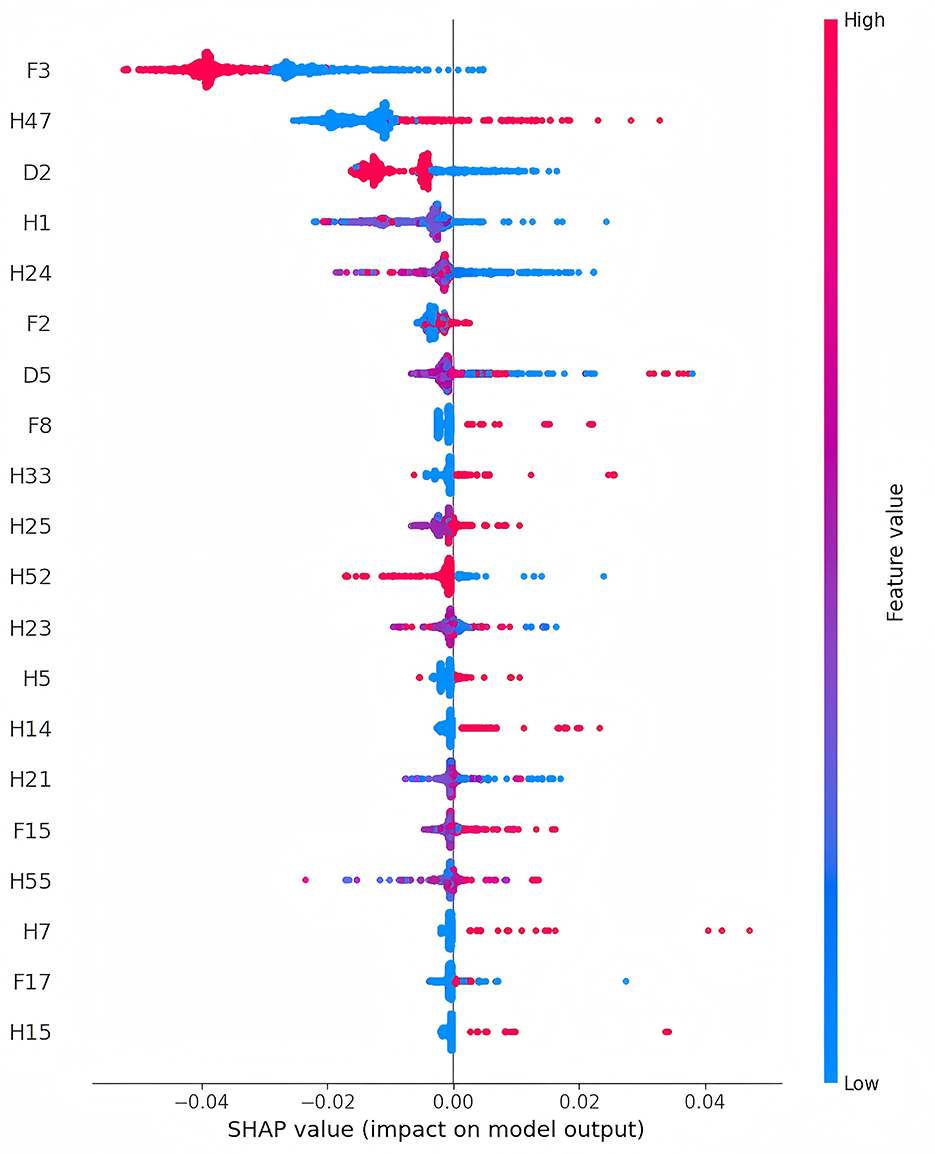
Figure 3. Feature importance charts for sarcopenia in older adults (The detailed description of the features can be found in Supplementary Table S1).
The visualized prediction system consists of an information input area on the left and a results display area on the right (Figure 4), shows that the input information is consistent with the features used in the training model (Supplementary Table S1). For continuous variables, input can be adjusted using sliders, while categorical variables (e.g., gender) can be selected by clicking. The right side of the interface is divided into two parts: the upper section displays the predicted sarcopenia status after 4 years, while the lower section provides a personalized analysis report to guide precise intervention strategies.
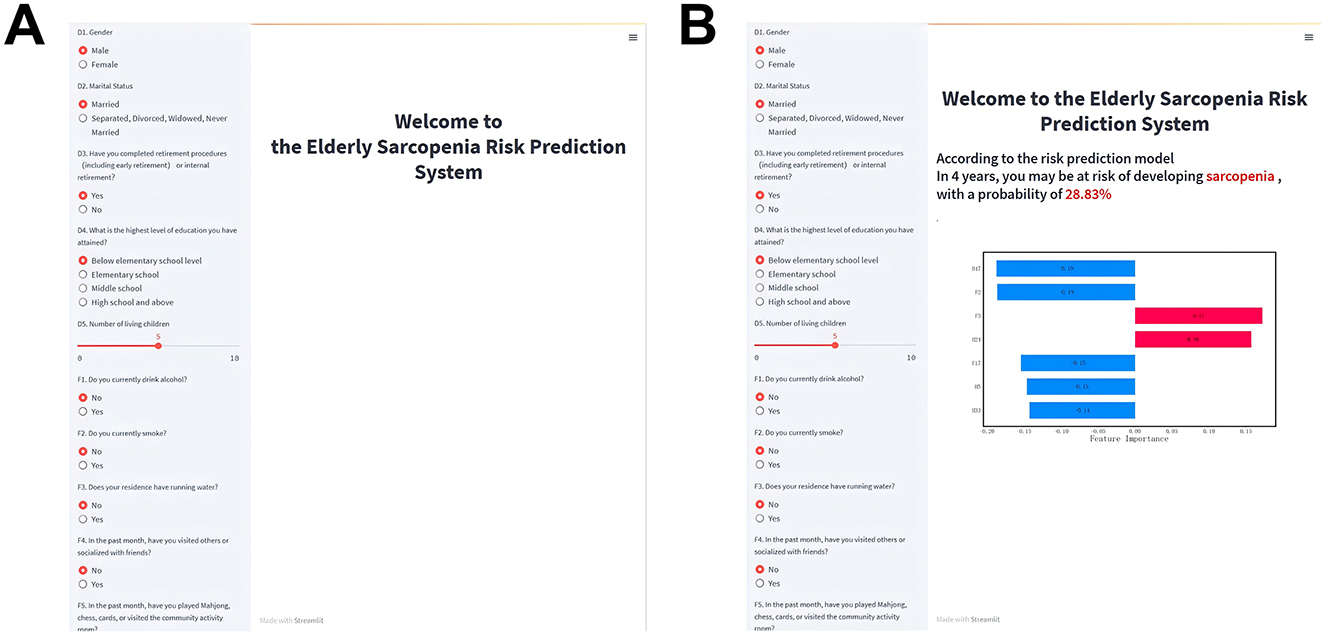
Figure 4. Visualized risk prediction system for older adults. (A) System homepage; (B) Information output page.
An example application of the prediction system is shown in Figure 4B. After entering relevant information on the left, the system predicts a 28.83% probability of developing sarcopenia within 4 years. Below, the SHAP plot visualizes how each feature influences the prediction. The length of the bars reflects the strength of the effect: red bars indicate positive influences, and blue bars indicate negative influences. Features positively associated with the prediction include F3 and H24, while H47, F2, F17, H5, and H33 had negative impacts. Based on this analysis, preventive measures such as installing running water facilities and improving maximum breathing values could reduce the user's future sarcopenia risk.
This study successfully developed a sarcopenia risk prediction system for the older adult based on the CHARLS database using multiple machine learning algorithms. The system not only identifies high-risk individuals but also enhances usability and user experience through a visualized web interface, providing intuitive decision support for medical professionals.
Unlike previous studies that primarily relied on cross-sectional data (11–13), this study employed longitudinal data to conduct a cohort analysis of sarcopenia risk in the older adult. Cross-sectional studies often capture sarcopenia-related features at a single time point, limiting their ability to reflect dynamic changes and time-dependent risk factors during the disease progression. This limitation can lead to an incomplete understanding of the critical stages in sarcopenia development, reducing the accuracy and clinical applicability of predictive models. In contrast, longitudinal data enable the observation of individual characteristic trends over time, capturing dynamic processes and time-dependent risk factors, thus improving the predictive accuracy and clinical relevance of the model.
After comparing the performance of the models, the XGB model performed the best. In building the risk prediction model using the XGB algorithm, we employed the KNN algorithm for missing value imputation and used the SMOTE algorithm to address class imbalance. Although these methods may introduce some bias, the KNN algorithm, through its imputation strategy based on data similarity, better preserves the original structure and distribution of the data. Moreover, the SMOTE algorithm effectively alleviates class imbalance by generating synthetic samples, thereby improving the model's ability to recognize the minority class (18). To validate the effectiveness of these methods, we compared the performance of models under different preprocessing strategies. The experimental results showed that the model built using KNN imputation and SMOTE for data balancing had a significantly higher ROC-AUC than models using mean imputation, mode imputation, or no data balancing (Supplementary Figure S3). This result supports the rationale for choosing KNN and SMOTE during the preprocessing stage.
We selected the optimal F1-score threshold for prediction probability (Supplementary Code S3). This threshold selection method maximizes the F1-score, balancing the model's precision and recall. Clinically, the optimal F1-score threshold helps improve the diagnostic accuracy of sarcopenia while minimizing false positives and false negatives. According to the confusion matrix analysis of the XGB model (Supplementary Figure S2), among the 753 participants who did not develop sarcopenia after 4 years, the model correctly classified 73.84% of individuals, with a low false-positive rate, indicating that the model effectively avoids misclassifying healthy individuals as diseased, thus reducing unnecessary medical tests and treatment costs. However, among the 63 participants who developed sarcopenia after 4 years, the model correctly classified only 60.32%, with a relatively high false-negative rate. This may result in some patients who require treatment not being identified in time, missing the best opportunity for early intervention, potentially leading to worsening conditions and increasing the complexity and cost of subsequent treatments.
To enhance model interpretability, SHAP technology was used for visual explanations. Traditional machine learning models are often considered “black boxes” (19–21), with their decision-making processes and feature contributions remaining opaque. SHAP assigns contribution values to features, clarifying their roles in predictions. Analysis of SHAP values in this study revealed that features such as living conditions, health status, and behavioral habits significantly influenced the model's predictions. Among these, “Does your residence have running water?” (F3) had the most substantial impact, showing a negative correlation with sarcopenia risk. While no direct association between access to running water and sarcopenia risk has been established in existing studies, it is hypothesized that water, as an essential nutrient, plays a crucial role in overall health (22–24). This finding underscores the importance of improving infrastructure for promoting healthy aging and offers insights for public health policy. Additionally, “Have you lost all of your teeth?” (H47) was the second most influential feature in the model, suggesting that tooth loss is a significant indicator of sarcopenia risk. This aligns with studies such as Kusama et al. (25), which linked tooth loss to reduced protein intake, and Azzolino et al. (26), which found that poor oral health can influence food choices and nutritional intake, leading to frailty and sarcopenia. Other important predictive factors include lower breathing test values (H24) and smoking (F2). Research by Rahimi et al. (27) demonstrated that improved respiratory function significantly enhances muscle strength in older adult women, while Rom et al. (28) reported that smoking accelerates skeletal muscle loss through inflammation and oxidative stress. Consistent with the SHAP analysis results from the overall data, in different gender subgroups (Supplementary Figures S4 and S5), tap water (F3) and breathing test values (H24) have significant effects on the likelihood of sarcopenia in both men and women. However, the impact of alcohol consumption (F1) is greater for men, and marital status (D2) has a stronger influence on women regarding the risk of sarcopenia. These findings not only validate the model's predictions but also reveal potential mechanisms influencing sarcopenia. The developed system integrates the prediction model into a web platform, enabling users to input individual characteristics and generate personalized risk assessment reports based on SHAP analysis. This enhances accessibility and provides an intuitive understanding of the results.
However, the study has several limitations. First, the data were derived exclusively from Chinese older adult populations, potentially limiting its generalizability across different cultural or ethnic groups. Second, the model did not include certain potentially critical variables, such as genetic information, long-term exercise habits, and detailed dietary patterns, which may affect prediction accuracy. Additionally, although this study is based on longitudinal data from CHARLS, the temporal changes of predictive factors (such as the dynamic changes in health behaviors) were not adequately considered during model development, which may affect the long-term predictive ability of the model. Lastly, while SHAP technology elucidates the contributions of various features, the specific mechanisms linking certain features to sarcopenia remain underexplored. Future research should expand data sources, incorporate key variables such as genetic information, and optimize model performance. Experimental studies are also needed to further investigate the mechanisms between features and sarcopenia, providing scientific evidence for clinical interventions.
This study successfully developed a sarcopenia risk prediction model for the older adult based on the CHARLS database, enhancing its interpretability through SHAP technology and building a visualized web platform to make prediction results more accessible and applicable. The findings highlight the significant role of factors such as living conditions, dental health, and respiratory function in predicting sarcopenia risk, providing a foundation for policy development and clinical decision-making. However, the study has limitations, including the restricted data scope. Future efforts should aim to expand the sample range and integrate key variables to further optimize the model, offering more comprehensive support for precise sarcopenia prediction and promoting healthy aging.
This study utilized data from the China Health and Retirement Longitudinal Study (CHARLS), a multidisciplinary nationwide survey led by the National School of Development at Peking University. CHARLS covers 28 provinces, 150 counties, and 450 communities (villages) in China, involving ~10,000 households (29, 30). High-quality longitudinal data were collected through in-home visits from individuals aged 45 years and older. The study was approved by the Peking University Institutional Review Board (IRB00001052-11015), and all participants provided informed consent prior to participation. Ethical standards were strictly adhered to, ensuring transparency and integrity throughout the research process. As shown in Figure 1, the study sample was derived from the first (2011) and third (2015) waves of CHARLS. A total of 2,717 eligible participants were included in the final analysis after applying the following exclusion criteria: (1) Participants in 2011 who did not complete sarcopenia testing or had low muscle mass, low muscle strength, or poor physical function; (2) Participants in 2015 who did not complete sarcopenia testing; (3) Participants under 60 years old or with missing age data.
Sarcopenia was assessed based on the Asian Working Group for Sarcopenia (AWGS 2019) criteria, encompassing three components: muscle strength, appendicular skeletal muscle mass (ASM), and physical function (31). Muscle strength was evaluated by measuring handgrip strength using a Yuejian™ WL-1000 hand dynamometer (Nantong Yuejian Measuring Instruments Co., Ltd., Nantong, China). Participants were instructed to squeeze the dynamometer with maximum effort, and two measurements were taken for both the dominant and non-dominant hands. The maximum grip strength was recorded, and the average was used. According to AWGS 2019, the thresholds for low grip strength are < 28 kg for men and < 18 kg for women. ASM was estimated using a validated body composition formula (Supplementary Equation S1), which has been shown to correlate strongly with dual-energy X-ray absorptiometry (DXA) results (32, 33). ASM adjusted for height squared (ASM/Ht2) was calculated by dividing ASM by the square of height in meters. Low muscle mass was defined as the lowest 20th percentile of height-adjusted muscle mass in the study population: ASM/Ht2 < 4.90 kg/m2 for women and < 6.79 kg/m2 for men. Physical function was assessed by gait speed, measured as the time taken to walk 2.5 m back and forth at a normal pace. Low physical function was defined as gait speed < 1.0 m/s based on AWGS 2019 recommendations. Participants were classified into two groups: non-sarcopenia and sarcopenia, with the latter defined as low muscle mass combined with either low muscle strength or low physical function. This study included 78 feature variables (Supplementary Table S1), with missing data rates below 10% for all variables. Given the strong correlation between age and muscle mass, the remaining 77 features were used as predictors, encompassing three categories: demographics, family lifestyle, and health status. Demographic variables included five features (excluding age), such as sex and marital status; family lifestyle included 17 variables, such as current smoking and alcohol consumption; and health status included 55 variables, such as self-rated health and bodily pain.
A visualized risk assessment system for sarcopenia in older adults was developed using Python 3.11. The dataset was randomly split into training and testing sets at a 7:3 ratio. Missing data were imputed using the K-Nearest Neighbors (KNN) algorithm, and the Synthetic Minority Oversampling Technique (SMOTE) was employed on the training set to address class imbalance (18). We selected the optimal hyperparameters through 10-fold cross-validation with grid search and constructed XGB, LGBM, ADA, RF, GBT, CB, NGB, LR, MLP, and SVM models. Optimal hyperparameters were determined through grid search with 10-fold cross-validation. Eight models—XGB, LGBM, ADA, RF, GBT, CB, NGB, and LR—were constructed, with performance metrics including accuracy, precision, F1-score, and area under the ROC curve. The model with the best performance was selected as the sarcopenia risk assessment model. Feature importance indices were calculated using SHapley Additive exPlanations (SHAP), and an online risk assessment system was developed. Additionally, to validate the effect of data processing, we also applied mean imputation, mode imputation, and no data balancing strategies, using the best model construction algorithms.
Publicly available datasets were analyzed in this study. This data can be found here: https://charls.charlsdata.com/pages/data/111/zh-cn.html.
The studies involving humans were approved by Peking University Institutional Review Board (IRB00001052-11015). The studies were conducted in accordance with the local legislation and institutional requirements. Written informed consent for participation was not required from the participants or the participants' legal guardians/next of kin in accordance with the national legislation and institutional requirements.
JD: Conceptualization, Methodology, Resources, Writing – review & editing, Writing – original draft. XT: Data curation, Writing – original draft, Writing – review & editing. LZ: Data curation, Writing – review & editing. HW: Methodology, Writing – review & editing. WQ: Methodology, Writing – review & editing. XM: Data curation, Writing – review & editing. SW: Validation, Writing – review & editing. XZ: Validation, Writing – review & editing. QL: Resources, Writing – original draft, Writing – review & editing.
The author(s) declare that financial support was received for the research and/or publication of this article. This research was supported by the Industry-Academia Cooperation for Synergistic Education Project (No. 2410141228), the Horizontal Project of Zaozhuang University (No. HX20240266), the 2024 Zaozhuang University Teaching Reform Project, with funding awarded to JD.
The authors declare that the research was conducted in the absence of any commercial or financial relationships that could be construed as a potential conflict of interest.
The author(s) declare that no Gen AI was used in the creation of this manuscript.
All claims expressed in this article are solely those of the authors and do not necessarily represent those of their affiliated organizations, or those of the publisher, the editors and the reviewers. Any product that may be evaluated in this article, or claim that may be made by its manufacturer, is not guaranteed or endorsed by the publisher.
The Supplementary Material for this article can be found online at: https://www.frontiersin.org/articles/10.3389/fpubh.2025.1544894/full#supplementary-material
1. Petermann-Rocha F, Balntzi V, Gray SR, Lara J, Ho FK, Pell JP, et al. Global prevalence of sarcopenia and severe sarcopenia: a systematic review and meta-analysis. J Cachexia Sarcopenia Muscle. (2022) 13:86–99. doi: 10.1002/jcsm.12783
2. Keller K. Sarcopenia. Wiener Medizinische Wochenschrift. (2019) 169:157–72. doi: 10.1007/s10354-018-0618-2
3. Chen LK, Lee WJ, Peng LN, Liu LK, Arai H, Akishita M, et al. Recent advances in sarcopenia research in Asia: 2016 update from the Asian Working Group for Sarcopenia. J Am Med Directors Assoc. (2016) 17:767–e1. doi: 10.1016/j.jamda.2016.05.016
4. Qiu WD, Cai AP Li LW, Feng YQ. Trend in prevalence, associated risk factors, and longitudinal outcomes of sarcopenia in China: a national cohort study. J Intern Med. (2024) 296:156–67. doi: 10.1111/joim.13808
5. Lim ST, Kang S. Exercise therapy for sarcopenia and diabetes. World J Diabetes. (2023) 14:565–72. doi: 10.4239/wjd.v14.i5.565
6. Zhu XX, Wang J, Lu YJ, Zhao YC, Zhang N, Wu W, et al. Potential of food protein-derived bioactive peptides against sarcopenia: a comprehensive review. J Agric Food Chem. (2023) 71:5419–37. doi: 10.1021/acs.jafc.3c06882
7. Du JS, Yang SJ, Zeng YJ, Ye CH, Chang X, Wu S. Visualization obesity risk prediction system based on machine learning. Sci Rep. (2024) 14:22424. doi: 10.1038/s41598-024-73826-6
8. Du JS, Chang X, Ye CH, Zeng YJ, Yang SJ, Wu S, Li L. Developing a hypertension visualization risk prediction system utilizing machine learning and health check-up data. Sci Rep. (2023) 13:18953. doi: 10.1038/s41598-023-46281-y
9. Dong Z, Wang Q, Ke Y, Zhang W, Hong Q, Liu C, et al. Prediction of 3-year risk of diabetic kidney disease using machine learning based on electronic medical records. J Transl Med. (2022) 20:143. doi: 10.1186/s12967-022-03339-1
10. Wang K, Tian J, Zheng C, Yang H, Ren J, Liu Y, Han Q, Zhang Y. Interpretable prediction of 3-year all-cause mortality in patients with heart failure caused by coronary heart disease based on machine learning. Comput Biol Med. (2021) 137:104813. doi: 10.1016/j.compbiomed.2021.104813
11. Luo X, Ding HR, Broyles A, Warden SJ, Moorthi RN, Imel EA. Using machine learning to detect sarcopenia from electronic health records. Digital Health. (2023) 9:20552076231197098. doi: 10.1177/20552076231197098
12. Lee J, Yoon Y, Kim J, Kim YH. Metaheuristic-based feature selection methods for diagnosing sarcopenia with machine learning algorithms. Biomimetics. (2024) 9:179. doi: 10.3390/biomimetics9030179
13. Ko JB, Kim KB, Shin YS, Han H, Han SK, Jung DY, et al. Predicting sarcopenia of female elderly from physical activity performance measurement using machine learning classifiers. Clin Interv Aging. (2021) 16:1723–33. doi: 10.2147/CIA.S323761
14. Dong X, Yu Z, Cao W, Shi Y, Ma Q. A survey on ensemble learning. Front Comput Sci. (2020) 14:241–58. doi: 10.1007/s11704-019-8208-z
15. Bentejac C, Csorgo A, Martinez-Munoz G. A comparative analysis of gradient boosting algorithms. Artif Intell Rev. (2021) 54:1937–67. doi: 10.1007/s10462-020-09896-5
16. Nordin N, Zainol Z, Noor MHM, Chan LF. An explainable predictive model for suicide attempt risk using an ensemble learning and Shapley Additive Explanations (SHAP) approach. Asian J Psychiatr. (2023) 79:103316. doi: 10.1016/j.ajp.2022.103316
17. Nohara Y, Matsumoto K, Soejima H, Nakashima N. Explanation of machine learning models using shapley additive explanation and application for real data in hospital. Comput Methods Programs Biomed. (2022) 2022:214. doi: 10.1016/j.cmpb.2021.106584
18. Chawla NV, Bowyer KW, Hall LO, Kegelmeyer WP, SMOTE. synthetic minority over-sampling technique. J Artif Intell Res. (2002) 16:321–57. doi: 10.1613/jair.953
19. Chen T, Guestrin C. “Xgboost: A scalable tree boosting system,” in Proceedings of the 22nd Acm Sigkdd International Conference on Knowledge Discovery and Data Mining. (2016). 785–794 p.
20. Linardatos P, Papastefanopoulos V, Kotsiantis S. Explainable AI: a review of machine learning interpretability methods. Entropy. (2021) 23:18. doi: 10.3390/e23010018
21. Adadi A, Berrada M. Peeking inside the black-box: a survey on Explainable Artificial Intelligence (XAI). IEEE Access. (2018) 6:52138–60. doi: 10.1109/ACCESS.2018.2870052
22. Ngure FM, Reid BM, Humphrey JH, Mbuya MN, Pelto G, Stoltzfus RJ. “Water, sanitation, and hygiene (WASH), environmental enteropathy, nutrition, and early child development: making the links,” in Conference on Every Child's Potential - Integrating Nutrition, Health, and Psychosocial Interventions to Promote Early Childhood Development. (2014). 118–128 p.
23. Miller JD, Workman CL, Panchang SV, Sneegas G, Adams EA, Young SL, et al. Water security and nutrition: current knowledge and research opportunities. Adv Nutr. (2021) 12:2525–39. doi: 10.1093/advances/nmab075
24. Mabhaudhi T, Chibarabada T, Modi A. Water-food-nutrition-health nexus: linking water to improving food, nutrition and health in Sub-Saharan Africa. Int J Environ Res Public Health. (2016) 13:107. doi: 10.3390/ijerph13010107
25. Kusama T, Takeuchi K, Kiuchi S, Aida J, Hikichi H, Sasaki S, et al. Dental prosthesis use is associated with higher protein intake among older adults with tooth loss. J Oral Rehabil. (2023) 50:1229–38. doi: 10.1111/joor.13554
26. Azzolino D, Passarelli PC, De Angelis P, Piccirillo GB, D'Addona A, Cesari M. Poor oral health as a determinant of malnutrition and sarcopenia. Nutrients. (2019) 11:2898. doi: 10.3390/nu11122898
27. Rahimi FM, Sohrabi M, Kakhki AS, Rahimi NM. Six weeks to wellness: the role of breathing exercises based on motor development pattern in improving fitness and quality of life in overweight elderly women. Biol Res Nurs. (2024) 2024:10998004241297403. doi: 10.1177/10998004241297403
28. Rom O, Kaisari S, Aizenbud D, Reznick AZ. Identification of possible cigarette smoke constituents responsible for muscle catabolism. J Muscle Res Cell Motil. (2012) 33:199–208. doi: 10.1007/s10974-012-9299-4
29. Zhao Y, Hu Y, Smith JP, Strauss J, Yang G. Cohort profile: the China health and retirement longitudinal study (CHARLS). Int J Epidemiol. (2014) 43:61–8. doi: 10.1093/ije/dys203
30. Chen X, Wang Y, Strauss J, Zhao Y. China Health and Retirement Longitudinal Study (CHARLS). (2022). Cham: Springer International Publishing. p. 948–56.
31. Chen LK, Woo J, Assantachai P, Auyeung TW, Chou MY, Iijima K, et al. Asian Working Group for Sarcopenia: 2019 consensus update on sarcopenia diagnosis and treatment. J Am Med Direct Assoc. (2020) 21:300. doi: 10.1016/j.jamda.2019.12.012
32. Hu Y, Peng W, Ren R, Wang Y, Wang G. Sarcopenia and mild cognitive impairment among elderly adults: the first longitudinal evidence from CHARLS. J Cachexia Sarcopenia Muscle. (2022) 13:2944–52. doi: 10.1002/jcsm.13081
Keywords: sarcopenia, risk prediction, visualized, machine learning, CHARLS
Citation: Du J, Tao X, Zhu L, Wang H, Qi W, Min X, Wei S, Zhang X and Liu Q (2025) Development of a visualized risk prediction system for sarcopenia in older adults using machine learning: a cohort study based on CHARLS. Front. Public Health 13:1544894. doi: 10.3389/fpubh.2025.1544894
Received: 13 December 2024; Accepted: 24 February 2025;
Published: 12 March 2025.
Edited by:
Diogo Luís Marques, University of Beira Interior, PortugalReviewed by:
Chang Won Jeong, Wonkwang University, Republic of KoreaCopyright © 2025 Du, Tao, Zhu, Wang, Qi, Min, Wei, Zhang and Liu. This is an open-access article distributed under the terms of the Creative Commons Attribution License (CC BY). The use, distribution or reproduction in other forums is permitted, provided the original author(s) and the copyright owner(s) are credited and that the original publication in this journal is cited, in accordance with accepted academic practice. No use, distribution or reproduction is permitted which does not comply with these terms.
*Correspondence: Qiang Liu, bGl1cWlhbmcxNjY2OTk5QDE2My5jb20=
†These authors have contributed equally to this work and share first authorship
Disclaimer: All claims expressed in this article are solely those of the authors and do not necessarily represent those of their affiliated organizations, or those of the publisher, the editors and the reviewers. Any product that may be evaluated in this article or claim that may be made by its manufacturer is not guaranteed or endorsed by the publisher.
Research integrity at Frontiers
Learn more about the work of our research integrity team to safeguard the quality of each article we publish.