- 1College of Medical Engineering and Technology, Xinjiang Medical University, Urumqi, Xinjiang, China
- 2Institute of Medical Engineering Interdisciplinary Research, Xinjiang Medical University, Urumqi, Xinjiang, China
- 3School of Public Health, Xinjiang Medical University, Urumqi, Xinjiang, China
- 4Xinjiang Uygur Autonomous Region Center for Disease Control and Prevention, Urumqi, Xinjiang, China
Background: Aerosols can affect human health through mechanisms like inflammation, oxidative stress, immune dysregulation, and respiratory impairment. In high-pollution areas, airborne particles may promote the transmission of pathogens such as Mycobacterium tuberculosis. This study investigates the spatiotemporal distribution of tuberculosis, its association with air pollution, and potential sources in the geographically unique Kashgar region of Xinjiang, encircled by mountains and desert.
Methods: Kriging interpolation and time series observation were used to analyze spatiotemporal trends and identify hot and cold spots of tuberculosis (TB) incidence and air quality in Xinjiang from 2011 to 2023. Kruskal-Wallis and multiple comparisons were applied to assess regional differences. Meteorological clustering and trajectory analysis identified pollutant pathways and potential source areas, with hypotheses proposed for TB transmission routes.
Results: The interaction between tuberculosis, the geographic environment, and aerosols in Xinjiang reveals a consistent spatial distribution of air quality index (AQI) and TB incidence, with overlapping hotspots and cold spots. The incidence rate of tuberculosis is “n/100,000.”Southern Xinjiang, shows higher TB incidence (235.31 ± 92.44) and poorer air quality (AQI: 64.19 ± 11.73) compared to Northern Xinjiang (TB: 83.82 ± 21.43, AQI: 53.90 ± 6.48). Significant regional differences in TB incidence (p < 0.0001) were confirmed, with post-hoc analyses indicating higher TB rates and worse air quality in Southern Xinjiang. Trajectory and concentration-weighted trajectory (WCWT) analysis identified dust from the Taklimakan Desert as a major contributor to PM2.5 and PM10 pollution, with values exceeding 150 μg/m3 for PM2.5 and 400 μg/m3 for PM10 in key areas like Aksu and Kashgar. The Kunlun and Tianshan mountain ranges serve as barriers that trap migrating dust, while meteorological patterns indicate that dust-laden trajectories extend further into the mountainous areas. This phenomenon exacerbates the spread of tuberculosis (TB) in the high-risk regions of southern Xinjiang.
Conclusion: The study highlights a distinct interaction between TB, the geographic environment, and aerosols in southern Xinjiang. Poor air quality and elevated TB incidence overlap, particularly in Kashgar. Here, dust from the Taklimakan Desert, trapped by the Kunlun and Tianshan mountains, intensifies PM2.5 and PM10 pollution, further contributing to TB transmission in high-risk areas.
Introduction
Air pollution, a major global issue, primarily affects the respiratory and circulatory systems of the human body (1–3). Additionally, the impact of air pollutants on the immune system is influenced by respiratory diseases. These effects can impair immune function and increase the risk of various diseases (4–6). Inhaled particulate matter (PM10 and PM2.5) contributes to inflammatory responses, oxidative stress, and immune dysregulation, increasing susceptibility to respiratory diseases like tuberculosis by inducing inflammatory gene expression (e.g., TNF-α, IL-1β), suppressing anti-tuberculosis immune responses, and altering the lung microenvironment and immune tolerance (7–13). In 2019, an estimated 10 million new tuberculosis cases and 1.4 million TB-related deaths were reported globally (14). China ranks third in the world in terms of tuberculosis burden, accounting for 8.4% of the global total (15). Therefore, the relationship between the characteristics of air quality pollution and tuberculosis can be studied and analyzed by leveraging the advantage of a large population.
Particulate matter (PM10 and PM2.5) not only impacts the respiratory and circulatory systems but may also facilitate the spread of infectious diseases like tuberculosis (TB) through complex biological and chemical mechanisms (1, 3). Tuberculosis is an infectious disease caused by Mycobacterium tuberculosis. The factors contributing to active tuberculosis are highly complex, encompassing bacterial strains, host immunity, and various social and environmental influences. In heavily polluted areas, such as Xinjiang, China, particulate matter can carry pathogens like Mycobacterium tuberculosis, thereby increasing the risk of disease transmission (7). Xinjiang’s unique geographical features, which trap pollutants, further exacerbate the spread of TB in the region (14). Traditional monitoring methods often fail to capture the spatial distribution of pollutants, prompting researchers to employ advanced spatial analysis techniques such as Kriging interpolation and the Potential Source Contribution Function (PSCF) (16, 17). Kriging interpolation estimates pollutant concentrations at unobserved locations based on spatial autocorrelation, offering detailed insights into pollution distribution and source identification (18). PSCF integrates meteorological back-trajectory data with pollutant concentrations to trace the origin of pollutants, particularly in regions with complex topography like Xinjiang, where long-distance pollutant transport is significant (19). These methods, along with Concentration Weighted Trajectory (CWT) analysis, assist researchers in assessing the movement and accumulation of pollutants, and provide critical insights for addressing pollution and tuberculosis transmission in vulnerable areas (20).
The Xinjiang Uygur Autonomous Region is among the most severely air-polluted areas in China, located in the arid desertification zone of Eurasia. Surrounded by high mountains, the region has limited access to oceanic air flow (21). The Kashgar region, situated in the Xinjiang Uygur Autonomous Region of China, provides a unique geographical setting for examining the relationship between air pollution and tuberculosis bacilli (22, 23). Figure 1 vividly illustrates our research. Surrounded by mountains and adjacent to the vast Taklimakan Desert, Kashgar’s unique topography may contribute to the regional accumulation of air pollutants (24–26).
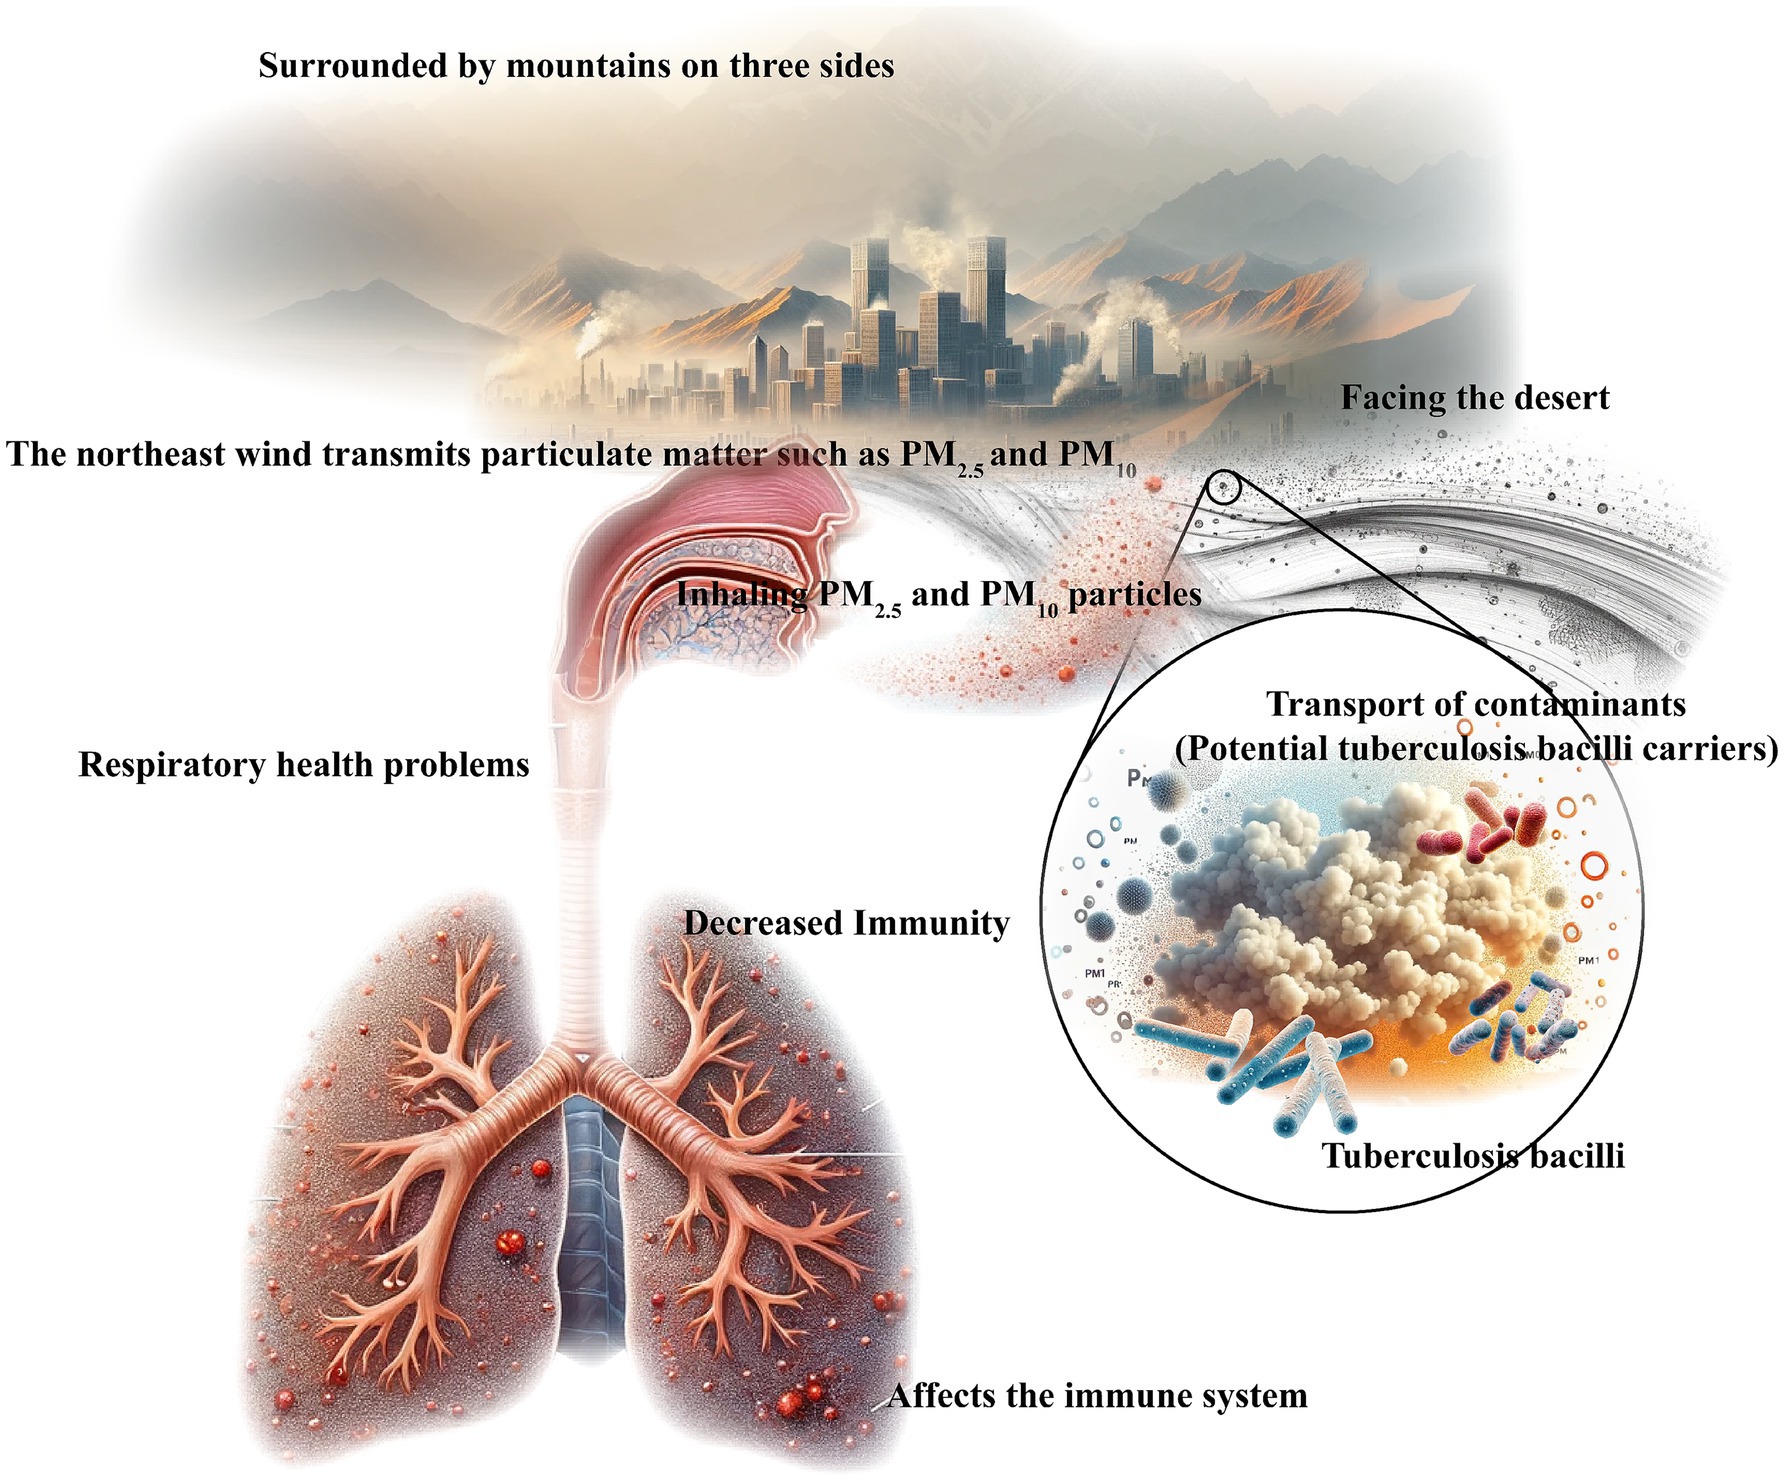
Figure 1. Relationship between geographical environment, transport and distribution of pollutants (potential carriers of tuberculosis bacilli), and human health.
The Kashgar region in Xinjiang has been recognized as a hotspot for respiratory diseases, including tuberculosis. Tuberculosis is an infectious disease caused by the bacterium Mycobacterium tuberculosis, which is primarily transmitted through airborne particles (27). There is concern that airborne particles may act as carriers for Mycobacterium tuberculosis, potentially amplifying the transmission of this disease within the population. The Kashgar area, characterized by high population density and relatively crowded living conditions, may thus be at increased risk for the spread of infectious diseases (24, 25). The variations in air pollution levels across different regions of Xinjiang, influenced by numerous factors, correlate with varying disease incidence rates. Single identification will underestimate the impact of air pollutants on diseases. Therefore, this study analyzed potential atmospheric pollution sources and carrier sources of Mycobacterium tuberculosis from the source area of pollutants.
Most studies have primarily focused on the isolated associations between air pollutant exposure and DNA methylation or cytokine concentrations, or have employed mediation analysis to explore the intermediary role of DNA methylation or cytokines in the impact of pollutants on tuberculosis risk (26). While systematic reviews and meta-analyses have evaluated the relationship between air pollutants and tuberculosis incidence, no studies have yet examined the interaction between tuberculosis, aerosols, and geographic environment from spatiotemporal dimensions or through long-term, large-scale data tracking (28). This study aims to address this gap. However, the complexity and diversity of environmental factors, combined with the high transmission risk of tuberculosis, present significant challenges in designing experiments to study the intricate interactions between air pollution and TB transmission. In response to these challenges, this study uses a space-oriented approach to explore the relationship between air pollution and TB incidence in Kashgar, a typical region surrounded by mountains on three sides and facing deserts. By simulating the transport of pollutants and analyzing the spatial distribution characteristics of tuberculosis incidence and pollutants, this study aims to elucidate the potential mechanism of air pollution on tuberculosis transmission. Comprehensive data collected over the past decade, including meteorological data, pollutant data, and TB incidence records in Xinjiang, especially during the high TB incidence season (April to June), using advanced analytical techniques such as Kriging interpolation, potential source contribution factor analysis, and concentration weight trajectory analysis. By studying the spatiotemporal dynamics between air quality, tuberculosis incidence, and the unique geographic environment in the Kashgar region, the potential role of geographic factors in pollution patterns and disease transmission dynamics is explored. Understanding the influence of environmental factors on disease epidemiology, predicting key areas that may serve as sources of pollution and contributors to tuberculosis transmission, and revealing how specific geographic regions and meteorological conditions influence disease spread, provide strong support for better control and mitigation of tuberculosis spread and offer valuable insights for future spatiotemporal epidemiological studies.
Materials and methods
Disease data
The incidence of tuberculosis in various regions of Xinjiang (One in 100,000) is sourced from the Xinjiang Uygur Autonomous Region Center for Disease Control and Prevention. Rigorous auditing is conducted on all data reports to guarantee data integrity and authenticity. Due to Medical and health conditions, only the incidence data from 2011 to 2022 are available.
Assessment of ambient air pollutants and meteorological data
Daily statistical data on air pollutants from 2012 to 2023 were obtained from the Environmental Monitoring Station of the Xinjiang Environmental Protection Bureau and the Center for Disease Control and Prevention of the Xinjiang Uygur Autonomous Region. Some data were collected from 153 stations of the China National Environmental Monitoring Center.1 The daily monitoring data for SO2 (μg/m3), NO2 (μg/m3), PM2.5 (μg/m3), PM10 (μg/m3), CO (μg/m3), and O3 (24 h average concentration (μg/m3)) were acquired based on historical monitoring data from air quality monitoring stations across various regions. The air quality index (AQI) is determined by the highest value of the individual air quality index (IAQI) corresponding to each pollutant. The classification of each pollutant is based on the air quality index reference guide (29).
Meteorological data
The data used in the inverse trajectory model for the second quarter (April to June, the peak incidence period of tuberculosis in the Xinjiang region) from 2015 to 2022 are derived from the Global Data Assimilation System (GDAS) of the National Centers for Environmental Prediction (NCEP). Meteorological information is obtained from the National Meteorological Science Data Sharing Service Platform.2 These datasets were initially recorded starting from 2015. This study aligns with the truncation year of tuberculosis statistics and extends until 2022.
Kriging interpolation method
The Kriging method is a scientific method based on the theory of variogram and structural analysis, which is used for unbiased optimal estimation of regionalized variables in a limited area (30). It is one of the important components of geostatistics and is often used in epidemiological studies to construct and predict disease transmission models. The advantage of this method is that it can take into account the correlation of geographical space, that is, there may be more similar disease transmission patterns between close locations, thus improving the accuracy of prediction. In our study, we used this method to describe the distribution of the incidence of tuberculosis in 2011–2022 and the distribution characteristics of the median size of AQI in 2012–2023. Among them, the ordinary Kriging method is the most used interpolation method in the Kriging method, and its expression is:
In Equation 1, represents the estimated value of the interpolation point, while denotes the measured value of the sample point . The weight coefficient corresponds to the sample point , and indicates the number of measured sample points used in the calculation. The weight coefficients for Kriging interpolation are determined based on the semi-variance function, which is expressed as follows:
In Equation 2, is the number of sampling points with distance . In the application, it is necessary to select the appropriate semi-variance function model according to the characteristics of the test semi-variance. The selection of weights should ensure that the estimated value is unbiased and the estimated variance is smaller than the variance generated by other linear combinations of the observed value. The minimum variance expression of is:
When the following formula is satisfied, the minimum variance of can be obtained.
In this Equations 3, 4, is the number of measured sample points involved in the calculation, is the Lagrange multiplier, is the semi-variance function between the sample point and the sample point, and is the semi-variance function between the sample point and the trajectory point.
PSCF and CWT model
Potential Source Contribution Function (PSCF) (31) is a widely used method in recent years for identifying sources of high-concentration pollutants, which helps in understanding the origins, transport pathways, and spatial distribution of atmospheric pollutants (32). In this study, this method was used to indirectly identify the potential source regions of particulate matter and the possible Mycobacterium tuberculosis it may carry. This method is based on HYSPLIT regional pollution source identification method. The PSCF at the grid cell is calculated, and its expression is:
In Equation 5, is the total number of trajectory endpoints in the same grid unit where the measured pollutant concentration exceeds the specified threshold of the pollutant, and is the total number of all trajectory endpoints passing through the grid unit. Regions with high PSCF values indicate a greater contribution to pollutants and may represent high-risk areas for tuberculosis transmission (33). In Equation 6, the PSCF value is multiplied by any weight function to eliminate the uncertainty in the pixels with smaller , so as to better reflect the uncertainty of the median value of these pixels. Based on this, a model was constructed to assign weight to the common spatial distribution of tuberculosis and particulate matter. The weight function is defined as follows:
Weight Potential Source Contribution Function (WPSCF) is often used to analyze the proportion of pollution trajectories in grid cells, but for areas with the same WPSCF value, it is impossible to determine the impact of pollution on the target area accurately. The concentration-weighted trajectory analysis (CWT) method can break through the above limitations and calculate the relative contribution of different source areas, which can better explore the spatial and temporal characteristics of air pollutants (20). By assuming that the particles may carry Mycobacterium tuberculosis, the potential source area of epidemic tuberculosis is proposed. The CWT calculation is as follows:
In Equation 7, is the weighted average concentration of the grid unit, is the trajectory index, is the total number of trajectories, is the pollutant concentration corresponding to the trajectory passing through the network unit , and is the time that the trajectory stays in the grid unit . Because the CWT method also has uncertainty, this paper uses the same weight factor as WPSCF to reduce its uncertainty, which called Weight concentration-weighted trajectory analysis (WCWT). The WCWT model was used to better understand how different meteorological conditions and elevation factors, as well as desert environments, affect the distribution of pollutants and the size of potential source areas for TB transmission.
Based on the hour-by-hour data of PM2.5 and PM10 from 2015 to 2022 in different regions of Xinjiang, the potential source areas of aerosol transmission routes and the potential source areas of tuberculosis transmission were analyzed by WPSCF and WCWT models. The potential source contribution factor and concentration weight trajectory of PM2.5 and PM10 are calculated by multiplying the potential contribution factor and concentration weight trajectory by the weight factor, respectively. Based on the calculation results of the WPSCF model, we divided the potential source areas into mild (0–0.3), moderate (0.3–0.7), and severe (0.7–1.0) pollution source areas. Combined with the spatial distribution of aerosol and tuberculosis incidence, and based on the WCWT model, we defined areas with particulate matter concentrations below 50 μg/m3 as low contribution source areas, 50–150 μg/m3 as moderate contribution source areas, and above 150 μg/m3 as high contribution source areas. This was done to explore the impact of particulate matter source areas on tuberculosis transmission (34).
Statistical analysis
Kriging interpolation and time series observations were used to analyze spatiotemporal trends and identify hot and cold spots of tuberculosis (TB) incidence from 2011 to 2023 and air quality in Xinjiang from 2010 to 2022. A predictive model for TB incidence and AQI was constructed using quadratic fitting, and model performance was evaluated using the R2 metric and p-value. The significance level was set at α = 0.05.
Spatial autocorrelation was analyzed for TB incidence and air quality in Xinjiang using Moran’s I index, where positive values near 1 indicate clustering and negative values near −1 suggest dispersion. A z-score of 7.49886, greater than the critical value of 1.65, confirmed significant clustering. Hotspot and cold-spot areas were identified based on 90, 95, and 99% confidence intervals.
Local spatial autocorrelation was assessed using the Gi* statistic, where values near 1 indicate strong clustering and near 0 suggest no significant clustering. Combined analysis of Moran’s I and General G index pinpointed Southern Xinjiang as a hotspot for high-value clustering, revealing spatial heterogeneity in TB incidence and air quality. All analyses were performed using ArcGIS 10.8.2 software (ESRI Inc., United States).
To assess regional differences in TB incidence and air quality, non-parametric statistical tests were conducted. Specifically, the Kruskal-Wallis test was applied to examine the significance of differences between groups. Multiple comparisons were used to further explore and highlight significant regional disparities between different locations within Xinjiang.
Meteorological clustering and trajectory analysis were carried out to identify the pathways of pollutants and potential source areas contributing to air pollution in the region. Using GADS meteorological data and hourly PM2.5 and PM10 concentration data from 2015 to mid-2022, backward trajectory simulations were conducted to model the movement of atmospheric pollutants over a 72-h period. The simulations were performed at a height of 500 meters and at four daily intervals (00:00, 06:00, 12:00, and 18:00 UTC).
The TrajStat 1.4.9 plug-in in Meteoinfo software was used for clustering and analyzing air mass trajectories across different seasons. The air mass trajectories were categorized into five types based on their movement patterns. Additionally, PM2.5 and PM10 pollution trajectories were classified according to the secondary standard limits outlined in the “Ambient Air Quality Standard (GB3095-2012) (35)”, which sets thresholds of 75 μg/m3 for PM2.5 and 150 μg/m3 for PM10. The number of pollution trajectories for each pollutant was calculated to assess the transport pathways of these pollutants in relation to TB transmission.
Finally, based on the identified pollution pathways and source areas (WPSCF and WCWT), hypotheses were proposed regarding the potential transmission routes of TB, predicting the source areas and the contribution levels of tuberculosis in this region.
Results
Overview of the research area
Figure 2 shows the geographical, administrative, and environmental distribution, along with site locations in northeast and southwest Xinjiang. Located in northwest China, Xinjiang is highlighted by a purple dot marking Kashgar, the focus of our analysis. Our Kriging interpolation sites include meteorological observation sites (red circles) and tuberculosis monitoring sites (black triangles). The region is divided into southern, northern, and eastern Xinjiang based on local customs.
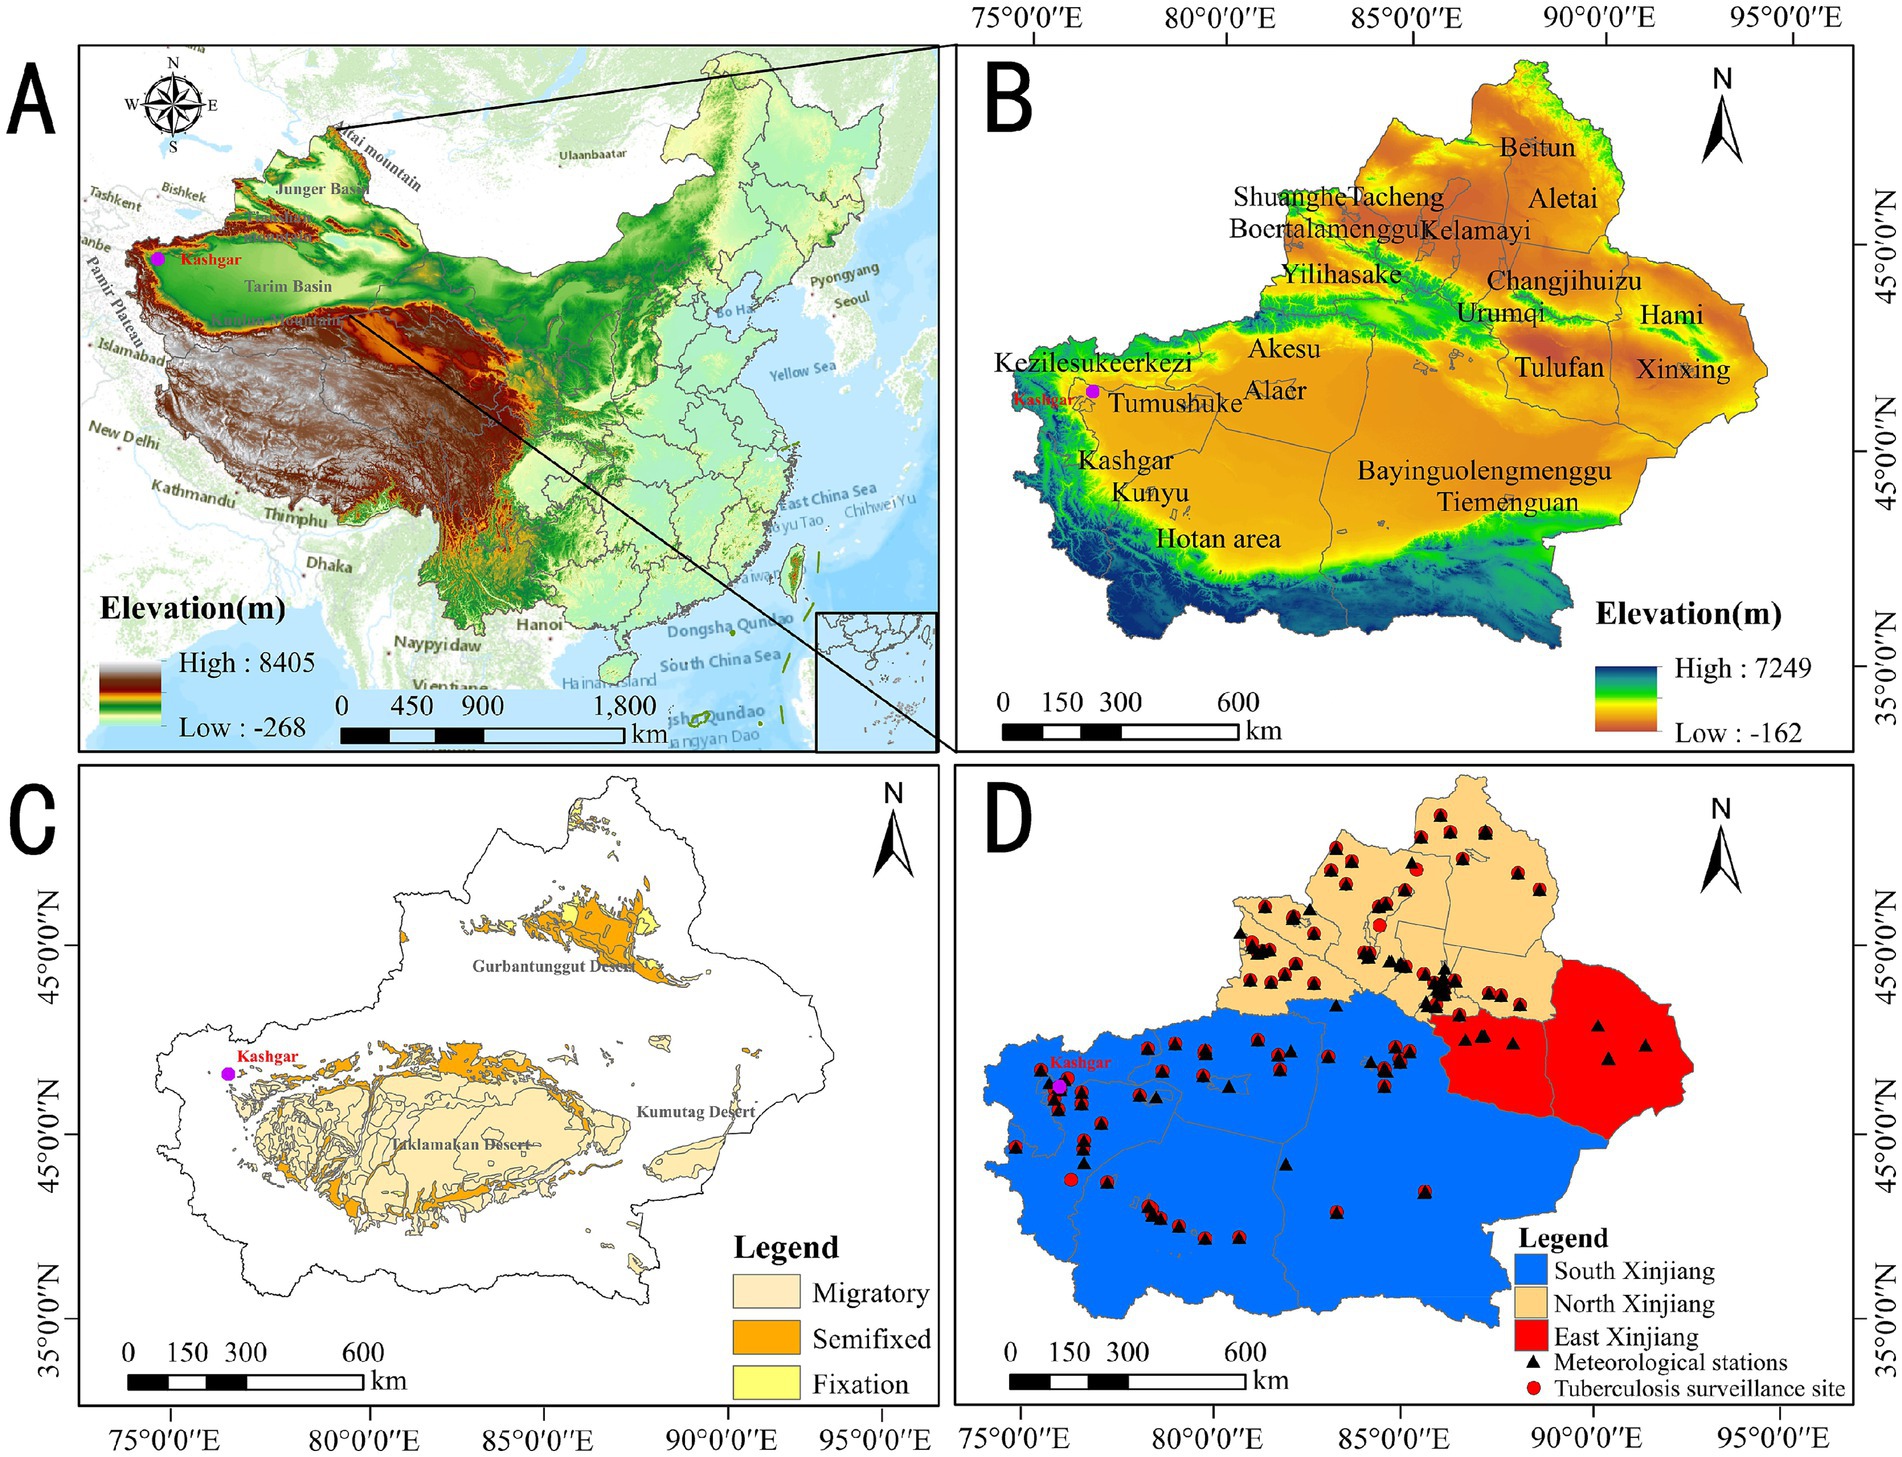
Figure 2. (A) Geographical location, (B) altitude, (C) geographical environment, and (D) regional division distribution of site locations in Xinjiang.
Kashgar, in southwest Xinjiang, is surrounded by the Tianshan Mountains, Kunlun Mountains, and Pamir Plateau, and bordered by the Taklimakan Desert. Xinjiang has three main desert zones: Taklimakan, Gurbantünggüt, and Kumtag, classified as migratory, semi-fixed, and fixed deserts. Migratory Deserts: The Taklimakan Desert, in the Tarim Basin (Southern Xinjiang), is characterized by shifting sand dunes and harsh, arid conditions. It extends from Hotan to near Aksu and Korla, with highly mobile dunes. Semi-fixed Deserts: The edges of the Taklimakan near Kashgar, Aksu, and Hotan have semi-fixed dunes with some stabilizing vegetation. Parts of the Kumtag Desert, extending east toward Lop Nur (Eastern Xinjiang), are also semi-fixed. Fixed Deserts: The Gurbantünggüt Desert, in Northern Xinjiang’s Junggar Basin, features stabilized sand dunes due to sparse vegetation. The northern Taklimakan and parts of the Kumtag Desert also show characteristics of fixed deserts. Overall, Xinjiang’s deserts vary in dune mobility, with the Taklimakan dominant in the south and the Gurbantünggüt more stable in the north.
The descriptive statistics for both tuberculosis incidence and air quality index (AQI) across four regions of Xinjiang (Eastern, Northern, Southern, and overall Xinjiang) are presented in Table 1. The incidence rate of tuberculosis is “n/100,000.”
Time series analysis of pollutants and pulmonary tuberculosis
The analysis of data for the Air Quality Index (AQI) and pulmonary tuberculosis (TB) incidence did not reveal any significant correlation or regression between the two variables. Both correlation analysis (p > 0.05) (Supplementary Table S1) and regression analysis (p > 0.05) (Supplementary Table S2) indicated a weak association, suggesting that changes in AQI have a limited impact on TB incidence.
As shown in Figures 3, 4, both the Air Quality Index (AQI) and tuberculosis (TB) incidence in Xinjiang exhibited significant trends from 2012 to 2023. Both AQI and TB incidence declined from 2012 to 2018, followed by an upward trend in AQI and a sharp decline in TB incidence after 2018, mainly due to active interventions by the government and health authorities. Following the TB outbreak in 2018, disease control departments learned from the incident and implemented proactive measures in collaboration with the government and healthcare sectors. The relationship between the pandemic’s lockdown measures and the decline in tuberculosis cases lies in the strict control of movement and reduced public interaction, which limited the spread of infectious diseases, including TB. The lockdown and isolation measures likely contributed to a decrease in TB transmission, as they reduced the opportunities for individuals to be exposed to infected people, especially in crowded settings.
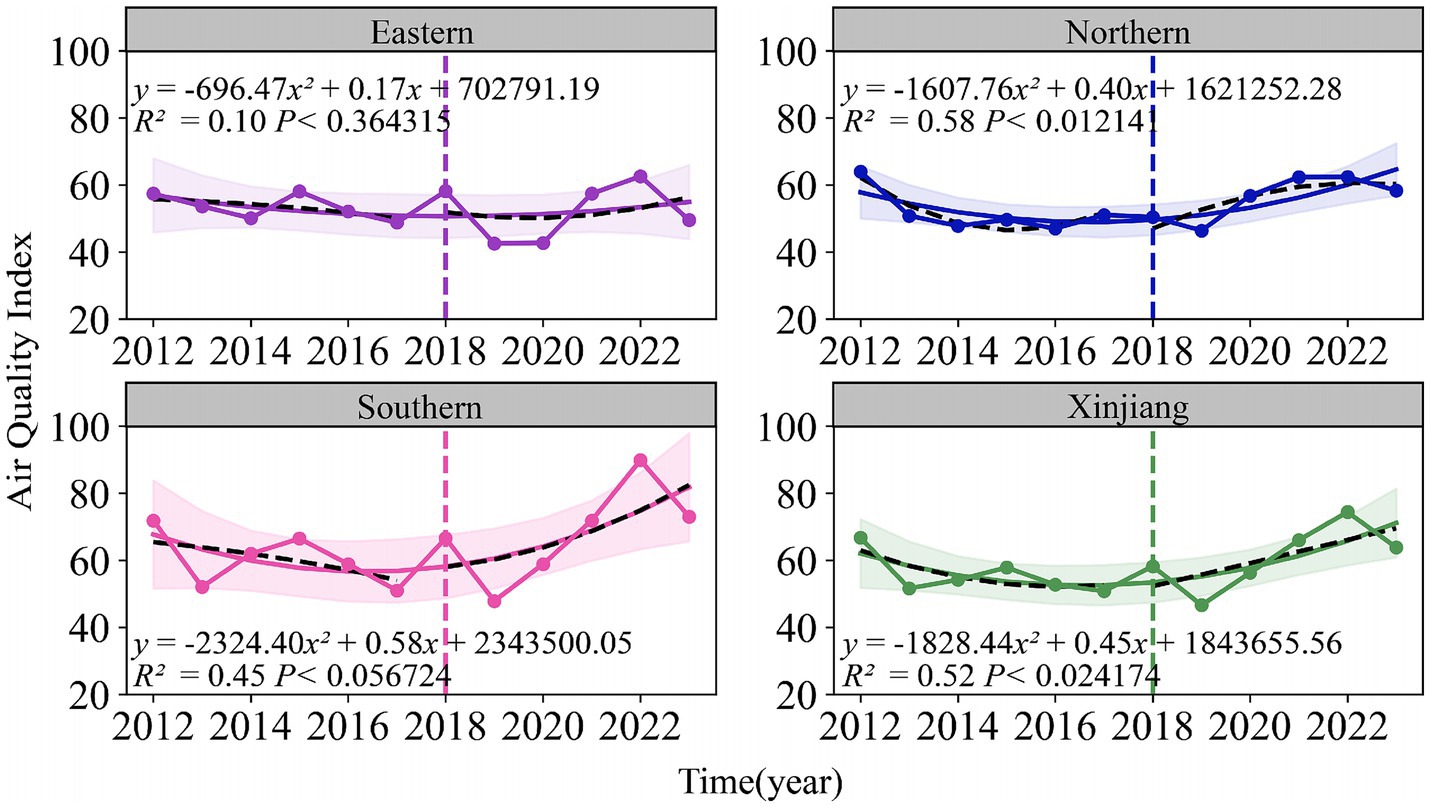
Figure 3. Temporal trends of air quality index (2012–2023) and tuberculosis incidence rates (2010–2022) in eastern, northern, southern Xinjiang, and Xinjiang overall.
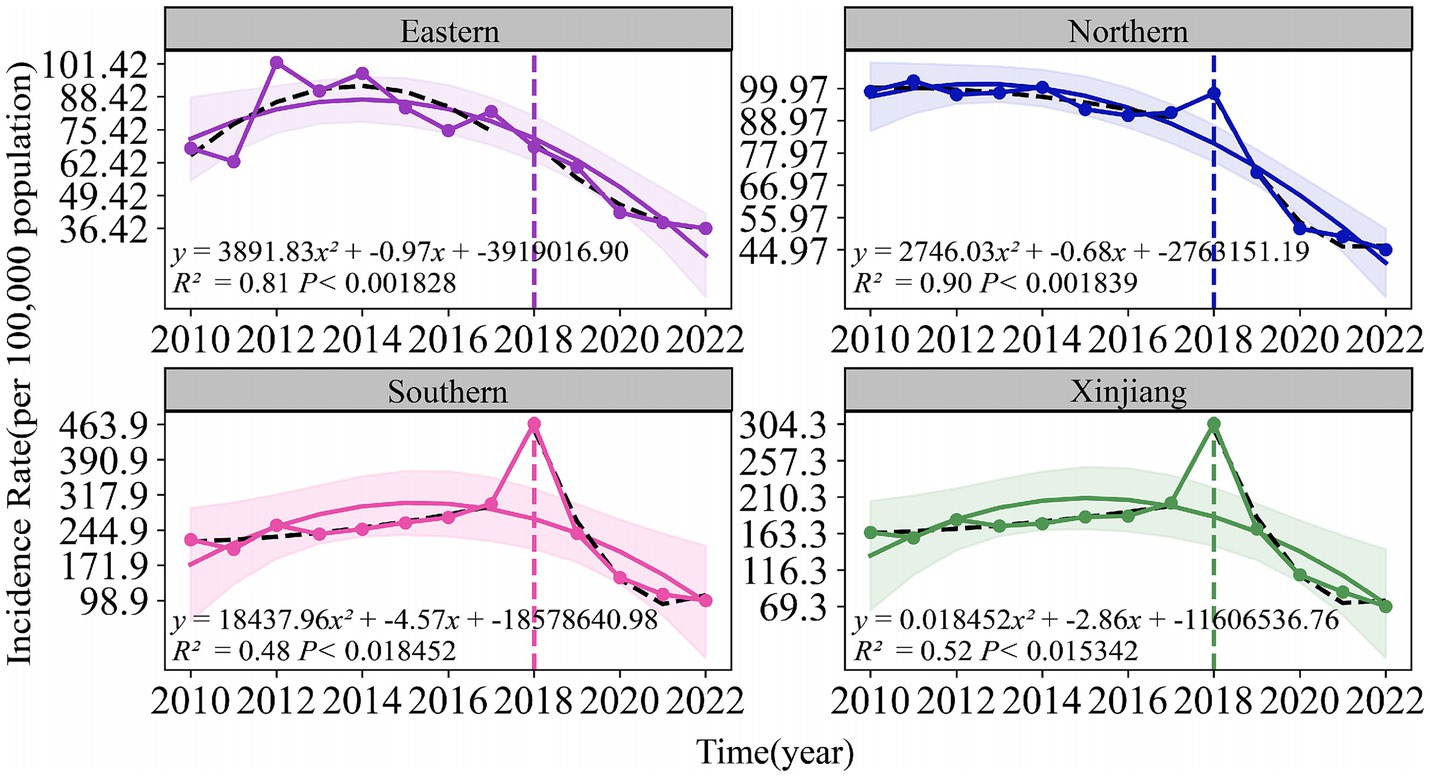
Figure 4. Temporal trends of air quality index (2012–2023) and tuberculosis incidence rates (2010–2022) in eastern, northern, southern Xinjiang, and Xinjiang overall.
There were significant regional fluctuations in air quality, particularly in Southern Xinjiang, which saw high AQI levels in 2012, 2015, 2018, and 2022, indicating severe air quality deterioration. TB incidence also showed notable regional differences, with Southern Xinjiang experiencing a sharp increase from 250 cases per 100,000 in 2015 to over 450 cases per 100,000 in 2018, followed by a steady decline, returning to lower levels by 2022. Meanwhile, Eastern and Northern Xinjiang consistently maintained the lowest TB incidence rates during the study period.
The fitted curve in the figure indicates that the AQI has shown a long-term upward trend, which is associated with the industrialization and urbanization of the region. Among the models, the predictions for Southern and Northern Xinjiang are relatively accurate, with R2 values of 0.45 and 0.58, respectively. The prediction model for the incidence rate of tuberculosis shows even higher accuracy, particularly in Northern Xinjiang, where R2 reaches 0.90, followed by Eastern Xinjiang with an R2 of 0.81. The fitting results for all regions, except Eastern Xinjiang, are statistically significant (p < 0.05).
Figure 5 illustrates that from 2010 to 2022, areas with high incidence of pulmonary tuberculosis in Xinjiang include Kashgar, Hotan, Akesu, and Kezilesu (Southern Xinjiang), while Kelamayi (Northern Xinjiang) has a low incidence. The correlation between AQI distribution (2013–2023, Figure 6) and tuberculosis incidence is evident in Southern Xinjiang, where higher pollution aligns with higher tuberculosis rates. In contrast, the relationship between AQI and low-incidence areas, like Northern Xinjiang, is less clear. In 2018, the tuberculosis incidence from high to low was Kashgar, Hotan, Akesu, and Kezilesu, mirroring the AQI pattern. From 2010 to 2022, the average tuberculosis incidence in Xinjiang was 166.66 per 100,000 people, with Kashgar reaching 377.43. The top counties-Yingjisha, Zepu, and Maigaiti (Southern Xinjiang)-had the highest rates. Severe air pollution in Kashgar, particularly from 2013 to 2023, correlates with the high incidence of tuberculosis cases. Referring to the tuberculosis trend in Kashgar from 2010 to 2022 (Figure 7), Tashkurgan (Southern Xinjiang) had the lowest prevalence, likely due to its sparse population in a desert area, while other parts of Kashgar remain highly affected.
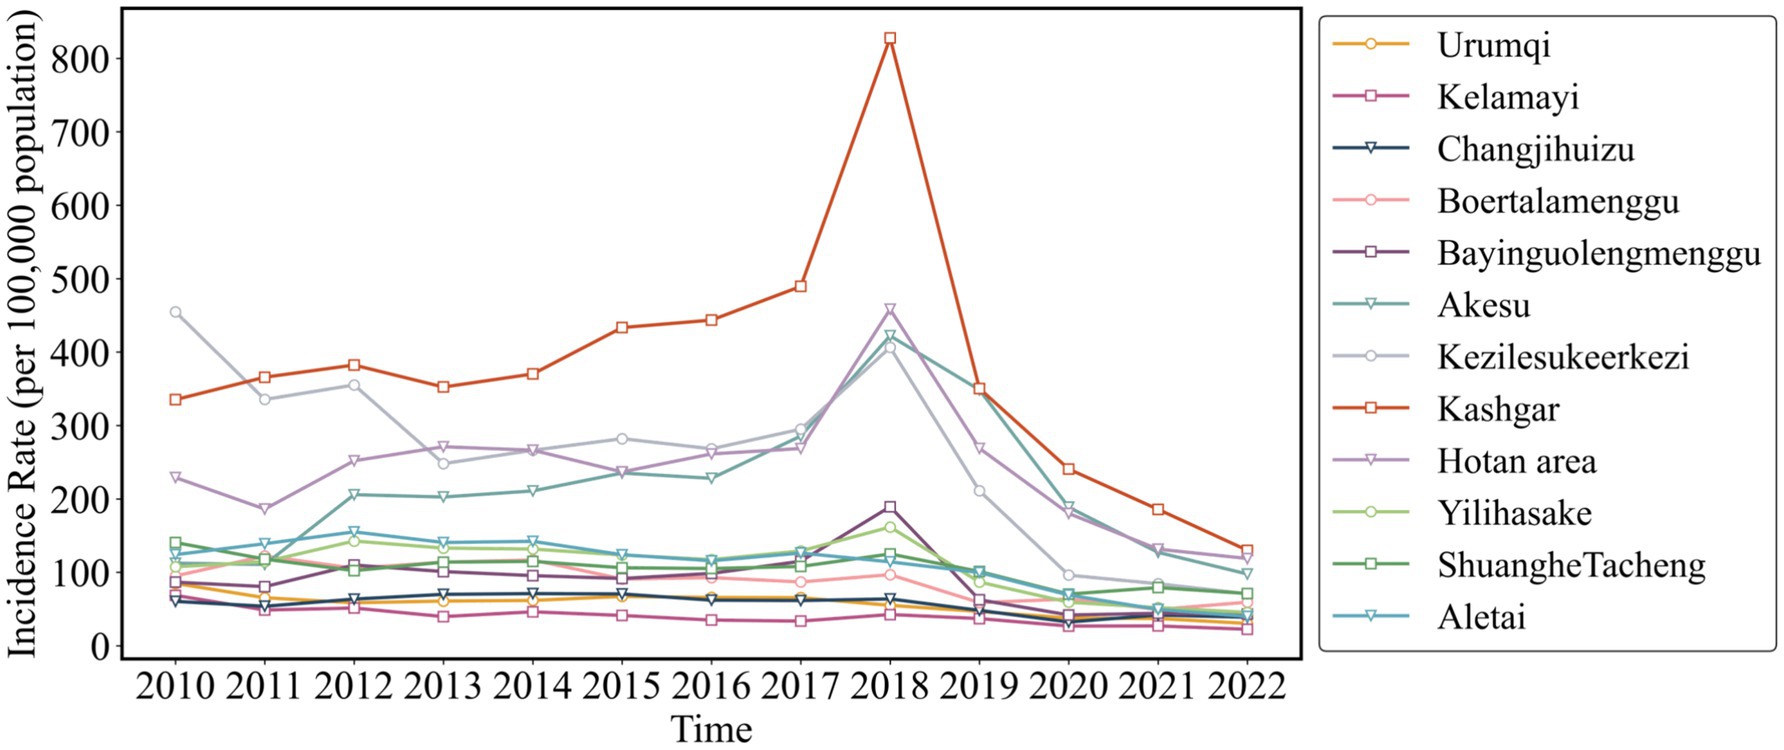
Figure 5. Incidence trend of pulmonary tuberculosis in Xinjiang Uygur Autonomous Region from 2010 to 2022.
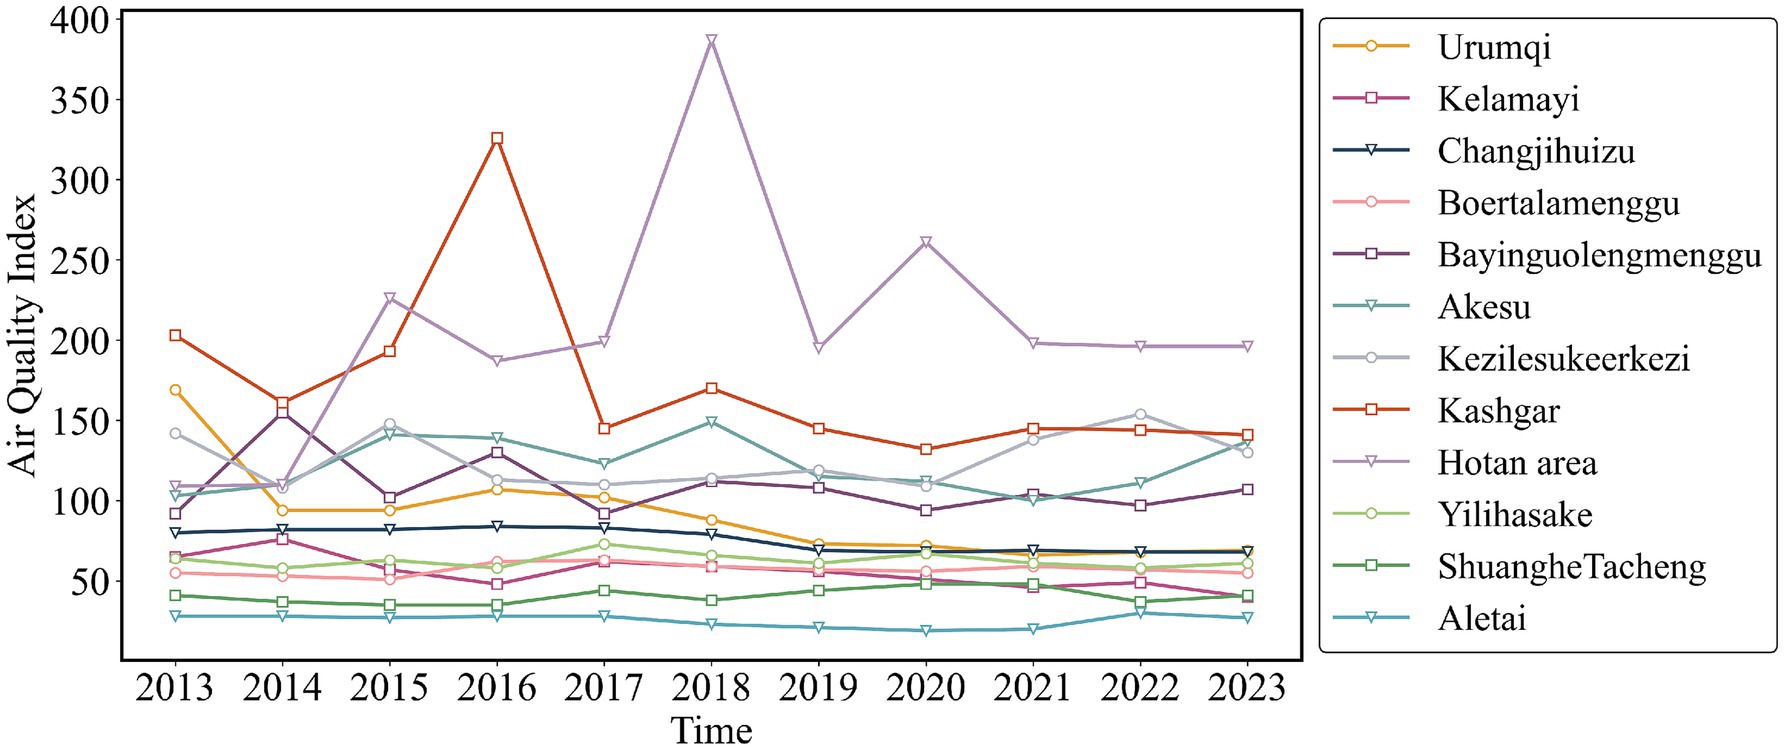
Figure 6. Time distribution characteristics of AQI in Xinjiang Uygur Autonomous Region from 2013 to 2023.
Spatial correlation analysis of air pollution and incidence of pulmonary tuberculosis
Figure 8 shows the spatial distribution of pulmonary tuberculosis incidence in the Xinjiang Uygur Autonomous Region from 2011 to 2022. The southern Tarim Basin, surrounded by the Tianshan Mountains (including Kashgar, Hotan area, Aksu, and other areas of southern Xinjiang), has higher incidence rates, while the northern Zhungeer Basin (including kelamayi, Urumqi, Changjihuizu Autonomous Prefecture, and other areas of northern Xinjiang) shows relatively lower rates. This may be related to factors such as higher population density, relatively limited medical resources, and environmental and climatic conditions in southern Xinjiang, leading to significant regional differences in incidence rates between southern and northern Xinjiang.
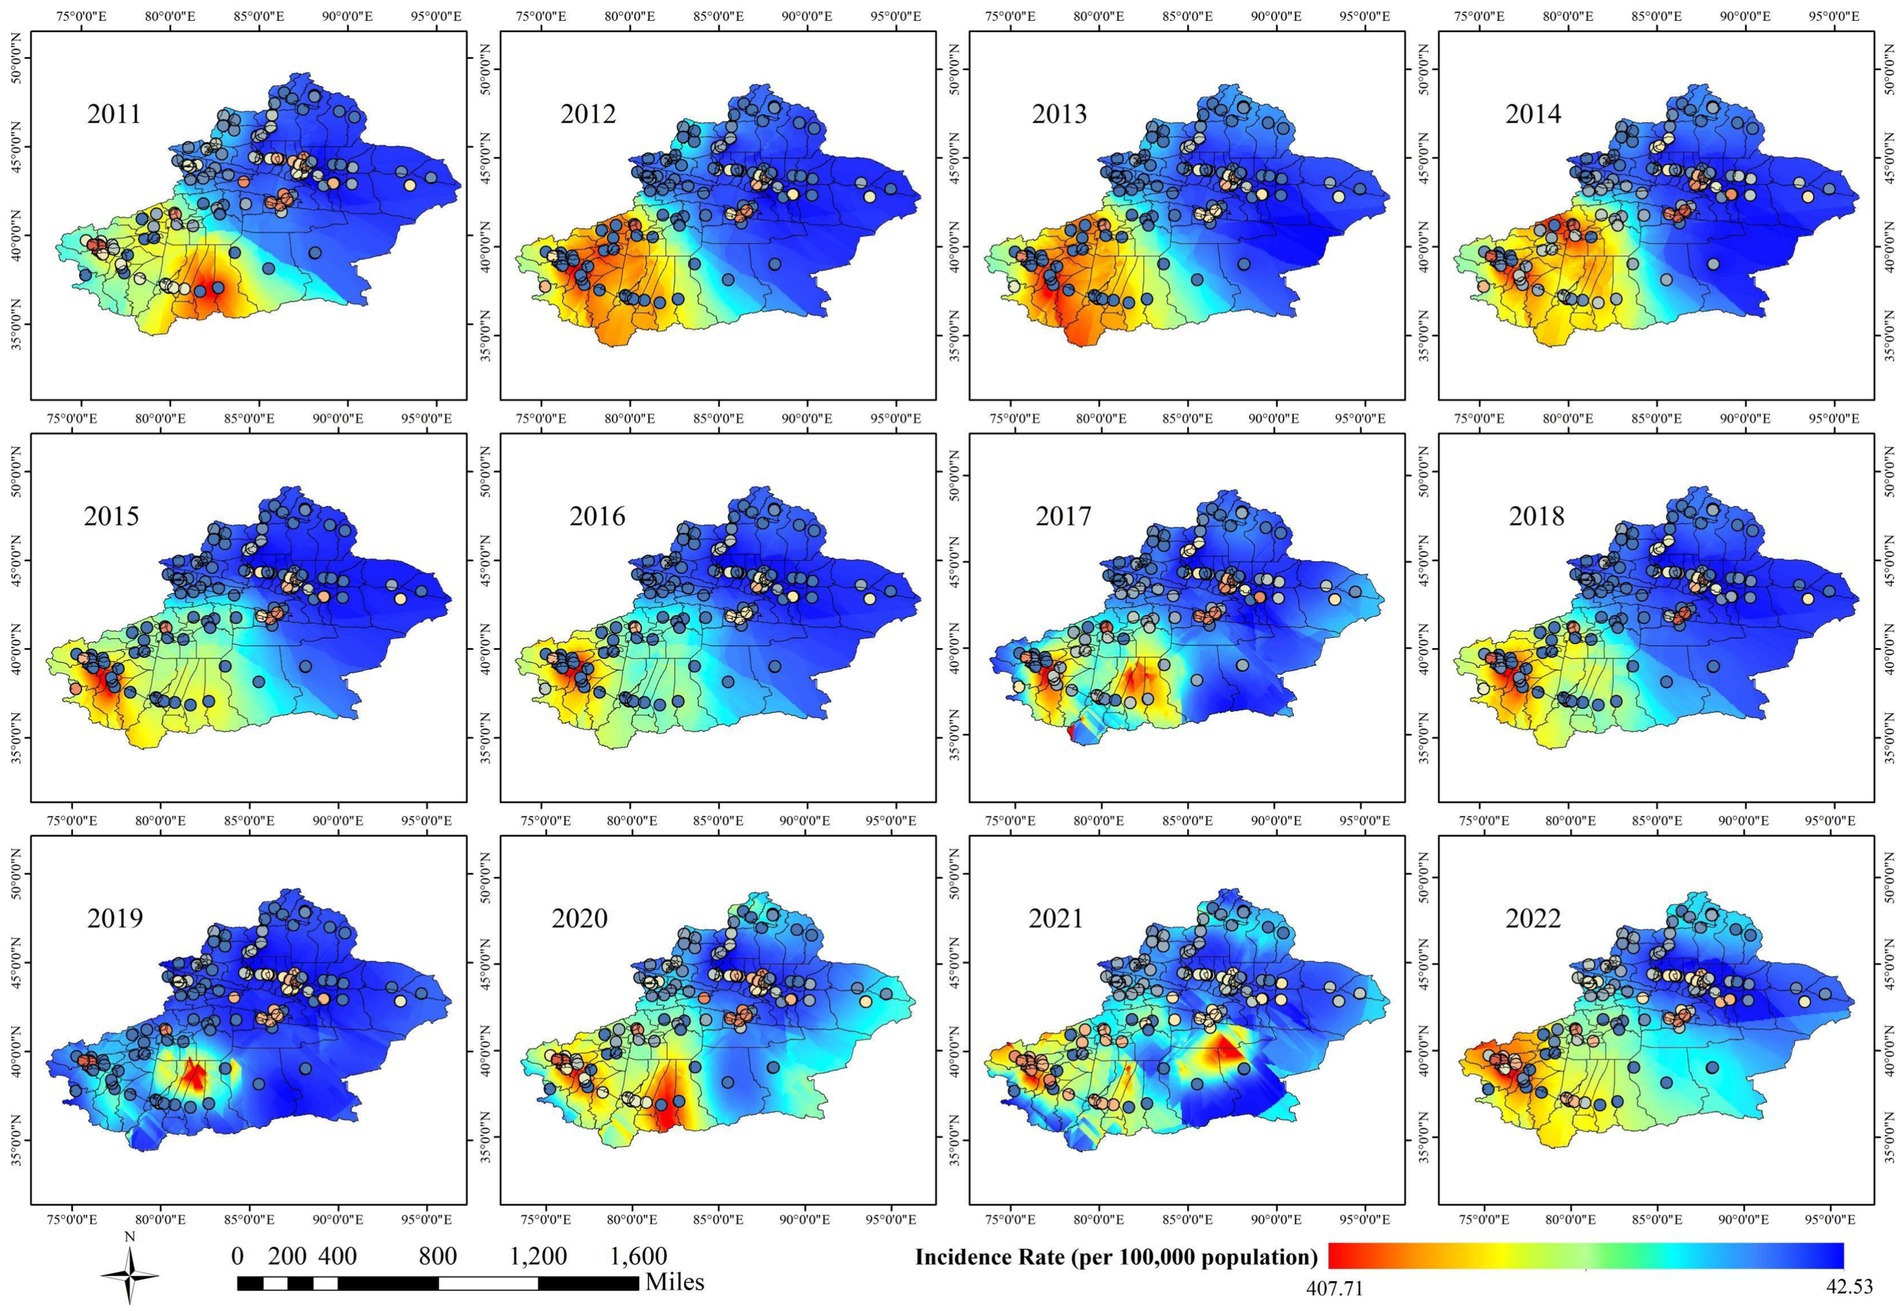
Figure 8. Spatial distribution characteristics of pulmonary tuberculosis incidence in Xinjiang Uygur Autonomous Region from 2011 to 2022.
Due to non-normal distribution and unequal variances in tuberculosis incidence (Levene statistic = 3.144, p = 0.03355), a Kruskal-Wallis test was performed, revealing significant regional differences (p < 0.0001). Dunn-Sidak post-hoc comparisons showed significantly higher tuberculosis incidence in Southern Xinjiang compared to Northern Xinjiang (Table 2).
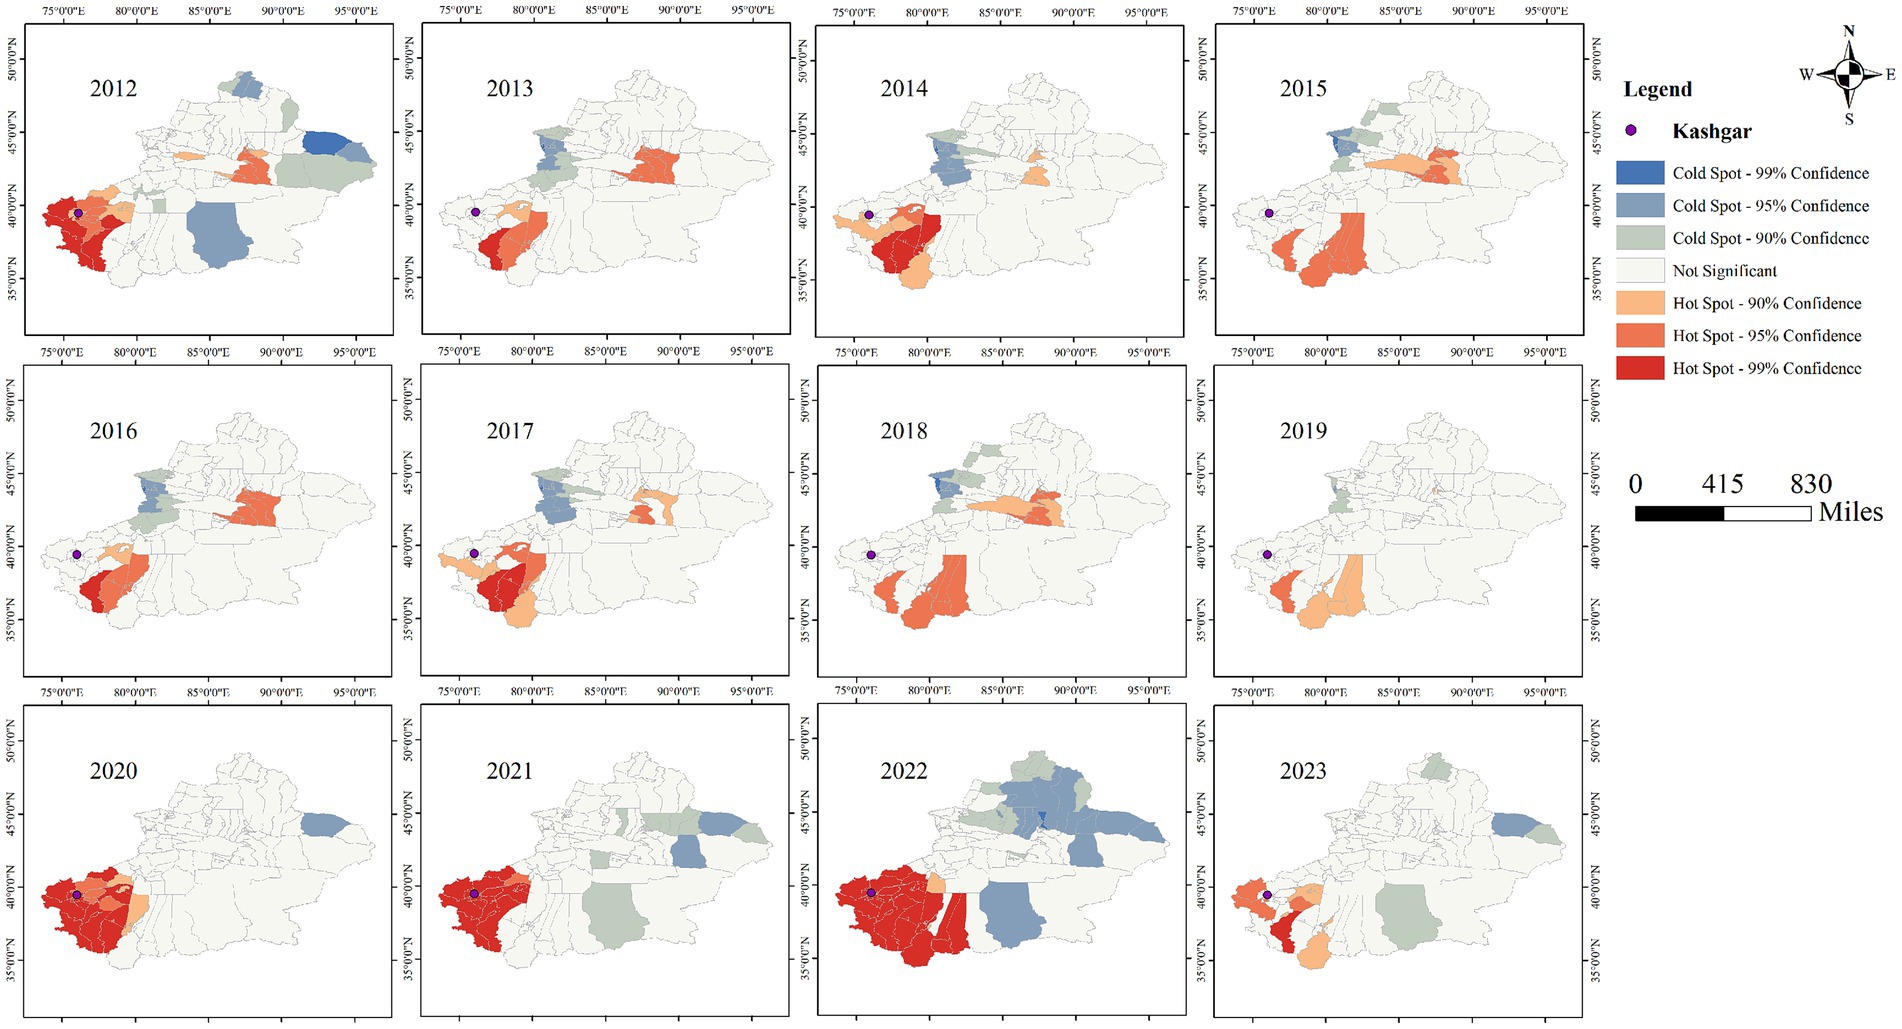
Meanwhile, Figure 9 illustrates the spatial distribution of AQI, which largely aligns with the spatial distribution of tuberculosis incidence. Southern Xinjiang, including Kashgar, Hotan area, and Aksu, experiences heavier pollution, while northern Xinjiang, such as Urumqi and Hami, sees relatively lighter pollution.
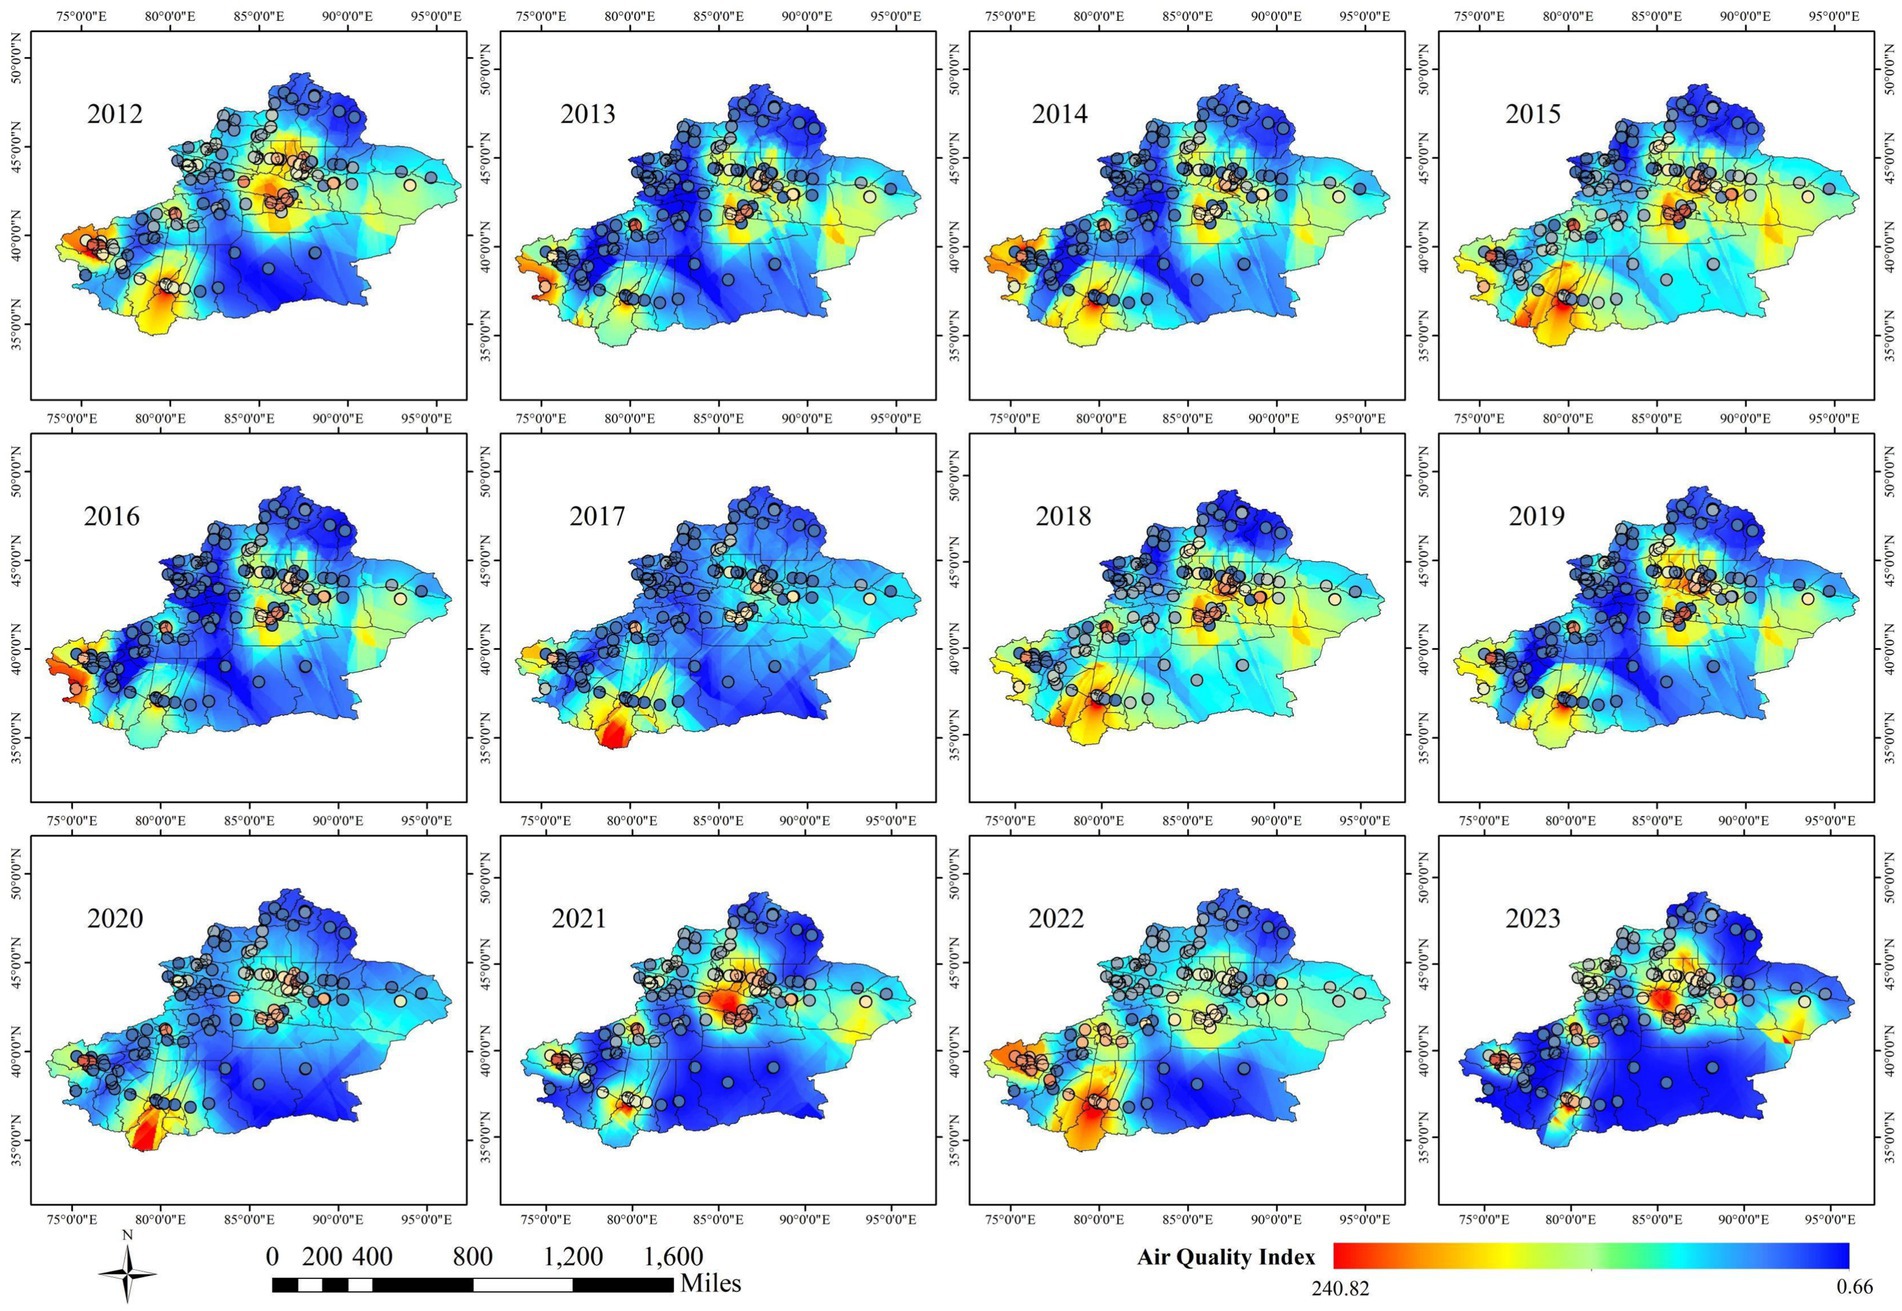
Figure 9. Spatial distribution characteristics of AQI in Xinjiang Uygur Autonomous Region from 2012 to 2023.
Notably, Urumqi, located in the central region of Xinjiang and surrounded by the Tianshan Mountains, shows higher tuberculosis incidence at specific sites according to Kriging interpolation, although the overall spatial analysis classifies the area as blue, indicating lower incidence. This contrasts with the AQI distribution, where Urumqi is marked red due to high pollution. This discrepancy is likely due to the uneven distribution of monitoring stations. Urumqi, a valley city near the Gurbantunggut Desert (semi-fixed), located in the northern foot of the middle section of the Tianshan Mountains and the southern margin of the Junggar Basin, is hindered by Mountain range that limit pollutant dispersion, resulting in consistently poor air quality. Despite its high pollution, Urumqi and Hami, unlike Kashgar and Hotan, are not directly impacted by desert dust. The overall pattern indicates that high tuberculosis incidence in southern Xinjiang, particularly in deeper areas of the Kunlun and Tianshan mountain regions, may be influenced by windblown desert particulate matter, as suggested by the hotspot areas in Figure 2. This supports the trend of southern Xinjiang being a high-risk area for tuberculosis, while northern Xinjiang remains relatively low-risk, as reflected in both Figures 8, 9.
This phenomenon may be influenced by various factors. It is important to note that these analyses are based solely on the available data and represent hypothetical interpretations. The actual situation may be affected by multiple factors, including but not limited to local environmental policies, industrial development, population density, increased industrial activities, or insufficient public health measures. The Kruskal-Wallis test revealed no statistically significant differences in AQI across regions (χ2 = 4.722, p = 0.1933), suggesting that regional variations in AQI are not significant.
The Kruskal-Wallis test revealed significant differences in tuberculosis incidence, but AQI did not show a corresponding significant difference, despite following similar regional patterns. This may be due to the uneven distribution of monitoring stations, with more stations in rural and suburban areas compared to urban centers, leading to reduced statistical power in urban regions. Tuberculosis monitoring stations are concentrated in hospital districts, while AQI monitoring stations are mostly located in suburban areas, and the scarcity of urban stations may affect AQI’s statistical results. By including all available stations rather than random sampling, we enhanced the reliability of the spatial analysis. Southern Xinjiang, particularly regions like Kashgar, Hotan, and Aksu, showed higher tuberculosis incidence and AQI values, suggesting a potential correlation between air quality and health outcomes. These areas, surrounded by mountains and the Taklamakan Desert, may experience higher levels of particulate matter, contributing to both elevated AQI and tuberculosis rates. In contrast, Northern and Eastern Xinjiang exhibit better air quality and lower tuberculosis incidence, likely due to fewer environmental stressors such as desert dust. These spatial patterns are shown in Figure 10.
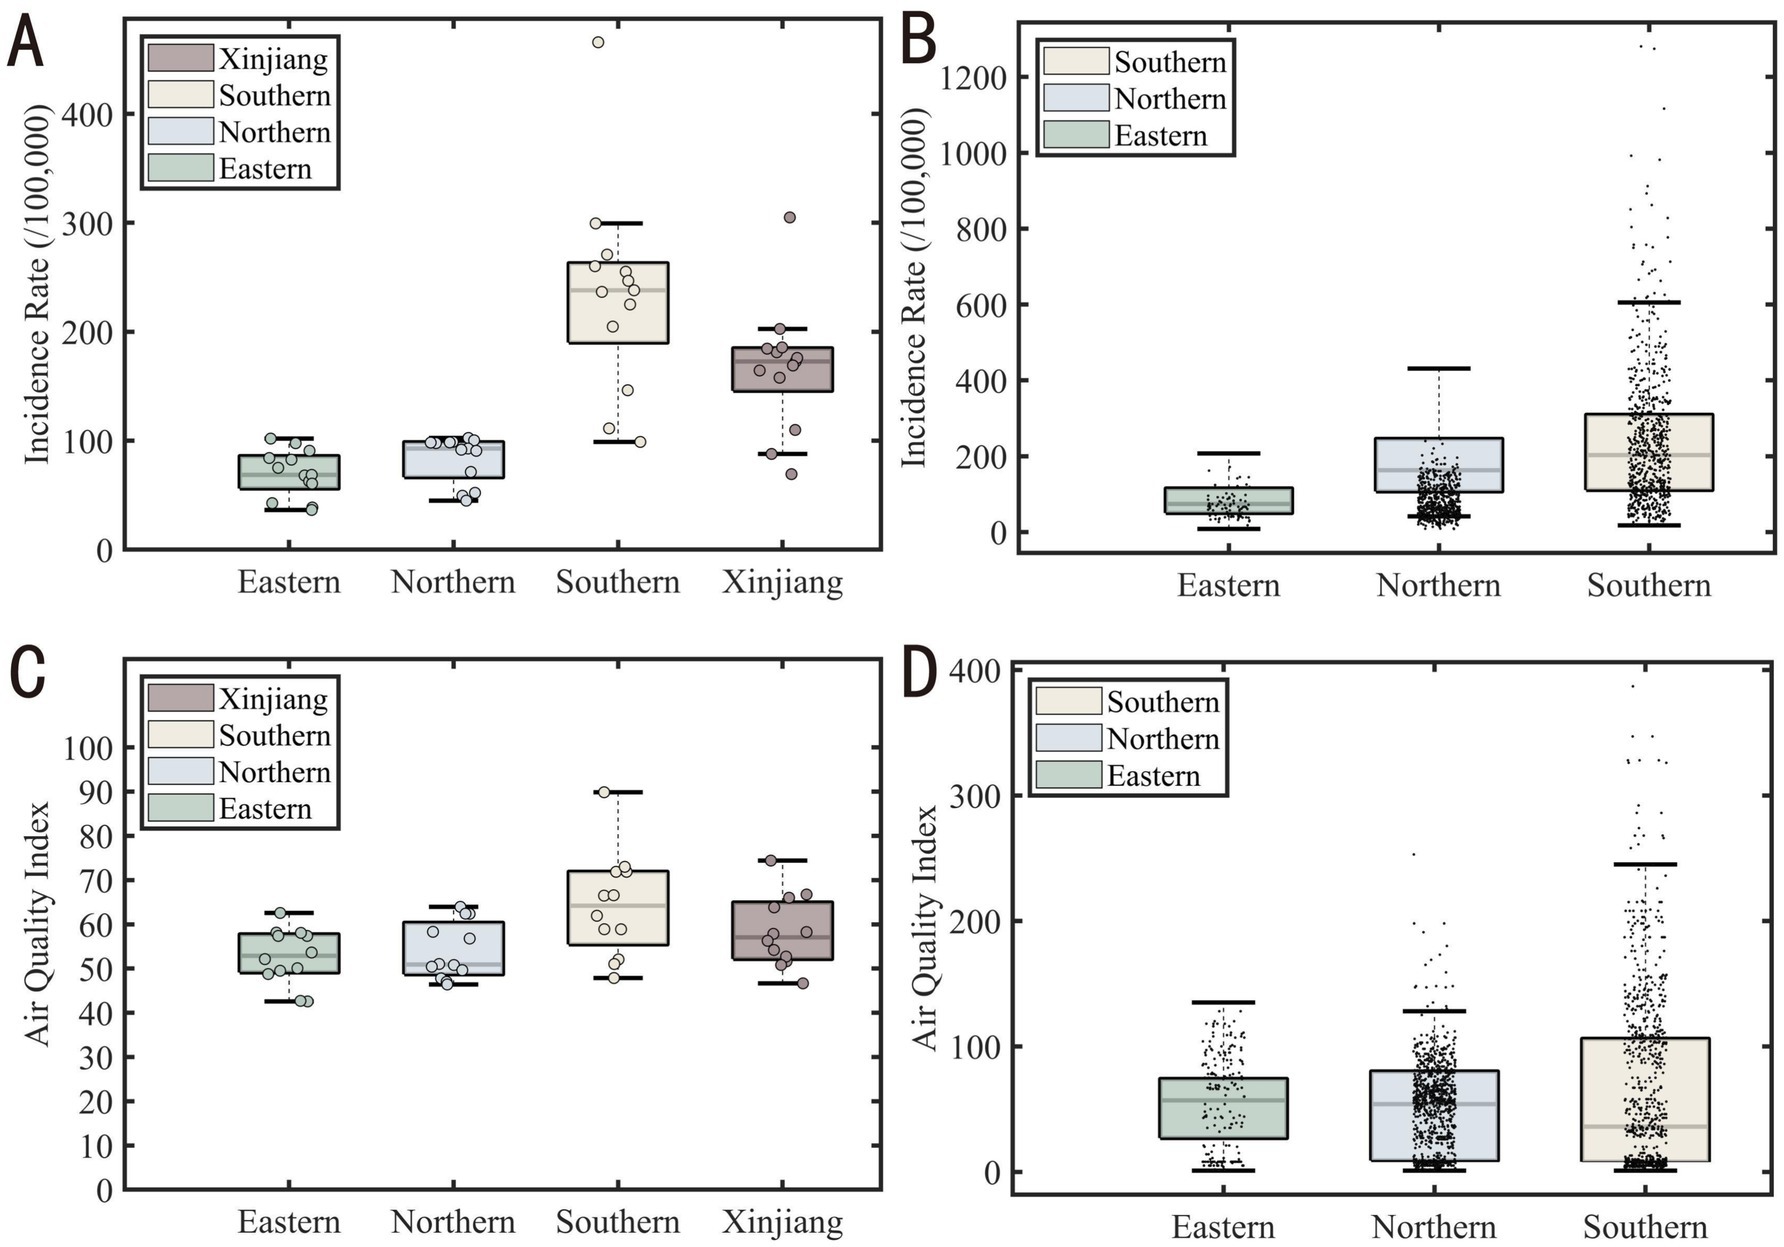
Figure 10. Boxplot comparison of tuberculosis incidence and air quality index (AQI) across Xinjiang regions. (A) Boxplot of regional tuberculosis incidence (B) Boxplot of tuberculosis incidence at county level (C) AQI box plot at regional level (D) AQI box plot at county level.
Cold hot spot analysis
Figures 11, 12 clearly show the differences between southern and northern Xinjiang through hot and cold spot analyses. The spatial hotspots for both AQI and tuberculosis incidence are located in southern Xinjiang, particularly in Kashgar, Hotan, and Aksu, which are surrounded by mountains on three sides and face the Tarim Basin and the Taklamakan Desert (migratory). The cold spots are mostly found in northern Xinjiang or other sparsely populated areas. Notably, in Figure 10, the AQI hotspots include the Urumqi area (located in the Tianshan mountain pass, in the central part of the Xinjiang map), whereas Figure 9 shows no corresponding tuberculosis hotspots in this region. This could be due to the significant spatial variability in tuberculosis distribution, where smaller Individual cases fail to influence the overall pattern of hot and cold spots.
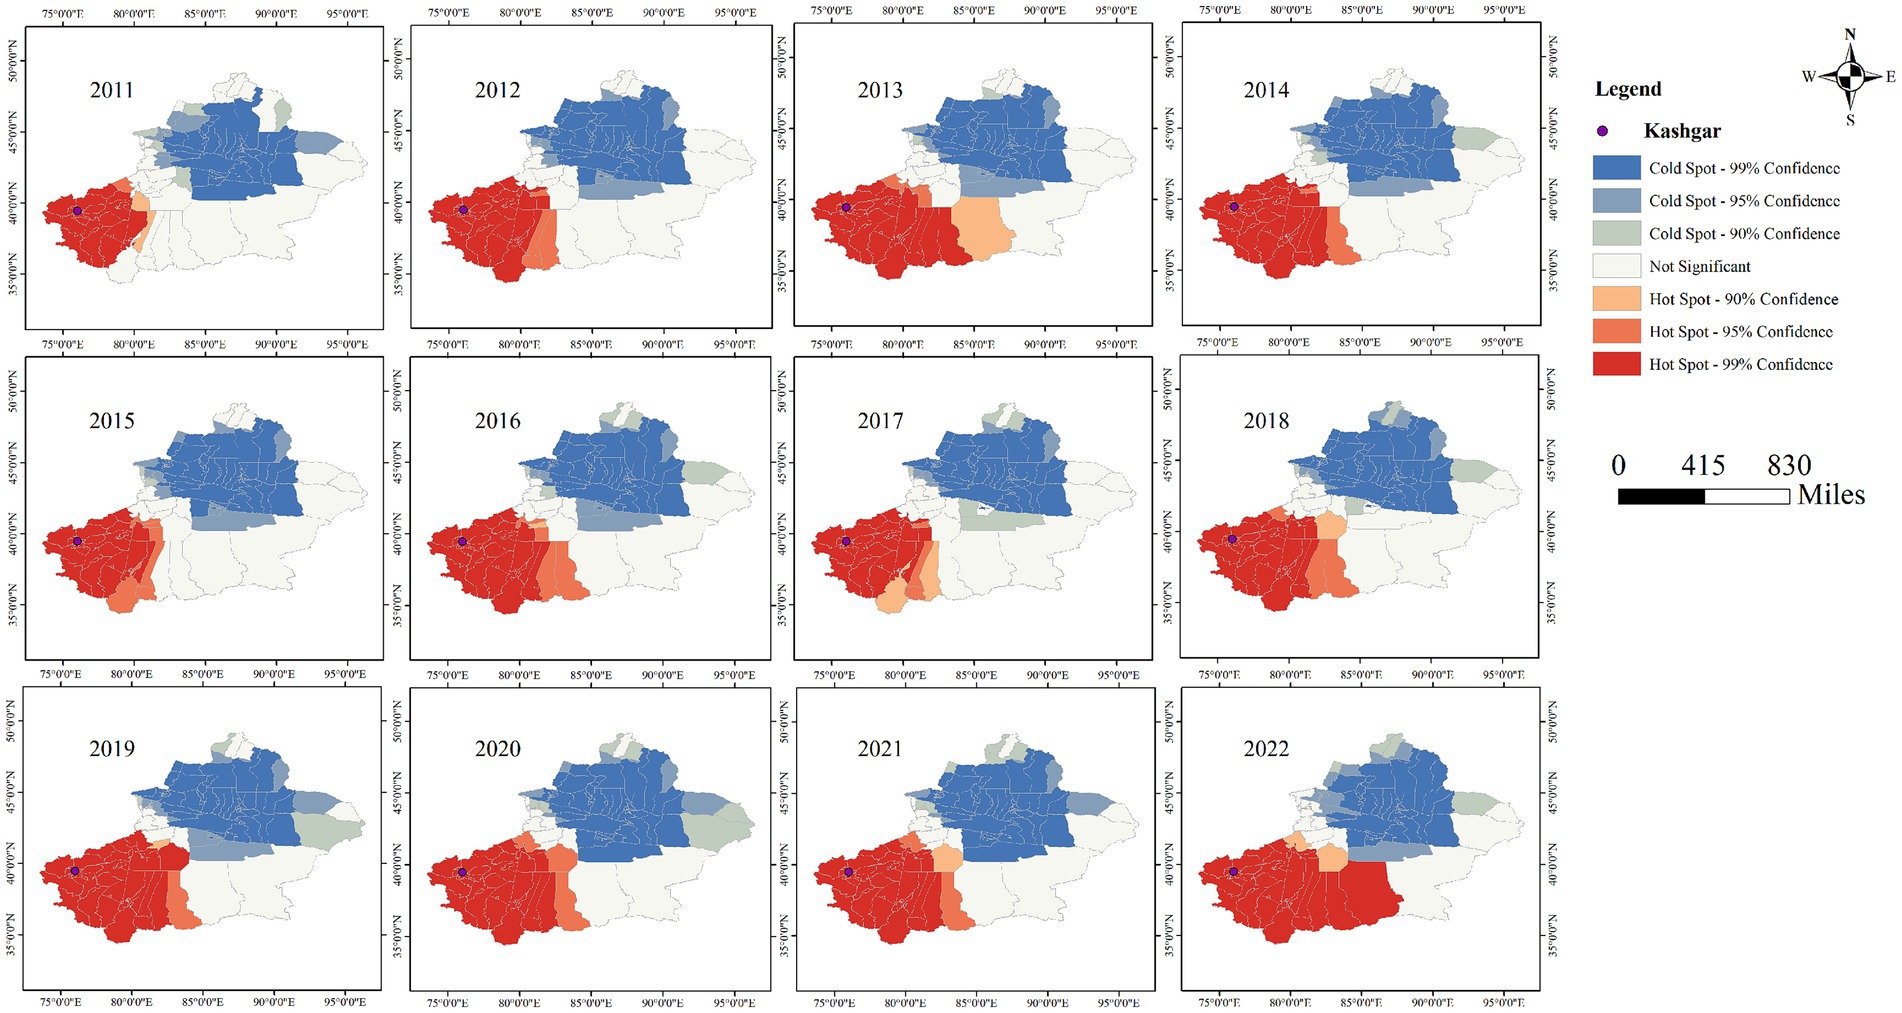
Figure 11. Cold hot spot analysis of pulmonary tuberculosis incidence in Xinjiang Uygur Autonomous Region from 2011 to 2022.
Cluster analysis of aerosol transmission trajectory
Trajectory ① (blue line) in Figure 13 traverses from the northern junction of the West Tianshan Mountains to the southern junction of the West Kunlun Mountains, extending westward and eastward through Tajikistan to Kashgar. Trajectory ② (Green Line) extends from east to west, passing through the Aksu region, Bayinguolengmenggu Mongol Autonomous Prefecture, and Hotan area region to Kashgar in the west. Trajectory ③ (yellow line) extends from northwest to southeast, passing through Kyrgyzstan and the Kezilesukeerkezi Kyrgyz Autonomous Prefecture to Kashgar. Trajectory ④ (red line) extends from southwest to northeast, passing through Pakistan, including Islamabad, to Kashgar. Trajectory ⑤ (purple-red line) extends from northeast to southwest, passing through Kyrgyzstan and the Aksu region to Kashgar.

Figure 13. The intersection of the western part of the Tianshan mountains and the western part of the Kunlun mountains: a topographic map of the backward clustering trajectory in Kashgar [the second quarter (April–June) of 2015–2022].
The Kashgar region experiences increased susceptibility to dust during the second quarter of each year. Trajectories originating from the Taklimakan Desert contribute 30.88 and 6.73% to Trajectories ② and ⑤, respectively, transporting a significant amount of dust aerosols to the Kashgar region. The proportion of PM10 pollution trajectories reaches 59.73 and 65.79%, with average trajectory concentrations of 500.72 and 471.47 ug/m3, respectively, higher than those in other directions, indicating substantial influence of dust on PM10 pollution levels in the second quarter. Trajectory 4 exhibits the shortest airflow transmission trajectory, primarily influenced by the southern Kunlun Mountains, leading to limited pollutant diffusion and accumulation of atmospheric pollutants, with higher average concentrations of PM2.5 and PM10. Trajectories ① (49.09%) and ③ (9.96%) cover longer transmission distances, originating mainly from Tajikistan and Pakistan, with lower pollution concentrations. Further details are reported in Table 3.

Table 3. Meteorological clustering trajectories of PM2.5 and PM10 in Kashgar from April to June in 2015–2022.
Notably, the main wind direction and the direction of topographic barriers are consistent with the previous hot and cold spot results, as well as the spatial correlation results. The meteorological cluster extending deeper into the desert has the largest proportion.
Prediction of potential source area of tuberculosis
The Weighted Potential Source Contribution Function (WPSCF) and Concentration Weighted Trajectory (WCWT) analysis provide insights into the influence of potential aerosol source areas on the Kashgar region. Figures 14, 15 present the PSCF and CWT analyses for PM2.5 and PM10 concentrations during the second quarter (April–June, which coincides with the peak incidence period for tuberculosis in this region.) from 2015 to 2022.

Figure 14. PSCF and CWT analysis of PM2.5 in Kashgar region in the second quarter of 2015–2022 (April–June).

Figure 15. PSCF and CWT analysis of PM10 in Kashgar region in the second quarter of 2015–2022 (April–June).
For PM2.5, the predominant pollution sources are located in the northeast, with severe pollution clusters concentrated in Aksu, Alar, Korla, and Urumqi, primarily originating from the Taklimakan Desert. The airflow patterns disperse moderate and mild pollution clusters toward the southwest and west. This is critical for epidemiology, as aerosols, including PM2.5, can facilitate the suspension of pathogens such as Mycobacterium tuberculosis, allowing them to remain airborne longer due to their attachment to fine particles. The combination of dust, air pollution, and the presence of resistant pathogens increases the risk of tuberculosis (TB) transmission, especially given Kashgar’s high population density and crowded living conditions.
The trajectory analysis for PM2.5 shows that WCWT values exceed 150 μg/m3 in regions such as Aksu, Alar, and Hotan, with peak values reaching 300 μg/m3 in some areas. This indicates a significant influence of aerosols in southwestern China on the region’s air quality and their potential role in facilitating the spread of TB.
In contrast, PM10 pollution is widely dispersed but severe in specific areas. Notably, the southern region of Kashgar, particularly areas affected by the Kunlun Mountains and located on the leeward slope, experiences significant pollution accumulation due to the blockage of air masses. WCWT values for PM10 exceed 400 μg/m3 in the northwest Taklimakan Desert and reach over 250 μg/m3 in the southern region of Kashgar, where the Kunlun Mountains contribute to the buildup of pollution. This geographic and meteorological pattern correlates with the high incidence of tuberculosis in Kashgar, demonstrating distinct regional characteristics.
These findings highlight the critical interaction between air pollution (specifically PM2.5 and PM10), the geographic environment, and tuberculosis incidence in Kashgar. The unique topographic and environmental factors exacerbate pollution levels, particularly in regions adjacent to major deserts and mountainous barriers, further intensifying the potential for airborne transmission of Mycobacterium tuberculosis.
Discussion
The complex impacts of air pollution on human immunity involve inflammatory responses, oxidative stress modulation, and respiratory health (36–38). Fine particulate matter (PM10, PM2.5) has gained considerable attention for harboring pathogens like Mycobacterium tuberculosis that can facilitate their spread among populations (39). Studies have shown that exposure to pollutants, such as particulate matter (PM2.5), can alter immune system function, weakening the body’s defense mechanisms against tuberculosis and thus increasing transmission risk (40). In arid and semi-arid regions, environmental factors such as low humidity, high temperatures, and dust storms play a significant role in tuberculosis (TB) transmission. Recent studies have shown that in desert climates, such as those in Central Asia, the dry conditions and dust storms contribute to the prolonged survival of Mycobacterium tuberculosis in the air, increasing the risk of airborne transmission (41). Additionally, research comparing desert and temperate climates suggests that areas with better air quality and higher humidity tend to have lower TB transmission rates due to reduced airborne bacterial survival (42, 43). Although microscopic analyses have revealed potential links between tuberculosis and air quality (44), current research has not fully addressed how particulate matter propagates or interacts with geographic context, demographic health effects, and transmission mechanisms (45, 46). This study uses an epidemiological approach with geographical and meteorological data to analyze dust transmission, but our ability to trace Mycobacterium tuberculosis spread is limited by the lack of strain-based evidence, making any claims about tuberculosis transmission speculative and requiring further investigation.
When examining the relationship between air pollution and tuberculosis, several uncertainties must be taken into account. These include variations in air pollution measurement methods and the selection of pollutants such as PM2.5, nitrogen oxides, and ozone, which can influence the findings (47). The socioeconomic characteristics of the study population, especially in low-income areas with high levels of air pollution and tuberculosis incidence, complicate the determination of whether air pollution serves as an independent risk factor (48, 49). Although studies control for confounders like smoking, nutrition, population density, and healthcare access, these factors may still affect results (50). Tuberculosis (TB) is a chronic disease with a long incubation period, making it crucial to account for the time lag when analyzing the relationship between air pollution and TB. Future research should apply models such as Distributed Lag Nonlinear Models (DLNM) to conduct a more detailed analysis of time-lagged cumulative effects in the spatial distribution of diseases, especially by interpreting the latency period between exposure and disease onset. This approach will help clarify the relationship between air pollution and TB and reduce potential biases arising from lag effects (51, 52). Geographic location and climate conditions can also influence how this relationship manifests across regions (53). Additionally, demographic factors such as age, gender and socioeconomic status across regions may further influence tuberculosis incidence (54, 55). While Xinjiang’s population structure has stabilized under government policies, healthcare in some regions, especially in southern and northern Xinjiang, remains underdeveloped (56). Our study relies on crude incidence rates, which may affect the results (57).
The Kashgar region of Xinjiang is surrounded by mountains on three sides (58). The southern part of the northern Tianshan Mountains lies horizontally, and the Pamir Plateau stands in the west. The southern part is the Karakoram Mountains stretching from east to west, and the eastern part is the vast Taklimakan Desert (59). The dominant wind direction is easterly wind, which causes floating dust to stay in this area for a long time (60). The AQI shows a seasonal trend, with higher levels in the spring and winter and lower levels in the summer and autumn (61). In spring and summer, there are more blowing sand and dust storms, resulting in severe air pollution (62). At the same time, the incidence of tuberculosis exhibits two peaks throughout the year: one during the winter AQI peak and another during April and May, when sandstorms are most frequent (63). The terrain of the three mountains and two basins is prone to heavy pollution deposition. The southwesterly wind in the high altitude area prevents the diffusion of PM2.5 and PM10 to the southwest to a certain extent (64). It is blocked by the Tianshan Mountains, Kunlun Mountains and Pamirs. The spatial diffusion of pollutants and the potential source area are perpendicular to the mountains, which also verifies the deposition of particulate matter in Kashgar with a high incidence of tuberculosis. The strong correlation between pollutant distribution, tuberculosis incidence, and pollution source characteristics supports the impact of pollution on tuberculosis (65, 66). This study found significant differences in pulmonary tuberculosis incidence and atmospheric particulate matter concentration between southern and northern Xinjiang, providing evidence to support previous research (12). While the direct causal link between these pollutants and specific health outcomes like tuberculosis is not fully established by our study, it is reasonable to hypothesize that such an accumulation could potentially contribute to the observed health trends in the region (67, 68). Due to Kashgar’s unique environmental conditions, there is no better evidence of the impact of atmospheric particulate matter and dust transmission on tuberculosis incidence than in this area (69).
Conclusion
Spatial and temporal analysis using Kriging interpolation and time series observation reveals a significant overlap between high tuberculosis (TB) incidence areas and regions with poor air quality in southern Xinjiang, divided by the Tianshan Mountains. Hot and cold spot analysis further confirms this pattern. Specifically, the case study of dust transmission in Kashgar highlights the role of atmospheric pollutants in influencing TB incidence in this unique environment. Inhalation of particulate matter impairs immune function, increasing disease susceptibility, while providing an environment conducive to Mycobacterium tuberculosis proliferation. The accumulation of airborne pollutants is strongly linked to higher TB incidence in the region. Trajectory analysis and meteorological clustering reveal pathways and source areas for pollutants, showing that atmospheric particulate matter significantly contributes to the increased risk of dust-borne TB in Kashgar. Although this phenomenon is evident, direct epidemiological evidence, such as bacterial strain analysis, is lacking to confirm TB transmission via these particulates. The hypothesis that particulate matter carries Mycobacterium tuberculosis remains speculative but plausible given the environmental conditions. To reduce health risks, residents should avoid outdoor activities, especially strenuous exercise, during high pollution periods to limit exposure to harmful particles. Policymakers should focus on measures like sandstorm prevention, afforestation, land reclamation, and wetland protection to address the environmental factors worsening air quality.
Limitations
Our study has several limitations: (1) There is no strain-based epidemiological evidence or experimental proof indicating that these particulates carry Mycobacterium tuberculosis from polluted source areas to high-incidence regions. Therefore, this article merely describes local phenomena and presents possible speculations. (2) The unevenness in our data reflects the historical development of air quality stations in Xinjiang, with stations increasing over time and the earliest records from 2012. Prior to that, few national testing stations existed, limiting spatial analysis. Additionally, lag effects between TB and air quality must be considered. (3) Our research focuses solely on macro-level statistical analysis of time and space, neglecting micro-level experimental and methodological research. (4) We exclusively consider environmental factors such as medicine and meteorology, overlooking sociological factors like population dynamics and potential confounding variables. The incidence rate of crude tuberculosis is affected by many factors. (5) The annual levels of airborne pollutants and tuberculosis incidence are shown; however, there is no statistical analysis proving the quantitative impact of air pollution on the disease.
Data availability statement
The original contributions presented in the study are included in the article/Supplementary material, further inquiries can be directed to the corresponding author.
Author contributions
BS: Data curation, Formal analysis, Resources, Software, Visualization, Writing – original draft, Writing – review & editing. CWe: Data curation, Formal analysis, Software, Writing – original draft, Writing – review & editing. CWa: Conceptualization, Data curation, Formal analysis, Investigation, Writing – original draft, Writing – review & editing. YZ: Data curation, Funding acquisition, Project administration, Resources, Supervision, Validation, Visualization, Writing – original draft, Writing – review & editing. LZ: Funding acquisition, Investigation, Resources, Supervision, Validation, Writing – original draft, Writing – review & editing.
Funding
The author(s) declare that financial support was received for the research and/or publication of this article. This work was supported by National Natural Science Foundation of China (Grant Nos. 72163033, 72064036, 72174175).
Conflict of interest
The authors declare that the research was conducted in the absence of any commercial or financial relationships that could be construed as a potential conflict of interest.
Generative AI statement
The author(s) declare that no Gen AI was used in the creation of this manuscript.
Publisher’s note
All claims expressed in this article are solely those of the authors and do not necessarily represent those of their affiliated organizations, or those of the publisher, the editors and the reviewers. Any product that may be evaluated in this article, or claim that may be made by its manufacturer, is not guaranteed or endorsed by the publisher.
Supplementary material
The Supplementary material for this article can be found online at: https://www.frontiersin.org/articles/10.3389/fpubh.2025.1519330/full#supplementary-material
Footnotes
References
1. Manisalidis, I, Stavropoulou, E, Stavropoulos, A, and Bezirtzoglou, E. Environmental and health impacts of air pollution: a review. Front Public Health. (2020) 8:14. doi: 10.3389/fpubh.2020.00014
2. Hamanaka, RB, and Mutlu, GM. Particulate matter air pollution: effects on the cardiovascular system. Front Endocrinol (Lausanne). (2018) 9:680. doi: 10.3389/fendo.2018.00680
3. Glencross, DA, Ho, TR, Camina, N, Hawrylowicz, CM, and Pfeffer, PE. Air pollution and its effects on the immune system. Free Radic Biol Med. (2020) 151:56–68. doi: 10.1016/j.freeradbiomed.2020.01.179
4. Zhou, S, Zhang, L, Lu, S, Peng, J, Li, Y, Rao, L, et al. Ambient particulate matter-associated autophagy alleviates pulmonary inflammation induced by Platanus pollen protein 3 (Pla3). Sci Total Environ. (2021) 758:143696. doi: 10.1016/j.scitotenv.2020.143696
5. Dijkhoff, IM, Drasler, B, Karakocak, BB, Petri-Fink, A, Valacchi, G, Eeman, M, et al. Impact of airborne particulate matter on skin: A systematic review from epidemiology to in vitro studies. Part Fibre Toxicol. (2020) 17:1–28. doi: 10.1186/s12989-020-00366-y
6. Ishii, M, Seki, T, Sakamoto, K, Sato, T, Sato, Y, Sato, M, et al. Effects of Asian dust on blood pressure and blood cell counts: a cross-sectional study of health check-up data. Eur Heart J. (2019) 40:ehz745.0744. doi: 10.1093/eurheartj/ehz745.0744
7. Nagappan, A, Park, SB, Lee, SJ, Lee, YJ, Lee, JH, Lee, YS, et al. Mechanistic implications of biomass-derived particulate matter for immunity and immune disorders. Toxics. (2021) 9:18. doi: 10.3390/toxics9020018
8. Yang, L, Li, C, and Tang, X. The impact of PM2.5 on the host defense of respiratory system. Front Cell Dev Biol. (2020) 8:91. doi: 10.3389/fcell.2020.00091
9. Arias-Pérez, RD, Taborda, NA, Gómez, DM, Hernández, JC, Rodríguez, J, González, M, et al. Inflammatory effects of particulate matter air pollution. Environ Sci Pollut Res. (2020) 27:42390–404. doi: 10.1007/s11356-020-10574-w
10. Nayayapathi, PP, Daka, G, Namuduri, S, Malla, RR, Kolli, SK, Srinivas, KN, et al. Particulate matter and its impact on macrophages: Unraveling the cellular response for environmental health. Crit Rev Oncog. (2024) 29:33–42. doi: 10.1615/CritRevOncog.2024053305
11. Misiukiewicz-Stepien, P, and Paplinska-Goryca, M. Biological effect of PM10 on airway epithelium-focus on obstructive lung diseases. Clin Immunol. (2021) 227:108754. doi: 10.1016/j.clim.2021.108754
12. Noda, J, Tomizawa, S, Takahashi, K, Morimoto, K, and Mitarai, S. Air pollution and airborne infection with mycobacterial bioaerosols: a potential attribution of soot. Int J Environ Sci Technol. (2022) 19:717–26. doi: 10.1007/s13762-021-03203-7
13. Pompilio, A, and Di Bonaventura, G. Ambient air pollution and respiratory bacterial infections, a troubling association: epidemiology, underlying mechanisms, and future challenges. Crit Rev Microbiol. (2020) 46:600–30. doi: 10.1080/1040841X.2020.1816894
14. Chakaya, J, Petersen, E, Nantanda, R, Mungai, B, Migliori, GB, Zumla, A, et al. The WHO Global Tuberculosis 2021 Report–not so good news and turning the tide back to End TB. Int J Infect Dis. (2022) 124:S26–9. doi: 10.1016/j.ijid.2022.03.011
15. Ragonnet, R, Trauer, JM, Geard, N, Scott, N, and McBryde, ES. Profiling Mycobacterium tuberculosis transmission and the resulting disease burden in the five highest tuberculosis burden countries. BMC Med. (2019) 17:208. doi: 10.1186/s12916-019-1452-0
16. Stein, ML. Interpolation of Spatial Data: Some Theory for Kriging. New York: Springer Science & Business Media (2012).
17. Kim, IS, Kim, YP, and Wee, D. Potential source density function: a new tool for identifying air pollution sources. Aerosol Air Qual Res. (2022) 22:210236. doi: 10.4209/aaqr.210236
18. Guo, J, and Feng, Z. Study on spatial temporal distribution characteristics of air quality index in Beijing and its correlation with local meteorological conditions. Discret Dyn Nat Soc. (2019) 2019:1–15. doi: 10.1155/2019/1462034
19. Chen, Y, He, S, and Luo, B. Seasonal variations of transport pathways and potential sources of PM2.5 in Chengdu, China (2012–2013). Front Environ Sci Eng. (2018) 12:1–11. doi: 10.1007/s11783-018-1050-9
20. Hsu, YK, Holsen, TM, and Hopke, PK. Comparison of hybrid receptor models to locate PCB sources in Chicago. Atmos Environ. (2003) 37:545–62. doi: 10.1016/S1352-2310(02)00886-5
21. Yu, H, Yang, W, Wang, X, Yin, B, Zhang, X, Wang, J, et al. A seriously sand storm mixed air-polluted area in the margin of Tarim Basin: Temporal-spatial distribution and potential sources. Sci Total Environ. (2019) 676:436–46. doi: 10.1016/j.scitotenv.2019.04.298
22. Querol, X, Tobías, A, Pérez, N, Karanasiou, A, Amato, F, Stafoggia, M, et al. Monitoring the impact of desert dust outbreaks for air quality for health studies. Environ Int. (2019) 130:104867. doi: 10.1016/j.envint.2019.05.061
23. Thompson, JA, Burbank, DW, Li, T, Chen, J, Bookhagen, B, Yang, X, et al. Late Miocene northward propagation of the northeast Pamir thrust system, northwest China. Tectonics. (2015) 34:510–34. doi: 10.1002/2014TC003690
24. Lin, J, Lei, J, Yang, Z, Zhang, Y, Wang, Y, Zhang, Y, et al. Differentiation of rural development driven by natural environment and urbanization: a case study of Kashgar region, Northwest China. Sustain For. (2019) 11:6859. doi: 10.3390/su11236859
25. Zhang, R, Li, L, Nai, W, Zhang, Y, Wang, Y, Zhang, Y, et al. Astronomical forcing of terrestrial climate recorded in the Pleistocene of the western Tarim Basin, NW China. Palaeogeogr Palaeoclimatol Palaeoecol. (2019) 530:78–89. doi: 10.1016/j.palaeo.2019.05.039
26. Liu, Q, Zhang, Y, Wang, Y, Zhang, Y, Wang, Y, Zhang, Y, et al. Air pollutants in bronchoalveolar lavage fluid and pulmonary tuberculosis: a mediation analysis of gene-specific methylation. iScience. (2023) 26:107907. doi: 10.1016/j.isci.2023.107907
27. American Thoracic Society. Targeted tuberculin testing and treatment of latent tuberculosis infection. Am J Respir Crit Care Med. (2000) 161:S221–47. doi: 10.1164/ajrccm.161.4.ats6-00
28. Song, J, Zhang, Y, Wang, Y, Zhang, Y, Wang, Y, Zhang, Y, et al. A systematic review and meta-analysis of the association between air pollutants and the incidence of tuberculosis. Heliyon. (2024) 10:e12147. doi: 10.1016/j.heliyon.2024.e12147
29. Plaia, A, and Ruggieri, M. Air quality indices: A review. Rev Environ Sci Biotechnol. (2011) 10:165–79. doi: 10.1007/s11157-010-9227-2
30. Yu, S, Wang, Z, and Li, Y. Time and space-variant system reliability analysis through adaptive kriging and weighted sampling. Mech Syst Signal Process. (2022) 166:108443. doi: 10.1016/j.ymssp.2021.108443
31. Berriban, I, Azahra, M, Chham, E, Ferro-García, MA, Milena-Pérez, A, Nouayti, A, et al. PSCF and CWT methods as a tool to identify potential sources of 7Be and 210Pb aerosols in Granada, Spain. J Environ Radioact. (2022) 251–252:106977. doi: 10.1016/j.jenvrad.2022.106977
32. Zachary, M, Yin, L, and Zacharia, M. Application of PSCF and CWT to identify potential sources of aerosol optical depth in ICIPE Mbita. Open Access Libr J. (2018) 5:1–12. doi: 10.4236/oalib.1104487
33. Zhang, H, Cheng, S, Wang, X, Yao, S, Zhu, F, Zhang, J, et al. Continuous monitoring, compositions analysis and the implication of regional transport for submicron and fine aerosols in Beijing, China. Atmos Environ. (2018) 195:30–45. doi: 10.1016/j.atmosenv.2018.09.043
34. Xia, L, Zhu, B, Wang, H, Kang, H, and An, J. Characterization and source apportionment of fine particles during a heavy pollution episode over the Yangtze River Delta, China. Sci Lett. (2020) 8:1–8. doi: 10.11648/j.sci.20200801.11
35. Zhang, G, and Zhang, N. Environmental regulation and worker earnings: evidence from city-level air quality standards in China. Energy Econ. (2024) 138:107834. doi: 10.1016/j.eneco.2024.107834
36. Altman, MC, Kattan, M, O'Connor, GT, Gold, DR, Wood, RA, Gergen, PJ, et al. Associations between outdoor air pollutants and non-viral asthma exacerbations and airway inflammatory responses in children and adolescents living in urban areas in the USA: a retrospective secondary analysis. Lancet Planet Health. (2023) 7:e33–44. doi: 10.1016/S2542-5196(22)00302-3
37. Gawda, A, Majka, G, Nowak, B, and Marcinkiewicz, J. Air pollution, oxidative stress, and exacerbation of autoimmune diseases. Cent Eur J Immunol. (2017) 3:305–12. doi: 10.5114/ceji.2017.70975
38. Gorini, F, Sabatino, L, Gaggini, M, Saponaro, C, De Gennaro, G, De Palma, G, et al. Oxidative stress biomarkers in the relationship between type 2 diabetes and air pollution. Antioxidants. (2021) 10:1234. doi: 10.3390/antiox10081234
39. Sarkar, S, Rivas-Santiago, CE, Ibironke, OA, Ghosh, S, Saha, B, Saha, S, et al. Season and size of urban particulate matter differentially affect cytotoxicity and human immune responses to Mycobacterium tuberculosis. PLoS One. (2019) 14:e0219122. doi: 10.1371/journal.pone.0219122
40. Environmental Health Perspectives. Ambient air pollution and tuberculosis incidence in the United States: a cohort study. Environ Health Perspect. (2021) 129:077007. doi: 10.1289/EHP7571
41. Gališanka, M, and Kasyanov, A. Dust storms and their impact on the transmission of tuberculosis in Central Asia. Environ Pollut. (2020) 267:115487. doi: 10.1016/j.envpol.2020.115487
42. Zhang, H, Wang, Y, Hu, J, Zhang, Y, and Li, Y. Comparative analysis of tuberculosis transmission in desert vs. temperate climates: a cross-regional study. Lancet Infect Dis. (2021) 21:578–87. doi: 10.1016/S1473-3099(21)00159-1
43. Smith, J, Johnson, M, Williams, R, Brown, T, Jones, P, Davis, S, et al. Environmental conditions and tuberculosis transmission in dry and semi-dry regions of the world: a review of global data. Tuberculosis. (2019) 117:45–51. doi: 10.1016/j.tube.2019.06.001
44. Che, W, Zhang, Y, Lin, C, Wang, Y, and Li, Y. Impacts of pollution heterogeneity on population exposure in dense urban areas using ultra-fine resolution air quality data. J Environ Sci. (2023) 125:513–23. doi: 10.1016/j.jes.2022.02.041
45. Meliker, JR, and Sloan, CD. Spatio-temporal epidemiology: principles and opportunities. Spat Spatiotemporal Epidemiol. (2011) 2:1–9. doi: 10.1016/j.sste.2010.10.001
46. Kiani, B, Raouf Rahmati, A, Bergquist, R, and Kiani, B. Spatio-temporal epidemiology of the tuberculosis incidence rate in Iran 2008 to 2018. BMC Public Health. (2021) 21:1–20. doi: 10.1186/s12889-021-10647-0
47. Liu, Y, Pan, J, Zhang, H, Chen, H, Wang, W, Li, J, et al. Short-term exposure to ambient air pollution and asthma mortality. Am J Respir Crit Care Med. (2019) 200:24–32. doi: 10.1164/rccm.201810-1823OC
48. Cohen, AJ, Brauer, M, Burnett, R, Anderson, HR, Frostad, J, Estep, K, et al. Estimates and 25-year trends of the global burden of disease attributable to ambient air pollution: an analysis of data from the global burden of diseases study 2015. Lancet. (2017) 389:1907–18. doi: 10.1016/S0140-6736(17)30505-6
49. Lin, HH, Ezzati, M, and Murray, M. Tobacco smoke, indoor air pollution and tuberculosis: a systematic review and meta-analysis. PLoS Med. (2007) 4:e20. doi: 10.1371/journal.pmed.0040020
50. Maté, T, Guaita, R, Pichiule, M, Rodríguez, A, Linares, C, Díaz, J, et al. Short-term effect of fine particulate matter (PM2.5) on daily mortality due to diseases of the circulatory system in Madrid (Spain). Sci Total Environ. (2010) 408:5750–7. doi: 10.1016/j.scitotenv.2010.07.083
51. Pope, CA III, Ezzati, M, and Dockery, DW. Fine-particulate air pollution and life expectancy in the United States. N Engl J Med. (2009) 360:376–86. doi: 10.1056/NEJMsa0805646
52. Brauer, M, Freedman, G, Frostad, J, Van Donkelaar, A, Martin, RV, Dentener, F, et al. Ambient air pollution exposure estimation for the global burden of disease 2013. Environ Sci Technol. (2016) 50:79–88. doi: 10.1021/acs.est.5b03709
53. Thurston, GD, Ahn, J, Cromar, KR, Foreman, RG, Gardiner, K, Hoh, E, et al. Ambient particulate matter air pollution exposure and mortality in the NIH-AARP diet and health cohort. Environ Health Perspect. (2016) 124:484–90. doi: 10.1289/ehp.1509676
54. Ji, W, Xie, N, He, D, Wang, W, Li, H, and Wang, K. Age-period-cohort analysis on the time trend of hepatitis B incidence in four prefectures of southern Xinjiang, China from 2005 to 2017. Int J Environ Res Public Health. (2019) 16:3886. doi: 10.3390/ijerph16203886
55. He, X, Cao, M, Mahapatra, T, Du, X, Mahapatra, S, Li, Q, et al. Burden of tuberculosis in Xinjiang between 2011 and 2015: a surveillance data-based study. PLoS One. (2017) 12:e0187592. doi: 10.1371/journal.pone.0187592
56. Li, X, Dong, W, Liu, Y, and Yang, Y. Tracking the urban expansion and its driving mechanisms behind Xinjiang production and construction corps (XPCC): evidence from morphology and landscapes. Habitat Int. (2022) 126:102599. doi: 10.1016/j.habitatint.2022.102599
57. Zhan, L, Li, N, Li, C, Sang, X, and Ma, J. Evaluation method of equalization of basic medical services from the spatial perspective: the case of Xinjiang, China. ISPRS Int J Geo Inf. (2022) 11:612. doi: 10.3390/ijgi11120612
58. Xu, Q, Li, J, Zhang, S, Yuan, Q, and Ren, P. Spatio-temporal changes and driving mechanisms of vegetation net primary productivity in Xinjiang, China from 2001 to 2022. Land. (2024) 13:1305. doi: 10.3390/land13081305
59. Jin, L, He, Q, Li, Z, Wang, Y, Zhang, Y, Li, N, et al. Variation characteristics of dust in the Taklimakan Desert. Nat Hazards. (2024) 120:2129–53. doi: 10.1007/s11069-023-06269-3
60. Li, L, Li, Z, Chang, W, Ou, Y, Goloub, P, Li, C, et al. Aerosol solar radiative forcing near the Taklimakan Desert based on radiative transfer and regional meteorological simulations during the dust aerosol observation-Kashi campaign. Atmos Chem Phys. (2020) 20:10845–64. doi: 10.5194/acp-20-10845-2020
61. Zhang, Y, Xu, H, Zhang, Y, Luo, J, Chen, F, Cao, B, et al. Analysis of air pollutants and their potential sources in eastern Xinjiang, northwestern inland China, from 2018 to 2022. Atmos. (2023) 14:1670. doi: 10.3390/atmos14111670
62. Li, J, Wang, S, Chu, J, Wang, J, Li, X, Yue, M, et al. Characteristics of air pollution events over Hotan prefecture at the southwestern edge of Taklimakan Desert, China. J Arid Land. (2018) 10:686–700. doi: 10.1007/s40333-018-0096-9
63. Tusun, D, Abulimiti, M, Mamuti, X, Liu, Z, Xu, D, Li, G, et al. The epidemiological characteristics of pulmonary tuberculosis—Kashgar prefecture, Xinjiang Uygur autonomous region, China, 2011–2020. China CDC Wkly. (2021) 3:557–61. doi: 10.46234/ccdcw2021.144
64. Wen, Y, Xiao, J, Yang, J, Wang, Y, Zhang, Y, Li, Z, et al. Quantitatively disentangling the geographical impacts of topography on PM2.5 pollution in China. Remote Sens. (2022) 14:6309. doi: 10.3390/rs14246309
65. Wang, W, Guo, W, Cai, J, Guo, W, Liu, R, Liu, X, et al. Epidemiological characteristics of tuberculosis and effects of meteorological factors and air pollutants on tuberculosis in Shijiazhuang, China: a distribution lag non-linear analysis. Environ Res. (2021) 195:110310. doi: 10.1016/j.envres.2020.110310
66. Wang, S, Wu, G, Du, Z, Wang, Y, Zhang, Y, Li, Z, et al. The causal links between long-term exposure to major PM2.5 components and the burden of tuberculosis in China. Sci Total Environ. (2023) 870:161745. doi: 10.1016/j.scitotenv.2023.161745
67. Min, KD, Kim, SY, and Cho, S. Ambient PM2.5 exposures could increase risk of tuberculosis recurrence. Environ Health Prev Med. (2023) 28:48. doi: 10.1265/ehpm.23-00131
68. Nie, Y, Yang, Z, Lu, Y, Bahani, M, Zheng, Y, Tian, M, et al. Interaction between air pollutants and meteorological factors on pulmonary tuberculosis in Northwest China: a case study of eight districts in Urumqi. Int J Biometeorol. (2024) 68:691–700. doi: 10.1007/s00484-023-02615-z
69. Li, J, Lei, J, Li, S, Yang, Z, Tong, Y, Zhang, S, et al. Spatiotemporal analysis of the relationship between urbanization and the eco-environment in the Kashgar metropolitan area, China. Ecol Indic. (2022) 135:108524. doi: 10.1016/j.ecolind.2021.108524
70. Tsunematsu, N, Kai, K, and Matsumoto, T. The influence of synoptic-scale air flow and local circulation on the dust layer height in the north of the Taklimakan Desert. Water Air Soil Pollut Focus. (2005) 5:175–93. doi: 10.1007/s11267-005-0734-z
71. Madibekov, A, and Kogutenko, L. The Issue of transporting pollutants with atmospheric precipitation. IOP Conf Ser Earth Environ Sci. (2018) 107:012064. doi: 10.1088/1755-1315/107/1/012064
Keywords: air contaminant, pulmonary tuberculosis, unique topography, spatiotemporal distribution characteristics, source analysis
Citation: Shang B, Wei C, Wang C, Zheng Y and Zhang L (2025) Interactions among tuberculosis, geographic environment and aerosols: evidence from the Kashgar region of China. Front. Public Health. 13:1519330. doi: 10.3389/fpubh.2025.1519330
Edited by:
Eugenia Bezirtzoglou, Democritus University of Thrace, GreeceReviewed by:
Mihaela Mihai, Bucharest University of Economic Studies, RomaniaZheng Qi, Harbin University of Commerce, China
Zhengbin Zhang, Wuhan Institute for Tuberculosis Control, China
Copyright © 2025 Shang, Wei, Wang, Zheng and Zhang. This is an open-access article distributed under the terms of the Creative Commons Attribution License (CC BY). The use, distribution or reproduction in other forums is permitted, provided the original author(s) and the copyright owner(s) are credited and that the original publication in this journal is cited, in accordance with accepted academic practice. No use, distribution or reproduction is permitted which does not comply with these terms.
*Correspondence: Liping Zhang, emhhbmdscDEyMTlAMTYzLmNvbQ==
†These authors have contributed equally to this work
 Bo Shang
 Chengjing Wei
 Chenchen Wang4
 Yanling Zheng
 Liping Zhang


