
94% of researchers rate our articles as excellent or good
Learn more about the work of our research integrity team to safeguard the quality of each article we publish.
Find out more
ORIGINAL RESEARCH article
Front. Public Health , 17 March 2025
Sec. Public Health Education and Promotion
Volume 13 - 2025 | https://doi.org/10.3389/fpubh.2025.1490439
 Tingting Ou1†
 Juan Jiang1†
 Dingwei Sun1Ying Liu1Changfu Xiong2Xiaohuan Wang1Xue Zhou1Hongying Wu1Lijie Zhang3
 Chao Wang3,4*Bin He2*
Background: Alcohol consumption is a significant risk factor for premature mortality and increased disease burden worldwide, especially among young and middle-aged individuals. This study aims to evaluate drinking patterns and alcohol consumption among adults in Hainan Province, while also identifying associated factors.
Methods: Analyses based on the 2022 “2 + 3” epidemiological survey in Hainan were conducted, and the drinking types, quantities, and frequencies among local residents were described. Chi-square tests and multiple linear regression were employed for the statistical analysis.
Results: A total of 32,857 adults participated, yielding an overall drinking rate of 42.8%. The drinking rate was significantly higher among men (64.4%) than women (18.9%). The highest drinking rates were found in the 30–59 age group, especially among individuals aged 30–39. Ethnic minorities had a higher drinking rate (70.1%) than Han individuals. Lower educational attainment was associated with lower drinking rates, although the prevalence of active drinkers was higher. Men preferred strong liquor and beer, whereas women favored beer and rice wine. The average weekly alcohol consumption was 59.8 mL for men and 10.9 mL for women, with 43.6% of men exceeding 100 mL weekly, compared to 12.7% of women.
Conclusion: This study emphasizes the complexity and diversity of drinking behaviors among adults in Hainan Province. Sociodemographic factors, including gender, age, ethnicity, education, marital status, occupation, and region, are closely linked to drinking behaviors. The findings provide a scientific basis for developing targeted public health strategies, highlighting the need for effective interventions to mitigate alcohol-related health issues among high-risk populations.
Alcohol consumption is a well-established risk factor for premature mortality and increased disease burden, especially among young and middle-aged populations. It surpasses other factors such as high body mass index, hypertension, and dietary risks (1–3). According to the World Health Organization’s 2024 report, approximately 400 million individuals worldwide have alcohol use disorders, with 209 million suffering from alcohol dependence. This situation led to about 2.6 million alcohol-related deaths in 2019 (4). The International Agency for Research on Cancer’s 2020 report estimates that approximately 741,000 new cancer cases globally are attributable to alcohol, accounting for 4.1% of all new cases that year. Notably, three-quarters of these alcohol-related cases occurred in men (5). Drinking behavior has been a significant focus in public health and social management, especially among young and middle-aged men. Their high drinking frequency and alcohol intake considerably impact health and social functioning (6, 7).
Approximately 1.6 million deaths worldwide each year are attributed to non-communicable diseases related to alcohol. This includes about 474,000 deaths from cardiovascular diseases and 401,000 from cancer. Additionally, around 724,000 deaths are due to injuries, such as traffic accidents and self-harm (4). Furthermore, alcohol suppresses immune function, increasing the risk of infectious diseases. In 2019, approximately 284,000 deaths globally were linked to alcohol-related infections (4). To effectively address the substantial disease burden caused by alcohol, the World Health Organization has launched the “2022–2030 Global Alcohol Action Plan.” The goal is to reduce harmful drinking by 20% compared to 2010 levels (8). While global alcohol consumption trends downward, China’s consumption continues to rise, with a 76% increase from 2005 to 2016. However, the abstinence rate has decreased from 50.9 to 42.1% (8). Therefore, strict control of alcohol consumption in China remains crucial.
Alcohol consumption exhibits notable demographic characteristics. Worldwide, drinking rates and alcohol-related health issues are generally higher among men than women, with episodic binge drinking being more prevalent (9). Distinct differences in drinking patterns exist across gender, age, geographic regions, and economic groups, highlighting the need for targeted alcohol consumption management. Currently, there is a lack of clear reporting on drinking types, quantities, and patterns among various demographic groups in China. This study aims to systematically assess alcohol consumption among adults in Hainan Province, highlighting differences in drinking patterns and alcohol intake across various demographic characteristics. The findings will provide a scientific basis for public health policy development, assist in identifying high-risk populations, and promote more refined and personalized intervention strategies.
Data for this study were obtained from the 2022 “2 + 3” epidemiological sampling survey in Hainan Province, focusing on local residents and migrant populations to analyze drinking types, quantities, and corresponding alcohol consumption. In order to accurately understand the epidemic situation of hypertension, diabetes, tuberculosis, viral hepatitis (hepatitis Z and hepatitis C) and serious mental disorders (referred to as “2 + 3” diseases) and behavioral factors influencing public health in Hainan Province, the local government conducted the epidemic investigation. The present study aims to report the drinking patterns and alcohol consumption across demographic characteristics, providing a scientific basis for public health policy and facilitating the identification of high-risk populations.
The study included residents aged 18 and older from Hainan Province, gathering demographic information such as gender (male, female), age, ethnicity (Han, minority), education level (primary or below, junior high, senior high, college or above), marital status (married, unmarried), occupation (agriculture, employed, student, other/unemployed), and geographic area (urban, rural). The sampling method for this survey is a two-stage unequal proportion cluster sampling. All of the village committees in cities, counties, and districts in Hainan Province were numbered and randomly selected weighted by the local population.
We assessed whether participants consumed alcohol in the past 12 months.
Participants consumed beer, high-proof liquor, low-proof liquor, wine, and yellow rice wine.
Average consumption per drinking time was collected, measured in “liang” (50 mL) for all types except beer, which was measured in milliliters.
Past 12-month drinking frequency was documented and categorized as daily, 5–6 days per week, 3–4 days per week, 1–2 days per week, 1–3 days per month, or less than once per month. Drinking frequency was defined as follows: drinking on ≥5 days per week was classified as “active,” 1–4 days per week as “moderately active,” and ≤ 3 days per month as “inactive.”
The average alcohol content was estimated for each type: beer (4%), high-proof liquor (50%), low-proof liquor (35%), wine (15%), and yellow rice wine (18%). Weekly pure alcohol intake was calculated using the formula: alcohol type content × drinking frequency × average drinking quantity, reported in milliliters.
Chi-square tests were used to perform group comparisons for categorical variables, including drinking rates. Weekly alcohol intake was estimated based on average drinking quantity, types of alcohol consumed, and drinking frequency. The natural logarithm and exponential of the average weekly intake were calculated according to its distribution characteristics. Multiple linear regression and multivariable logistic regression analyses were conducted to assess the impact of various demographic characteristics on weekly alcohol intake. A significance level of α = 0.05 was employed, and data were analyzed using R version 4.3.2.
This study included 32,857 adults from Hainan Province, of whom 17,733 (54.0%) were female. The overall drinking rate was 41.4%, with a weighted rate of 42.8%. The drinking rates were 64.4% for males and 18.9% for females. Among various age groups, adults aged 30–59 exhibited higher drinking rates, peaking at 50.3% in the 30–39 age group. Overall, the drinking rate initially increased before gradually declining, peaking at age 31 for males. In contrast, females experienced a brief rise from ages 18 to 20 before a decline (Figure 1). The drinking rate among ethnic minorities was significantly higher at 70.1%, compared to 36.8% for Han individuals. The majority of the population had a junior high education or less, with the lowest drinking rate of 31.3% observed among those with primary education or below, which was significantly lower than rates for higher educational levels. The drinking rate for married individuals was 40.4%, significantly lower than the 52.3% rate for unmarried individuals. The largest percentage of participants were farmers (52.3%), with a weighted drinking rate of 45.0%, which was lower than that of employed individuals at 51.7%. Drinking rates for urban and rural residents were similar, at 42.6 and 42.9%, respectively (Table 1). The highest drinking rates were found to be over 80% among male ethnic minorities aged 18–59 years. Drinking rates decreased from 21.8 to 3.7% with ages increased among Han female population, while around 50% ethnic minorities females drink at all age stages.
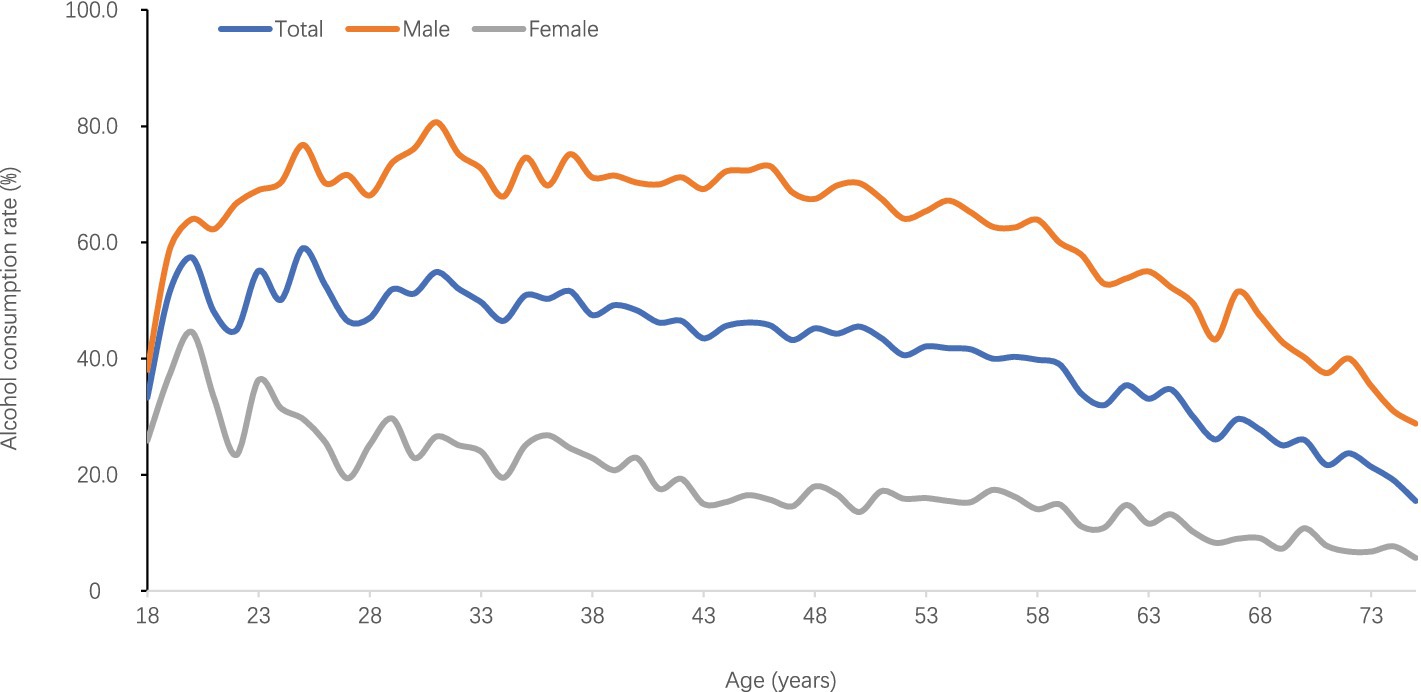
Figure 1. Alcohol consumption rate by age group.
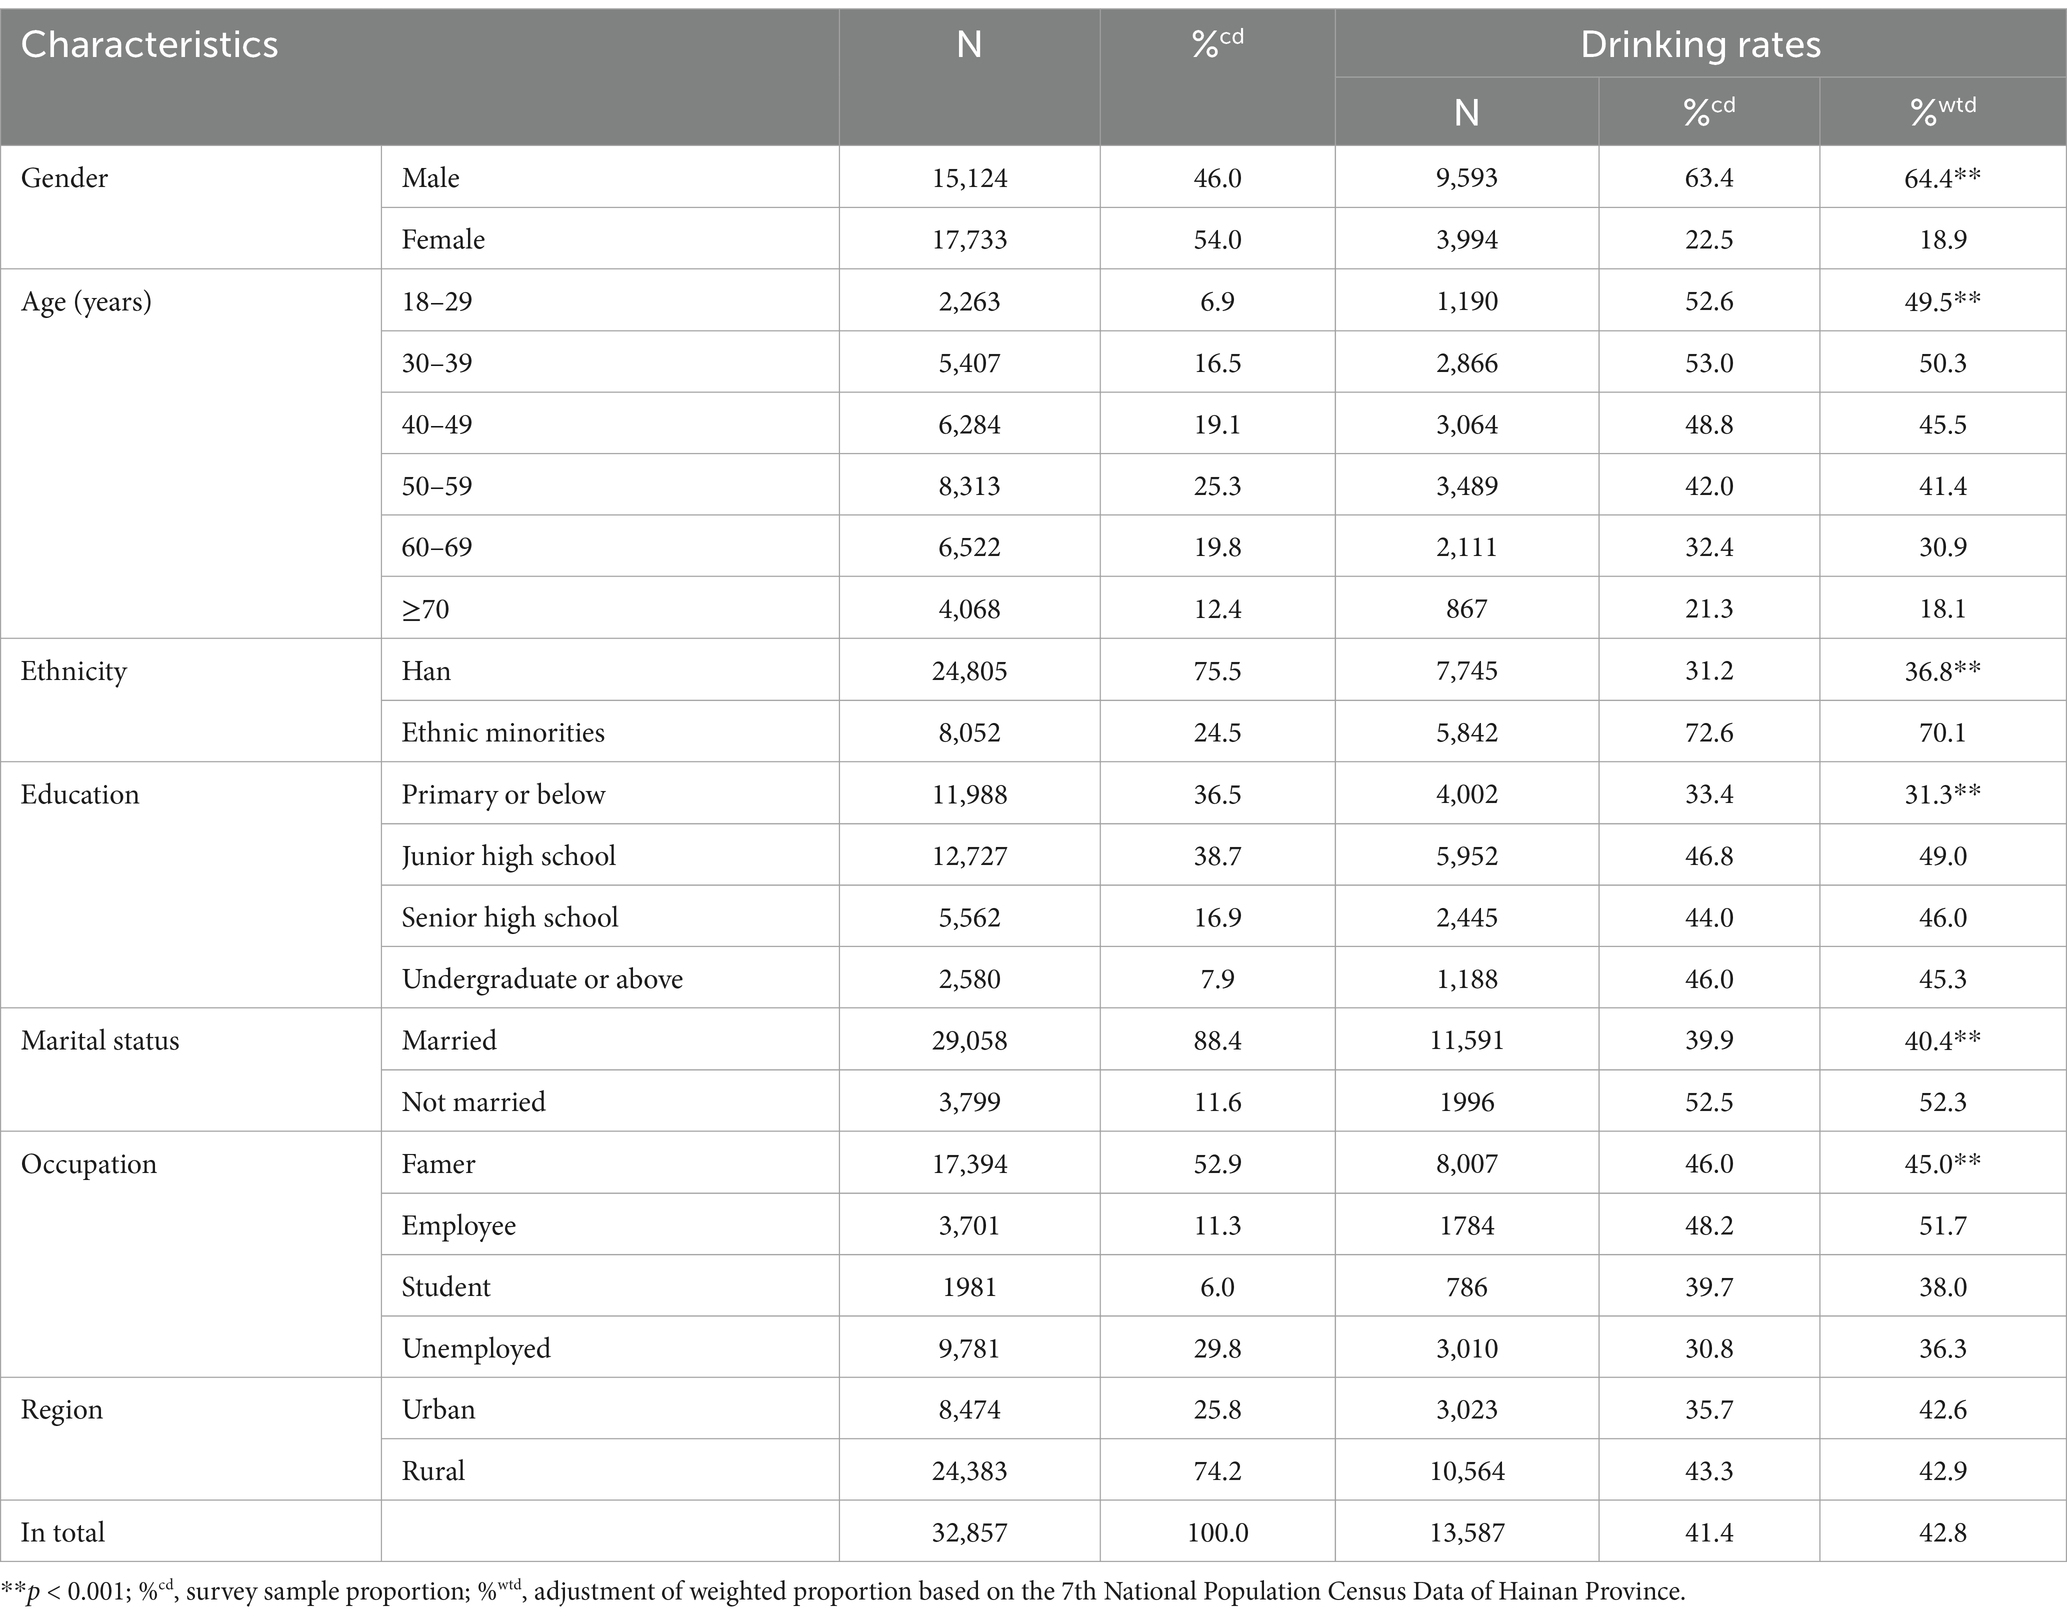
Table 1. Demographic information and drinking rates of participants.
The distribution of overall drinking frequency shows that individuals consuming alcohol for ≥5 days per week form the smallest active drinking group at 24.4%. In contrast, those drinking for ≤3 days per month comprise the largest inactive group at 43.2%. Notably, the proportion of active male drinkers (27.7%) is significantly higher than that of female drinkers (11.7%). The active drinking rate increases with age, with more than 40% of individuals aged 60 and above classified as active drinkers. Meanwhile, the proportion of individuals drinking alcohol 1–4 days per week gradually decreases. However, the decline in inactive drinkers is relatively small, and this trend is more pronounced among male drinkers (Table 2; Figures 2A–C). Regarding educational background, individuals with elementary education or less have a lower overall drinking rate but a significantly higher active drinking proportion of 36.2%, compared to just 10.3% among those with a bachelor’s degree or higher. Similarly, among agricultural workers, the overall drinking rate is lower than that of office workers; however, the active drinking rate is markedly higher than that of non-agricultural groups, with students showing the lowest active drinking rate at 10.1%. The active drinking rate in rural populations is significantly higher than that in urban populations.
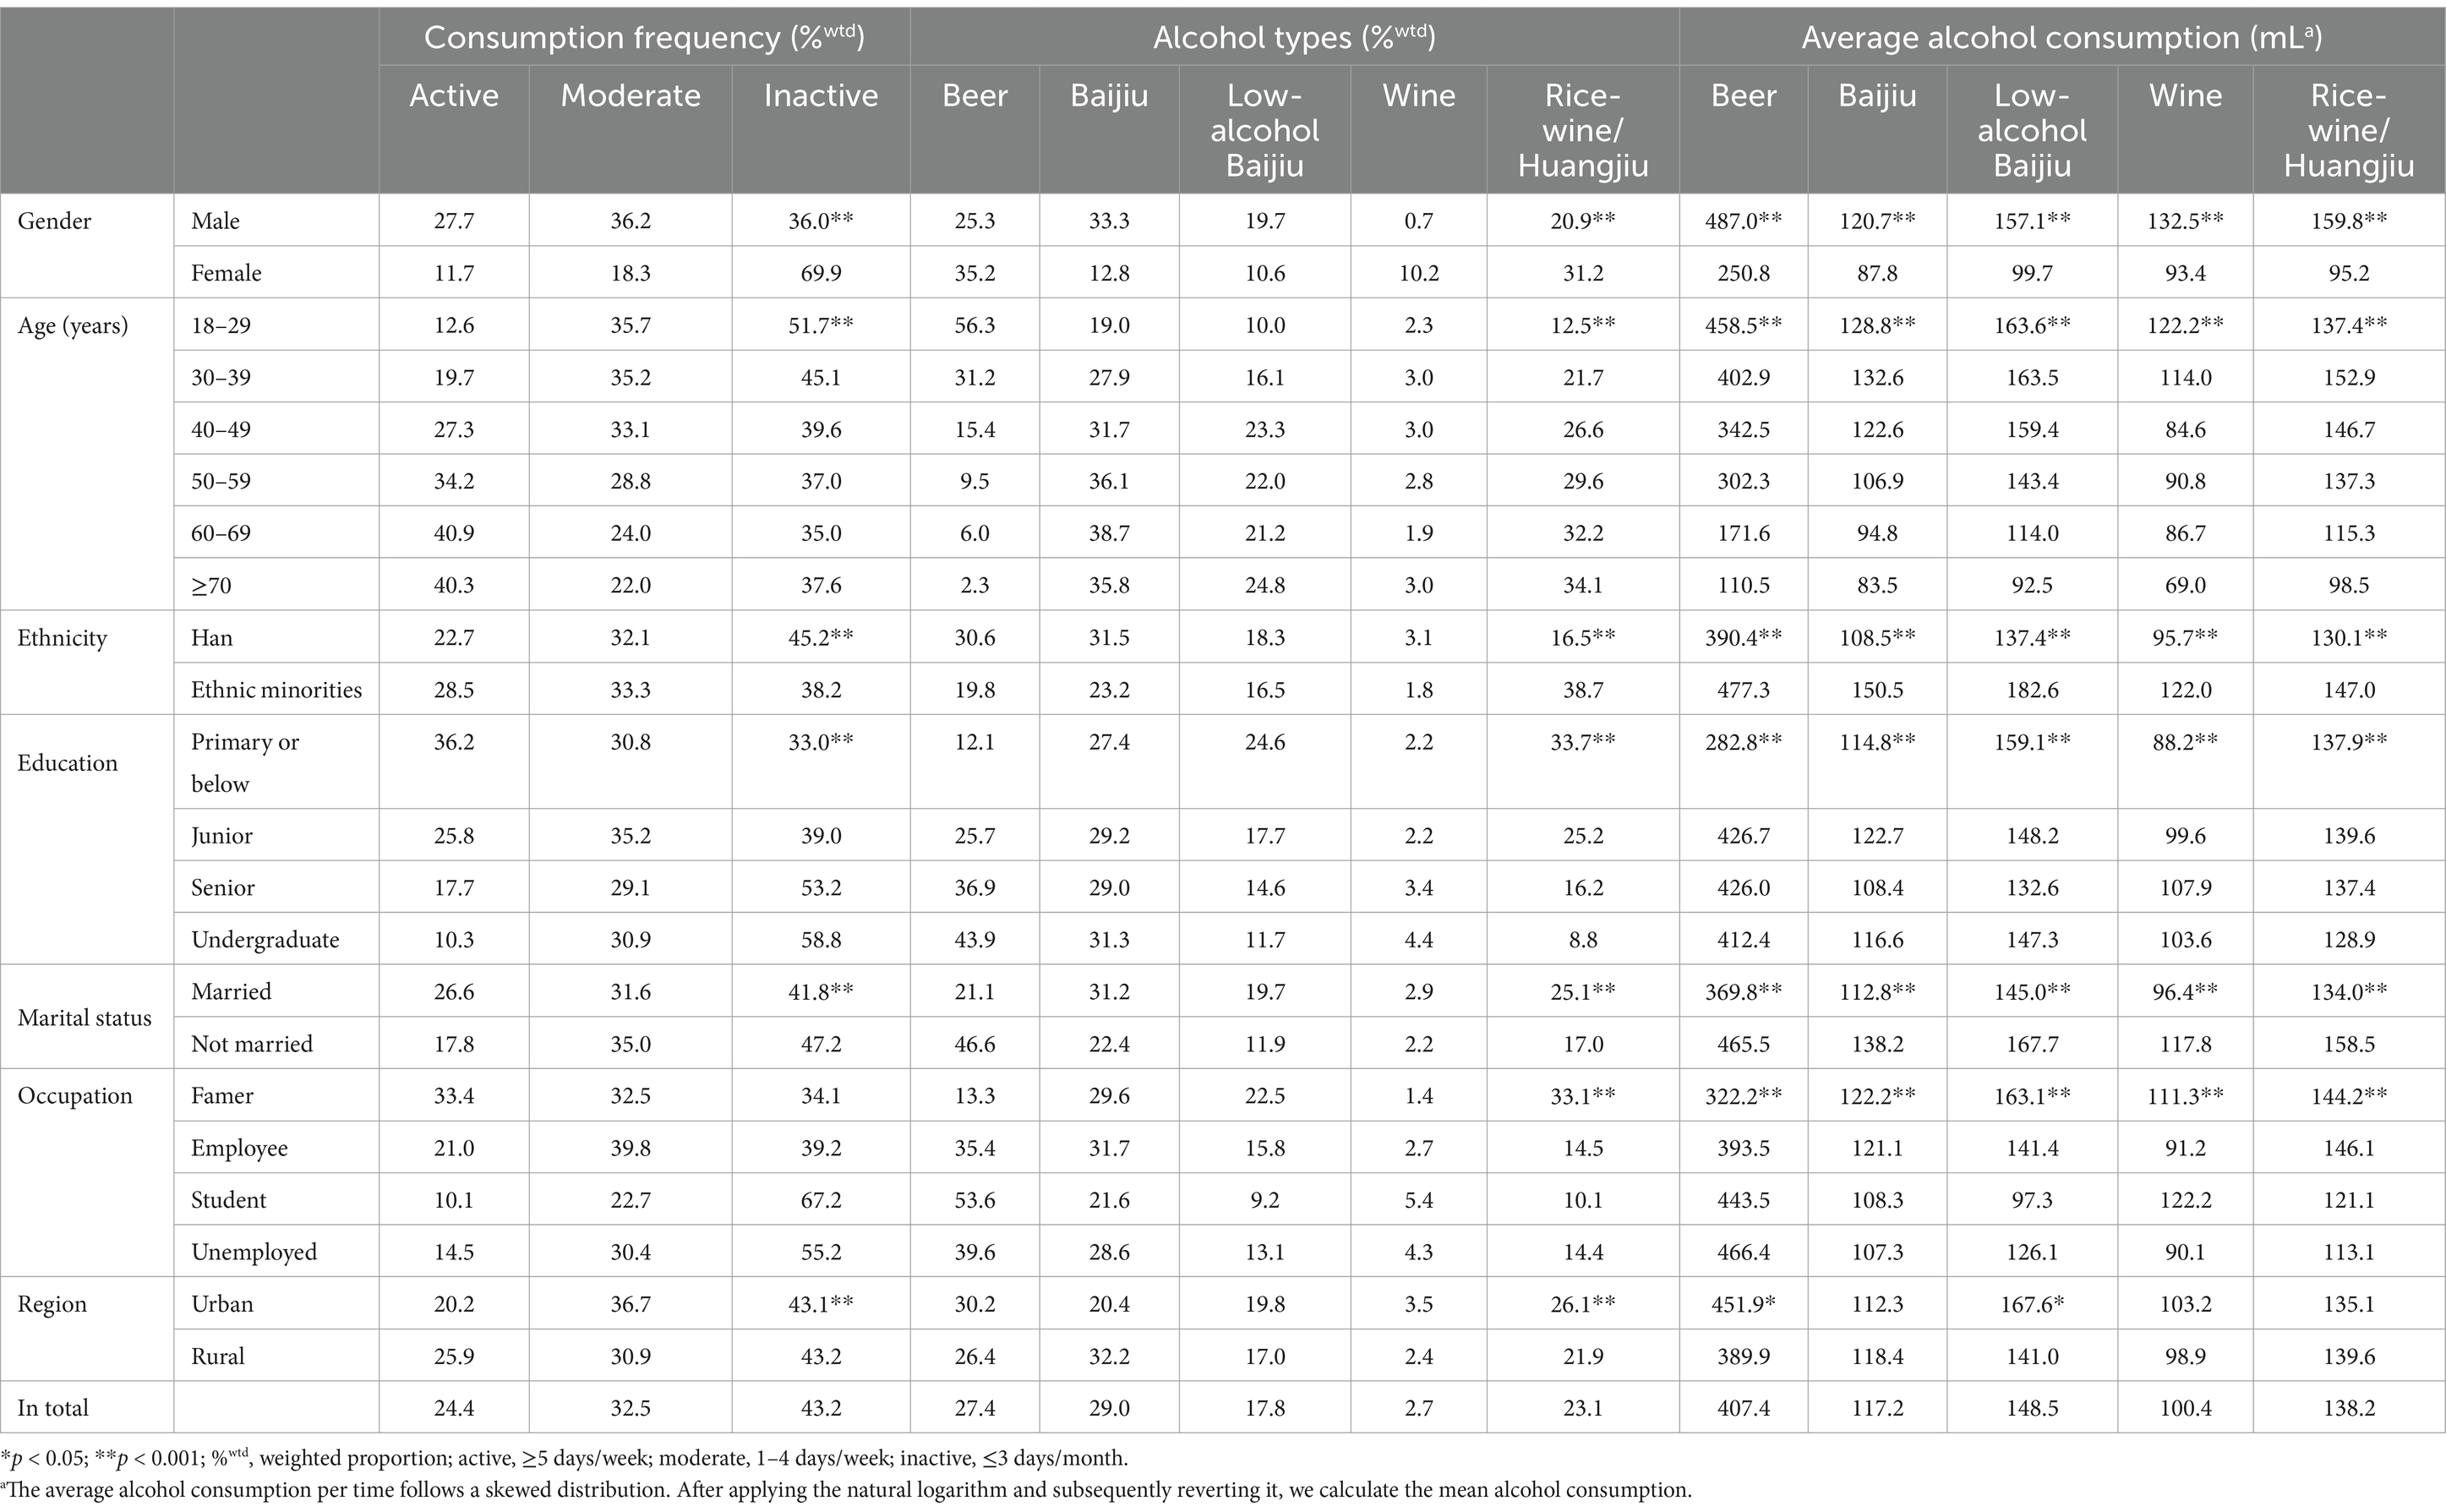
Table 2. Distribution characteristics of alcohol consumption frequency and types among adults in Hainan Province.
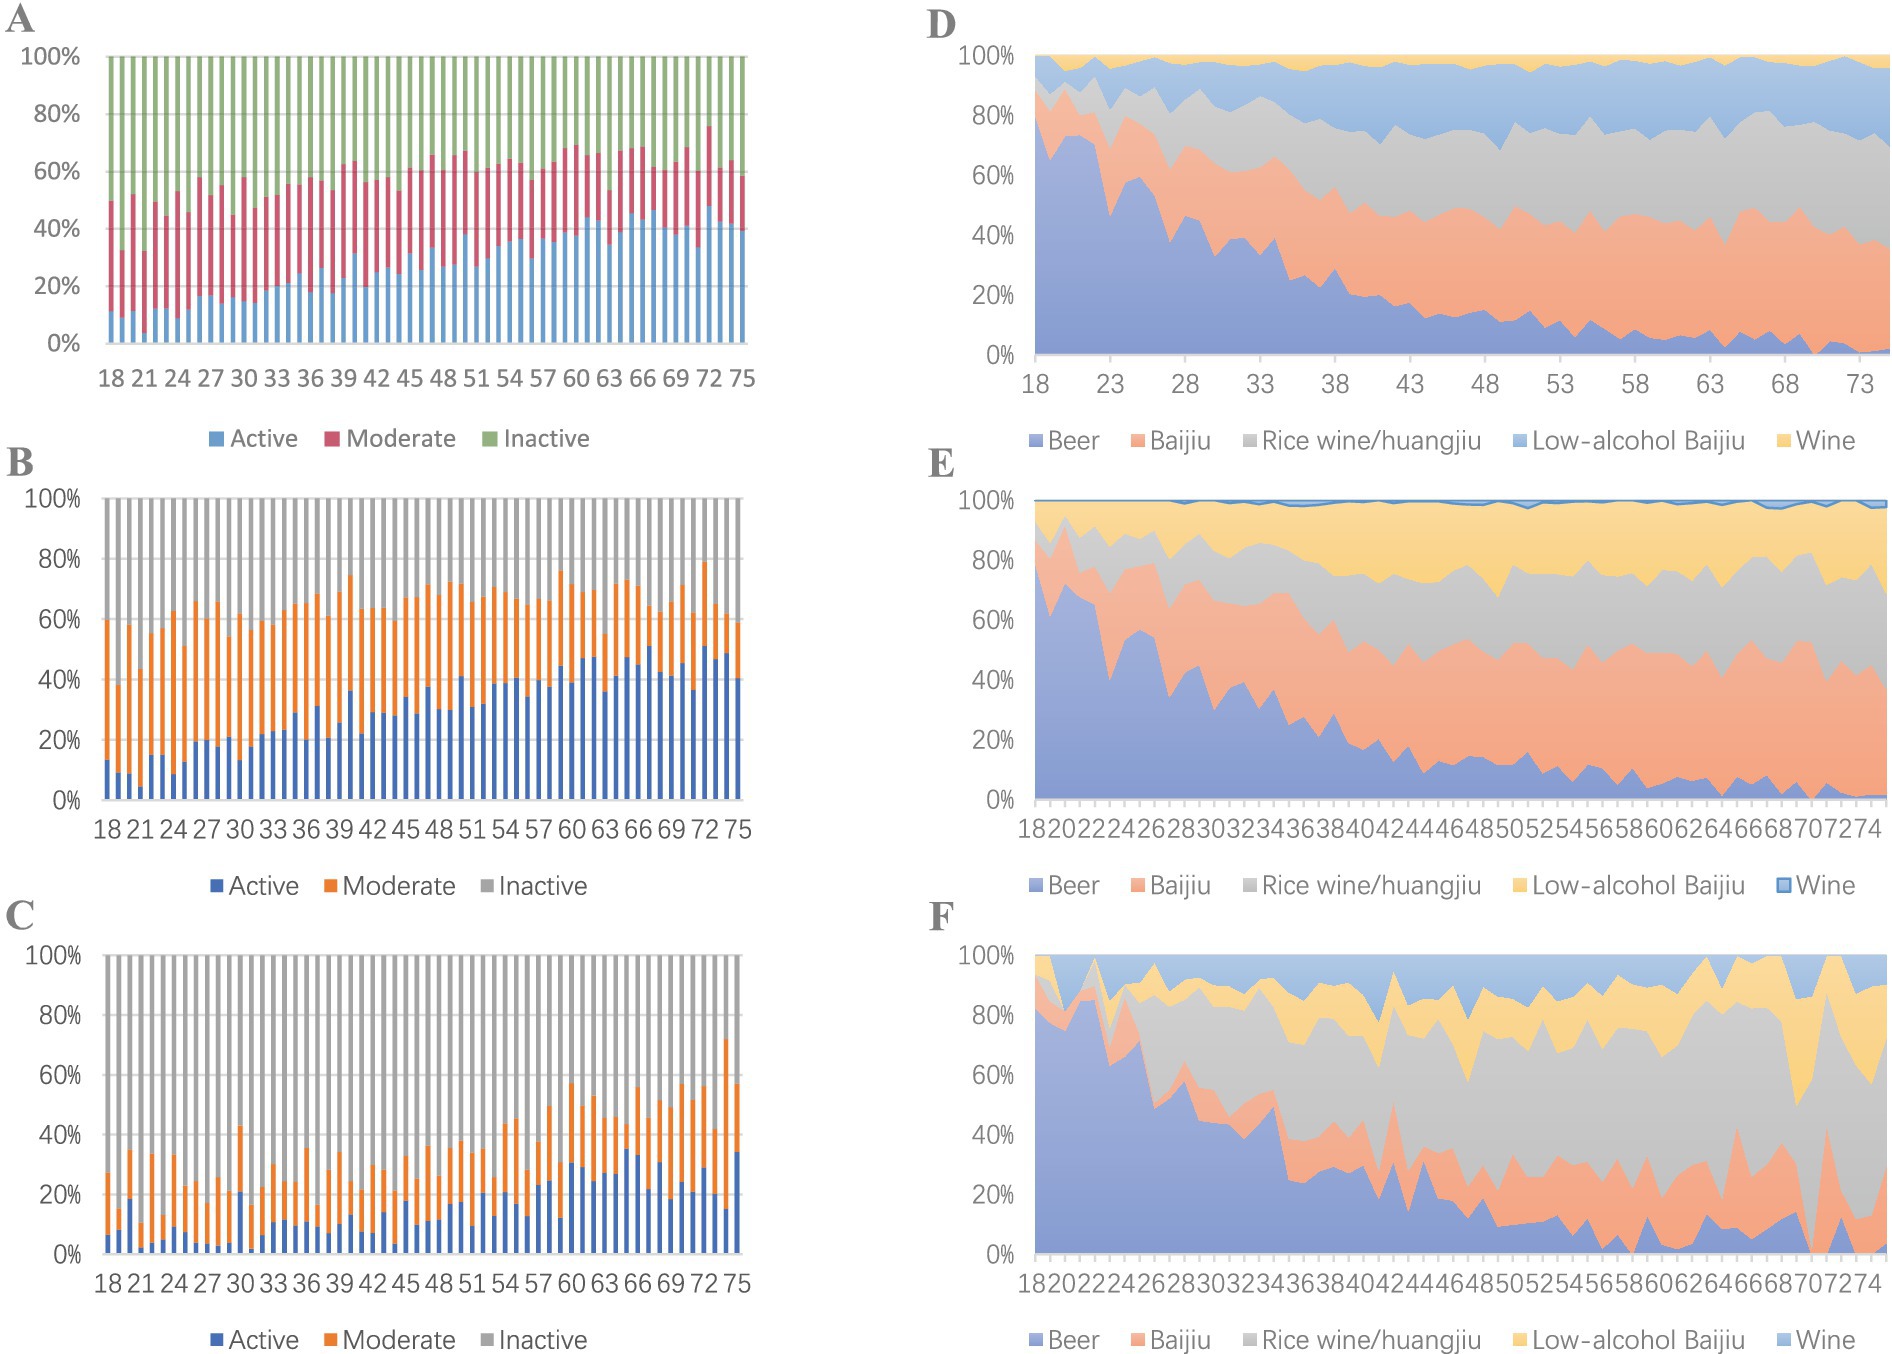
Figure 2. Alcohol consumption frequency and types by age group. (A) Overall population alcohol consumption frequency by age. (B) Male alcohol consumption frequency by age. (C) Female alcohol consumption frequency by age. (D). Overall population alcohol types by age. (E) Male alcohol types by age. (F) Female alcohol types by age.
In terms of alcohol types, distilled Baijiu and beer are the most commonly consumed beverages among males, with 33.3% choosing distilled Baijiu and 25.3% choosing beer. In contrast, females prefer beer and rice wine (Huangjiu), accounting for 35.2 and 31.2%, respectively. Overall, beer is the most consumed alcoholic beverage among individuals under 30, with a consumption rate of 56.3%. However, as age increases, the consumption rates of distilled Baijiu and rice wine (Huangjiu) significantly rise, while beer consumption declines markedly. Among males, there is a pronounced increase in the consumption of both distilled and low-alcohol Baijiu. In contrast, females exhibit a significant rise in the consumption of rice wine (Huangjiu), with a notably higher consumption rate compared to males (Table 2; Figures 2D–F).
Males have the highest average beer consumption per time at 487.0 mL, while females average 250.8 mL. Average consumption of other types of alcohol is relatively similar across genders. Notably, beer consumption declines significantly with age, while the decrease in the consumption of other types of alcohol is less pronounced. Ethnic minorities exhibit higher average consumption of all alcohol types compared to the Han population. Individuals with an education level of elementary school or below have significantly lower average beer consumption than those with higher education levels; however, they have the highest average consumption of low-alcohol Baijiu at 159.1 mL. In rural populations, both farmers and workers predominantly consume low-alcohol Baijiu in addition to beer (Table 2; Figure 3).
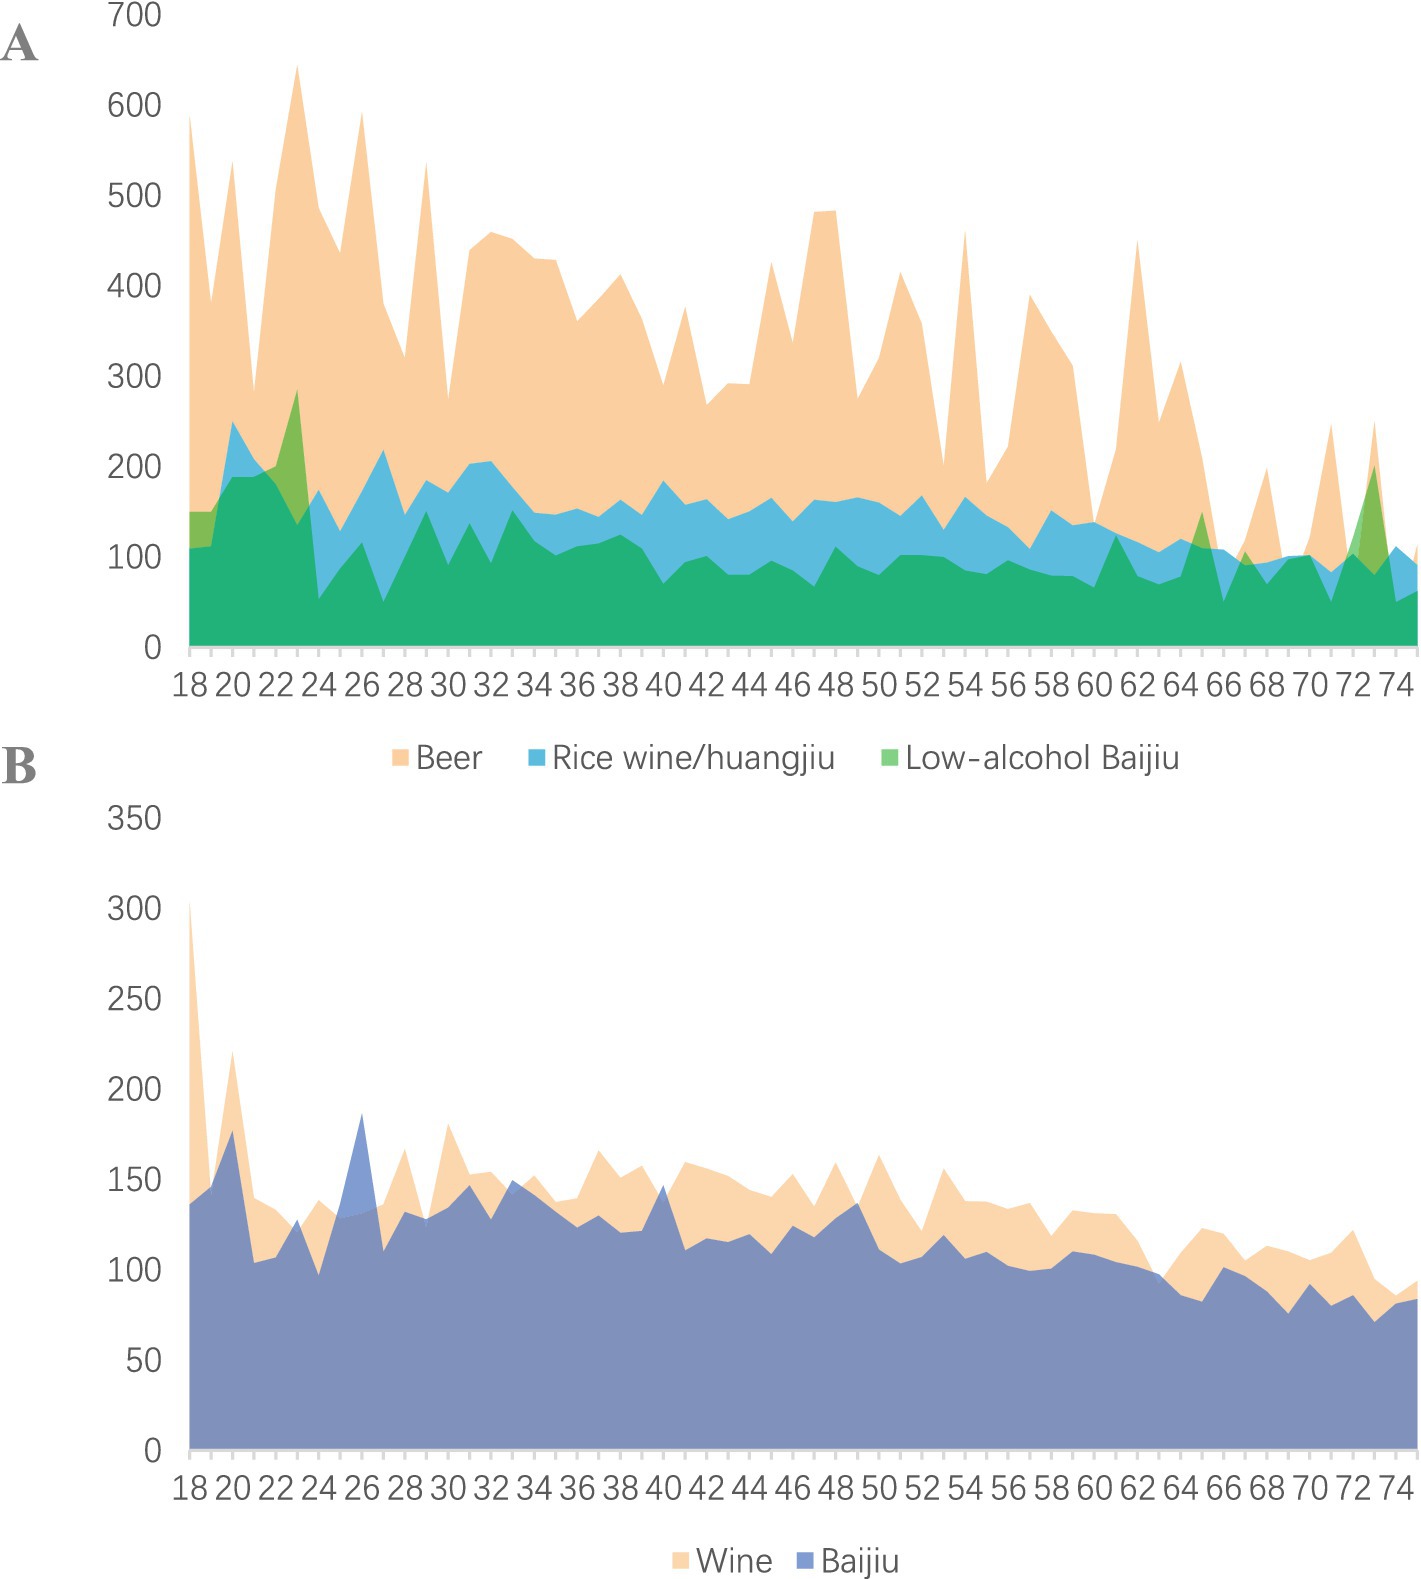
Figure 3. Average alcohol consumption per time by age. (A) Average consumption of beer, low-alcohol baijiu and wine. (B) Average consumption of Huangjiu and Baijiu.
Table 3 displays the distribution of weekly alcohol intake among adults in Hainan Province. The results indicate that the average weekly alcohol consumption for men is 59.8 mL, with 43.6% consuming over 100 mL. In contrast, women have an average intake of 10.9 mL, with 67.0% consuming ≤20 mL. Overall, alcohol consumption significantly increases with age, peaking at age 60 before declining. However, women’s alcohol intake continues to rise with age (Table 3; Figure 4). Regarding other demographic characteristics, ethnic minorities, individuals with lower educational attainment, married individuals, farmers, and rural populations exhibit significantly higher weekly alcohol intake. Notably, those with an education level of elementary school or below have consumption rates exceeding 62 mL per week, with over 47% consuming more than 100 mL per week. Further, we found all the unmarried male employees aged 60–69 years with primary or below education consumed over 100 mL pure alcohol per week, as well as those unmarried male employees aged 50–59 years with senior education. In the meantime, 91.5% unmarried females farmers of Han population with junior school education were found consuming over 100 mL pure alcohol.
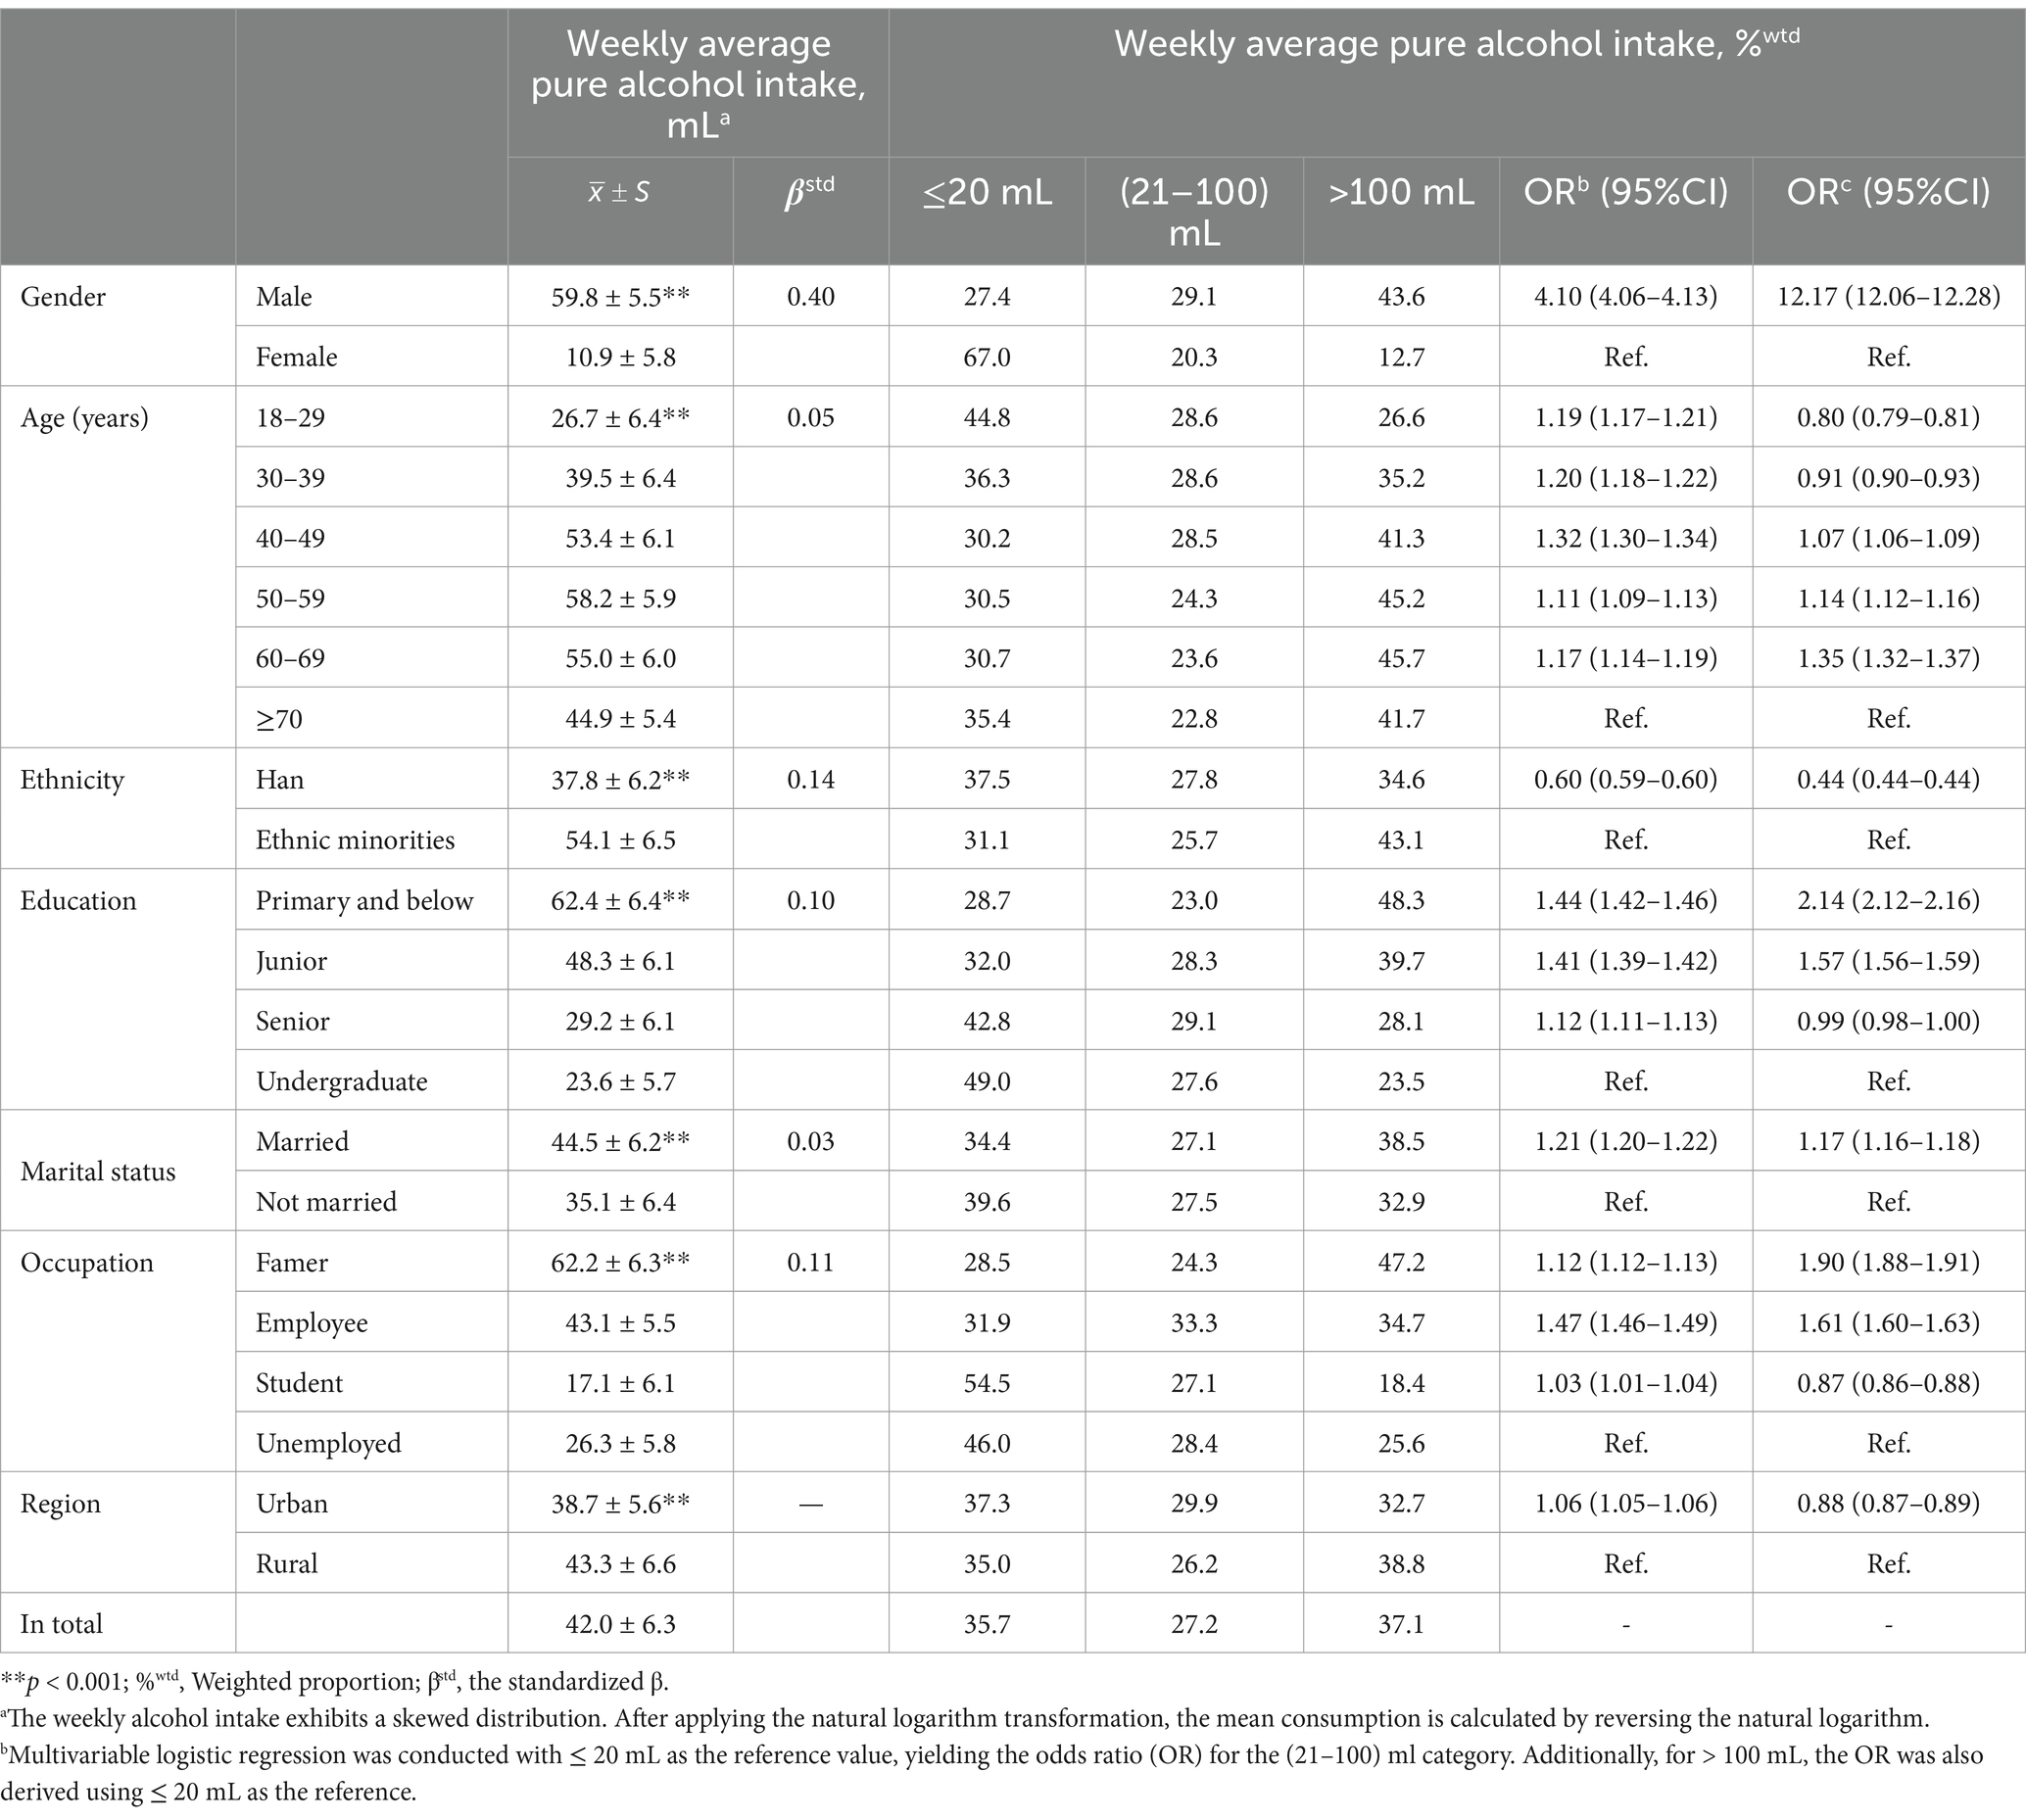
Table 3. Weekly alcohol consumption among adults in Hainan Province.
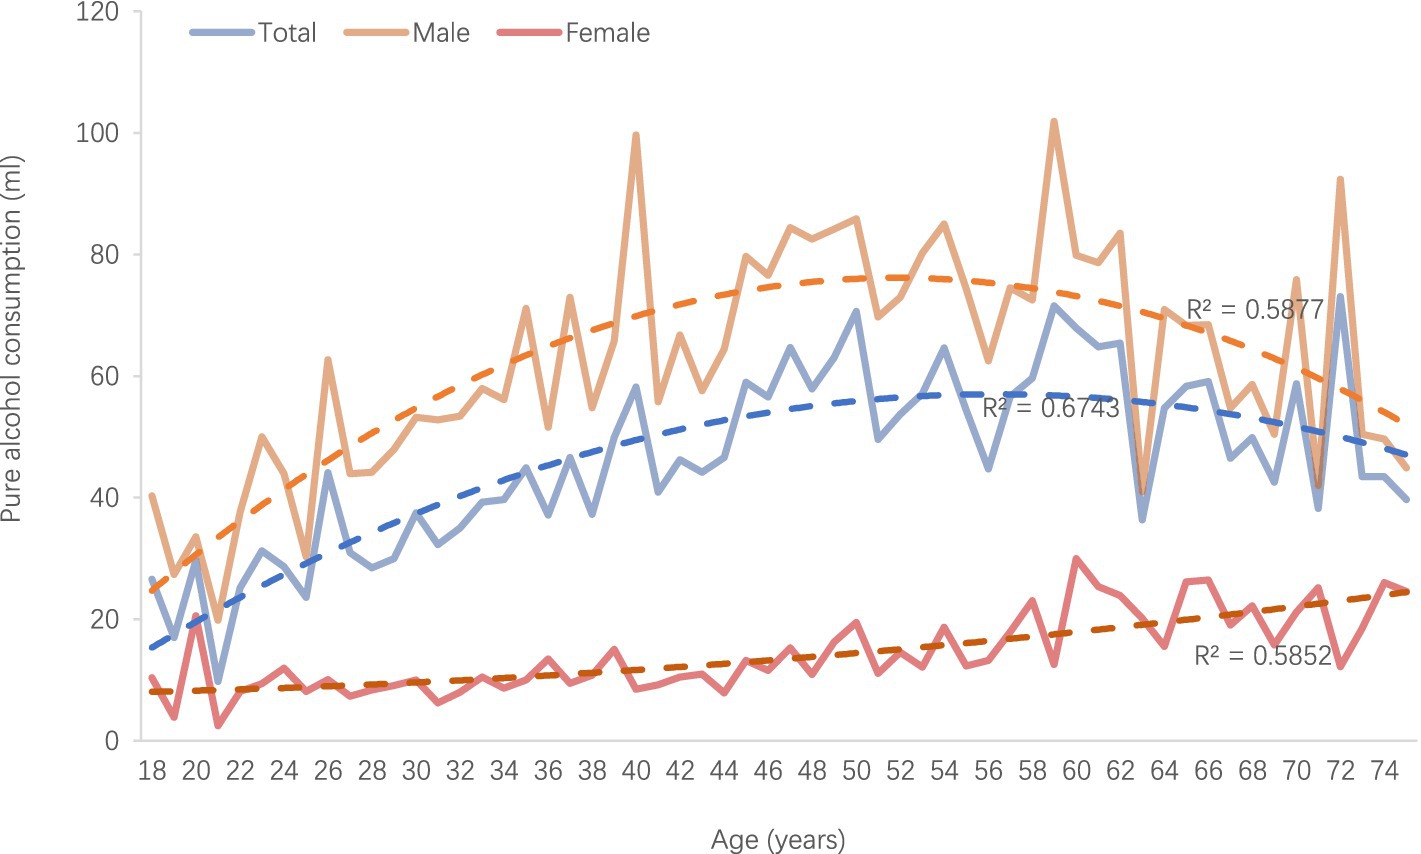
Figure 4. Weekly average pure alcohol intake.
Multiple linear stepwise regression results indicate that gender is the most significant demographic factor associated with weekly alcohol intake, with a standardized β value of 0.40, and ethnicity was with a standardized β of 0.14. Multivariable logistic regression analysis shows that men consuming between 21 and 100 mL weekly have a risk of 4.10 (4.06–4.13) times that of women, compared to those consuming ≤20 mL. Men consuming over 100 mL weekly have a risk of 12.17 (12.06–12.28) times that of women. Additionally, individuals with an education level of elementary school or below have an odds ratio (OR) of 1.44 (1.42–1.46) for consuming 21–100 mL weekly compared to those with a bachelor’s degree. They also have an OR of 2.14 (2.12–2.16) for consuming over 100 mL weekly.
This study conducted a comprehensive epidemiological survey and analysis of drinking patterns and alcohol consumption among adults in Hainan Province. It revealed significant differences in drinking behaviors and alcohol intake based on various demographic characteristics. The findings indicate that sociodemographic factors—such as gender, age, ethnicity, education level, marital status, occupation, and region—are closely linked to drinking behavior. This provides essential scientific evidence for formulating public health policies and intervention strategies.
The overall drinking rate among adults in Hainan Province is 42.8%, with men exhibiting a significantly higher rate (64.4%) compared to women (18.9%). This discrepancy suggests a persistent influence of gender norms and cultural customs on drinking behaviors. It also might be a result of the cultural and social context, that drinking is often considered as a part of social activities among male and the traditional tolerant attitude toward male drinking has also contributed to the increase in male drinking rates (10, 11). Studies have shown that men are more likely to relieve stress and anxiety by drinking (12). In addition, men tend to seek psychological comfort through drinking alcohol when facing life and work pressures (13, 14). The World Health Organization (WHO) reports that the global male drinking rate is approximately four times that of females (8, 9). Men’s drinking rates increase rapidly from age 18, peaking between 30 and 39 years. This indicates that early intervention is crucial before age 40. In contrast, women’s drinking rates peak early at ages 18 to 20, followed by a rapid decline. This highlights the need for early interventions targeted at female drinkers (9, 15). Previous research indicates that excessive drinking during youth can result in long-term health issues, underscoring the importance of addressing drinking patterns in young populations (15). Furthermore, as age increases, the proportion of active male drinkers rises, accompanied by a shift from beer to stronger spirits. This indicates a heightened risk (16). Meanwhile, women primarily consume rice wine and yellow wine, suggesting that interventions should account for age and gender-specific drinking preferences.
The drinking rate among ethnic minorities is 70.1%, much higher than the Han population’s 36.8%. Compared to Han nationality, drinking culture plays a more traditional role among ethnic minorities (10). Drinking is often treated as a racial cognition and ceremony in their daily life (17). This suggests that ethnic factors significantly influence drinking behaviors (18). This difference may stem from cultural traditions, social environments, or differing health education levels, highlighting the need for further investigation and culturally appropriate interventions (19). The study found that education level significantly affects drinking behavior. Individuals with junior high education or less have the lowest overall drinking rate (31.3%) but a higher proportion of active drinkers. This aligns with Jernigan’s findings that marginalized groups face greater alcohol-related health issues (20). This underscores the need for tailored educational interventions to reduce heavy drinking risks across different educational backgrounds. Although urban (42.6%) and rural (42.9%) residents have similar overall drinking rates, the higher active drinking rate in rural areas indicates a need for targeted public health messaging on drinking frequency and quantity (16, 21, 22).
The average weekly pure alcohol intake among adult men in Hainan Province is about six times that of women, aligning with global trends (8). Additionally, 43.6% of men consume over 100 mL of alcohol weekly. Multivariable regression analysis shows that men are more likely to engage in excessive drinking than women. Men’s weekly alcohol consumption gradually increases with age, peaking at 60 before declining, while women’s consumption keeps rising. The percentage of older adults consuming over 100 mL of alcohol weekly also rises, peaking at ages 60–69. This suggests that interventions for older populations should focus on reducing alcohol intake.
Individuals with primary education or less, along with agricultural workers, show lower overall drinking rates. However, their high levels of active drinking, preferred alcohol types, and average consumption reflect risky behaviors, with pure alcohol intake exceeding 62 mL. Previous studies show that health risks linked to alcohol consumption are significantly higher in lower socioeconomic groups. This suggests that low-education and agricultural populations in Hainan are at elevated risk for alcohol-related health issues and need targeted intervention. Notably, students have much lower drinking rates, consumption levels, and frequency compared to other groups. This indicates that improved health education for students could significantly enhance intervention effectiveness (23).
Alcohol drinking is suggested as a social psychological demand, including a need for interpersonal relationship, less empathy ability, high stress, depression, or coping mechanisms, which are key drivers of alcohol use and drinking patterns (24–27). As is concluded, the level of empathy was significantly lower in the group of alcohol-dependent population than others, in whom alcohol use might be a compensation for their intrinsic weakness (26). Though we did not include such psychological aspects into analysis, our results offered similar clues. Groups experiencing high drinking rate focused on males, youngsters, ethnic minorities or enterprise employees, that were indicated bearing heavy social stress or emotional weakness. This is in line with several former researches indicating alcohol misuse increases the risk of subsequent behavioral disorders (14).
The study bears several limitations. First, the cross-sectional design restricts the ability to establish causal relationships between sociodemographic factors and drinking behaviors, necessitating longitudinal research for deeper insights. Additionally, reliance on self-reported data may introduce bias. Moreover, while the study recognizes ethnic and cultural influences on drinking behaviors, it does not explore the specific cultural contexts shaping these patterns, indicating a need for further qualitative research. Also, we did not acquire globally validated tools like Alcohol Use Disorders Identification Test (AUDIT), to evaluate drinking patterns or alcohol consumption, which might make our results difficult in external validity across regions. The focus on adults in Hainan Province may limit the generalizability of the findings to other regions with different cultural or economic backgrounds, and a more detailed analysis within specific age cohorts is warranted to understand generational differences in drinking patterns.
This study highlights the complex and diverse drinking behaviors in Hainan Province. By identifying high-risk groups based on gender, ethnicity, education, and occupation, the study offers clear guidance for public health strategies. Future efforts should emphasize culturally sensitive and targeted interventions, especially aimed at reducing drinking frequency and quantity among vulnerable populations to minimize alcohol-related health risks.
The raw data supporting the conclusions of this article will be made available, upon reasonable request to the corresponding author.
The studies involving humans were approved by Hainan Provincial Center for Disease Control and Prevention Institutional Review Board (No.202360). The studies were conducted in accordance with the local legislation and institutional requirements. The participants provided their written informed consent to participate in this study.
TO: Data curation, Formal analysis, Investigation, Writing – original draft. JJ: Data curation, Funding acquisition, Investigation, Methodology, Writing – original draft. DS: Conceptualization, Software, Supervision, Writing – review & editing. YL: Investigation, Methodology, Project administration, Writing – original draft. CX: Conceptualization, Data curation, Investigation, Writing – original draft. XW: Conceptualization, Data curation, Formal analysis, Writing – original draft. XZ: Methodology, Writing – original draft, Writing – review & editing. HW: Investigation, Methodology, Supervision, Validation, Writing – original draft, Writing – review & editing. LZ: Project administration, Supervision, Visualization, Writing – original draft, Writing – review & editing. CW: Conceptualization, Data curation, Methodology, Resources, Software, Supervision, Visualization, Writing – original draft, Writing – review & editing. BH: Conceptualization, Resources, Supervision, Visualization, Writing – original draft, Writing – review & editing.
The author(s) declare that financial support was received for the research and/or publication of this article. This work was supported by Hainan Province Health and Wellness Science and Technology Innovation Joint Project (WSJK2024QN038).
The authors declare that the research was conducted in the absence of any commercial or financial relationships that could be construed as a potential conflict of interest.
All claims expressed in this article are solely those of the authors and do not necessarily represent those of their affiliated organizations, or those of the publisher, the editors and the reviewers. Any product that may be evaluated in this article, or claim that may be made by its manufacturer, is not guaranteed or endorsed by the publisher.
1. Waller, R, Shaw, DS, et al. Accelerated alcohol use across adolescence predicts early adult symp-toms of alcohol use disorder via reward -related neurafunction. Psychol Med. (2019) 4:675–84.
2. World health statistics 2022: monitoring health for the SDGs, sustainable development goals. Geneva: World Health Organization. (2022). Available at: https://www.who.int/publications/i/item/9789240051157. (Accessed August 5, 2024).
3. Wang, H, Ma, L, Yin, Q, Zhang, X, and Zhang, C. Prevalence of alcoholic liver disease and its association with socioeconomic status innorth-eastern China. Alcohol Clin Exp Res. (2014) 4:1035–41. doi: 10.1111/acer.12321
4. World Health Organization, Global status report on alcohol and health and treatment of substance use disorders. Geneva: World Health Organization. (2024). Available at: https://www.who.int/publications/i/item/9789240096745. (Accessed August 5, 2024).
5. Rumgay, H, Shield, K, Charvat, H, Ferrari, P, Sornpaisarn, B, Obot, I, et al. Global burden of cancer in 2020 attributable to alcohol consumption: a population-based study. Lancet Oncol. (2021) 22:1071–80. doi: 10.1016/S1470-2045(21)00279-5
6. Asrani, SK, Mellinger, J, Arab, JP, and Shah, VH. Reducing the global burden of alcohol-associated liver disease: a blueprint for action. Hepatology. (2021) 73:2039–50. doi: 10.1002/hep.31583
7. Qianl, NI, Xong, W, et al. Traditional grain alcohol (bai jiu, [symbol:see text]) production and use in rural Central China: implications for public health. BMC Public Health. (2015) 15:1261. doi: 10.1186/s12889-015-2594-4
8. Global status report on alcohol and health 2018 (2018). Geneva: World Health Organization. Available at: https://www.who.int/publications/i/item/9789241565639. (Accessed August 5, 2024).
9. H, X, P, X, and Zhang, F. Epidemic characteristics of alcohol-related liver disease in Asia from 2000 to 2020: a systematic review and meta -analysis. Liver Int. 9:1991–8.
10. Yaru, L, Jing, W, Liyun, Z, Wang Zhihong, Y, Dongmei, HY, and Ding, J. Drinking habits and influencing factors among Chinese adults. Chin J Epidemiol. (2018) 39:6.
11. Perrotte, JK, and Zamboanga, BL. Traditional gender roles and alcohol use among Latinas/os: a review of the literature. J Ethn Subst Abus. (2021) 20:151–68. doi: 10.1080/15332640.2019.1579142
12. Adams, J, Asiasiga, L, and Neville, S. Justifications for heavy alcohol use among gender and sexually diverse people. Glob Public Health. (2022) 17:2018–33. doi: 10.1080/17441692.2021.1957492
13. Greaves, L, Poole, N, and Brabete, AC. Sex, gender, and alcohol use: implications for women and low-risk drinking guidelines. Int J Environ Res Public Health. (2022) 19:4523. doi: 10.3390/ijerph19084523
14. Martinotti, G, Lupi, M, Carlucci, L, Santacroce, R, Cinosi, E, Acciavatti, T, et al. Alcohol drinking patterns in young people: a survey-based study. J Health Psychol. (2017) 22:1889–96. doi: 10.1177/1359105316667795
15. Global strategy to reduce the harmful use of alcohol. Geneva: World Health Organization. (2010). Available at: https://apps.who.int/iris/handle/10665/44395. (Accessed August 5, 2024).
16. Probst, C, Kilian, C, Sanchez, S, Lange, S, and Rehm, J. The role of alcohol use and drinking patterns in socioeconomic inequali-ties in mortality: a systematic review. Lancet Public Health. (2020) 5:e324–32. doi: 10.1016/S2468-2667(20)30052-9
17. Kang, Y. A study on the current status of Yunnan Yi Nationality's wine culture and health communication. J Jiamusi Vocat Instit. (2017):110. Available at: https://qikan.cqvip.com/Qikan/Article/Detail?id=74778374504849554950485457
18. Kurshed, AAM, Vincze, F, Piko, P, Kosa, Z, Sandor, J, Adany, R, et al. Alcohol consumption patterns of the Hungarian general and Roma populations. Front Public Health. (2022) 10:1003129. doi: 10.3389/fpubh.2022.1003129
19. Delk, J, Bensley, K, Ye, Y, Subbaraman, MS, Phillips, AZ, Karriker-Jaffe, KJ, et al. Intersectional disparities in outpatient alcohol treatment completion by gender and race and ethnicity. Alcohol Clin Exp Res. (2024) 48:389–99. doi: 10.1111/acer.15243
20. Jernigan, DH. Alcohol and public health: failure and opportunity. Milbank Q. (2023) 101:552–78. doi: 10.1111/1468-0009.12631
21. Shield, K, Manthey, J, Rylett, M, Probst, C, Wettlaufer, A, Parry, CDH, et al. National, regional, and global burdens of disease from 2000 to 2016 attributable to alcohol use: a comparative risk assessment study. Lancet Public Health. 5:e51–61. doi: 10.1016/S2468-2667(19)30231-2
22. Zhao, Z, Wang, L, Zhang, M, Zhang, X, Huang, Z, Li, C, et al. Geographic distribution of alcohol use among Chinese adults - China. China CDc Wkly. (2015) 2:98–103.
23. Shen, NT, Wahid, NA, et al. Evaluation of alcohol taxes as a public health opportunity to reduce liver transplantlistings for alcohol -related liver disease. Alcohol Clin ExpRes. (2020) 44:2307–15. doi: 10.1111/acer.14454
24. Mineur, YS, Garcia-Rivas, V, Thomas, MA, Soares, AR, McKee, SA, and Picciotto, MR. Sex differences in stress-induced alcohol intake: a review of preclinical studies focused on amygdala and inflammatory pathways. Psychopharmacology. (2022) 239:2041–61. doi: 10.1007/s00213-022-06120-w
25. Fogelman, N, Hwang, S, Sinha, R, and Seo, D. Social support effects on neural stress and alcohol reward responses. Curr Top Behav Neurosci. (2022) 54:461–82. doi: 10.1007/7854_2021_246
26. Martinotti, G, Di Nicola, M, Tedeschi, D, Cundari, S, and Janiri, L. Empathy ability is impaired in alcohol-dependent patients. Am J Addict. (2009) 18:157–61. doi: 10.1080/10550490802544391
Keywords: drinking pattern, alcohol consumption, adult age, Chinese population, public health
Citation: Ou T, Jiang J, Sun D, Liu Y, Xiong C, Wang X, Zhou X, Wu H, Zhang L, Wang C and He B (2025) Epidemiology characteristics of the drinking patterns and alcohol consumption among adults in Hainan Province, China. Front. Public Health. 13:1490439. doi: 10.3389/fpubh.2025.1490439
Edited by:
Qiuda Zheng, The University of Queensland, AustraliaReviewed by:
Giovanni Martinotti, University of Studies G. d’Annunzio Chieti and Pescara, ItalyCopyright © 2025 Ou, Jiang, Sun, Liu, Xiong, Wang, Zhou, Wu, Zhang, Wang and He. This is an open-access article distributed under the terms of the Creative Commons Attribution License (CC BY). The use, distribution or reproduction in other forums is permitted, provided the original author(s) and the copyright owner(s) are credited and that the original publication in this journal is cited, in accordance with accepted academic practice. No use, distribution or reproduction is permitted which does not comply with these terms.
*Correspondence: Chao Wang, d2NoYW8xOTg3QDEyNi5jb20=; Bin He, QmluaGU4OThAMTg5LmNu
†These authors have contributed equally to this work
Disclaimer: All claims expressed in this article are solely those of the authors and do not necessarily represent those of their affiliated organizations, or those of the publisher, the editors and the reviewers. Any product that may be evaluated in this article or claim that may be made by its manufacturer is not guaranteed or endorsed by the publisher.
Research integrity at Frontiers
Learn more about the work of our research integrity team to safeguard the quality of each article we publish.