 Qiuling Zhang1†
 Yushuang Wei2,4†Shengzhu Huang4†YeMei Mo1
 Boteng Yan3,4
 Xihui Jin3,4
 Mingjie Xu3,4Xiaoyou Mai2,4Chaoyan Tang1Haiyun Lan1Rongrong Liu1
 Mingli Li4*
 Zengnan Mo3,4*Wenchao Xie1*
- 1The First People’s Hospital of Yulin, Yulin, Guangxi, China
- 2School of Public Health, Guangxi Medical University, Nanning, Guangxi, China
- 3Institute of Urology and Nephrology, First Affiliated Hospital of Guangxi Medical University, Guangxi Medical University, Nanning, Guangxi, China
- 4Guangxi Key Laboratory for Genomic and Personalized Medicine, Guangxi Collaborative Innovation Center for Genomic and Personalized Medicine, Center for Genomic and Personalized Medicine, Guangxi Medical University, Nanning, Guangxi, China
Background: Recent studies suggest that the metabolic score for insulin resistance (MetS-IR) is an effective indicator of metabolic disorders. However, evidence on the relationship between MetS-IR and metabolic syndrome (MetS) among the Chinese middle-aged and older adult population is limited.
Objective: This cohort study aims to assess the associations of MetS-IR levels with MetS risk and its components.
Methods: Data used in this study from the National Basic Public Health Service Project Management System (2020–2023). Multivariable Cox proportional hazards model and restricted cubic spline (RCS) were employed to evaluate the associations of baseline MetS-IR levels with MetS risk and its components, receiver operating characteristic (ROC) curves were further utilized to assess the efficacy of MetS-IR in predicting the risk of MetS and its component.
Results: Of 1,498 subjects without MetS at baseline, 392 incident MetS cases were observed during a median of 27.70 months of follow-up. The adjusted multivariable Cox regression analysis indicated an elevated 15% risk of developing MetS for 1-SD increment of MetS-IR [hazard ratios (HRs) and 95% confidence intervals: 1.16 (1.13–1.18)]. Compared to the first tertile of MetS-IR, the HRs of the third tertile and second tertile were 6.31 (95% CI 4.55–8.76) and 2.72 (95% CI 1.92–3.85), respectively. Consistent findings were further detected across subgroups. Moreover, nonlinear associations were observed between MetS-IR and the risk of MetS, abdominal obesity, and reduced high-density lipoprotein concentration (HDL-C) (Pnonlinear < 0.01), with the cutoff of MetS-IR was 32.89. The area under the curve for MetS-IR in predicting MetS was 0.740 (95% CI 0.713–0.768), which was better than those of other indicators.
Conclusion: Our cohort study indicates a positive nonlinear association between MetS-IR with incident MetS, abdominal obesity, and reduced HDL-C, but positive linear associations of MetS-IR and elevated blood pressure (BP), elevated fasting blood glucose (FBG), elevated triglycerides (TG) in middle-aged and older adult people, more studies are warranted to verify our findings.
Introduction
MetS is a comprehensive state of systemic metabolic disruption and is commonly characterized as central obesity, insulin resistance, hypertension, dyslipidemia, and hyperglycemia (1). As China’s population rapidly aging, disability due to age-related diseases has become a substantial socio-economic burden (2, 3). MetS is one of the most prevalent chronic diseases in the older adult population, which directly increases the risk of cardiovascular disease, type 2 diabetes, and all-cause mortality (4, 5). In China, the prevalence of MetS was estimated to be 36.96% among the older adult population, which is significantly higher than the general population (6, 7) However, the definition and diagnostic criteria of MetS has been a controversial issue since the initial conceptualization raised in 1923 (8). Additionally, existing definitions are binary variables that insufficiently identify individuals at critical risk. Hence, our efforts are focused on discovering an efficient continuous biomarker to comprehensively evaluate the overall disease status. This initiative aims to ensure precise assessment of individual risks and widespread applicability.
Insulin resistance (IR) is considered the most plausible hypothesis for MetS pathophysiology (9, 10). Currently, the hyperinsulinemic-euglycemic clamp is commonly used in clinical practice to assess insulin resistance (11). However, this technique has several limitations due to cost and technical complexity (11, 12). The metabolic score for insulin resistance (MetS-IR) is an indicator that has been used widely as an indirect method for estimating insulin resistance. The calculation typically involves in the following parameters: fasting blood glucose (FBG), triglycerides (TG), body mass index (BMI), and high-density lipoprotein concentration (HDL-C) (13). Cumulative evidence has proved the role of MetS-IR on hypertension, type 2 diabetes mellitus and adverse cardiovascular events (14–17). The study in children found that MetS-IR correlates with MetS (18). A Thai study found that MetS-IR may be a valuable tool in predicting MetS in younger police personnel (19). These findings suggest that MetS-IR is not only associated with the presence of MetS but also may predict its onset. However, to date, only a few studies have assessed the potential role of MetS-IR in anticipating and managing MetS among middle-aged and older adult populations.
Herein, our study focuses on the middle-aged and older adult population to explore the relationships between MetS-IR with MetS and its components and further to assess the diagnostic efficacy of MetS-IR in identifying MetS using the ROC curve. Our study contributes to the early screening of MetS in middle-aged and older adult populations and provides a scientific reference for auxiliary clinical diagnosis.
Methods
Study design and population
The data used in this study was obtained from the public health service (BPHS) management system. BPHS aims to provide primary health care services to the target population, including disease control, management of chronic disease, health promotion and education (20). The older adult people aged (65+) are eligible to receive complimentary healthcare services, including health management, health check-ups, and health guidance services. Participants under management have consented to the potential use of their health record data for scientific research purposes. These participants have annual follow-up assessments. We derived health record data between 2020 and 2022 from Wuliqiao Community Health Service Center of the First People’s Hospital of Yulin City, Guangxi. The inclusion criteria of the participants are as follows: (1) age ≥ 45 years old; (2) having physical examination data ≥2 times; (3) MetS has not been diagnosed at the first visit. We further excluded the participants with no baseline data available for FBG, TG, and those suffering from malignant tumors, autoimmune diseases, mental diseases. Finally, we included 1,498 subjects without MetS in the cohort study from 2020 to 2022. The flowchart for this study is shown in Figure 1.
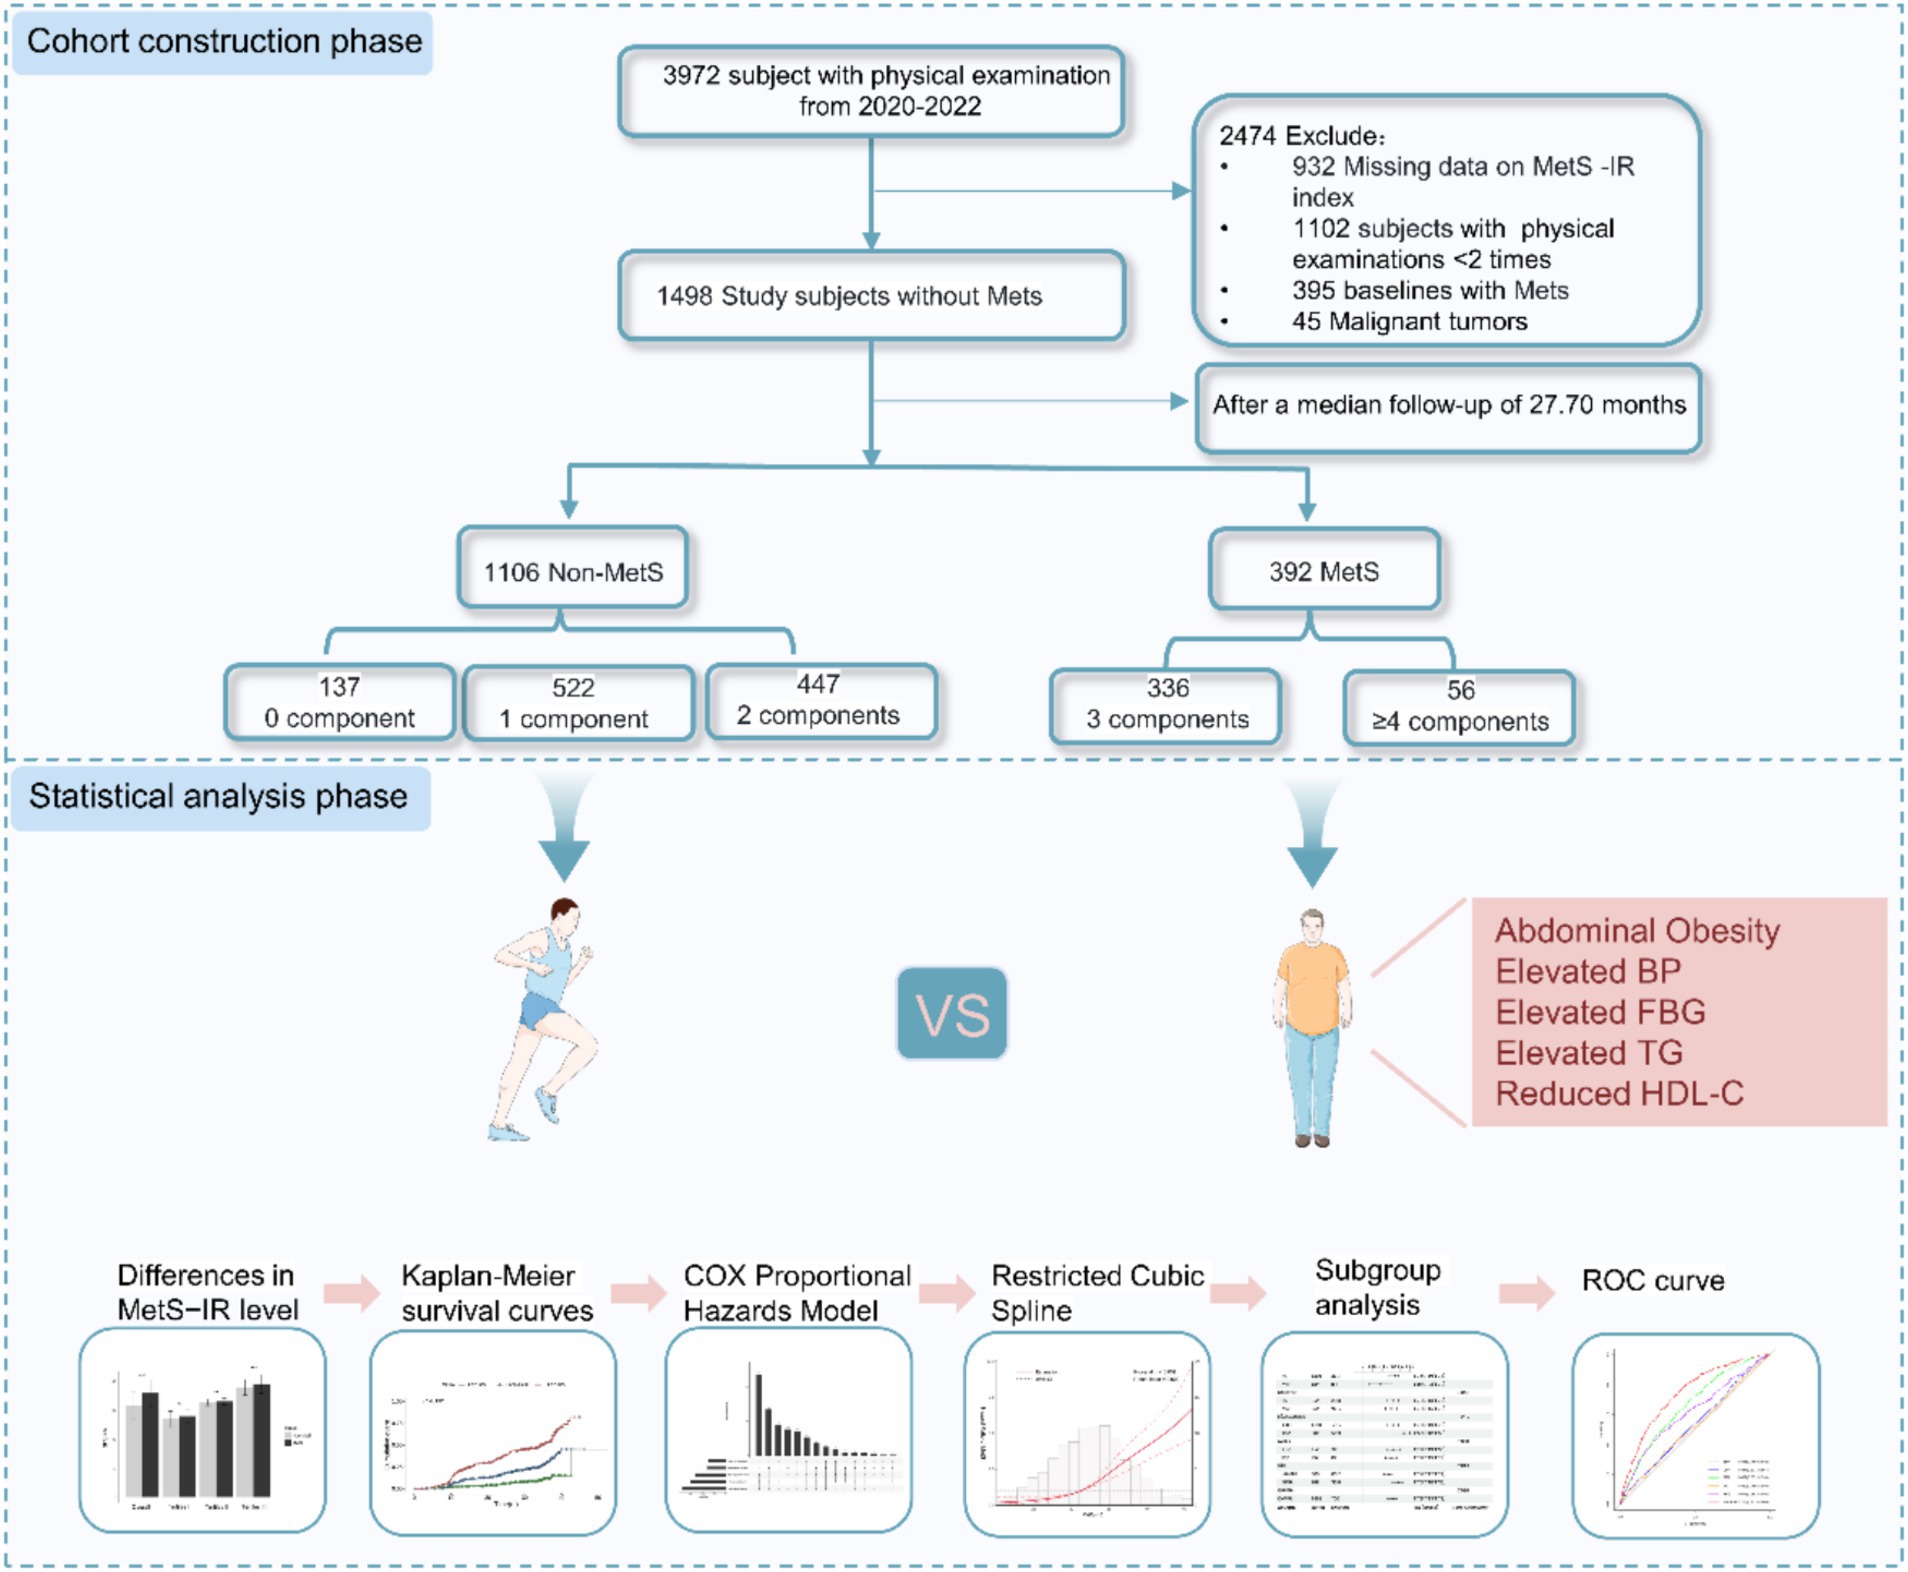
Figure 1. Study flowchart of subject selection. MetS–IR, metabolic score for insulin resistance; Mets, metabolic syndrome.
Measurement of baseline characteristics
Information on demographic characteristics [age, gender, ethnicity, waist circumference (WC), weight, height, etc.], exercise frequency (every day, more than once a week, occasionally, no exercise), smoking (yes, no), drinking (yes, no), disease history, and medication history were collected and updated annually by a face-to-face interview. BMI is calculated as weight (kg) divided by height squared (m2), a WHtR is for WC/height. Blood pressure was evaluated twice on the participant’s right arm using a validated electric BP monitor after at least 15 min of rest. The average of two measurements was documented as the individual’s BP.
Fasting blood samples were collected at the baseline visit to test serum white blood cells, FBG, TC, TG and HDL- C, low-density lipoprotein cholesterol (LDL-C) by local hospital.
Definition of main variables
MetS-IR was calculated using the formula: (Ln (2*FBG + TG) *BMI)/(Ln (HDL–C)) (13). MetS were determined using the Chinese Diabetes Branch of the Chinese Medical Association (CDS2013) criteria. MetS was defined as the presence of no less than three risk factors as follows: (1) abdominal obesity: WC ≥ 90 cm (men), WC ≥ 85 cm (female), (2) Elevated BP: BP ≥ 130/85 mmHg and/or those who have been diagnosed and treated for hypertension, (3) Elevated fasting glucose: FBG ≥ 6.1 mmol/L or 2hPG ≥ 7.8 mmol/L and/or have been Diagnosis of diabetes and treatment, (4) Elevated triglycerides: TG ≥ 1.7 mmol/L, (5) Reduced HDL-C: HDL-C < 1.04 mmol/L.
Statistical
Person time of follow-up was determined from the time at the baseline visit until the time at diagnose of MetS or the end of the study (December 2023). The baseline characteristics were described as frequencies and proportion for categorical variables, mean and standard deviation (SD) for continuous variables with normal distribution otherwise median and interquartile ranges for continuous variables with skewed distribution. To assess group differences, the Mann–Whitney U test was utilized for skewed distributed continuous variables, ANOVA for normally distributed continuous variables, and Chi-square tests for categorical variables. For the variable white blood cell count (WBC), which was missing for 196 participants (13.08%), we employed the multiple imputation method using the mice package in R, utilizing chained equations to handle the missing values.
The study first divided the MetS-IR variable into three groups according to tertile cut-points, then employed the Kaplan–Meier method to construct cumulative incidence rate survival curves for MetS events over time (months) across the three groups. The log-rank test was used to compare differences in the survival curves between the MetS-IR groups. Subsequently, multivariable-adjusted Cox proportional hazards model was performed to estimate the relationships between MetS-IR and MetS and associated components, adjustment covariates included gender, age, Exercise Frequency, Smoking, Alcohol use, WBC, antihypertensive medication, and antidiabetic medication. Further RCS was employed to explore potential nonlinear relationships between exposure and outcome. Additionally, we also conducted the interaction and subgroup analyses according to gender (male, female), age (≤65, >65), WHtR (≤0.5, >0.5), hypertension (yes, no), diabetes (yes, no), to assess the associations between MetS-IR and MetS. A sensitivity analysis was performed by excluding individuals with imputed data to reassess the relationship between MetS-IR and metabolic syndrome. Finally, ROC curve analysis was applied to evaluate the predictive performance of MetS-IR, SBP, DBP, BMI, TG, and FBG for MetS risk.
All analyses were performed using R statistical software version 4.3.0 and SPSS version 27.0 for Windows, and two-sided p-values < 0.05 were considered statistical significance.
Results
Baseline characteristics of the subjects according to MetS-IR categories
As shown in Tables 1, a total of 1,498 subjects without MetS at baseline from 2020 to 2022 were included in this cohort study, with a mean age of 69.76 ± 8.23 years. Most of them were mainly female (60.08%), non-smokers (96.53%), non-drinker (95.66%), and having exercise every day (89.95%). We finally observed 392 incident MetS cases during 3211.05 person-years of follow-up (27.70 months), and the incidence rate of Mets was 12.21 cases per 100 person-years for all subjects. Statistically significant differences were also observed in gender, age, DBP, WHtR, BMI, FBG, TC, TG, LDL-C, HDL-C, WBC, hypertension, diabetes, and antihypertensive medication across MetS-IR groups (p < 0.05).
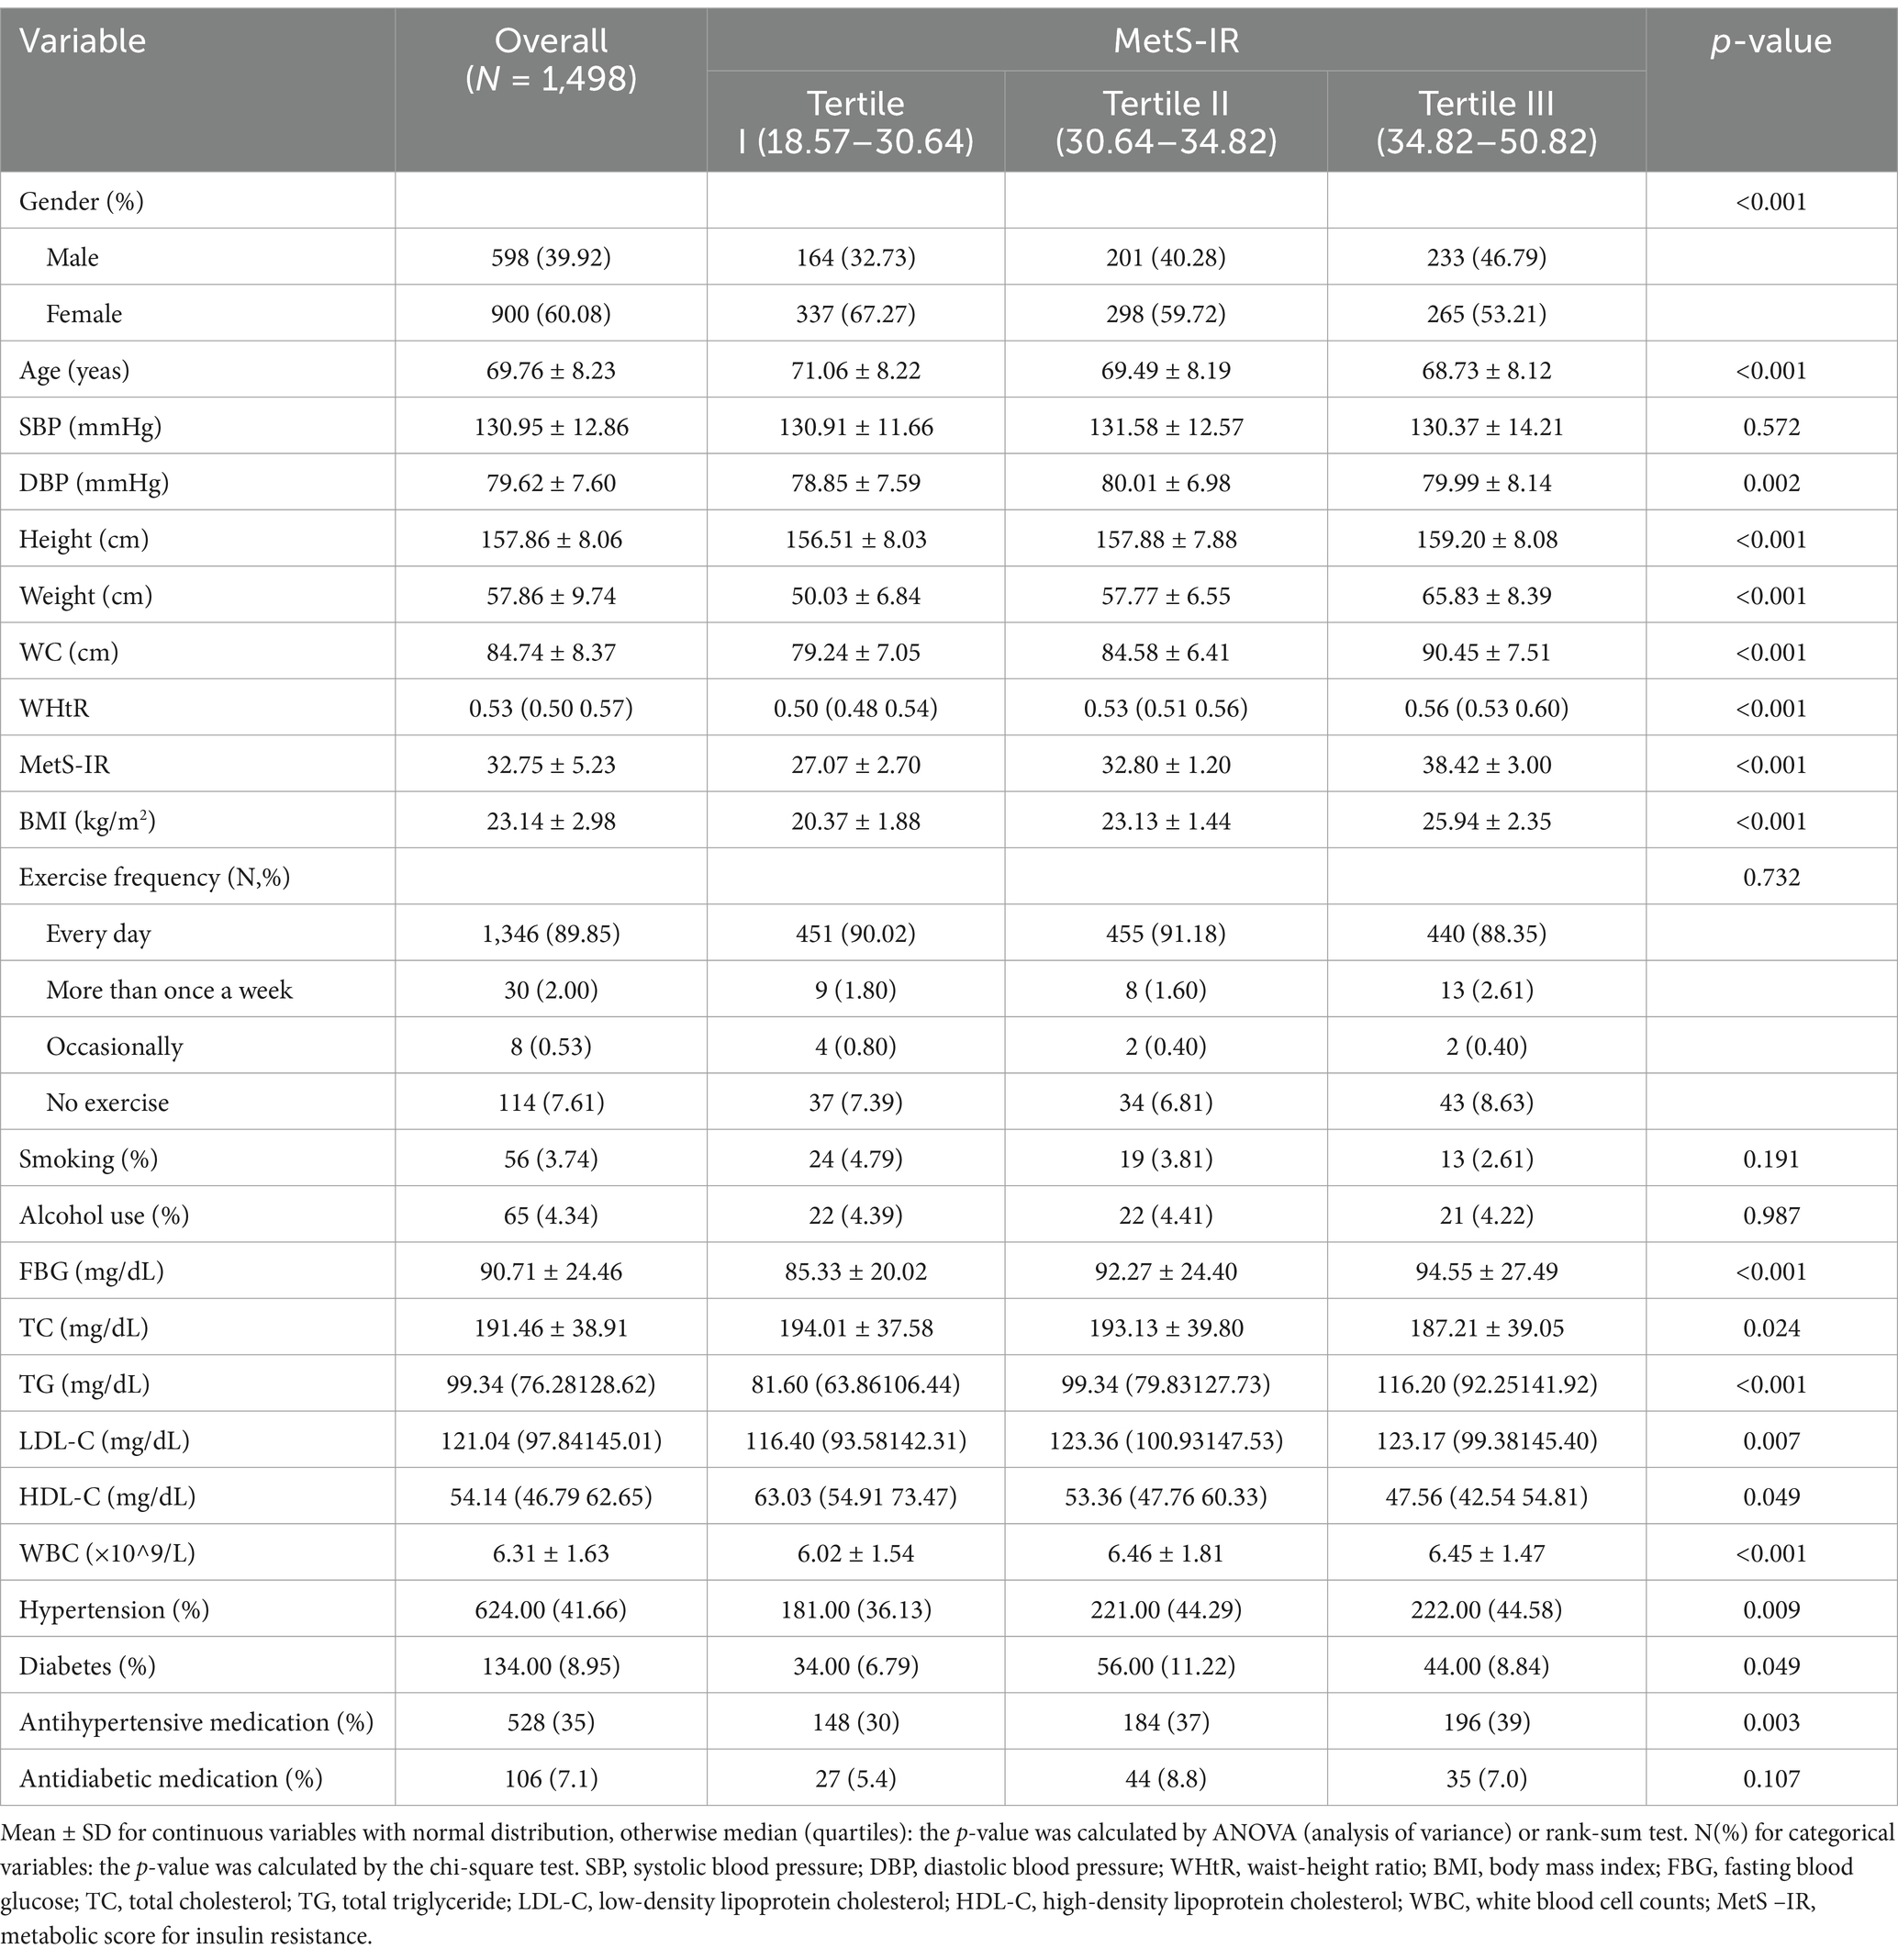
Table 1. Characteristics of the cohort study subjects grouped by MetS-IR tertiles at baseline.
Association of MetS-IR and MetS risk
Compared to the subjects in the non-MetS group, higher MetS-IR was significantly detected in those in the MetS group (p < 0.001), and this trend remained consistent when MetS-IR was divided into three categories (Figure 2A). Our findings revealed that elevated BP accounted for the largest component of MetS, followed by central obesity; while the common combinations co-occurrences were the combinations of elevated BP, abdominal obesity and elevated TG (Figure 2B). Furthermore, Kaplan–Meier survival curve analysis demonstrated that the cumulative incidence of MetS increased with each higher MetS-IR tertile (Plog-rank < 0.001, Figure 3A); Consistent trends were also observed in each component of MetS (Figures 3B–F) and in two or more MetS components (Supplementary Figure S1). As depicted in Table 2, multivariable-adjusted Cox proportional hazards regression analysis indicated that 1-SD increment of MetS-IR resulted in 1.15-fold higher risk of developing MetS (95% CI 1.13–1.18). Compared with the subjects in the first tertile of MetS-IR, the HRs of those in the second and the third tertile of MetS-IR were 2.72 (95% CI 1.92–3.85), 6.31 (95% CI 4.55–8.76), respectively; and the trend test was statistically significant (Ptrend < 0.05). When further analysis of the associations between MetS-IR with the single risk factor and the number of MetS components, the increased risk of developing abdominal obesity, elevated BP, elevated FBG, elevated TG and elevated HDL-C for 1-SD increment of MetS-IR was 1.16 (95% CI 1.13–1.19), 1.04 (95% CI 1.02–1.07), 1.09 (95% CI 1.05–1.13), 1.07 (95% CI 1.05–1.10), 1.10 (95% CI 1.06–1.13), respectively. Besides, in participants with two or more MetS components, an association with MetS-IR was found in both the unadjusted and adjusted models. The adjusted HRs of the association between the MetS-IR (analyzed as continuous variables) and the cluster of MetS components (presence of two or more symptoms) were 1.06(95%CI 1.04, 1.09), 1.11(95%CI 1.08, 1.13) and 1.31(95%CI 1.22, 1.4), respectively.
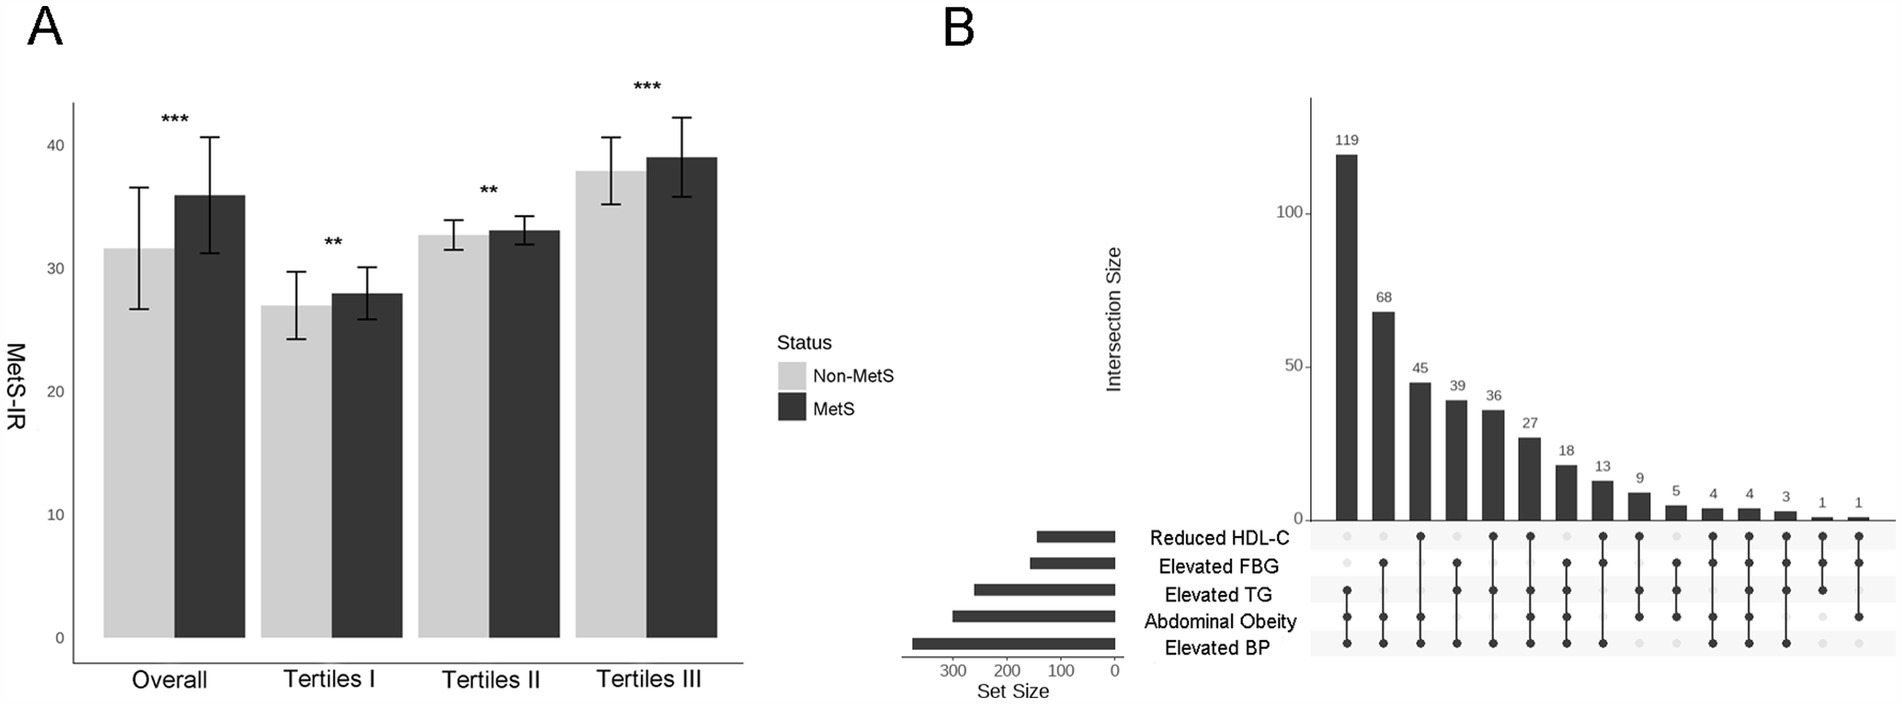
Figure 2. Differences in the levels of MetS–IR between the MetS and non- MetS groups and the categories of MetS. (A) Histograms of MetS –IR levels between Non-MetS and MetS groups under different strata, with Student’s t-tests used to compare the differences between the two groups. *p < 0.05, **p < 0.01, ***p < 0.001. (B) Upset plot shows the counts of participants with one or multiple target metabolic syndrome components. Matrix layout for all intersections of five metabolic syndrome components, sorted by intersection size. Dark circles in the matrix indicate sets that are part of the intersection. (This matrix layout shows the intersections of the five metabolic syndrome components, arranged by intersection size. Sets included in each intersection are indicated by dark circles in the matrix).

Figure 3. Kaplan–Meier survival curves of the cumulative incidence of MetS and its components according to the baseline MetS–IR categories. (A) MetS, (B) Abdominal Obesity, (C) Elevated BP, (D) Elevated FBG, (E) Elevated TG, (F) Reduced HDL-C. The log-rank test was used for comparisons between groups. MetS–IR, metabolic score for insulin resistance; BP, blood pressure; FBG, fasting blood glucose; TG, triglycerides; HDL-C, high-density lipoprotein cholesterol.
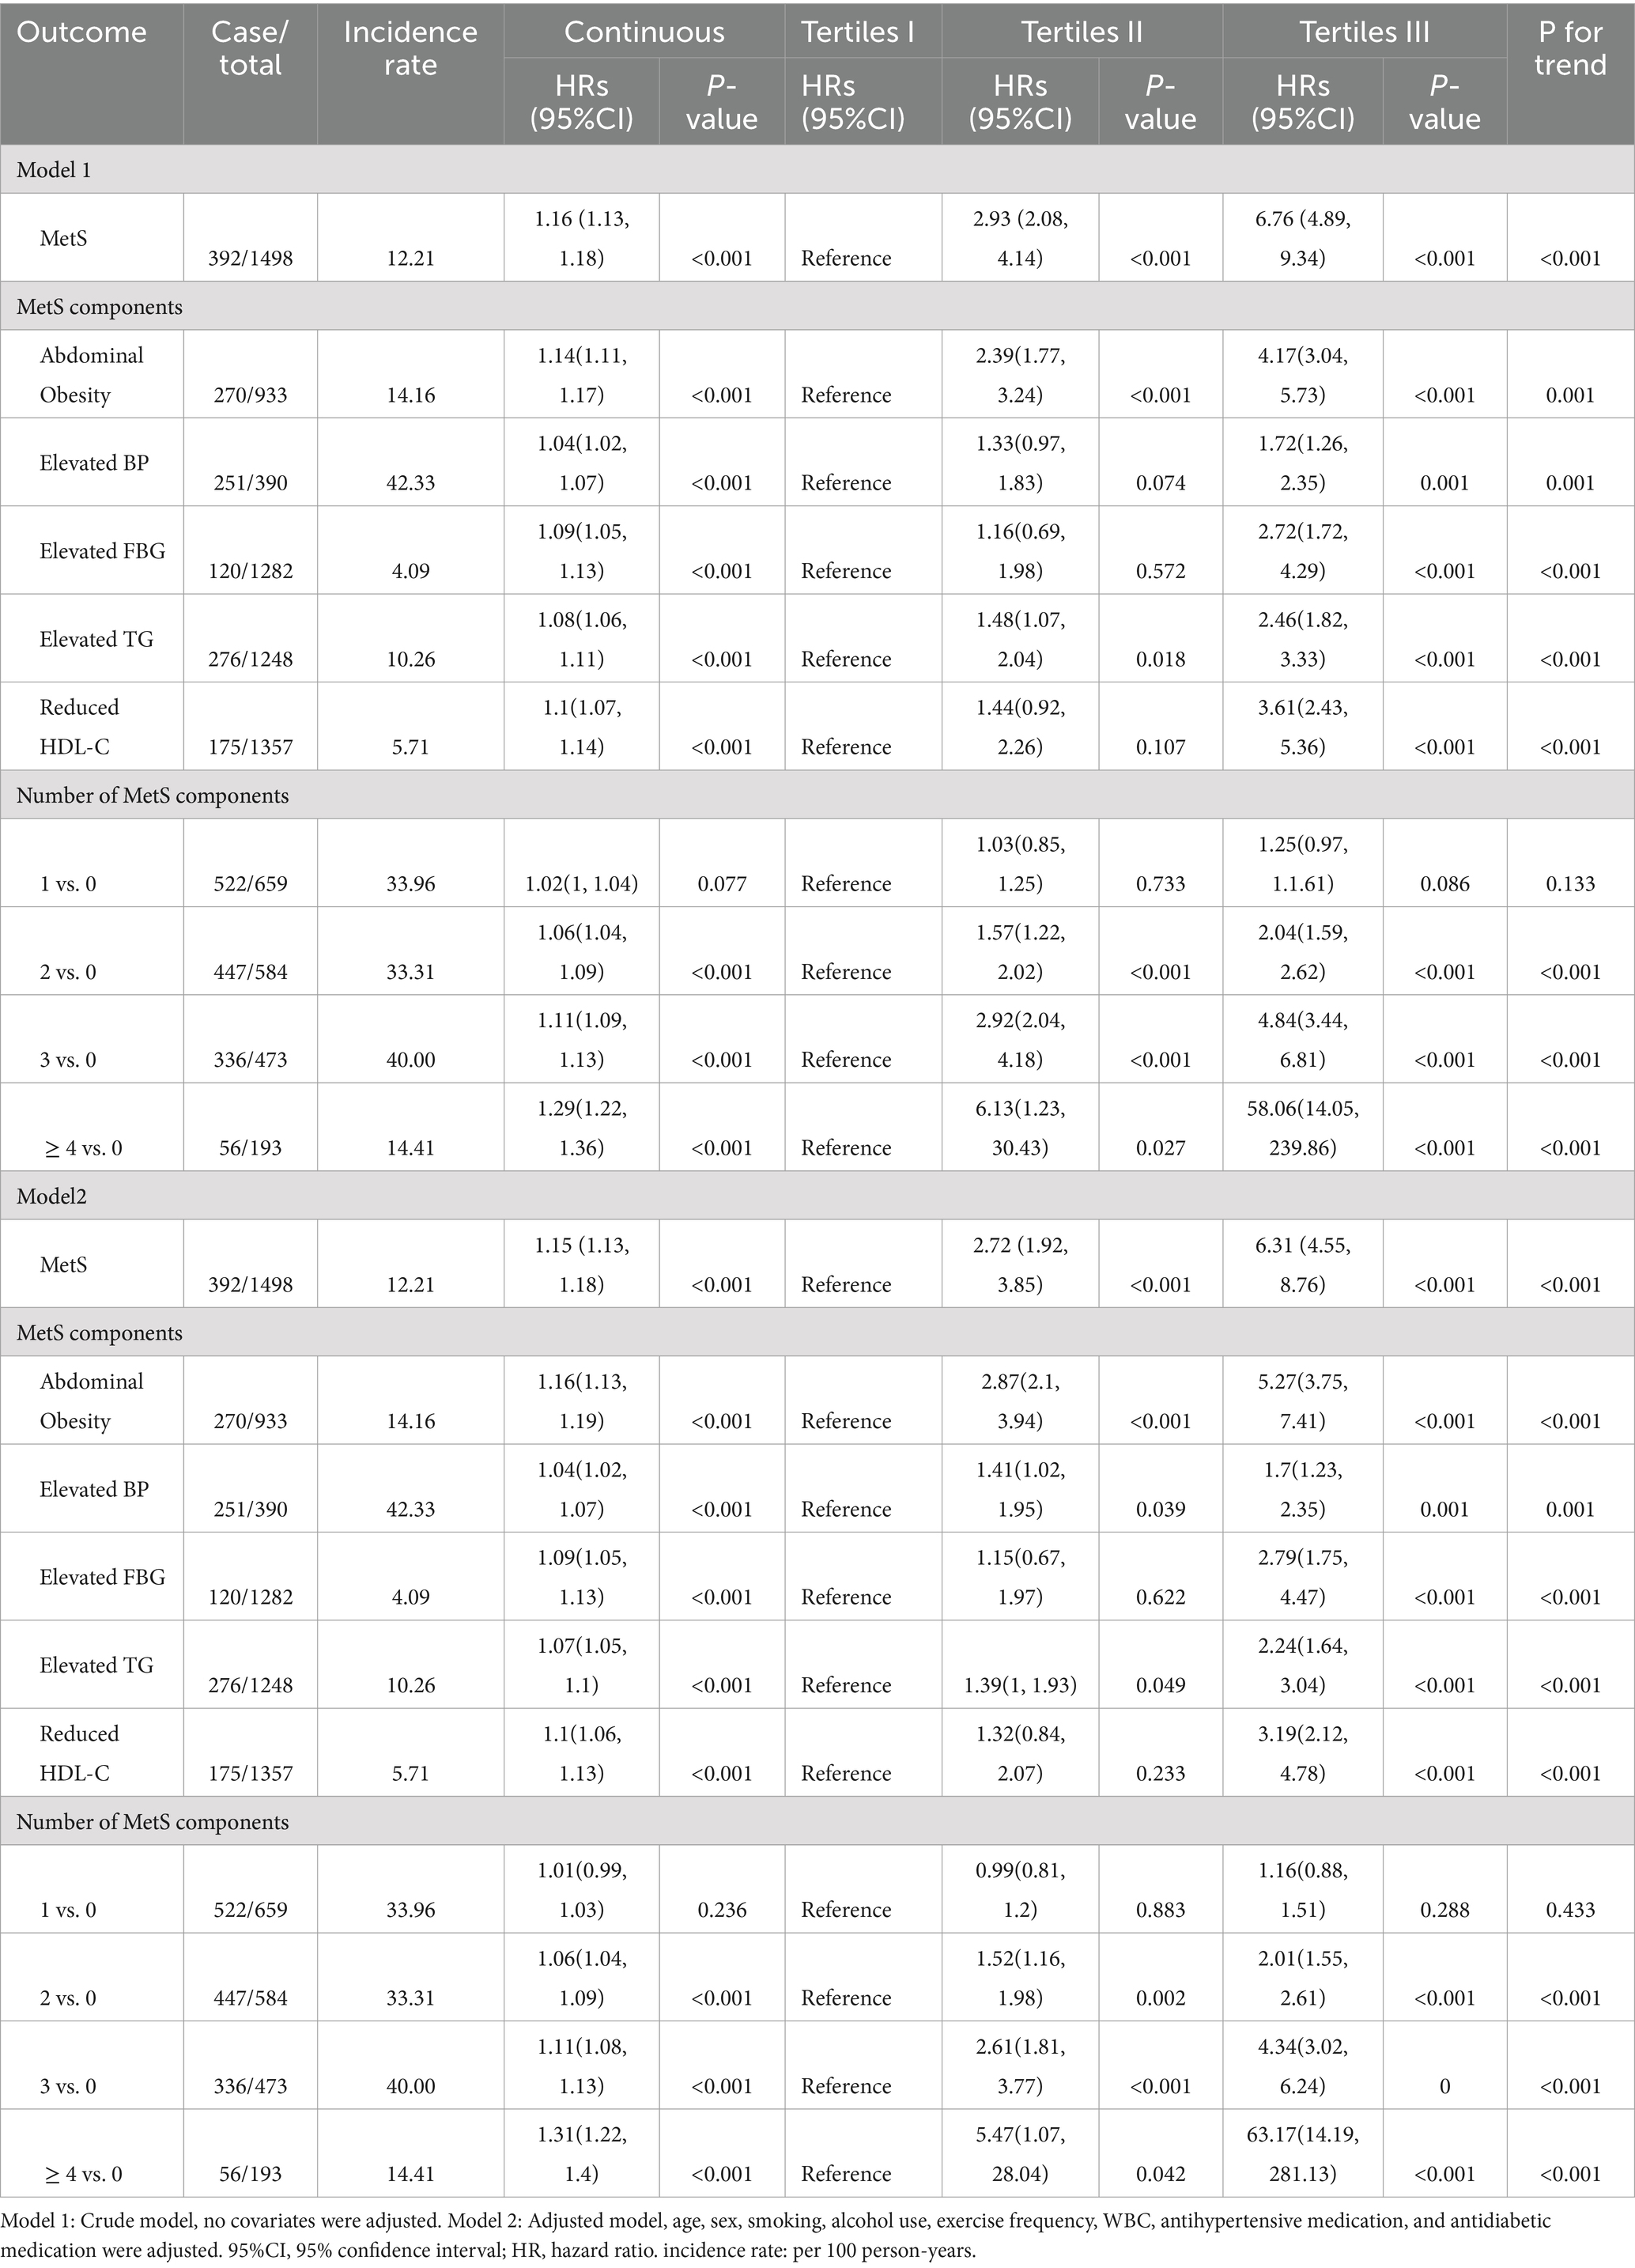
Table 2. Univariable and multivariable Cox proportional hazards model for MetS and its components.
Dose–response relationship between MetS-IR and MetS
Furthermore, the RCS analysis demonstrated a nonlinear dose–response relationship between MetS-IR and MetS risk (Poverall ≤ 0.001, Pnonlinear = 0.009), and the HRs of MetS increased rapidly when MetS-IR was greater than 32.89 (Figure 4A). Nevertheless, we found positive linear associations of MetS-IR with elevated BP (Poverall ≤ 0.001, Pnonlinear = 0.339), elevated FBG (Poverall ≤ 0.001, Pnonlinear = 0.658), and elevated TG (Poverall ≤ 0.001, Pnonlinear = 161) (Figures 4B–F); Interestingly, when analyzing the number of MetS components as outcomes, we found that MetS-IR was positively correlated with the presence of 2, 3, and ≥ 4 MetS components. However, a nonlinear relationship was only observed in participants with 3 or more MetS components (Supplementary Figure S2). Two-segment Cox regression analysis showed that a 1-SD increment in MetS–IR was associated with a 1.21-fold increase in the risk of higher MetS status (HR = 1.209, 95% CI: 1.109–1.319, p < 0.001) when MetS–IR levels were below 32.89. Similarly, a 1-SD increment in MetS–IR was associated with a 1.12-fold increase in the risk of higher MetS status (HR = 1.124, 95% CI: 1.089–1.161, p < 0.001) when MetS–IR levels were greater than or equal to 32.89 (Supplementary Table S1).
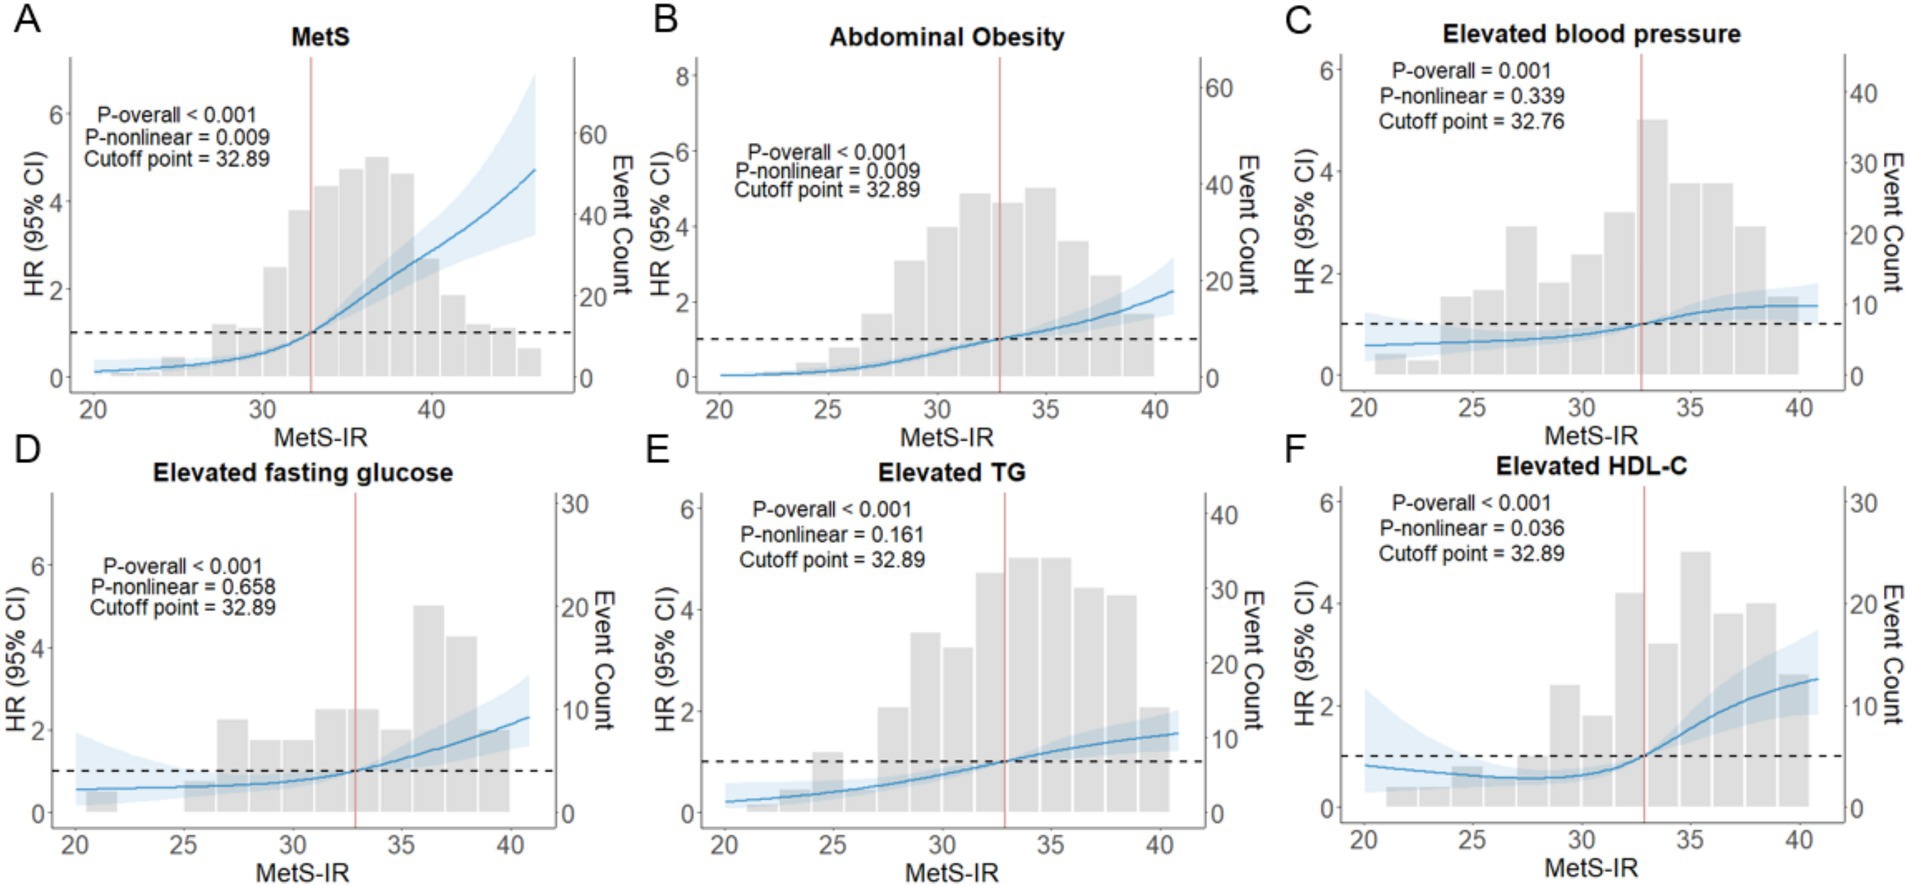
Figure 4. The nonlinear associations between MetS–IR and the hazard ratios of MetS and its components were analyzed using restricted cubic splines (A–F). RCS with four knots were used, and the models were adjusted for age and gender. 95% CI, 95% confidence interval; HR, hazard ratio; p-overall, p-value for model tests; p-nonlinear, p-value for nonlinear tests.
Subgroup analyses and sensitivity analysis
Further subgroup analysis was performed to explore the robustness and reliability of the relationships between MetS-IR and MetS (Figure 5). A significant positive relationship between MetS-IR and MetS was observed across different demographic settings, consistent with previous analyses of the whole population. Interaction tests revealed significant interaction effects between MetS-IR and gender, diabetes, indicating that these factors may influence the positive correlation between MetS-IR and MetS (P for interaction <0.05). Additionally, a sensitivity analysis was conducted, revealing that each standard deviation increase in MetS-IR was associated with a 16% higher risk of MetS in Model 2 (Supplementary Table S2).
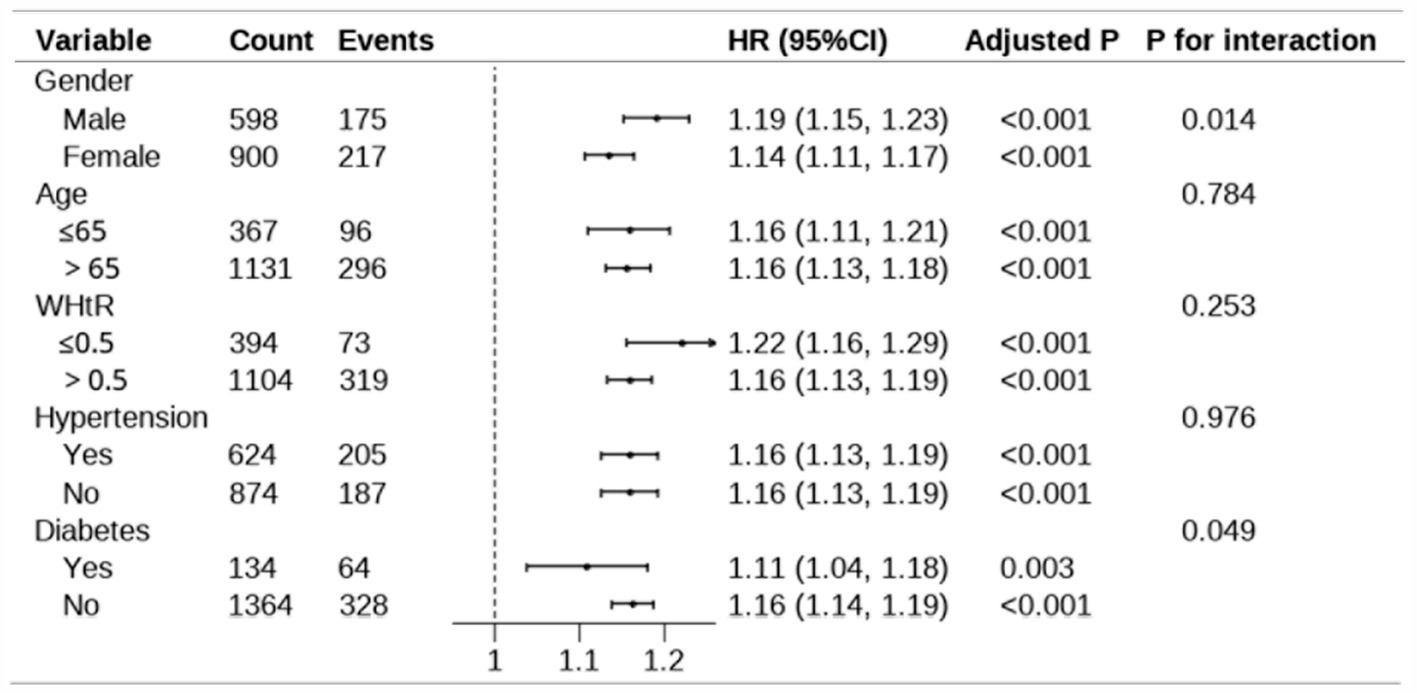
Figure 5. Subgroup analysis for the association between MetS-IR and MetS. The model adjust for age, sex, smoking, alcohol use, exercise frequency, WBC, antihypertensive medication, and antidiabetic medication. In the subgroup analysis stratified by gender and age, the model is not adjusted for gender and age, respectively. Adjusted p-values were calculated using the Benjamini post-hoc test. “Count” represents the total number of participants in each subgroup, while “Events” indicates the number of cases observed in each subgroup. The p-values for interaction assess the heterogeneity of associations across subgroups. WHtR, waist-to-height ratio; 95% CI, 95% confidence interval; HR, hazard ratio.
ROC analysis for predicting the incidence of MetS development
ROC curves were conducted to identify the optimal predictive indicator for MetS and its associated components by MetS-IR, SBP, DBP, BMI, TC, and FBG (Figure 6). The results showed that the AUC of MetS-IR, SBP, DBP, BMI, TC and FBG for MetS were 0.713 (0.74, 0.768), 0.518 (0.485, 0.552), 0.534 (0.501, 0.567), 0.662 (0.632, 0.693), 0.522 (0.488, 0.555) and 0.616 (0.583, 0.650), respectively. More importantly, the ROC curve of MetS-IR was significantly different from those of the other indicators (p < 0.001), suggesting a superior predictive performance for MetS. The optimal cut-off value for MetS-IR was determined to be 32.7, with the HRs being 3.92(95%CI, 3.09–4.98). As for the MetS components, MetS-IR also had the highest predictive power for elevated TG and reduced HDL-C, and exhibited significant differences with other indicators. Additionally, we found that MetS-IR had the highest AUCs in predicting the occurrence of 2, 3, and > 4 MetS components, with the values of 0.794, 0.857, and 0.931, respectively (Supplementary Figure S3).
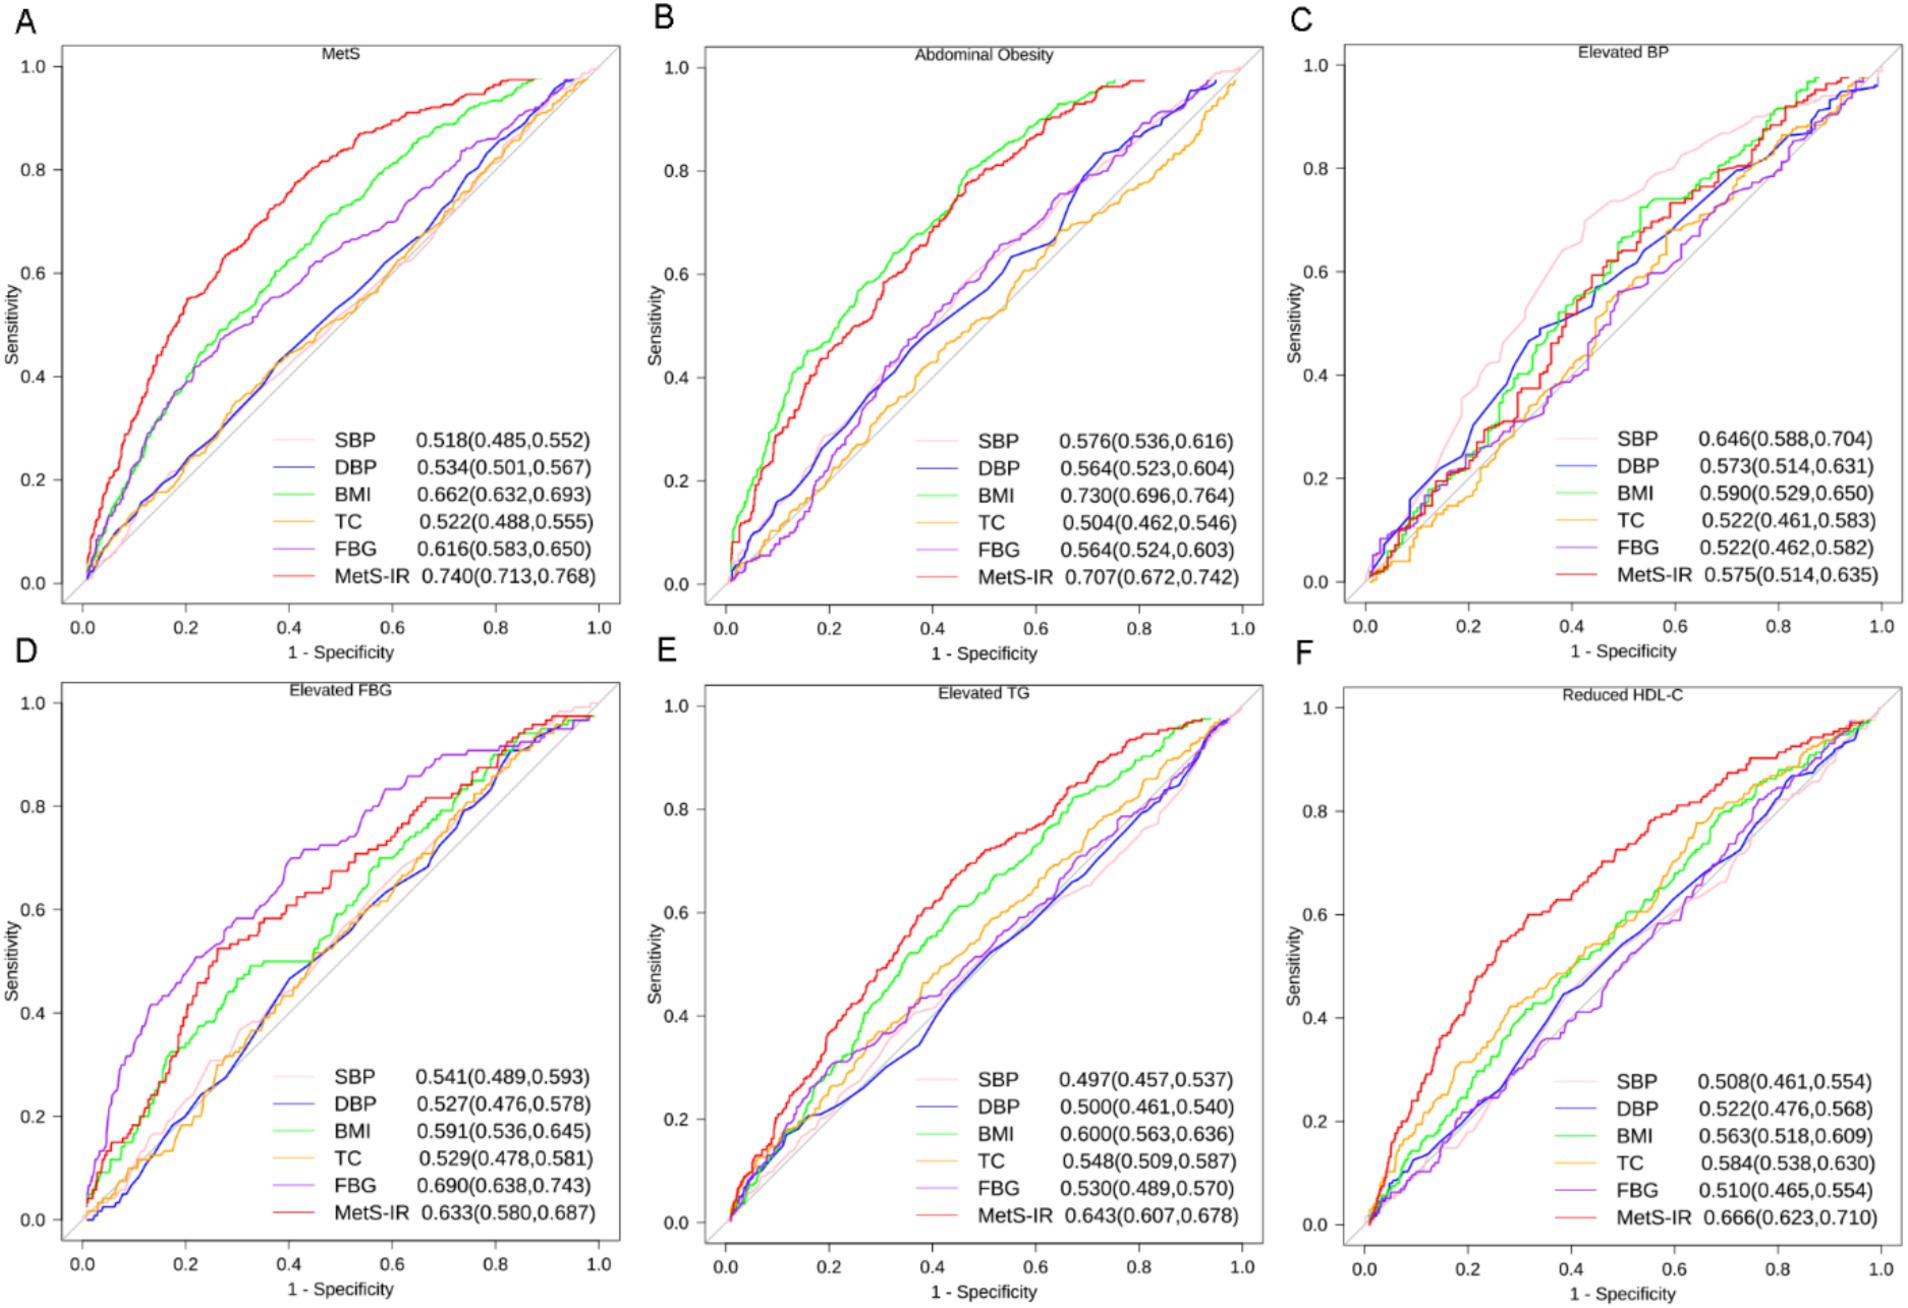
Figure 6. ROC curves for different indicators predicting incident MetS and its components. (A) MetS, (B) Abdominal Obesity, (C) Elevated BP, (D) Elevated FBG, (E) Elevated TG, (F) Reduced HDL-C. Footnotes are area under the curve and 95% confidence intervals. SBP, systolic blood pressure; DBP, diastolic blood pressure; BMI, body mass index; TC, total cholesterol; FBG, fasting blood glucose; MetS-IR, metabolic score for insulin resistance; TG, triglycerides; HDL-C, high-density lipoprotein cholesterol.
Discussion
In this cohort study, our results supported a positive association between MetS-IR and incident MetS and its components in the middle-aged and older adult Chinese population. This relationship exhibited a non-linear dose–response relationship between MetS-IR with incident MetS, abdominal obesity, and reduced HDL-C. A MetS-IR index exceeding 32.89 is suggestive of an elevated risk for MetS diseases. Compared with other metrics, MetS demonstrates the highest AUC, suggesting that MetS serves as a superior predictor for MetS. These findings indicate that maintaining lower MetS-IR levels might alleviate the onset of MetS among middle-aged and older adults.
MetS is widely acknowledged as a significant predictor of cardiovascular disease and cognitive impairment in the older adult population (21, 22). In our study cohort, the incidence rate of MetS was 12.21 cases per 100 person-years. Relevant studies have reported a positive association between MetS in the older adult and an increased incidence and progression of mild cognitive impairment to dementia (23). MetS is associated with various risk factors and several proposed pathophysiological mechanisms, such as insulin resistance (IR), chronic low-grade inflammation, and oxidative stress, with IR possibly being the primary cause (24–26). IR is a critical biomarker for MetS, with several key indicators including insulin (27), C-peptide (28), and the Homeostatic Model Assessment of Insulin Resistance (HOMA-IR) (29). Despite their importance, these biomarkers have notable drawbacks. Insulin and C-peptide levels lack consistent reference ranges and require specific laboratory conditions for measurement (30–32). HOMA-IR, although widely used, suffers from variable reference values and the need for precise fasting plasma insulin and glucose data, making its standardization and practical application challenging (33).
MetS-IR, a novel alternative indicator for IR, has emerged as a widely applied and promising metric, primarily utilized for cardiovascular health assessment and IR screening (13). Extensive epidemiological evidence has demonstrated that MetS-IR can be utilized to predict and assess the risk of various MetS components, including obesity (34), T2DM (35), hypertension (14), and dyslipidemia (36). Given these diverse applications, MetS-IR promises to become an important comprehensive indicator in clinical practice. The mechanisms through which IR impacts metabolic health further underscore the utility of MetS-IR as an effective measure. First, IR leads to reduced cellular uptake of glucose in the bloodstream, resulting in elevated blood glucose levels. A cohort study in China found that increased MetS-IR elevated the incidence of T2DM in the rural population (37). Second, the metabolic effects of IR, through increased sympathetic nervous system (SNS) activity and renal sodium retention, contribute to the development of hypertension (38). A retrospective study in Japan involving 15,453 participants showed that a one-unit increase in MetS-IR was associated with a 0.95-fold and 1.12-fold increase in pre-hypertension and hypertension, respectively (39). Furthermore, the body experiences elevated insulin levels under insulin-resistant conditions, exposing the liver to relative hyperinsulinemia. Insulin can inhibit the breakdown of fat in adipose tissue under catecholamine stimulation and stimulate the uptake of glucose in adipocytes for storage as fat, thereby promoting lipogenesis, leading to increased VLDL and reduced HDL particle production, manifesting as elevated plasma triglycerides, decreased HDL cholesterol, and abdominal obesity (40–42). Chinese researchers have found that MetS-IR can influence the risk of stroke through its impact on LDL-C levels (36). In summary, The various metabolic disturbances observed in MetS, including dyslipidemia, hypertension, and altered glucose metabolism, can be attributed to the abnormal physiological responses driven by elevated insulin concentrations in the insulin-resistant state.
The multivariable Cox regression and RCS analysis confirmed an overall correlation between MetS-IR and MetS. However, the RCS analysis revealed a more nuanced, non-linear relationship between these variables. Specifically, the data indicated the existence of an effect starting point, when MetS–IR < 32.89, the HR curve remains relatively stable, whereas when MetS–IR > 32.89, the HR increases significantly, indicating that 32.89 is a critical turning point for risk changes. Individuals with MetS–IR levels above this threshold are likely part of a high-risk population, necessitating closer monitoring and potential intervention. For instance, research in a Chinese population demonstrated a significant non-linear relationship between MetS-IR and the risk of prediabetes, with a clear quantitative saturation point (43). Similarly, a 10-year longitudinal study reported an early J-shaped dose–response relationship between MetS-IR and the risk of total stroke (44). Taken together, these non-linear analyses provide important insights into the complex associations between MetS-IR and various disease outcomes. By identifying critical thresholds, this approach can help elucidate the mechanistic underpinnings of MetS-IR-related pathologies. Accordingly, future research should continue to explore the non-linear relationships between MetS-IR and other health conditions, with the aim of informing more precise, evidence-based clinical decision-making.
The different effects of MetS on different gender populations can be attributed to several factors. Firstly, lifestyle-related disparities play a significant role. Males generally exhibit higher rates of smoking and alcohol consumption, as well as lower levels of physical activity, compared to females. These unhealthy lifestyle habits contribute to the accumulation of abdominal fat, which is a key component of MetS. Numerous studies have demonstrated the detrimental effects of smoking (45), alcohol consumption (46), and excessive adiposity (1) on glucose metabolism, leading to the development of IR and, consequently, an increased risk of MetS (47). Secondly, the age-related decline in testosterone levels observed in older adult men may also contribute to the gender-specific differences in MetS susceptibility. Testosterone deficiency has been linked to the development of IR and abnormal glucose metabolism, both of which are important risk factors for MetS (48–50). The decline in estrogen levels and the concurrent increase in bioavailable testosterone in postmenopausal women are key drivers of visceral adipose tissue accumulation, insulin resistance, and dyslipidemia, collectively heightening the risk of MetS (51–53). Thirdly, Significant sex-specific differences in body composition, particularly in fat and muscle distribution, play a critical role in the pathophysiology and development of MetS (54). It is important to note that the relatively small sample sizes of participants with a WHtR≤0.5 and non-diabetic individuals in the study may have introduced a certain degree of randomness and error in the estimation of hazard ratios (55). This potential limitation could have obscured any meaningful differences in the effect sizes observed between these two subgroups. Our study suggested that intervention in males may contribute to reducing incidence.
Although the AUC value of 0.740 is considered moderate, it has been regarded in the fields of epidemiology and public health as sufficient for screening high-risk populations and aiding in early risk stratification (56). For example, a study conducted in the United States reported an AUC of 0.616 for METS-IR in predicting the risk of heart failure in adults (57). Similarly, in middle-aged and older adult populations, METS-IR achieved an AUC of 0.631 for predicting hyperuricemia (58). Additionally, in a 10-year longitudinal study, the AUC of METS-IR for predicting coronary artery disease ranged between 0.53 and 0.61 (59). While these findings suggest that METS-IR has certain limitations in its predictive performance, they also highlight its potential and practical utility in assessing the risk of metabolic diseases. Furthermore, the AUC value of 0.740 observed in our study is relatively higher compared to similar studies, which may indicate its applicability in risk assessment. As older adult individuals age, the progressive decline in muscle mass is accompanied by an increase in fat proportion, despite stable overall body weight, rendering BMI an inadequate measure of metabolic risk (60, 61). Height can be significantly reduced due to spinal shortening caused by degenerative bone diseases or kyphosis, introducing additional inaccuracies into BMI calculations for older adult individuals. Although BMI is generally effective in evaluating overall obesity, its predictive capacity for central obesity and metabolic risk remains relatively limited (62–64). In contrast, METS-IR is comprised of parameters that span multiple dimensions of lipid metabolism, glucose metabolism, and body composition, thereby exhibiting a more robust association with metabolic diseases.
Several specific strengths emerged in our study. First, to our knowledge, this is the first cohort study to examine the exploration of the relationship between MetS -IR and MetS in middle-aged and older adults. This study adopts a cohort design utilizing real-world data, which provides a robust framework for establishing the causal relationship between MetS-IR and MetS. Moreover, the analytical approach accounted for a comprehensive set of potential confounding factors, thereby mitigating the risk of biased estimates. However, certain limitations are also present. Firstly, as a retrospective cohort study, this research inevitably encountered instances of missing data. To address this issue, multiple chained imputation methods were employed, revealing no significant differences in the baseline characteristics of the population before and after imputation. Furthermore, analyses performed after excluding individuals with missing data yielded results consistent with those derived from the complete dataset, thereby minimizing the potential bias associated with missing data. Secondly, although this study adjusted for various factors such as demographic characteristics, lifestyle, and medication use, residual confounding factors, including socioeconomic status, dietary habits, and diabetes duration, were not accounted for. Given that the study population was sourced from a single region, the variability in dietary patterns is likely minimal. Future research should incorporate more comprehensive data on lifestyle and socioeconomic variables to enhance the control of potential confounding biases. Thirdly, the relatively limited follow-up duration precluded the observation of cardiovascular events associated with metabolic syndrome. As this cohort forms part of a long-term public health initiative, future extended follow-up, coupled with a more comprehensive examination of contextual factors, has the potential to yield more robust evidence elucidating the relationship between MetS-IR and the risk of metabolic syndrome onset, while simultaneously offering critical insights into the progression of adverse cardiovascular outcomes. Finally, this study was conducted within an older adult population in Guangxi, China, where dietary patterns, genetic background, lifestyle factors, and metabolic risk profiles may differ from those observed in other populations. As a result, the generalizability of the findings might be constrained. To further enhance the universality of the conclusions, validation using multicenter data or more diverse populations is warranted in future research.
Conclusion
In summary, our findings indicate a nonlinear dose–response relationship between MetS-IR and incident MetS, abdominal obesity, and reduced HDL-C in the middle-aged older adult population but linear associations of MetS-IR and elevated BP, elevated FBG, elevated TG. These observations underscore the potential clinical utility of minimizing MetS-IR as an important and effective measure to prevent MetS. The insights gained from this research provide valuable evidence to inform the development of targeted prevention strategies for MetS in middle-aged and older adult population.
Data availability statement
Due to ethical and privacy concerns, the data are not publicly available but can be requested from the corresponding author.
Ethics statement
The studies involving humans were approved by the Institutional Review Board of the First People’s Hospital of Yulin. The studies were conducted in accordance with the local legislation and institutional requirements. Written informed consent for participation was not required from the participants or the participants’ legal guardians/next of kin because the data comes from China’s National Basic Public Health System, which is a project that provides physical examinations, health education, and health management for the older adult. Participants have been informed that the data may be used for academic research.
Author contributions
QZ: Data curation, Investigation, Project administration, Resources, Writing – original draft. YW: Conceptualization, Data curation, Formal analysis, Investigation, Methodology, Supervision, Writing – original draft, Writing – review & editing, Software, Validation. SH: Data curation, Methodology, Writing – original draft, Project administration. YM: Data curation, Investigation, Resources, Writing – original draft. BY: Data curation, Investigation, Methodology, Software, Supervision, Writing – original draft. XJ: Data curation, Formal analysis, Supervision, Writing – original draft, Investigation. MX: Data curation, Investigation, Writing – original draft. XM: Data curation, Investigation, Methodology, Writing – original draft. CT: Data curation, Investigation, Resources, Writing – original draft. HL: Data curation, Formal analysis, Investigation, Writing – original draft. RL: Project administration, Resources, Writing – original draft. ML: Conceptualization, Data curation, Investigation, Methodology, Project administration, Resources, Supervision, Writing – original draft. ZM: Formal analysis, Methodology, Project administration, Resources, Writing – original draft, Conceptualization. WX: Project administration, Resources, Writing – original draft, Conceptualization.
Funding
The author(s) declare that financial support was received for the research, authorship, and/or publication of this article. Guangxi Science and Technology Major Project (Grant No. Guike AA22096030). Guangxi Key Research and Development Project (Grant No. Guike AB21196022).
Conflict of interest
The authors declare that the research was conducted in the absence of any commercial or financial relationships that could be construed as a potential conflict of interest.
Publisher’s note
All claims expressed in this article are solely those of the authors and do not necessarily represent those of their affiliated organizations, or those of the publisher, the editors and the reviewers. Any product that may be evaluated in this article, or claim that may be made by its manufacturer, is not guaranteed or endorsed by the publisher.
Supplementary material
The Supplementary material for this article can be found online at: https://www.frontiersin.org/articles/10.3389/fpubh.2025.1453144/full#supplementary-material
References
1. Després, JP, and Lemieux, I. Abdominal obesity and metabolic syndrome. Nature. (2006) 444:881–7. doi: 10.1038/nature05488
2. Chang, AY, Skirbekk, VF, Tyrovolas, S, Kassebaum, NJ, and Dieleman, JL. Measuring population ageing: an analysis of the global burden of disease study 2017. Lancet Public Health. (2019) 4:e159–67. doi: 10.1016/s2468-2667(19)30019-2
3. Zhang, J, Tong, H, Jiang, L, Zhang, Y, and Hu, J. Trends and disparities in China's cardiovascular disease burden from 1990 to 2019. Nutr Metab Cardiovasc Dis. (2023) 33:2344–54. doi: 10.1016/j.numecd.2023.07.039
4. Scuteri, A, Najjar, SS, Morrell, CH, and Lakatta, EG. The metabolic syndrome in older individuals: prevalence and prediction of cardiovascular events: the cardiovascular health study. Diabetes Care. (2005) 28:882–7. doi: 10.2337/diacare.28.4.882
5. Yao, F, Bo, Y, Zhao, L, Li, Y, Ju, L, Fang, H, et al. Prevalence and influencing factors of metabolic syndrome among adults in China from 2015 to 2017. Nutrients. (2021) 13:1312. doi: 10.3390/nu13124475
6. He, YN, Zhao, WH, Zhao, LY, Yu, DM, Zhang, J, Yang, XG, et al. Prevalence of metabolic syndrome in Chinese adults in 2010-2012. Zhonghua Liu Xing Bing Xue Za Zhi. (2017) 38:212–5. doi: 10.3760/cma.j.issn.0254-6450.2017.02.015
7. Levesque, J, and Lamarche, B. The metabolic syndrome: definitions, prevalence and management. J Nutrigenet Nutrigenomics. (2008) 1:100–8. doi: 10.1159/000112457
8. Rochlani, Y, Pothineni, NV, Kovelamudi, S, and Mehta, JL. Metabolic syndrome: pathophysiology, management, and modulation by natural compounds. Ther Adv Cardiovasc Dis. (2017) 11:215–25. doi: 10.1177/1753944717711379
9. Fahed, G, Aoun, L, Bou Zerdan, M, Allam, S, Bou Zerdan, M, Bouferraa, Y, et al. Metabolic syndrome: updates on pathophysiology and management in 2021. Int J Mol Sci. (2022) 23:232. doi: 10.3390/ijms23020786
10. McCracken, E, Monaghan, M, and Sreenivasan, S. Pathophysiology of the metabolic syndrome. Clin Dermatol. (2018) 36:14–20. doi: 10.1016/j.clindermatol.2017.09.004
11. Muniyappa, R, Lee, S, Chen, H, and Quon, MJ. Current approaches for assessing insulin sensitivity and resistance in vivo: advantages, limitations, and appropriate usage. Am J Physiol Endocrinol Metab. (2008) 294:E15–26. doi: 10.1152/ajpendo.00645.2007
12. Tam, CS, Xie, W, Johnson, WD, Cefalu, WT, Redman, LM, and Ravussin, E. Defining insulin resistance from hyperinsulinemic-euglycemic clamps. Diabetes Care. (2012) 35:1605–10. doi: 10.2337/dc11-2339
13. Bello-Chavolla, OY, Almeda-Valdes, P, Gomez-Velasco, D, Viveros-Ruiz, T, Cruz-Bautista, I, Romo-Romo, A, et al. METS-IR, a novel score to evaluate insulin sensitivity, is predictive of visceral adiposity and incident type 2 diabetes. Eur J Endocrinol. (2018) 178:533–44. doi: 10.1530/eje-17-0883
14. Bello-Chavolla, OY, Antonio-Villa, NE, Vargas-Vázquez, A, Martagón, AJ, Mehta, R, Arellano-Campos, O, et al. Prediction of incident hypertension and arterial stiffness using the non-insulin-based metabolic score for insulin resistance (METS-IR) index. J Clin Hypertens. (2019) 21:1063–70. doi: 10.1111/jch.13614
15. Cai, XT, Zhu, Q, Liu, SS, Wang, MR, Wu, T, Hong, J, et al. Associations between the metabolic score for insulin resistance index and the risk of type 2 diabetes mellitus among non-obese adults: insights from a population-based cohort study. Int J Gen Med. (2021) 14:7729–40. doi: 10.2147/ijgm.S336990
16. Li, Y, You, A, Tomlinson, B, Yue, L, Zhao, K, Fan, H, et al. Insulin resistance surrogates predict hypertension plus hyperuricemia. J Diabetes Investig. (2021) 12:2046–53. doi: 10.1111/jdi.13573
17. Zhang, X, Liu, F, Li, W, Zhang, J, Zhang, T, Yu, X, et al. Metabolic score for insulin resistance (METS-IR) predicts adverse cardiovascular events in patients with type 2 diabetes and ischemic cardiomyopathy. Diabetes Metab Syndr Obes. (2023) 16:1283–95. doi: 10.2147/dmso.S404878
18. Widjaja, NA, Irawan, R, Hanindita, MH, Ugrasena, I, and Handajani, R. METS-IR vs. HOMA-AD and metabolic syndrome in obese adolescents. J Med Investig. (2023) 70:7–16. doi: 10.2152/jmi.70.7
19. Rattanatham, R, Tangpong, J, Chatatikun, M, Sun, D, Kawakami, F, Imai, M, et al. Assessment of eight insulin resistance surrogate indexes for predicting metabolic syndrome and hypertension in Thai law enforcement officers. PeerJ. (2023) 11:e15463. doi: 10.7717/peerj.15463
20. Li, L, Zhang, R, Chen, Y, Deng, H, Liu, S, Wang, G, et al. Achievements and challenges in health management for aged individuals in primary health care sectors: a survey in Southwest China. BMC Public Health. (2020) 20:338. doi: 10.1186/s12889-020-8210-2
21. Lin, CS, Lee, WJ, Lin, SY, Lin, HP, Chen, RC, Lin, CH, et al. Subtypes of premorbid metabolic syndrome and associated clinical outcomes in older adults. Front Med. (2021) 8:698728. doi: 10.3389/fmed.2021.698728
22. Nilsson, PM, Tuomilehto, J, and Rydén, L. The metabolic syndrome - what is it and how should it be managed? Eur. J Prev Cardiol. (2019) 26:33. doi: 10.1177/2047487319886404
23. Ng, TP, Feng, L, Nyunt, MS, Feng, L, Gao, Q, Lim, ML, et al. Metabolic syndrome and the risk of mild cognitive impairment and progression to dementia: follow-up of the Singapore longitudinal ageing study cohort. JAMA Neurol. (2016) 73:456–63. doi: 10.1001/jamaneurol.2015.4899
24. Boden, G, Lebed, B, Schatz, M, Homko, C, and Lemieux, S. Effects of acute changes of plasma free fatty acids on intramyocellular fat content and insulin resistance in healthy subjects. Diabetes. (2001) 50:1612–7. doi: 10.2337/diabetes.50.7.1612
25. McMaster, WG, Kirabo, A, Madhur, MS, and Harrison, DG. Inflammation, immunity, and hypertensive end-organ damage. Circ Res. (2015) 116:1022–33. doi: 10.1161/circresaha.116.303697
26. Reaven, GM. Banting lecture 1988. Role of insulin resistance in human disease. Diabetes. (1988) 37:1595–607. doi: 10.2337/diab.37.12.1595
27. Saravia, G, Civeira, F, Hurtado-Roca, Y, Andres, E, Leon, M, Pocovi, M, et al. Glycated hemoglobin, fasting insulin and the metabolic syndrome in males cross-sectional analyses of the aragon workers' health study baseline. PLoS One. (2015) 10:e0132244. doi: 10.1371/journal.pone.0132244
28. Gonzalez-Mejia, ME, Porchia, LM, Torres-Rasgado, E, Ruiz-Vivanco, G, Pulido-Pérez, P, Báez-Duarte, BG, et al. C-peptide is a sensitive Indicator for the diagnosis of metabolic syndrome in subjects from Central Mexico. Metab Syndr Relat Disord. (2016) 14:210–6. doi: 10.1089/met.2015.0067
29. Arellano-Ruiz, P, García-Hermoso, A, Cavero-Redondo, I, Pozuelo-Carrascosa, D, Martínez-Vizcaíno, V, and Solera-Martinez, M. Homeostasis model assessment cut-off points related to metabolic syndrome in children and adolescents: a systematic review and meta-analysis. Eur J Pediatr. (2019) 178:1813–22. doi: 10.1007/s00431-019-03464-y
30. Barazzoni, R, Silva, V, and Singer, P. Clinical biomarkers in metabolic syndrome. Nutr Clin Pract. (2014) 29:215–21. doi: 10.1177/0884533613516168
31. Cho, YH, Lee, Y, Choi, JI, Lee, SR, and Lee, SY. Biomarkers in metabolic syndrome. Adv Clin Chem. (2022) 111:101–56. doi: 10.1016/bs.acc.2022.07.003
32. Johnson, JL, Duick, DS, Chui, MA, and Aldasouqi, SA. Identifying prediabetes using fasting insulin levels. Endocr Pract. (2010) 16:47–52. doi: 10.4158/ep09031.Or
33. Timóteo, AT, Miranda, F, Carmo, MM, and Ferreira, RC. Optimal cut-off value for homeostasis model assessment (HOMA) index of insulin-resistance in a population of patients admitted electively in a Portuguese cardiology ward. Acta Medica Port. (2014) 27:473–9. doi: 10.20344/amp.5180
34. Dong, J, Liu, YH, Lu, YK, Hu, LK, Chen, N, Ma, LL, et al. Association between surrogate indicators of insulin resistance and risk of type 2 diabetes combined with hypertension among Chinese adults: two independent cohort studies. Nutr Metab. (2022) 19:85. doi: 10.1186/s12986-022-00720-1
35. Gu, P, Pu, B, Xin, Q, Yue, D, Luo, L, Tao, J, et al. The metabolic score of insulin resistance is positively correlated with bone mineral density in postmenopausal patients with type 2 diabetes mellitus. Sci Rep. (2023) 13:8796. doi: 10.1038/s41598-023-32931-8
36. Qian, T, Sheng, X, Shen, P, Fang, Y, Deng, Y, and Zou, G. Mets-IR as a predictor of cardiovascular events in the middle-aged and elderly population and mediator role of blood lipids. Front Endocrinol. (2023) 14:1224967. doi: 10.3389/fendo.2023.1224967
37. Zhang, M, Liu, D, Qin, P, Liu, Y, Sun, X, Li, H, et al. Association of metabolic score for insulin resistance and its 6-year change with incident type 2 diabetes mellitus. J Diabetes. (2021) 13:725–34. doi: 10.1111/1753-0407.13161
38. da Silva, AA, do Carmo, JM, Li, X, Wang, Z, Mouton, AJ, and Hall, JE. Role of hyperinsulinemia and insulin resistance in hypertension: metabolic syndrome revisited. Can J Cardiol. (2020) 36:671–82. doi: 10.1016/j.cjca.2020.02.066
39. Han, KY, Gu, J, Wang, Z, Liu, J, Zou, S, Yang, CX, et al. Association between METS-IR and prehypertension or hypertension among Normoglycemia subjects in Japan: a retrospective study. Front Endocrinol. (2022) 13:851338. doi: 10.3389/fendo.2022.851338
40. Bäckdahl, J, Franzén, L, Massier, L, Li, Q, Jalkanen, J, Gao, H, et al. Spatial mapping reveals human adipocyte subpopulations with distinct sensitivities to insulin. Cell Metab. (2021) 33:1869–1882.e6. doi: 10.1016/j.cmet.2021.07.018
41. Bjornstad, P, and Eckel, RH. Pathogenesis of lipid disorders in insulin resistance: a brief review. Curr Diab Rep. (2018) 18:127. doi: 10.1007/s11892-018-1101-6
42. Tchernof, A, and Després, JP. Pathophysiology of human visceral obesity: an update. Physiol Rev. (2013) 93:359–404. doi: 10.1152/physrev.00033.2011
43. Xie, Q, Kuang, M, Lu, S, Huang, X, Wang, C, Zhang, S, et al. Association between MetS-IR and prediabetes risk and sex differences: a cohort study based on the Chinese population. Front Endocrinol. (2023) 14:1175988. doi: 10.3389/fendo.2023.1175988
44. Wu, Z, Cui, H, Zhang, Y, Liu, L, Zhang, W, Xiong, W, et al. The impact of the metabolic score for insulin resistance on cardiovascular disease: a 10-year follow-up cohort study. J Endocrinol Investig. (2023) 46:523–33. doi: 10.1007/s40618-022-01925-0
45. Cena, H, Fonte, ML, and Turconi, G. Relationship between smoking and metabolic syndrome. Nutr Rev. (2011) 69:745–53. doi: 10.1111/j.1753-4887.2011.00446.x
46. Sun, K, Ren, M, Liu, D, Wang, C, Yang, C, and Yan, L. Alcohol consumption and risk of metabolic syndrome: a meta-analysis of prospective studies. Clin Nutr. (2014) 33:596–602. doi: 10.1016/j.clnu.2013.10.003
47. Myers, J, Kokkinos, P, and Nyelin, E. Physical activity, cardiorespiratory fitness, and the metabolic syndrome. Nutrients. (2019) 11:117. doi: 10.3390/nu11071652
48. Barrientos, G, Llanos, P, Basualto-Alarcón, C, and Estrada, M. Androgen-regulated cardiac metabolism in aging men. Front Endocrinol. (2020) 11:316. doi: 10.3389/fendo.2020.00316
49. Blaya, R, Blaya, P, Rhoden, L, and Rhoden, EL. Low testosterone levels and metabolic syndrome in aging male. Curr Pharm Des. (2017) 23:4470–4. doi: 10.2174/1381612823666170503150955
50. Dimopoulou, C, Goulis, DG, Corona, G, and Maggi, M. The complex association between metabolic syndrome and male hypogonadism. Metabolism. (2018) 86:61–8. doi: 10.1016/j.metabol.2018.03.024
51. Banack, HR, Cook, CE, Grandi, SM, Scime, NV, Andary, R, Follis, S, et al. The association between reproductive history and abdominal adipose tissue among postmenopausal women: results from the Women's Health Initiative. Hum Reprod. (2024) 39:1804–15. doi: 10.1093/humrep/deae118
52. Janssen, I, Powell, LH, Jasielec, MS, and Kazlauskaite, R. Covariation of change in bioavailable testosterone and adiposity in midlife women. Obesity (Silver Spring). (2015) 23:488–94. doi: 10.1002/oby.20974
53. Sanchez, BN, Volek, JS, Kraemer, WJ, Saenz, C, and Maresh, CM. Sex differences in energy metabolism: a female-oriented discussion. Sports Med. (2024) 54:2033–57. doi: 10.1007/s40279-024-02063-8
54. Schorr, M, Dichtel, LE, Gerweck, AV, Valera, RD, Torriani, M, Miller, KK, et al. Sex differences in body composition and association with cardiometabolic risk. Biol Sex Differ. (2018) 9:28. doi: 10.1186/s13293-018-0189-3
55. Austin, PC, Allignol, A, and Fine, JP. The number of primary events per variable affects estimation of the subdistribution hazard competing risks model. J Clin Epidemiol. (2017) 83:75–84. doi: 10.1016/j.jclinepi.2016.11.017
56. Cook, NR. Use and misuse of the receiver operating characteristic curve in risk prediction. Circulation. (2007) 115:928–35. doi: 10.1161/circulationaha.106.672402
57. Su, X, Zhao, C, and Zhang, X. Association between METS-IR and heart failure: a cross-sectional study. Front Endocrinol. (2024) 15:1416462. doi: 10.3389/fendo.2024.1416462
58. Han, Y, Zhou, Z, Zhang, Y, Zhao, G, and Xu, B. The Association of Surrogates of insulin resistance with hyperuricemia among middle-aged and older individuals: a population-based Nationwide cohort study. Nutrients. (2023) 15:1514. doi: 10.3390/nu15143139
59. Mirjalili, SR, Soltani, S, Meybodi, ZH, Marques-Vidal, P, Firouzabadi, DD, Eshraghi, R, et al. Which surrogate insulin resistance indices best predict coronary artery disease? A machine learning approach. Cardiovasc Diabetol. (2024) 23:214. doi: 10.1186/s12933-024-02306-y
60. Jura, M, and Kozak, LP. Obesity and related consequences to ageing. Age (Dordr). (2016) 38:23. doi: 10.1007/s11357-016-9884-3
61. Mathus-Vliegen, EM. Obesity and the elderly. J Clin Gastroenterol. (2012) 46:533–44. doi: 10.1097/MCG.0b013e31825692ce
62. Chen, T, Liu, YL, Li, F, Qiu, HN, Haghbin, N, Li, YS, et al. Association of waist-to-hip ratio adjusted for body mass index with cognitive impairment in middle-aged and elderly patients with type 2 diabetes mellitus: a cross-sectional study. BMC Public Health. (2024) 24:2424. doi: 10.1186/s12889-024-19985-7
63. Hong, S, Park, JH, Han, K, Lee, CB, Kim, DS, and Yu, SH. Association between obesity and cardiovascular disease in elderly patients with diabetes: a retrospective cohort study. J Clin Endocrinol Metab. (2022) 107:e515–27. doi: 10.1210/clinem/dgab714
Keywords: METS-IR index, metabolic syndrome, older adult, abdominal obesity, HDL-C (high density lipoprotein)
Citation: Zhang Q, Wei Y, Huang S, Mo Y, Yan B, Jin X, Xu M, Mai X, Tang C, Lan H, Liu R, Li M, Mo Z and Xie W (2025) Association of metabolic score for insulin resistance with incident metabolic syndrome: a cohort study in middle-aged and older adult Chinese population. Front. Public Health. 13:1453144. doi: 10.3389/fpubh.2025.1453144
Edited by:
Giuseppe Signoriello, University of Campania Luigi Vanvitelli, ItalyReviewed by:
Azadeh Anna Nikouee, Loyola University Chicago, United StatesLamis AbdelGadir Kaddam, Al-Neelain University, Sudan
Copyright © 2025 Zhang, Wei, Huang, Mo, Yan, Jin, Xu, Mai, Tang, Lan, Liu, Li, Mo and Xie. This is an open-access article distributed under the terms of the Creative Commons Attribution License (CC BY). The use, distribution or reproduction in other forums is permitted, provided the original author(s) and the copyright owner(s) are credited and that the original publication in this journal is cited, in accordance with accepted academic practice. No use, distribution or reproduction is permitted which does not comply with these terms.
*Correspondence: Wenchao Xie, MTM2MzUwMDczMDhAMTYzLmNvbQ== Zengnan Mo, bW96ZW5nbmFuQGd4bXUuZWR1LmNu Mingli Li, bGltaW5nbGlneEAxMjYuY29t
†These authors have contributed equally to this work