
94% of researchers rate our articles as excellent or good
Learn more about the work of our research integrity team to safeguard the quality of each article we publish.
Find out more
OPINION article
Front. Public Health, 27 February 2025
Sec. Infectious Diseases: Epidemiology and Prevention
Volume 13 - 2025 | https://doi.org/10.3389/fpubh.2025.1448811
 Qing Liu1,2
 Hosung Son1*
Simpson's Paradox is a statistical phenomenon where trends observed in subgroups contradict those seen in the overall dataset (1). When data is segmented for analysis, the direction of relationships can reverse, highlighting the complexities of interpreting subgroup-level patterns (2). This paradox underscores the importance of rigorous analysis in complex datasets, as it may obscure causal relationships or lead to erroneous conclusions (1, 3). Its implications extend to various probability-dependent disciplines, including decision theory, causal inference, and evolutionary biology (4, 5).
While not intentionally sought, the COVID-19 pandemic has indeed brought about academic prosperity in the fields of medicine and statistics (6–8). Within these studies, there is no shortage of discoveries related to Simpson's Paradox, emphasizing the crucial importance of understanding this paradox for drawing accurate conclusions from data (9). Similarly, Rasool et al. (10), Hong et al. (11), and Han et al. (12) highlight the utility of advanced correlation methods and data-driven approaches in analyzing public sentiment, financial responses, and content recommendation during crises.
During the COVID-19 pandemic, instances of Simpson's Paradox, while not widespread, were observed in several studies, often highlighting challenges in interpreting complex datasets. For example, Sy (13) confirmed the presence of Simpson's Paradox in correlations between excess mortality and COVID-19 injections, suggesting potential unreliability in such findings. Shaki (14) identified similar issues in the World Health Organization's (WHO) early mortality rate predictions, where statistical methods exhibited Simpson's Paradox, leading to initially overestimated fatality rates that later proved lower. These cases underscore the importance of careful statistical analysis in high-stakes public health contexts.
Further illustrating this phenomenon, Raoult (15) demonstrated how mixing patient data with varying stages of illness, treatment dosages, and durations in studies on hydroxychloroquine efficacy produced erroneous results attributable to Simpson's Paradox. Similarly, Lu (16) emphasized the need for caution in revealing causal relationships in COVID-19 case statistics, using the paradox as a framework to critique oversimplified data interpretations. These examples collectively highlight how Simpson's Paradox can obscure critical insights, particularly during crises where decisions hinge on accurate data analysis.
During the COVID-19 pandemic, the study of public psychology and opinion dynamics has gained significant attention. While Simpson's Paradox has been extensively discussed in medical research and statistical case studies (17, 18), its application to public opinion remains largely unexplored. This study bridges that gap by extending the concept of Simpson's Paradox to analyze public sentiment, highlighting how aggregated data can obscure subgroup-specific trends in emotional responses to crises. By focusing on lagged correlations between epidemic intensity and news volume, our approach captures the temporal complexities of public opinion that static analyses overlook. This research not only deepens understanding of individual and societal psychological responses but also introduces a novel perspective on the dynamic interplay between public sentiment and external stimuli during crises significance (6, 19, 20).
The extensive transmission of COVID-19 in China commenced in January 2020 (21). The formal reclassification of COVID-19 by the Chinese National Health Commission from a “Class B, Level A” to a “Class B, Level B” on 8 January 2023,1 may be construed as signifying the conclusion of COVID-19 in China. In a recent scholarly survey, we examined whether fluctuations in COVID-19 intensity during the COVID-19 pandemic in China affect changes in news volume.
For this study, we used COVID-19 new cases and new deaths data from the World Health Organization's data center2 as indicators of COVID-19 intensity. To analyze online sentiments, we collected news and comment data from Weitoutiao,3 a self-media platform under the banner of “Today's Headlines.” Given the impracticality of collecting all available news texts, we focused on aggregating content from opinion leaders—news media and self-media accounts with an average following exceeding six million—as proxies for public opinion. The data covered the period from 1 January 2020, to 31 December 2022, with statistical intervals spanning 3 days to balance granularity and noise reduction.
Although our study primarily relies on data from a single platform, Weitoutiao, the issue of platform-specific limitations has been significantly mitigated in the era of social media. Opinion leaders and news organizations frequently disseminate their content simultaneously across multiple platforms, such as Sina Weibo, Twitter, and Facebook, to maximize reach and influence. By focusing on opinion leaders with significant influence, our dataset captures trends that extend beyond Weitoutiao, reflecting an interconnected ecosystem of platforms.
The COVID-19 intensity data from 2020 to 2022 can be represented as:
where (nci, ndi) represents the daily new cases and new deaths on the i-th day. The set of daily news volumes from 2020 to 2022 can be described as:
where ni denotes the news volume on the i-th day.
To address the issue of data discreteness, we reorganized the above data into statistical intervals of 3 days each. At this point:
and
The selected 3-day interval also aligns with temporal patterns observed in public opinion studies, where short-term fluctuations tend to stabilize over a few days, allowing for clearer analysis of trends without losing responsiveness to dynamic changes.
Table 1 illustrates the correlation statistics between the intensity of COVID-19 and the amount of news text in the statistical interval. The correlation between COVID-19 intensity in different years and news volume at different lags can be observed.

Table 1. Statistics of followers and news.
The complex table data drowns out the statistical laws. In order to observe the statistical laws of the data more clearly, we plotted Figure 1 based on the data in Table 1. In Figure 1, the x-axis denotes the lag of news, where, for a given x, we computed the correlation between CI3 (i ∈[0:−x] ) and N3 (i ∈[x:365]). The color depth of the scatter points indicates the significance of the p-value, with darker colors denoting higher levels of significance, as indicated in the figure's legend. The y-axis in Figure 1 represents the correlation coefficients, while the origin and triangles signify the significance of new cases and new deaths in relation to news volume, respectively.
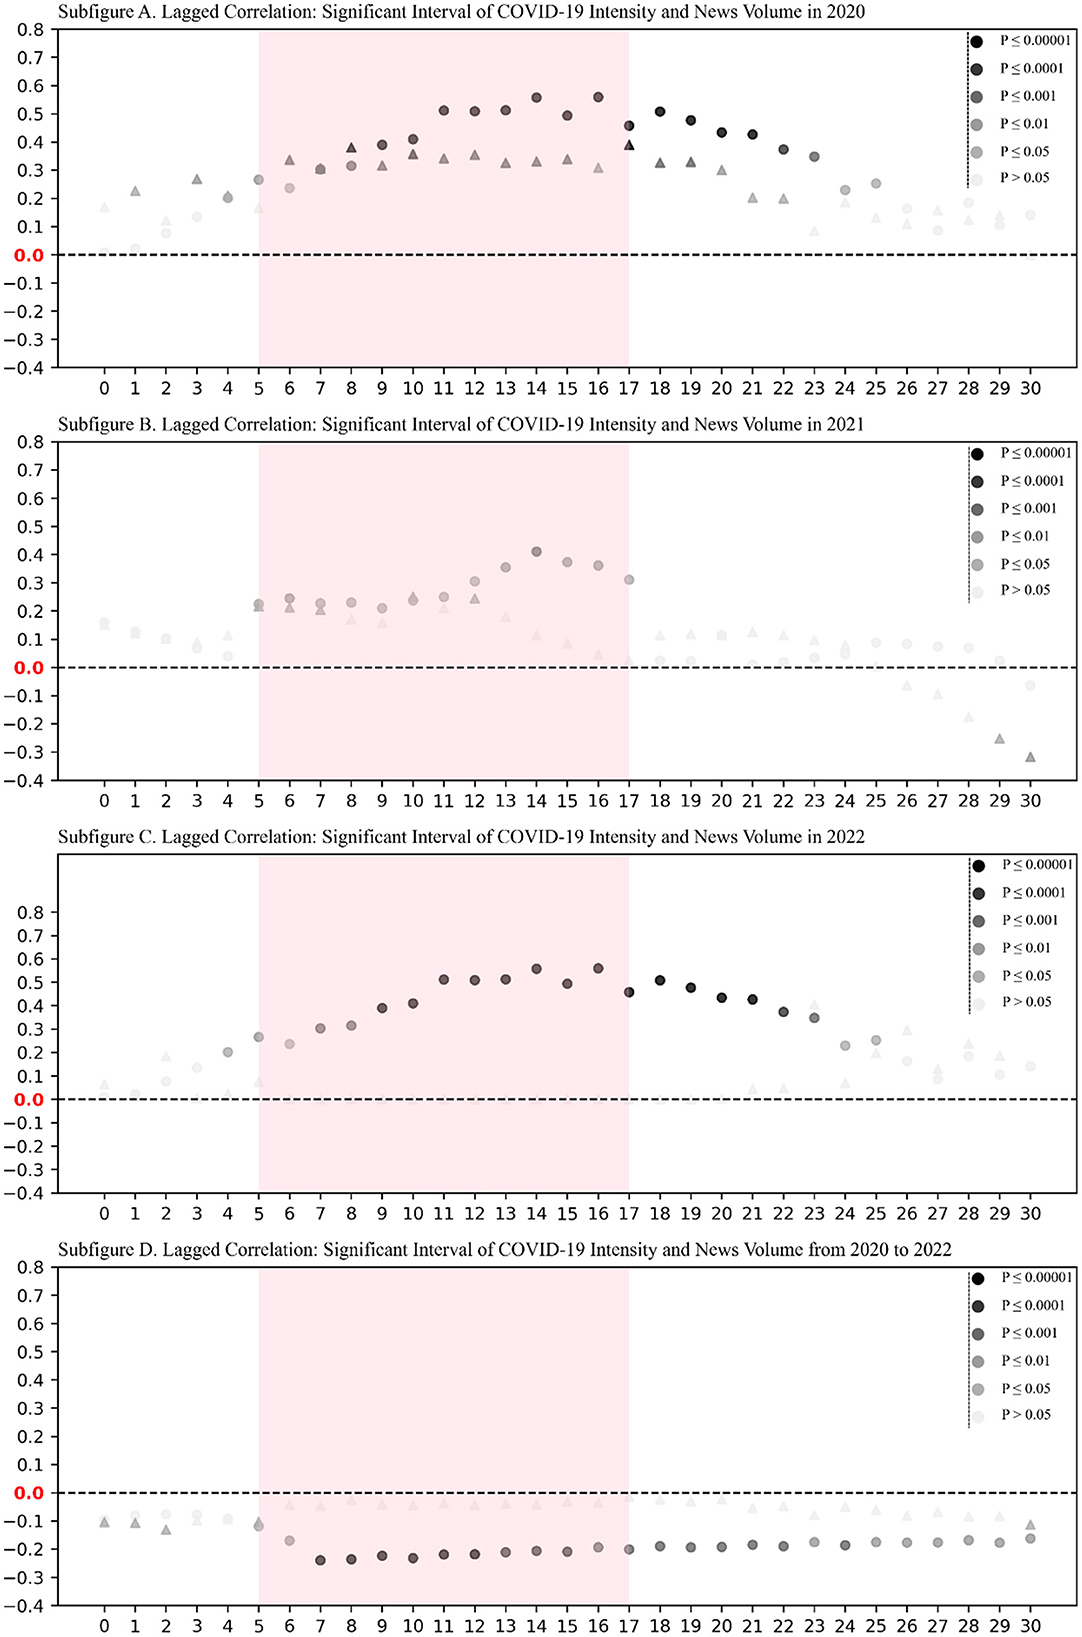
Figure 1. Significant plots of correlation between COVID-19 intensity and news text volume in China. The dashed horizontal line (y = 0) provides a reference for distinguishing positive and negative correlations. The figure was created using consistent styling across subplots to highlight key lag ranges and correlation trends. Subplots (A–C) reveal strong positive correlations (lags 5–17) in individual years, while subplot (D) illustrates a reversal in the aggregated dataset, showcasing Simpson's Paradox.
Figure 1 illustrates the Simpson's Paradox observed in the correlation between COVID-19 intensity and news volume. In subplots A, B, and C of Figure 1, there is a notable positive correlation between COVID-19 new cases in 2020–2022, and the volume of texts lagged from 5 to 17 periods. This implies that stronger instances of COVID-19 lead to greater publication of news texts. However, as shown in subplot D for the entire 3-year period from 2020 to 2022, there is a significant negative correlation between COVID-19 new cases and lagged text volume from 5 to 17 periods. We treat the data for 2020–2022 as subpopulations and the entire dataset as a whole. The initially observed positive correlation between COVID-19 intensity and news volume during the subperiods undergoes a reversal in the comprehensive analysis.
In sociological research, the volume of news itself is considered a manifestation of emotion (22). The correlation between COVID-19 and news volume reflects people's sentiment toward COVID-19. In our case, the reasons for the emergence of Simpson's Paradox may be multifaceted, such as changes in external conditions during different time periods. From a mathematical and probability perspective, there is no issue with the cases demonstrating this paradox, but the conclusions still leave us surprised.
In this article, we present the Simpson's Paradox observed in the correlation between COVID-19 intensity and news volume during the COVID-19 period in China, both in segmented and holistic analyses. This discovery supplements existing research on Simpson's Paradox related to COVID-19, simultaneously illustrating the complexity of public emotional responses to COVID-19 intensity. Our findings align entirely with the typical Simpson's Paradox mentioned by Sprenger and Weinberger (9), emphasizing that two variables may exhibit a negative correlation in the overall dataset but can be independent or even positively correlated within all subgroups.
The Simpson's Paradox, originally introduced by Simpson (23) and later known as Simpson's Paradox (3), reversal paradox (24), and amalgamation paradox (25), continues to pose challenges to our assessments of causality and our understanding of data, even in the era of artificial intelligence and big data (26, 27). As a statistical phenomenon, Simpson's Paradox emphasizes certain challenges in statistical inference. Accurately comprehending the overall trends in data and the relationships between subgroups is crucial for formulating policies and making well-informed decisions (4, 5).
All fields relying on probability are susceptible to Simpson's Paradox (4, 5). During the COVID-19 period, research mentioning the Simpson's Paradox has primarily been in the domains of medicine and case statistics (13, 16, 28). This study proposes the existence of a Simpson paradox between public opinion and epidemic intensity during the COVID-19 pandemic. This finding not only offers a new perspective for understanding the complexity of opinion formation but also underscores the intricacy of public psychology. However, the analysis was limited to data from the COVID-19 pandemic due to the lack of sufficient long-term public opinion data from other global crises, such as H1N1 or SARS, making broader validation a challenge.
Although this study does not delve into the specific reasons behind the Simpson paradox phenomenon, our findings provide new insights for opinion research and social psychology. Behind the paradoxes we mention, there may be complex emotional dynamics at play, suggesting that exploring the underlying causes could be an intriguing new research topic. Moreover, understanding these paradoxes offers practical value for managing public opinion on social media platforms. By identifying how public sentiment evolves during crises, this research could inform strategies to mitigate misinformation and foster accurate information dissemination, contributing to more effective crisis communication and public sentiment management.
QL: Conceptualization, Data curation, Formal analysis, Writing – original draft. HS: Conceptualization, Funding acquisition, Project administration, Supervision, Writing – review & editing.
The author(s) declare financial support was received for the research, authorship, and/or publication of this article. This work was supported by the National Research Foundation of Korea (NRF) grant funded by the Korea government (MSIT: Ministry of Science and ICT) (Grant no. 2022R1G1A1012604).
The authors declare that the research was conducted in the absence of any commercial or financial relationships that could be construed as a potential conflict of interest.
All claims expressed in this article are solely those of the authors and do not necessarily represent those of their affiliated organizations, or those of the publisher, the editors and the reviewers. Any product that may be evaluated in this article, or claim that may be made by its manufacturer, is not guaranteed or endorsed by the publisher.
1. ^https://m.gmw.cn/baijia/2022-12/27/1303236220.html
1. Wagner CH. Simpson's paradox in real life. Am Statisti. (1982) 36:46–8. doi: 10.1080/00031305.1982.10482778
2. Kievit R, Frankenhuis W, Waldorp L, Borsboom D. Simpson's paradox in psychological science: a practical guide. Front Psychol. (2013) 4:513. doi: 10.3389/fpsyg.2013.00513
3. Blyth CR. On Simpson's paradox and the sure-thing principle. J Am Stat Assoc. (1972) 67:364–6. doi: 10.1080/01621459.1972.10482387
4. Pearl J. Comment: understanding Simpson's paradox. In:Geffner H, Dechter R, Halpern JY, , editors, Probabilistic and Causal Inference. ACM. (2022). doi: 10.1145/3501714.3501738
5. Samuels ML. Simpson's paradox and related phenomena. J Am Stat Assoc. (1993) 88:81–8. doi: 10.1080/01621459.1993.10594297
6. Aggarwal A, Agosti E, Singh PM, Varshini A, Garg K, Chaurasia B, et al. Scientometric analysis of medical publications during COVID-19 pandemic: the twenty-twenty research boom. Minerva Med. (2021) 112:631–40. doi: 10.23736/S0026-4806.21.07489-9
7. Geurgas R, Tessler LR. Automatic detection of fake tweets about the COVID-19 vaccine in Portuguese. Soc Netw Anal Mining. (2024) 14:55. doi: 10.1007/s13278-024-01216-x
8. Mehra V, Singh P, Bharany S, Sawhney RS. Sports, crisis, and social media: a Twitter-based exploration of the Tokyo Olympics in the COVID-19 era. Soc Netw Anal Mining. (2024) 14:56. doi: 10.1007/s13278-024-01218-9
9. Sprenger J, Weinberger N. Simpson's Paradox. (2021). Available online at: https://plato.stanford.edu/ENTRIES/paradox-simpson/ (accessed February 10, 2024).
10. Rasool A, Jiang Q, Qu Q, Kamyab M, Huang M. HSMC: hybrid sentiment method for correlation to analyze COVID-19 tweets. In:Q Xie, L Zhao, K Li, A Yadav, L Wang, , editors. Advances in Natural Computation, Fuzzy Systems and Knowledge Discovery. Springer International Publishing. (2022). doi: 10.1007/978-3-030-89698-0_101
11. Hong J, Han P, Rasool A, Chen H, Hong Z, Tan Z, et al. A correlational strategy for the prediction of high-dimensional stock data by neural networks and technical indicators. In: International Conference on Big Data and Security. Singapore: Springer Nature Singapore. (2023). doi: 10.1007/978-981-99-3300-6_29
12. Han P, Hong J, Rasool A, Chen H, Pan Y, Jiang Q. A hybrid recommendation model for social network services using Twitter data. In:Y Zhang, LJ Zhang, , editors. Web Services – ICWS 2022. Springer Nature Switzerland. (2022). doi: 10.1007/978-3-031-23579-5_9
13. Sy W. Simpsons paradox in the correlations between excess mortality and covid-19 injections: a case study of iatrogenic pandemic for elderly Australians. Med Clin Res. (2023) 2023:1–16. doi: 10.13140/RG.2.2.10653.08166
14. Shaki YY. Quasi-Simpson paradox in estimating the expected mortality rate from the SARS-CoV-2. Sci Prog. (2021) 104:00368504211009673. doi: 10.1177/00368504211009673
15. Raoult D. Rational for meta-analysis and randomized treatment: the COVID-19 example. Clin Microbiol Infect. (2021) 27:6–8. doi: 10.1016/j.cmi.2020.10.012
16. Lu C. Causal confirmation measures: from Simpson's paradox to COVID-19. Entropy. (2023) 25:1. doi: 10.3390/e25010143
17. Ausat AMA. The role of social media in shaping public opinion and its influence on economic decisions. Technol Soc Perspect. (2023) 1:1. doi: 10.61100/tacit.v1i1.37
18. Shi D, Guan X. A brief analysis of the government's strategy to guide network public opinion under the new media environment. In: Proceedings of the 2023 4th International Conference on Education, Knowledge and Information Management (ICEKIM 2023). Atlantis Highlights in Computer Sciences. (2023). p. 297–303. doi: 10.2991/978-94-6463-172-2_38
19. Agusto FB, Numfor E, Srinivasan K, Iboi EA, Fulk A, Onge JMS, et al. Impact of public sentiments on the transmission of COVID-19 across a geographical gradient. PeerJ. (2023) 11:e14736. doi: 10.7717/peerj.14736
20. Baker L, Yang CX, Lindsey A, McLeod-Morin A, Telg R, Zagonel A, et al. Public opinion in a pandemic: four surveys conducted with Americans throughout the COVID-19 Pandemic. International Crisis and Risk Communication Conference. (2022). Available online at: https://stars.library.ucf.edu/icrcc/2022/proceedings/12 (accessed February 10, 2024).
21. Liu Q, Huang M, Zhao L, Lee W-S. The dispositional effects of holidays on investor sentiment: therapeutic and hygienic. J Innovat Knowl. (2023) 8:100358. doi: 10.1016/j.jik.2023.100358
22. Nofer M, Hinz O. Using Twitter to predict the stock market. Busin Inform Syst Eng. (2015) 57:229–42. doi: 10.1007/s12599-015-0390-4
23. Simpson EH. The interpretation of interaction in contingency tables. J R Statist Soc. (1951) 13:238–41. doi: 10.1111/j.2517-6161.1951.tb00088.x
24. Messick DM, Van de Geer JP. A reversal paradox. Psychol Bull. (1981) 90:582–93. doi: 10.1037//0033-2909.90.3.582
25. Good IJ, Mittal Y. The amalgamation and geometry of two-by-two contingency tables. Ann Statist. (1987) 15:694–711. doi: 10.1214/aos/1176350369
26. Sharma R, Garayev H, Kaushik M, Peious SA, Tiwari P, Draheim D. Detecting Simpson's paradox: a machine learning perspective. In:C Strauss, A Cuzzocrea, G Kotsis, AM Tjoa, I Khalil, , editors. Database and Expert Systems Applications. Springer International Publishing. (2022). doi: 10.1007/978-3-031-12423-5_25
27. Sharma R, Kaushik M, Peious SA, Shahin M, Vidyarthi A, Tiwari P, et al. Why not to trust big data: discussing statistical paradoxes. In:UK Rage, V Goyal, PK Reddy, , editors. Database Systems for Advanced Applications. DASFAA 2022 International Workshops. Springer International Publishing. (2022). doi: 10.1007/978-3-031-11217-1_4
Keywords: Simpson's Paradox, COVID-19, epidemic intensity, social media opinion, public emotional responses
Citation: Liu Q and Son H (2025) Simpson's Paradox of social media opinion's response to COVID-19. Front. Public Health 13:1448811. doi: 10.3389/fpubh.2025.1448811
Received: 15 June 2024; Accepted: 17 February 2025;
Published: 27 February 2025.
Edited by:
Mario Bernardo-Filho, Rio de Janeiro State University, BrazilReviewed by:
Jeff Bolles, Francis Marion University, United StatesCopyright © 2025 Liu and Son. This is an open-access article distributed under the terms of the Creative Commons Attribution License (CC BY). The use, distribution or reproduction in other forums is permitted, provided the original author(s) and the copyright owner(s) are credited and that the original publication in this journal is cited, in accordance with accepted academic practice. No use, distribution or reproduction is permitted which does not comply with these terms.
*Correspondence: Hosung Son, aHNzb25AcGtudS5hYy5rcg==
Disclaimer: All claims expressed in this article are solely those of the authors and do not necessarily represent those of their affiliated organizations, or those of the publisher, the editors and the reviewers. Any product that may be evaluated in this article or claim that may be made by its manufacturer is not guaranteed or endorsed by the publisher.
Research integrity at Frontiers
Learn more about the work of our research integrity team to safeguard the quality of each article we publish.