 Weiming Hou
- Department of Medical Engineering, Air Force Medical Center, PLA, Air Force Medical University, Beijing, China
Background: Previous studies have typically explored daily lagged relationships between hemorrhagic fever with renal syndrome (HFRS) and meteorology, with a limited seasonal exploration of monthly lagged relationships, interactions, and the role of pollutants in multiple predictions of hemorrhagic fever.
Methods: Our researchers collected data on HFRS cases from 2005 to 2018 and meteorological and contaminative factors from 2015 to 2018 for the northeastern region. First, we applied the moving epidemic method (MEM) to estimate the epidemic threshold and intensity level. Then, we used a distributed lag non-linear model (DLNM) and a generalized additive model (GAM) with a maximum lag of 6 months to evaluate the lagged and interaction effects of meteorological and pollution factors on the HFRS cases. Multiple machine learning models were then applied after Spearman’s rank correlation coefficient analysis was performed to screen for environmental factors in the Northeastern region.
Results: There was a yearly downward trend in the incidence of HFRS in the northeastern region. High prevalence threshold years occurred from 2005 to 2007 and from 2012 to 2014, and the epidemic months were mainly concentrated in November. During the low prevalence threshold period, the main lag factor was low wind direction. In addition, the meteorological lag effect was pronounced during the high prevalence threshold period, where the main lag factors were cold air and hot dew point. Low levels of the AQI and PM10 and high levels of PM2.5 showed a dangerous lag effect on the onset of HFRS, while extremely high levels of PM2.5 appeared to have a protective effect. High levels of the AQI and PM10, as well as low levels of PM2.5, showed a protective lag effect. The model of PM2.5 and the AQI interaction pollution is better. The support vector machine (SVM)-radial algorithm outperformed other algorithms when pollutants are used as predictor variables.
Conclusion: This is the first mathematically based study of the seasonal threshold of HFRS in northeastern China, allowing for accurate estimation of the epidemic level. Our findings suggest that long-term exposure to air pollution is a risk factor for HFRS. Therefore, we should focus on monitoring pollutants in cold conditions and developing HFRS prediction models.
1 Introduction
Hemorrhagic fever with renal syndrome (HFRS), also known as epidemic hemorrhagic fever, is a rodent-borne disease caused by various strains of the hantavirus or Seoul virus, characterized by fever, hemorrhage, and acute renal dysfunction (1). As one of the countries most affected by the HFRS epidemic, China has seen a significant decrease in the incidence of HFRS in most regions since 2000.Although preventive measures such as rodent eradication and vaccination have been implemented (2), transient epidemics still occur at certain times and in specific regions.
Early assessments of epidemic thresholds and risk classification focused on influenza and respiratory infections (3, 4), which have proven novel in application and effective for infectious diseases in China. However, there is a lack of relevant studies on HFRS. Earlier studies have suggested that climatic factors may contribute to the incidence of HFRS. According to an epidemiological survey in 2002, rainfall was identified as a predictor of HFRS transmission in the epidemic source (r = −0.63) (5). Furthermore, several studies have gradually refined the understanding of the relationship between meteorological factors and HFRS, highlighting varying effects in terms of lag and dose–response relationships. For example, in Nei Menggu province, Wen-Yi Zhang et al. found that rainfall, land temperature, and humidity were associated with HFRS onset at a lag of 3–5 months, after controlling for autocorrelation, seasonality, and long-term trends (6). Recent studies have also shown that wet and warm climatic conditions in the northeastern favor the occurrence and growth of HFRS (7). However, there is limited variability in climatic factors across different epidemic risk classifications. In addition, HFRS may be associated with air pollutants in terms of incidence because it is partly transmitted via the aerosol route. However, although several studies have confirmed the lag and correlation with air pollution in infectious diseases, few studies have been conducted on HFRS (8, 9).
The overall goal of this study was to explore the epidemiological characteristics of HFRS, the graded warning system, the lag and interaction effects of climate and pollutants, and the subsequent development of models for predicting HFRS outbreaks. Our specific objectives were to (a) calculate the epidemic thresholds and assess the risk levels, (b) explore the effects of lags and interactions of meteorological and pollution factors, and (c) construct stratified models for HFRS onset, selecting appropriate models for different populations.
2 Materials and methods
2.1 Setting
Supplementary Figure S1 shows the geographical location of the study area—Heilongjiang, Jilin, and Liaoning provinces. The three provinces are located in the northeastern of China and have medium levels of economic development and population size.
2.2 Data collection
We obtained HFRS case surveillance data from the National Public Health Data Center of China1 for the study area covering the period from 2005 to 2018. All patients were diagnosed according to the HFRS management criteria issued by the Ministry of Health of the People’s Republic of China. We obtained the corresponding daily weather data, including air temperature and dew point temperature, from the China Meteorological Data Sharing Service (data.cma.cn). Pollutant information, including CO, NO2, and O3, was originally sourced from the National Oceanic and Atmospheric Administration (NOAA).
2.3 Estimation of the epidemic threshold and intensity level
We used the R language implementation of the moving epidemic method (MEM) (package “mem”), which is available online for free. The method is based on a complex mathematical algorithm that can be summarized in three steps. The first step is the division of the pre-epidemic, epidemic, and post-epidemic periods. In the second step, the pre- and post-epidemic values of the historical seasons are used to calculate the baseline and epidemic thresholds. In the third step, the maximum values of n surveillance indicators during the epidemic period are selected separately to calculate different epidemic intensity thresholds. The unilateral 50%CI upper limit of the geometric mean of the n maximum surveillance indicators during the epidemic period is defined as the medium intensity threshold, the unilateral 90%CI upper limit as the high-intensity threshold, and the unilateral 95%CI upper limit as the very high-intensity threshold.
2.4 The lagging and interaction effect of DLNM and GAM
Distributed lag non-linear models (DLNM) have been widely used to assess the exposure–lag–response relationship between environmental factors and human diseases such as congenital heart disease, hand, foot, and mouth disease, and chronic sinusitis (8, 10–12). The model can be written as follows:
To analyze the lag and extreme effects of climate factors, air temperature, dew point temperature, wind direction, and wind speed were considered and applied to the cross-basis functions of a DLNM. Here, Yt is the number of the HFRS cases in monthly t; α1 is the intercept of the entire model; NS is a natural cubic spline that acts as a smooth function of the model; M represents the estimated climate or pollutants variable related to HFRS; and Xt represents other climate and pollutant variables involved in the pathogenesis of HFRS, for which non-linear confounding effects are adjusted. When constructing the meteorological factor model, does not exist, whereas in the pollution model, meteorological factors are used as confounding factors to construct . The NS was applied to adjust for the monthly confounding effects in the model. Month is a binary variable used to control the effect of time, and β represents regression coefficients. The optimal degrees of freedom (df) for the spline function were estimated using the Akaike information criterion for quasi-Poisson (Q-AIC) and minimum partial regression coefficient (PACFmin) criteria. The NS with 4 df was used for the climate factors, except for wind direction, which used 5 df during the period of low epidemic intensity. For both the high epidemic intensity period and the overall model, the NS with 4 df was applied to the climate and pollutant factors. The lag space was set to 3 df. The NS with 2–3 df/year was applied to the time variable in both pollutant and climate models. The climate model was constructed using the glm () function, while the pollution model was constructed using the gam () function.
Subsequently, a generalized additive model (GAM) was used to explore the interaction between the pollutants and the prevalence of HFRS. The model formula can be written as follows:
α2 is the intercept; X1 represents the AQI, whereas X2 and X3 denote the other two pollutants. s () indicates a penalized spline function. s (X1, X2) represents the spline function for the interaction between the parameters X1 and X2. X1, X2, and X3 represent 6-month lagged variables. represents the factors of climate.
2.5 Construction of a prediction model in GPR and SVM
A Gaussian process (GP) can be regarded as an extended function of a multivariate Gaussian distribution, which can be applied to a wide range of variables. In a Gaussian process (GP), it is assumed that any finite set of data follows a multivariate Gaussian distribution. Prior beliefs concerning the relationships between variables are incorporated into these (an infinite number of) multivariate Gaussian distributions to create a model that represents the observational variance. The combination of multiple Gaussian distributions in a GP can effectively model non-linear relationships and is more versatile than traditional parametric models, which depend on fitting a global model. This is because multivariate Gaussians can represent local covariance patterns between individual sites (13).
Support vector machines (SVMs) are a non-probabilistic binary linear regression method. Given a set of training data labeled as belonging to one of two classes, the algorithm maps the data into a space and defines a hyperplane that maximizes the margin between the two classes to separate them. This plane is called the “maximal marginal hyperplane.” An algorithm uses a kernel approach to acquire non-linear mapping to the feature space if linear integration is impossible. Thus, the hyperplane of the feature space stands for the non-linear boundary of the determination in the input space (14). All model metrics are compared using traditional machine learning metrics such as RMSE, R2, and MAE (15–17). A total of 75% of the dataset is used as the training set, while the remaining 25% is used as the test set. All analyses in our study were performed using R software (version 4.1.3).
3 Results
3.1 HFRS surveillance in northeastern China
A total of 59,431 HFRS cases were reported in the three eastern provinces of China from 2005 to 2018, showing a decreasing trend each year (Table 1). This was followed by the main epidemic area in Heilongjiang province, with a total of 28,074 cases until 2018. The incidence of influenza was primarily observed in the individuals aged 15–39 and 40–59 years, accounting for 86.42% of all cases.
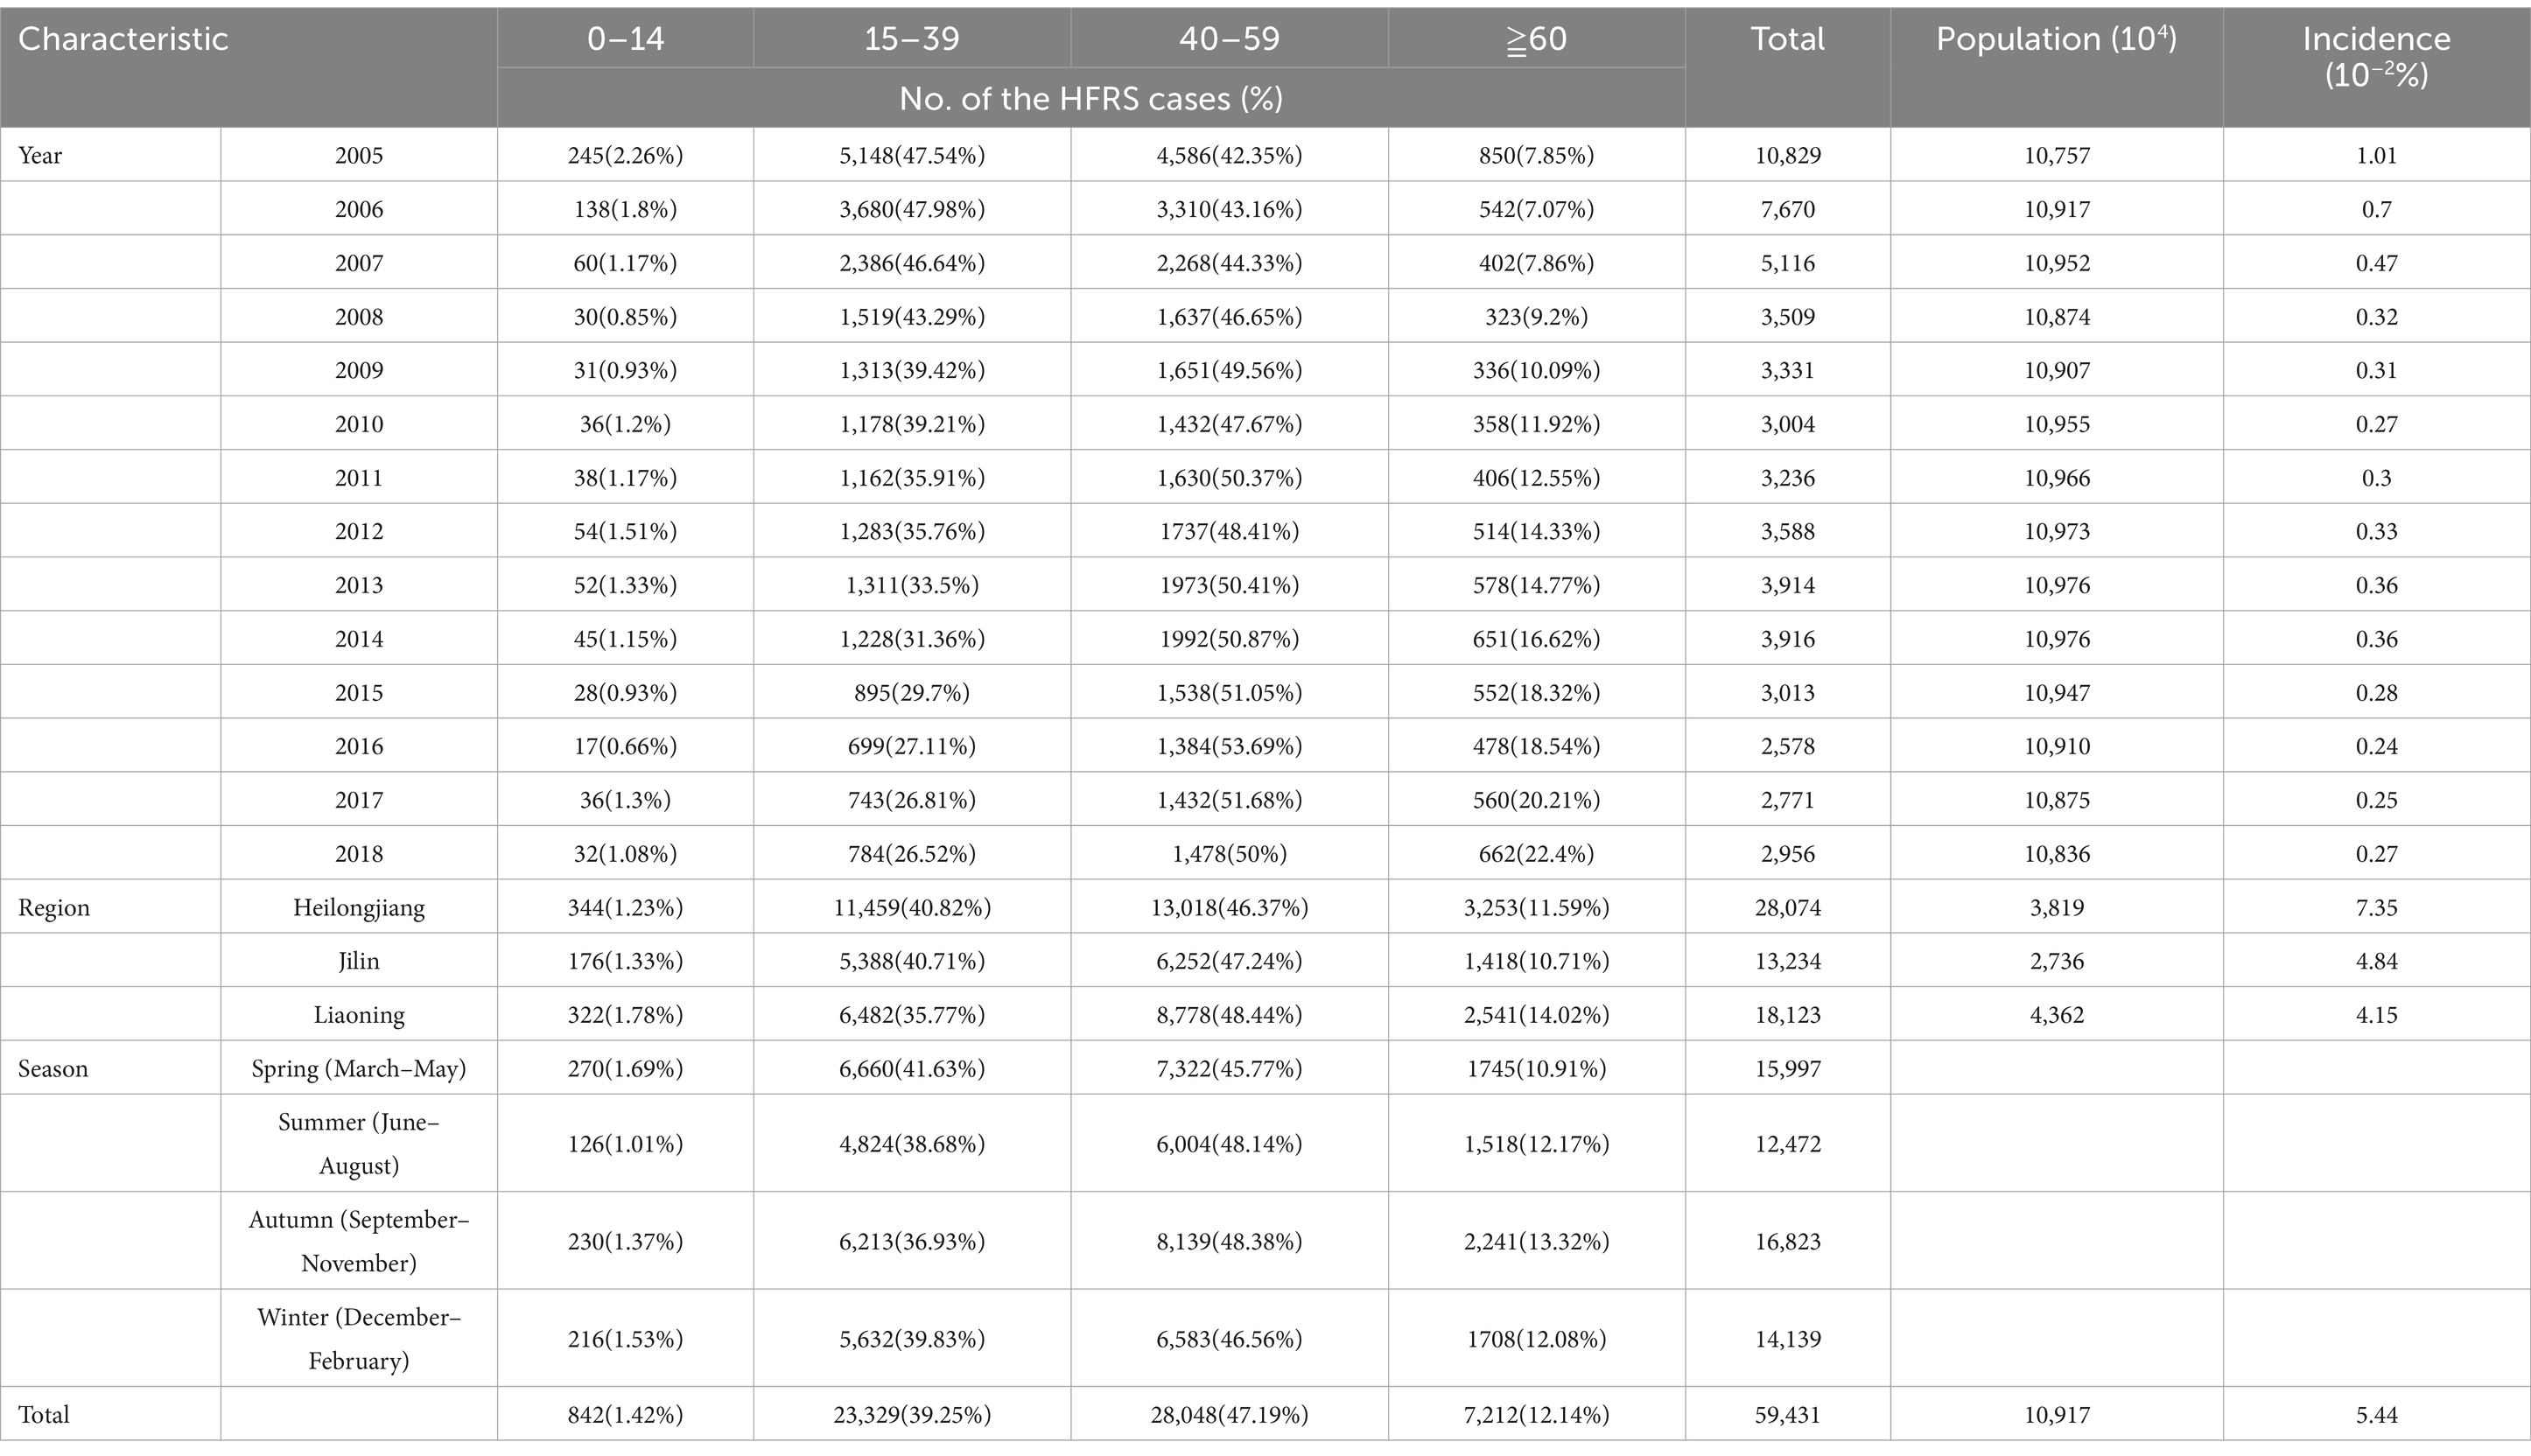
Table 1. Distribution of the HFRS cases by age groups, region, and season in northeastern China, 2005–2018.
Based on Table 1, however, there was a short-term rise in the cases from 2012 to 2014. We also performed a calculation of the prevalence threshold and determined from Supplementary Table S1 that the optimal parameter δ was 7.0 after the calculation of the popular threshold model. As shown in Table 2, the years with a high prevalence threshold were 2005–2007 and 2012–2014, while the years with a low prevalence threshold were 2008–2011 and 2015–2018. Based on the threshold model prediction shown in Table 2 and Figure 1, it was concluded that the epidemic months were primarily concentrated in November.
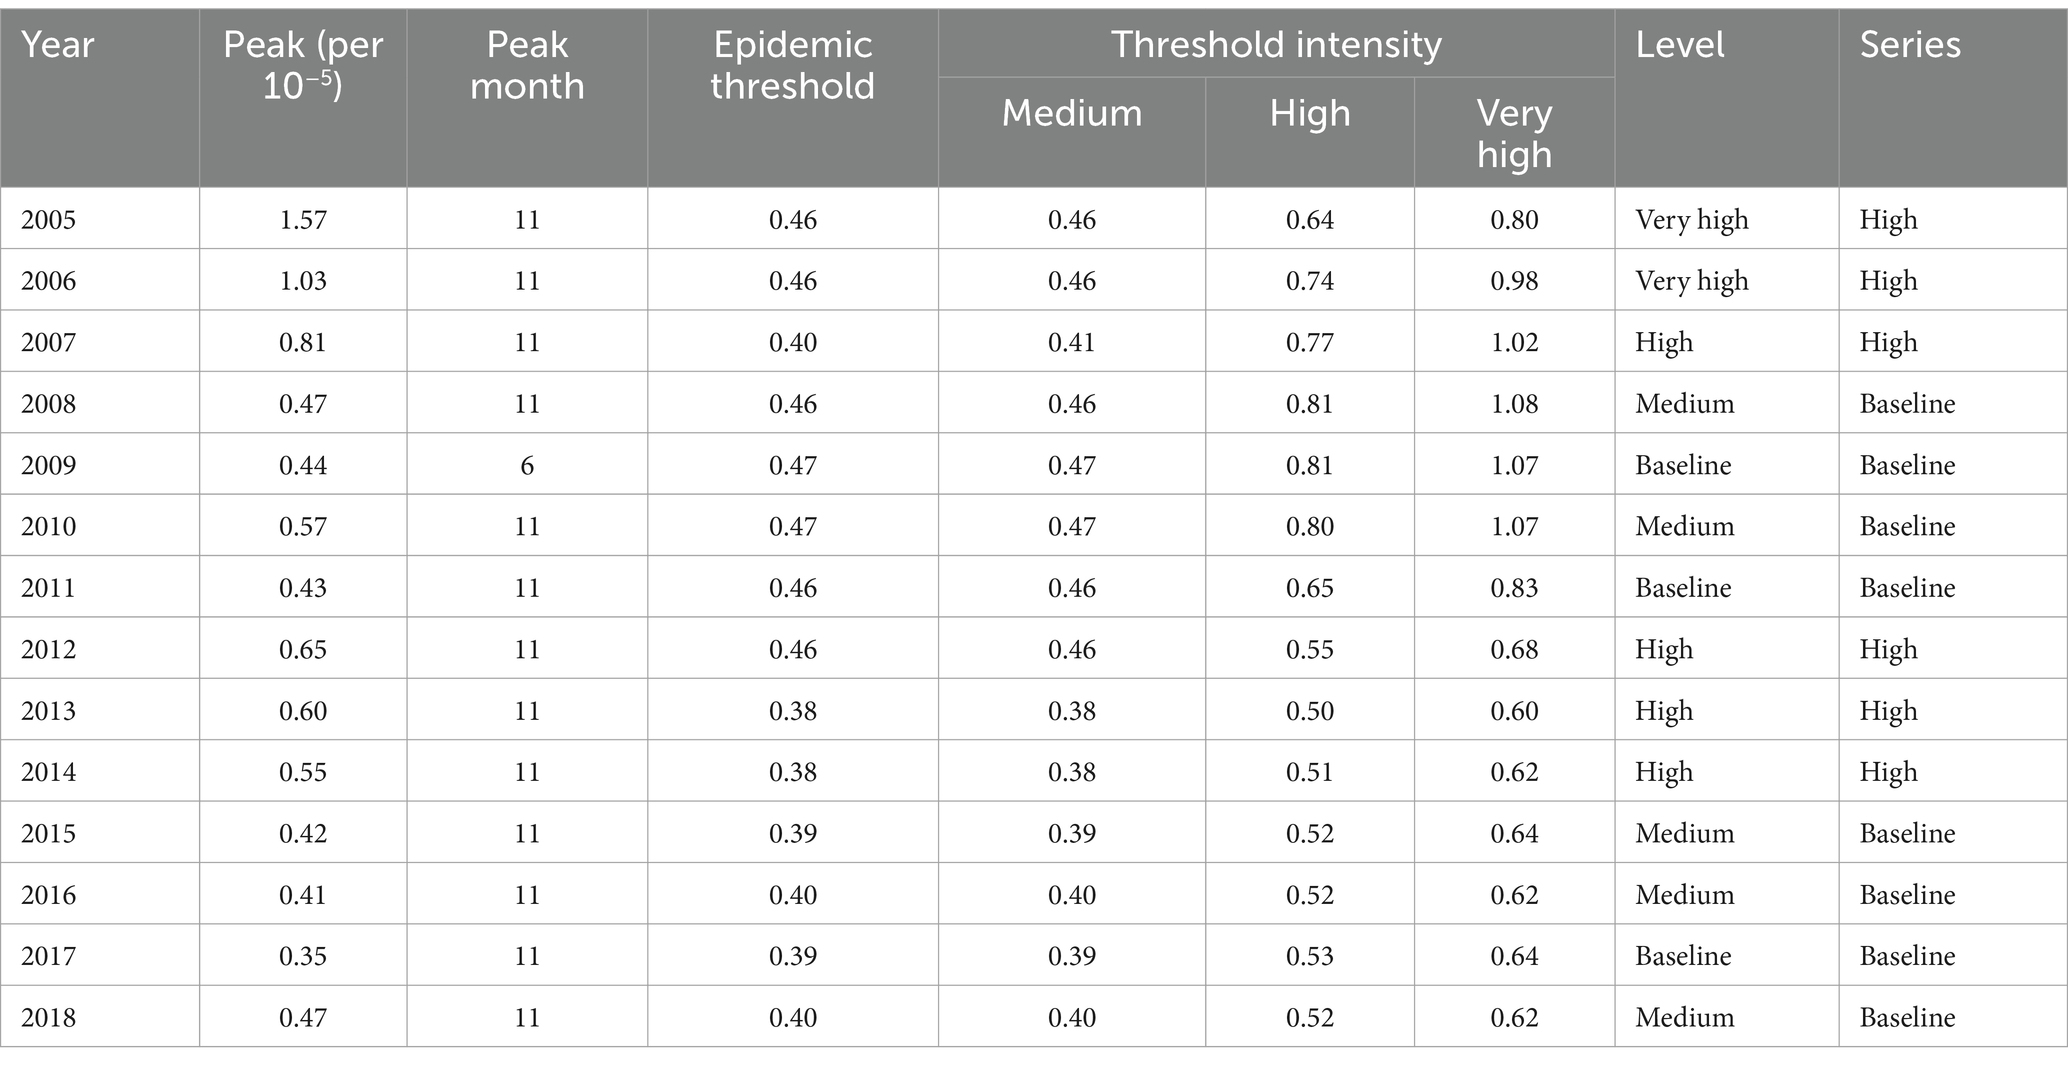
Table 2. Characteristics of the peak values in each year used in the model.

Figure 1. Surveillance and early warning of HFRS in northeastern China during 1–12 months in 2018.
3.2 Exposure–response relationships and lagging effect for the climate factors
The summary statistics for all HFRS cases and environmental variables in northeastern China are shown in Supplementary Table S2. The Spearman’s rank correlation coefficient analysis showed that HFRS was significantly correlated with air temperature (r = −0.18, p < 0.05), dew point temperature (r = −0.23, p < 0.01), wind direction (r = 0.22, p < 0.01), and wind speed (r = 0.29, p < 0.01) (Supplementary Table S3). As shown in Supplementary Figure S2, these climate factors were associated with high relative risk at the lags above moderate levels, except for air temperature.
From the dose–response relationship shown in Supplementary Figure S3, air temperature showed mostly a U-shaped relationship with the risk of HFRS, both in general and across the different regions and age groups, while the other factors mostly showed an arch bridge-shaped relationship. In Liaoning province, air temperature, dew point temperature, and wind speed all showed a parabolic decreasing trend in their relationship with HFRS risk. As shown in Supplementary Table S5, the climate lag effect was weak during the low prevalence threshold period, with sensitivity mainly concentrated in the high prevalence areas of Heilongjiang province and the 0–14 years age group, where the main lag factor was low wind direction. As shown in Supplementary Table S6, the meteorological lag effect was higher during the high prevalence threshold period, with sensitivity mainly concentrated in the 0–14 years and 60 years and above age groups, where the main lag factors were cold air and hot dew point. When comparing the climatic lags during the low and high prevalence threshold periods (Supplementary Tables S5, S6), we found that low wind direction and windy conditions showed a dangerous lag effect on HFRS onset (OR > 0), while high wind direction and windless conditions showed a protective lag effect (OR < 0). In addition, air temperature showed protective effects at both low and high levels, while cold air showed a dangerous effect in the 0–14 years age group during the high prevalence threshold period (OR (95% CI): 3.2e+17(8.4e+08, 1.2e+26)). Cold dew point had a little lag effect, while hot dew point showed a protective effect during the low prevalence threshold period. However, this effect was reversed during the high prevalence period.
3.3 Exposure–response relationships and lagging effect for the pollutants
The Spearman’s rank correlation coefficient analysis showed that HFRS was significantly correlated with the AQI (r = 0.40, p < 0.05), PM2.5 (r = 0.37, p < 0.05), and PM10 (r = 0.40, p < 0.01) (Supplementary Table S4). As shown in Supplementary Figure S4, these factors were associated with high relative risk at the lags above high levels, except for PM10. From the dose–response relationship shown in Figure 2, PM2.5 mostly showed an arch bridge-shaped relationship, while the AQI and PM10 mostly showed a U-shaped relationship with the risk of HFRS, both in general and across the different regions and age groups. In Jilin province and the 0–14 years age group, the AQI exhibited a parabolic decreasing trend, while PM2.5 showed a parabolic increasing trend. As shown in Figure 3, in terms of the total pollution lags, the effects of the low-level pollutants were mainly concentrated in the long-term lag conditions (3–6 months), while the effects of the high-level pollutants were mainly concentrated in the short-term lag conditions (1–2 months). In terms of the lagging trend, PM2.5 differed from the other pollution factors. As shown in Table 3, except for high-level PM10, the lag effect of the other pollution factors was more pronounced, and the sensitivity was mainly concentrated in Liaoning province and the age group of 40–59 years. Among these, we found that low levels of the AQI and PM10 and high levels of PM2.5 showed a dangerous lag effect on the onset of HFRS (OR > 0), while extremely high levels of PM2.5 (P95) showed a protective effect. In addition, high levels of the AQI and PM10 and low levels of PM2.5 showed a protective lag effect (OR < 0). However, at extremely high levels of the AQI (P95), a dangerous effect was observed.
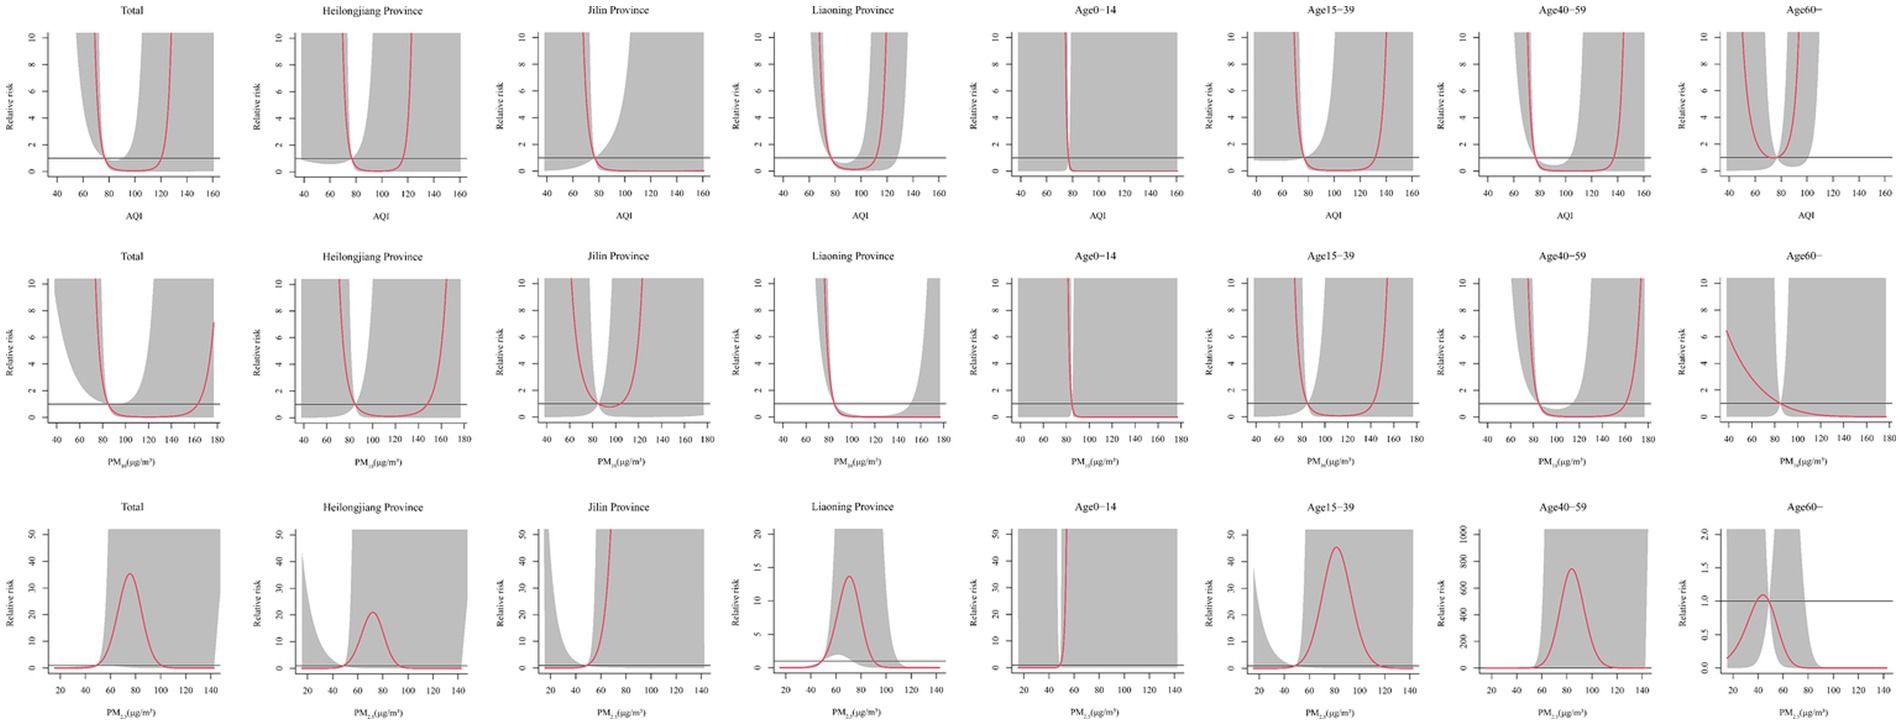
Figure 2. Effect of the different pollutants on the incidence of HFRS across the different months for total, regions, and age groups.
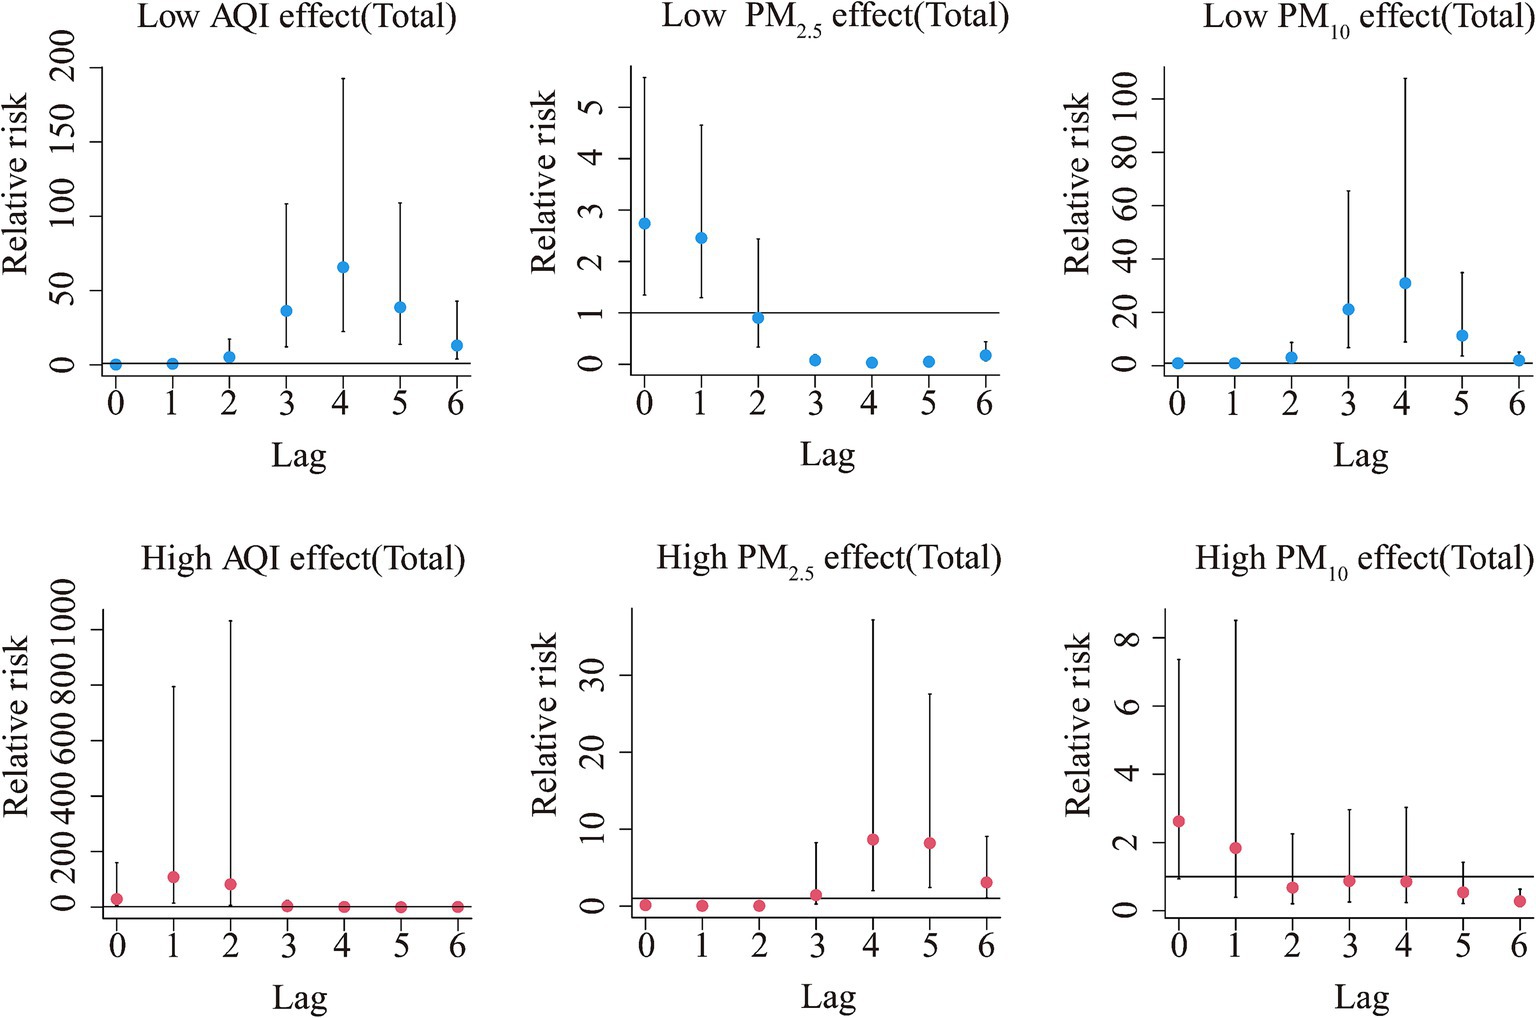
Figure 3. Summary of the estimated extreme effects at the 5th and the 95th percentile of the pollutants on the HFRS cases for the total during the different lag months. The median value of each pollutant (AQI: 76.79, PM2.5: 48.7 μg/m3, PM10: 84.89 μg/m3) serves as a reference level.
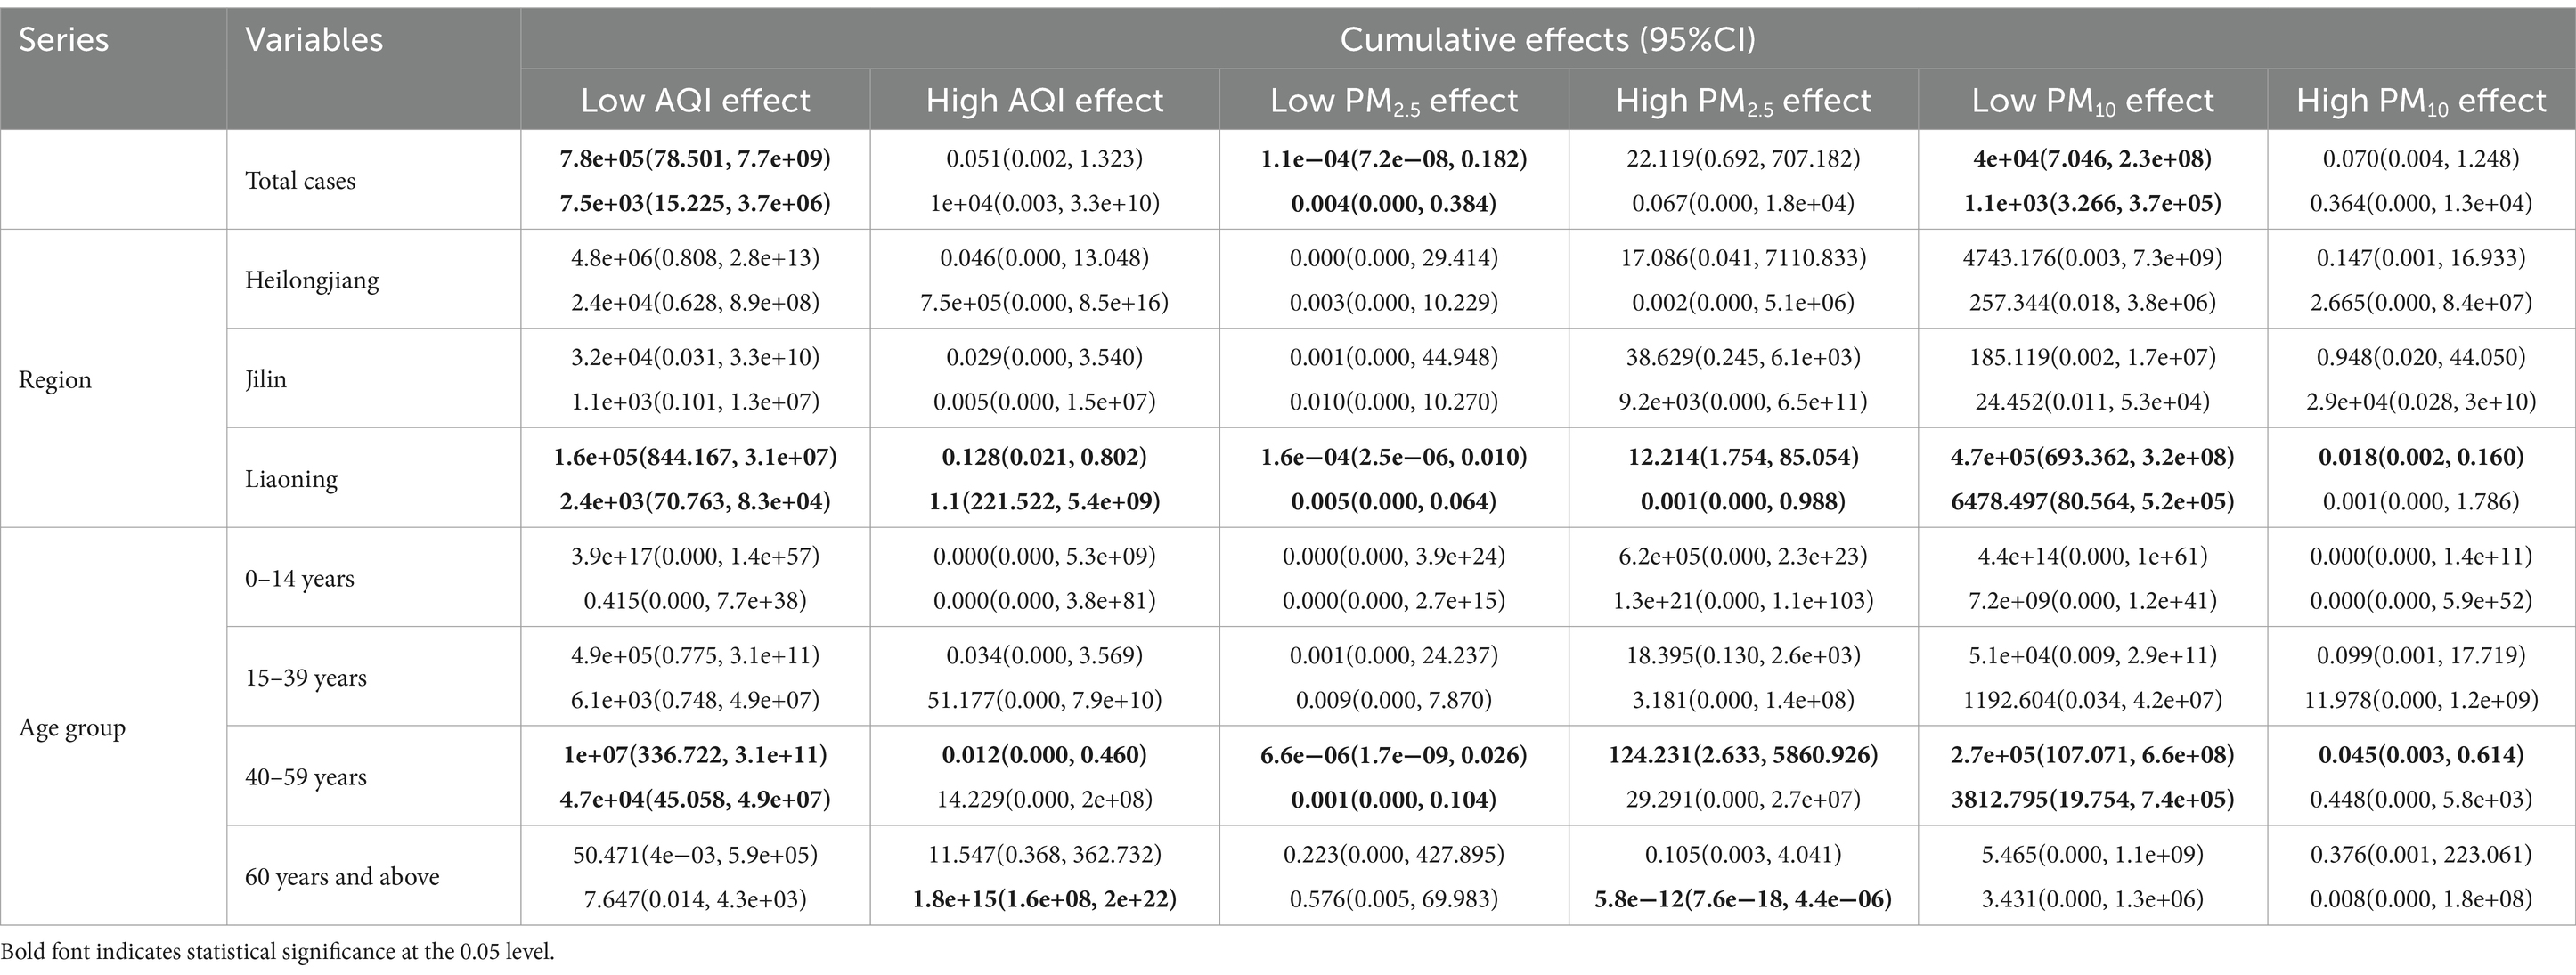
Table 3. The cumulative effects of the extreme pollutant factors on the HFRS cases by region and age group.
3.4 Interaction and comparison of the multiple pollutant models
From Supplementary Figure S5, we can see that the AQI interacted with PM2.5 and PM10 in relation to HFRS incidence. PM10 was weakly positively correlated with the risk of HFRS, while PM2.5 showed the opposite relationship. From the interaction effect shown in Figure 4, we found that low AQI combined with high levels of PM2.5 and PM10 had the greatest impact on HFRS onset. The results from the test in Supplementary Table S7 indicate that the model involving the interaction between PM2.5 and the AQI performed better (R2 = 44.1%). From Supplementary Table S8 and Table 4, the model fit was best in Liaoning province among the different regions (R2 > 70%) and in the 15–39 age group. In addition, the GPR model showed the same fit as that of the SVM model. In the GPR model, the prediction results were good, except for the polydot kernel function. In the SVM model, good prediction results were observed with the radial and sigmoid kernel functions. Based on the SVM-radial model for exploring the importance of the variables related to HFRS, the priority order was the pollutant factors (in the order of the AQI, PM10, and PM2.5), followed by the climatic factors (in the order of windspeed, dew point temperature, and air temperature).
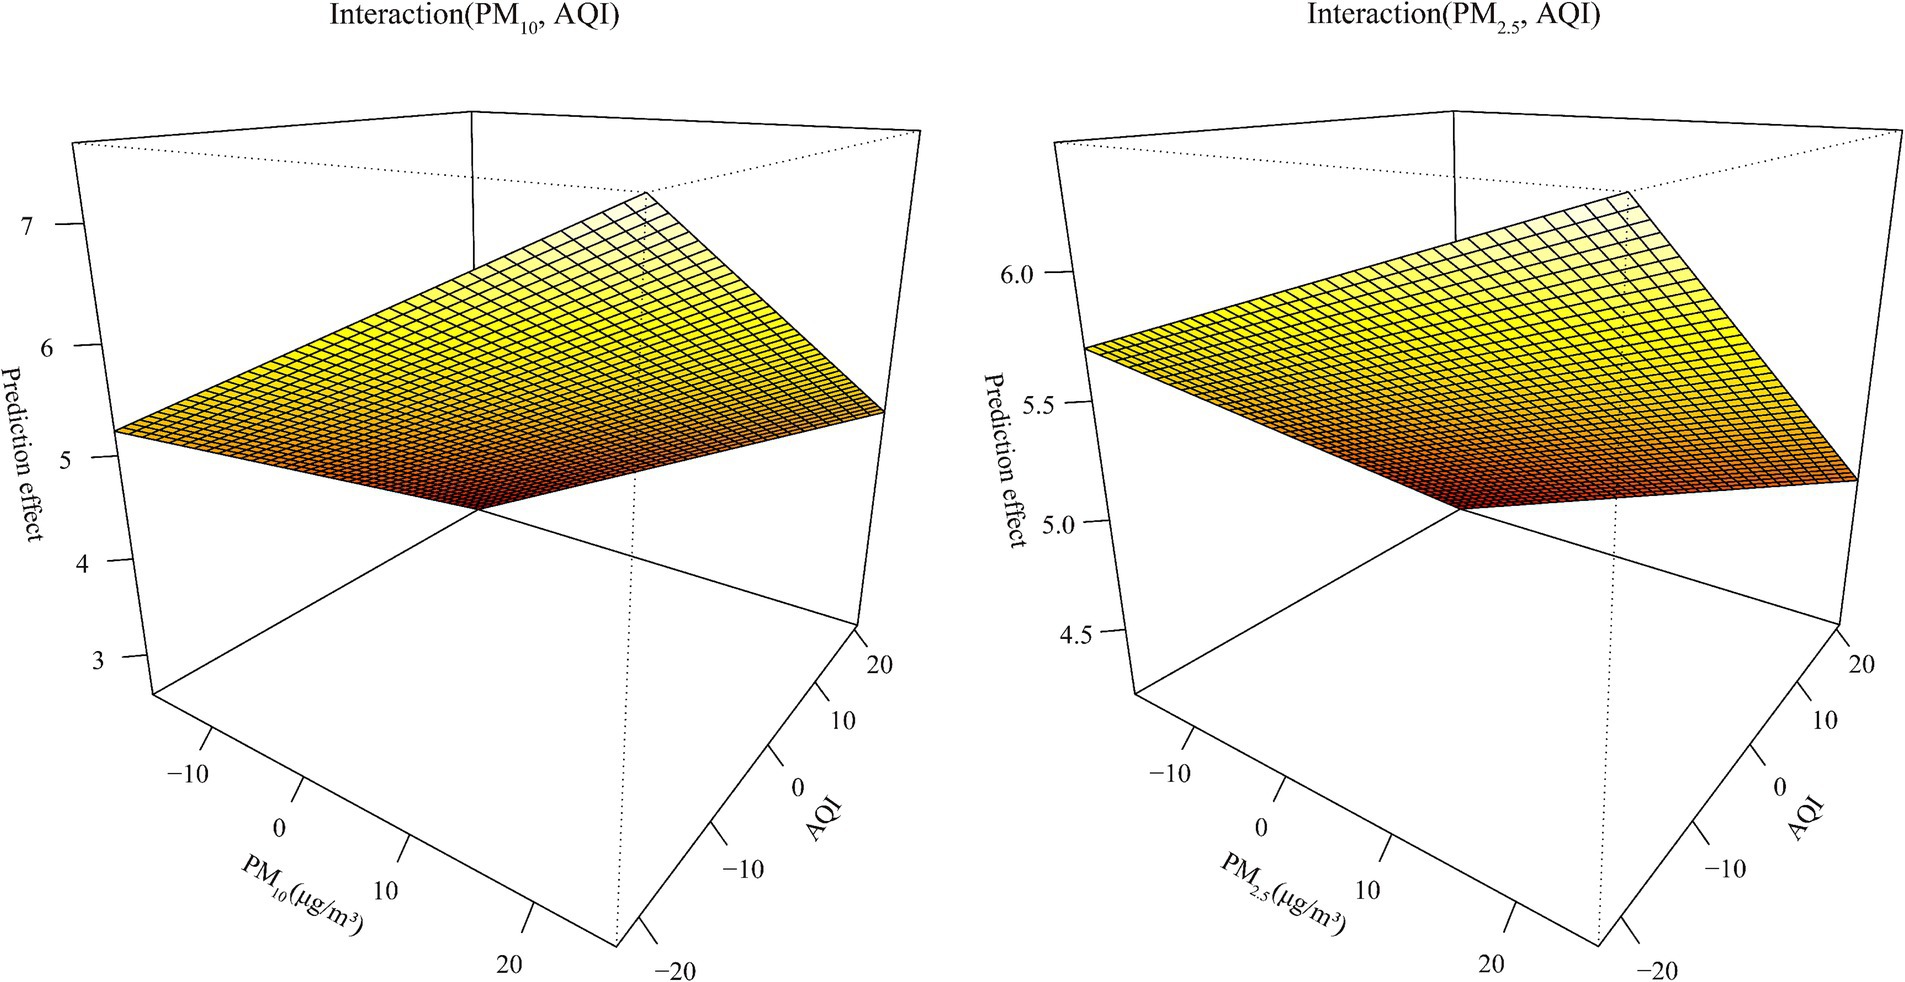
Figure 4. The fitting interactions of the association between the pollutants and HFRS cases in northeastern China during 2015–2018 based on the generalized additive model (GAM).
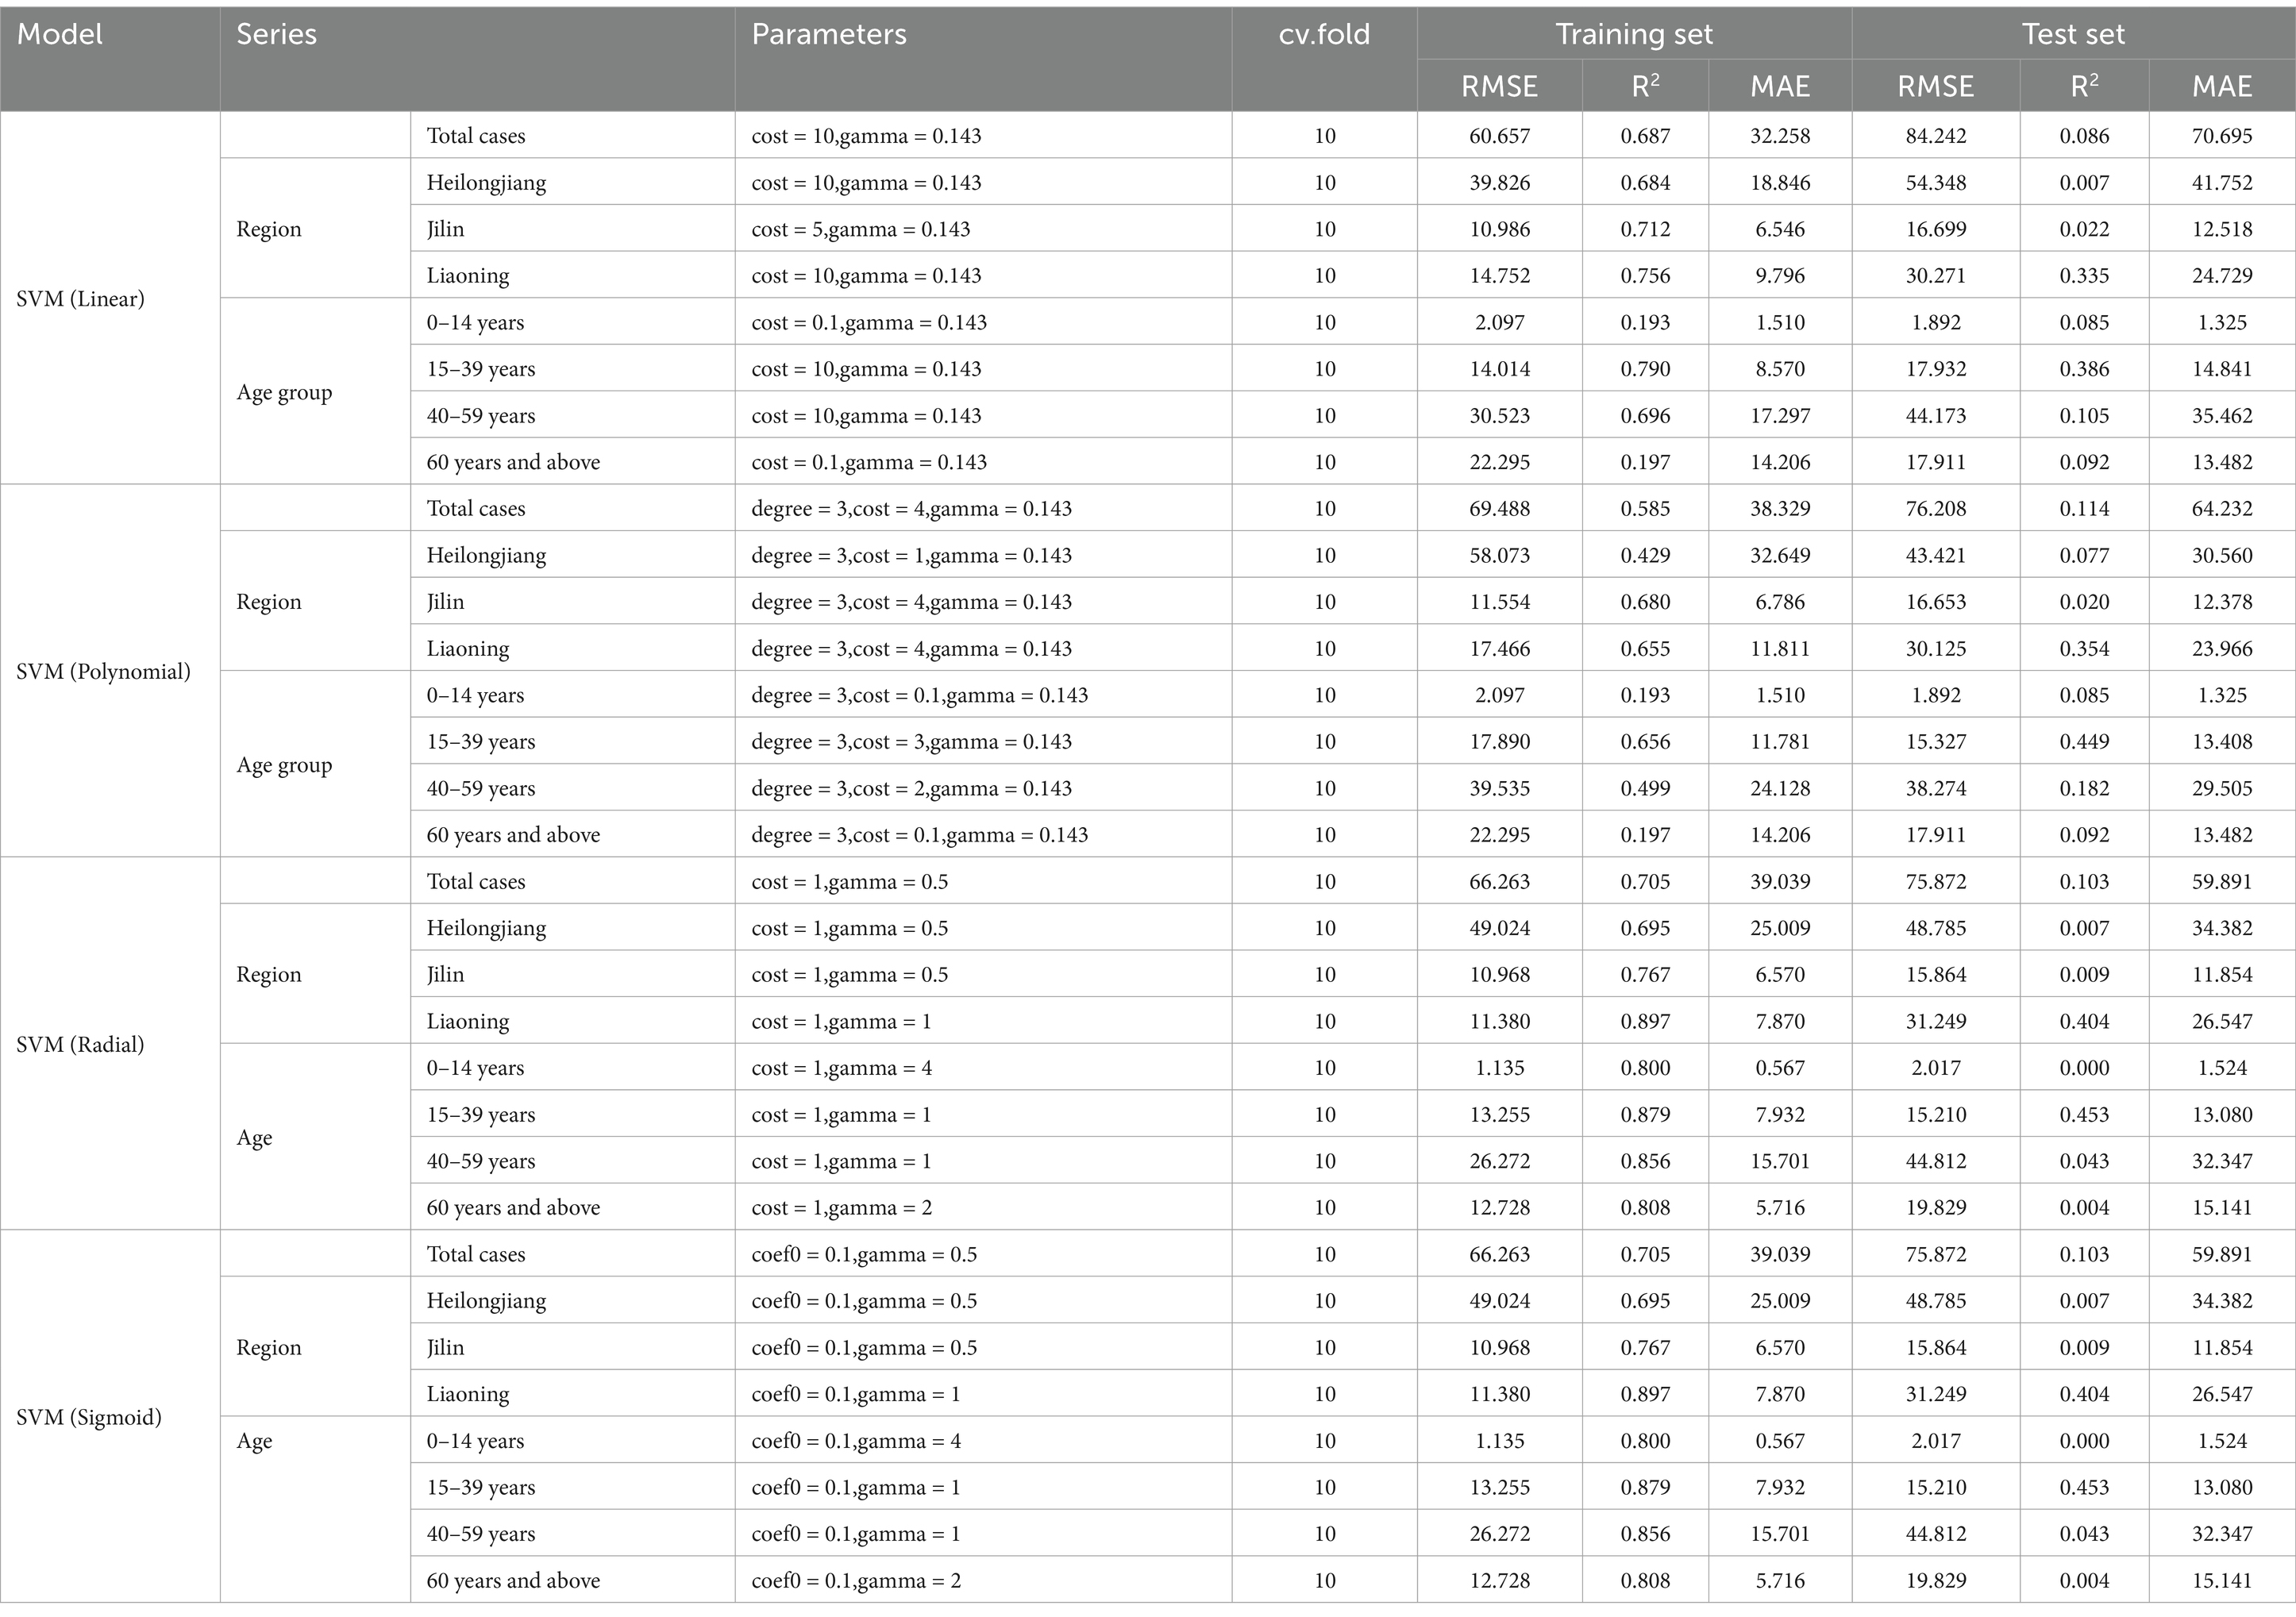
Table 4. Comparison of the prediction results with the different kernels of the support vector machine (SVM) models.
4 Discussion
In the European Centre for Disease Prevention and Control (ECDC), the MEM is a standardized approach for epidemiological classification and early warning of infectious diseases (18). However, the application is limited to diseases with a yearly upward trend, such as influenza and hand, foot, and mouth disease. The better-controlled infectious diseases, such as HFRS, have limited application in epidemic grading. Based on recent global environmental pollution and the short-term annual rise in hemorrhagic fever cases, this study applied the MEM to classify and issue warnings regarding its epidemic status. As the MEM was originally applied to weekly cases, monthly data were used in this study. The selection range for the δ parameter was adjusted from 2.5–5.0 to 4.0–8.0, and the adjustment was made based on the criteria developed after testing with reference to the data.
The prediction of HFRS is widespread both domestically and internationally, with models ranging from ARIMA (19) to Holt–Winters (20) using time series analysis for the univariate prediction of HFRS, achieving good results. However, since HFRS is a natural epidemic, environmental factors greatly influence the transmission of the pathogen and the host. Therefore, this study examined the impact of meteorological factors with lag effects during different periods, classified into high and low epidemic phases using the MEM. This will help future disease control departments implement targeted preventive measures and strategies under different climatic conditions based on the epidemic intensity. We found that Liaoning province exhibited different susceptibility compared to the other regions. This finding is in agreement with the findings of several studies, which indicated that the HFRS epidemic in Liaoning province follows a bimodal pattern (21, 22). During the high epidemic period, HFRS was mainly affected by cold air, with the most susceptible population being in the 0-14-years age group. This finding is consistent with the findings of studies conducted in other regions of China (23, 24). The main reason may be that cold air increases indoor activity among young, immunocompromised individuals. Since rodents are the primary hosts of the HFRS virus, cold air also raises the likelihood of rodents entering indoor spaces, which significantly exacerbates the incidence of HFRS. Research on the impact of pollutants on diseases dates back to a survey conducted in the United States in 1964 (25). A subsequent study in the U.S. found that long-term exposure to fine particle pollution was linked to death from ischemic heart disease and stroke, highlighting the need for continued improvements in air quality to prevent cardiovascular disease (26). In the field of infectious diseases, air pollution research has primarily focused on respiratory diseases, with little attention given to natural epidemic diseases such as HFRS. A survey in Tianjin found that air pollution control efforts were primarily focused on fulfilling local responsibilities (27), highlighting the impact of air pollution on local health and diseases. Therefore, this study first explored the lagged relationship between air pollution and HFRS, identifying particulate matter (PM) as the main environmental factor. Specifically, low levels of PM10 and high levels of PM2.5 were significant at a maximum lag of 6 months, with sensitivity concentrated in the age group of 40–59 years. The reason for this may be that middle-aged individuals are more likely to overlook pollution issues during periods of high air pollution, increasing their time and chances of being exposed to environmental hazards. This, in turn, can significantly enhance exposure to pathogens and host animals. Moreover, for a transmission pathway as unique as aerosols, particulate matter may contribute to the transmission rate, although the exact mechanism remains unknown. This study also conducted a multiple regression analysis of environmental factors to explore the predictive power of machine learning. Although time variables were not included in the prediction model, as in the study by Chao Zhang et al. (24), the application of different models with varying parameters for hierarchical exploration helped reduce errors from omitted variables and increased confidence in the predictive power. The results showed better prediction accuracy in Liaoning province, which is consistent with previous findings regarding the lagged sensitivity of environmental factors. The SVM model proved to be more stable than the GPR. This also confirmed the advantage of combining the traditional ARIMA time series model with the SVM algorithm to enhance the time series model for HFRS disease prediction, as demonstrated by Chao Zhang et al. (24). However, this study focused more specifically on the northeastern region of China and did not explore the southern regions, which limited the ability to extrapolate the effects of HFRS and natural environmental factors across the country.
5 Conclusion
This is the first mathematically based study on the seasonal threshold of HFRS in northeastern China, enabling accurate estimation of the epidemic levels. Our findings support that long-term exposure to air pollution is a risk factor for HFRS. Therefore, we should focus on monitoring pollutants in cold conditions and developing HFRS prediction models.
Data availability statement
Publicly available datasets were analyzed in this study. This data can be found here: the National Public Health Data Centre of China (https://www.phsciencedata.cn/) and the National Oceanic and Atmospheric Administration (NOAA) (https://www.noaa.gov/).
Ethics statement
The studies involving humans were approved by China Center for Disease Control and Prevention. The studies were conducted in accordance with the local legislation and institutional requirements. Written informed consent for participation was not required from the participants or the participants’ legal guardians/next of kin because Hemorrhagic fever is a Class B infectious disease under China’s Infectious Disease Prevention and Control Law, and each case reported by a medical institution is reported through the direct reporting system of the infectious disease network and requires epidemiological investigation and surveillance testing to further clarify the source of the pathogen and infection.
Author contributions
WH: Conceptualization, Formal analysis, Investigation, Methodology, Project administration, Software, Supervision, Validation, Visualization, Writing – original draft, Writing – review & editing.
Funding
The author(s) declare that no financial support was received for the research, authorship, and/or publication of this article.
Conflict of interest
The author declares that the research was conducted in the absence of any commercial or financial relationships that could be construed as a potential conflict of interest.
Publisher’s note
All claims expressed in this article are solely those of the authors and do not necessarily represent those of their affiliated organizations, or those of the publisher, the editors and the reviewers. Any product that may be evaluated in this article, or claim that may be made by its manufacturer, is not guaranteed or endorsed by the publisher.
Supplementary material
The Supplementary material for this article can be found online at: https://www.frontiersin.org/articles/10.3389/fpubh.2025.1393763/full#supplementary-material
Footnotes
References
1. Bai, Y, Xu, Z, Lu, B, Sun, Q, Tang, W, Liu, X, et al. Effects of climate and rodent factors on hemorrhagic fever with renal syndrome in Chongqing, China, 1997-2008. PLoS One. (2015) 10:e0133218. doi: 10.1371/journal.pone.0133218
2. Xiao, H, Tian, HY, Gao, LD, Liu, HN, Duan, LS, Basta, N, et al. Animal reservoir, natural and socioeconomic variations and the transmission of hemorrhagic fever with renal syndrome in Chenzhou, China, 2006-2010. PLoS Negl Trop Dis. (2014) 8:e2615. doi: 10.1371/journal.pntd.0002615
3. Kang, M, Tan, X, Ye, M, Liao, Y, Song, T, and Tang, S. The moving epidemic method applied to influenza surveillance in Guangdong, China. Int J Infect Dis. (2021) 104:594–600. doi: 10.1016/j.ijid.2021.01.058
4. Teeluck, M, and Samura, A. Assessing the appropriateness of the moving epidemic method and WHO average curve method for the syndromic surveillance of acute respiratory infection in Mauritius. PLoS One. (2021) 16:e0252703. doi: 10.1371/journal.pone.0252703
5. Bi, P, Tong, S, Donald, K, Parton, K, and Ni, J. Climatic, reservoir and occupational variables and the transmission of haemorrhagic fever with renal syndrome in China. Int J Epidemiol. (2002) 31:189–93. doi: 10.1093/ije/31.1.189
6. Zhang, WY, Guo, WD, Fang, LQ, Li, CP, Bi, P, Glass, GE, et al. Climate variability and hemorrhagic fever with renal syndrome transmission in northeastern China. Environ Health Perspect. (2010) 118:915–20. doi: 10.1289/ehp.0901504
7. Wang, Y, Wei, X, Xiao, X, Yin, W, He, J, Ren, Z, et al. Climate and socio-economic factors drive the spatio-temporal dynamics of HFRS in northeastern China. One Health. (2022) 15:100466. doi: 10.1016/j.onehlt.2022.100466
8. Luo, C, Qian, J, Liu, Y, Lv, Q, Ma, Y, and Yin, F. Long-term air pollution levels modify the relationships between short-term exposure to meteorological factors, air pollution and the incidence of hand, foot and mouth disease in children: a DLNM-based multicity time series study in Sichuan Province, China. BMC Public Health. (2022) 22:1484. doi: 10.1186/s12889-022-13890-7
9. Yang, L, Yang, J, Liu, M, Sun, X, Li, T, Guo, Y, et al. Nonlinear effect of air pollution on adult pneumonia hospital visits in the coastal city of Qingdao, China: a time-series analysis. Environ Res. (2022) 209:112754. doi: 10.1016/j.envres.2022.112754
10. du, R, Jiao, W, Ma, J, Zhou, Q, Liang, ZS, Sun, S, et al. Association between ambient temperature and chronic rhinosinusitis. Int Forum Allergy Rhinol. (2023) 13:1906–14. doi: 10.1002/alr.23152
11. Zhang, Q, Sun, S, Sui, X, Ding, L, Yang, M, Li, C, et al. Associations between weekly air pollution exposure and congenital heart disease. Sci Total Environ. (2021) 757:143821. doi: 10.1016/j.scitotenv.2020.143821
12. Chen, Y, Hou, W, and Dong, J. Time series analyses based on the joint lagged effect analysis of pollution and meteorological factors of hemorrhagic fever with renal syndrome and the construction of prediction model. PLoS Negl Trop Dis. (2023) 17:e0010806. doi: 10.1371/journal.pntd.0010806
13. Cole, JH, Poudel, RPK, Tsagkrasoulis, D, Caan, MWA, Steves, C, Spector, TD, et al. Predicting brain age with deep learning from raw imaging data results in a reliable and heritable biomarker. NeuroImage. (2017) 163:115–24. doi: 10.1016/j.neuroimage.2017.07.059
14. Lynch, CM, Abdollahi, B, Fuqua, JD, de Carlo, AR, Bartholomai, JA, Balgemann, RN, et al. Prediction of lung cancer patient survival via supervised machine learning classification techniques. Int J Med Inform. (2017) 108:1–8. doi: 10.1016/j.ijmedinf.2017.09.013
15. Li, RYM, Song, L, Li, B, Crabbe, MJC, and Yue, X-G. Predicting carpark prices indices in Hong Kong using AutoML. Comput Model Eng Sci. (2022) 134:2247–82. doi: 10.32604/cmes.2022.020930
16. Lei, T, Li, RYM, Jotikastira, N, Fu, H, and Wang, C. Prediction for the inventory management chaotic complexity system based on the deep neural network algorithm. Complexity. (2023) 2023:1–11. doi: 10.1155/2023/9369888
17. Li, RYM, Fong, S, and Chong, KWS. Forecasting the REITs and stock indices: group method of data handling neural network approach. Pac Rim Prop Res J. (2017) 23:123–60. doi: 10.1080/14445921.2016.1225149
18. Green, H, Charlett, A, Moran-Gilad, J, Fleming, D, Durnall, H, Thomas, D, et al. Harmonizing influenza primary-care surveillance in the United Kingdom: piloting two methods to assess the timing and intensity of the seasonal epidemic across several general practice-based surveillance schemes. Epidemiol Infect. (2015) 143:1–12. doi: 10.1017/S0950268814001757
19. Qi, C, Zhang, D, Zhu, Y, Liu, L, Li, C, Wang, Z, et al. SARFIMA model prediction for infectious diseases: application to hemorrhagic fever with renal syndrome and comparing with SARIMA. BMC Med Res Methodol. (2020) 20:243. doi: 10.1186/s12874-020-01130-8
20. Ye, GH, Alim, M, Guan, P, Huang, DS, Zhou, BS, and Wu, W. Improving the precision of modeling the incidence of hemorrhagic fever with renal syndrome in mainland China with an ensemble machine learning approach. PLoS One. (2021) 16:e0248597. doi: 10.1371/journal.pone.0248597
21. Lin, H, Liu, Q, Guo, J, Zhang, J, Wang, J, and Chen, H. Analysis of the geographic distribution of HFRS in Liaoning Province between 2000 and 2005. BMC Public Health. (2007) 7:207. doi: 10.1186/1471-2458-7-207
22. Lv, CX, An, SY, Qiao, BJ, and Wu, W. Time series analysis of hemorrhagic fever with renal syndrome in mainland China by using an XGBoost forecasting model. BMC Infect Dis. (2021) 21:839. doi: 10.1186/s12879-021-06503-y
23. Xu, Q, Li, R, Rutherford, S, Luo, C, Liu, Y, Wang, Z, et al. Using a distributed lag non-linear model to identify impact of temperature variables on haemorrhagic fever with renal syndrome in Shandong Province. Epidemiol Infect. (2018) 146:1671–9. doi: 10.1017/S095026881800184X
24. Zhang, C, Fu, X, Zhang, Y, Nie, C, Li, L, Cao, H, et al. Epidemiological and time series analysis of haemorrhagic fever with renal syndrome from 2004 to 2017 in Shandong Province, China. Sci Rep. (2019) 9:14644. doi: 10.1038/s41598-019-50878-7
25. Ferris, BG Jr, and Frank, NR. Air pollution and disease. Anesthesiology. (1964) 25:470–8. doi: 10.1097/00000542-196407000-00010
26. Hayes, RB, Lim, C, Zhang, Y, Cromar, K, Shao, Y, Reynolds, HR, et al. PM2.5 air pollution and cause-specific cardiovascular disease mortality. Int J Epidemiol. (2020) 49:25–35. doi: 10.1093/ije/dyz114
Keywords: hemorrhagic fever with renal syndrome, moving epidemic method, pollutants, time series models, machine learning
Citation: Hou W (2025) Effect and prediction of long-term weather and pollutant exposure on hemorrhagic fever with renal syndrome: based on statistical models. Front. Public Health. 13:1393763. doi: 10.3389/fpubh.2025.1393763
Edited by:
Jiaying Li, The University of Queensland, AustraliaReviewed by:
Surjit Singh, Sister Nivedita University, IndiaRita Yi Man Li, Hong Kong Shue Yan University, Hong Kong SAR, China
Copyright © 2025 Hou. This is an open-access article distributed under the terms of the Creative Commons Attribution License (CC BY). The use, distribution or reproduction in other forums is permitted, provided the original author(s) and the copyright owner(s) are credited and that the original publication in this journal is cited, in accordance with accepted academic practice. No use, distribution or reproduction is permitted which does not comply with these terms.
*Correspondence: Weiming Hou, aHdtMTAwOTA4QDE2My5jb20=