- 1School of Economics and Management, Anhui University of Chinese Medicine, Hefei, China
- 2Anhui Institute of Conservation and Development of Traditional Chinese Medicine Resources, Hefei, China
Background: With the increasing global focus on health and the growing popularity of natural therapies, Traditional Chinese Medicine (TCM) products, including extracts, crude drugs, and herbal preparations, are widely utilized as both primary and complementary medicines worldwide. The Regional Comprehensive Economic Partnership (RCEP), spanning 15 countries across East Asia, Southeast Asia, and Oceania, offers a vast market for TCM. However, limited research has been conducted on the complex trade relations among RCEP members.
Methods: The structural features and nodes attributes are analyzed using Social Network Analysis (SNA). Influencing factors are studied through the Quadratic Assignment Procedure (QAP) model. We also compiled a list of medicinal plants among RCEP member countries and the main TCM export products.
Results: The scale of TCM trade among RCEP members has fluctuated over time, with a temporary spike during the COVID-19 pandemic, followed by a gradual normalization. The trade network does not exhibit small-world properties, indicating a relatively balanced trade relationship. Due to its resource advantages, China occupies a central role acting as a dominant producer and leading exporter. Vietnam’s export performance has been excellent in recent years, with the highest annual growth rate. Emerging markets, such as Myanmar, warrant closer attention. Economic size and population significantly positively affect trade value, while geographic distance and land adjacency have no significant impact. Trade activity is positively influenced by cultural and linguistic similarities, and countries with higher levels of economic freedom tend to engage in more trade. Tonifying TCM products with antioxidant and immune-boosting properties are more widely recognized in international markets.
Conclusion: RCEP has established an excellent trade platform for the export of TCM. The factors influencing TCM trade are predominantly long-term and structural, rather than being driven by the occurrence of any single, isolated event. Member states should strengthen collaboration in standardization, technology coordination, and knowledge sharing to establish a mutually beneficial trade ecosystem for TCM.
1 Introduction
Traditional Chinese medicine (TCM) is not only an effective solution for primary health care, but also a great resource for drug innovation and discovery. TCM encompass a wide range of natural substances such as plants, animals, minerals, and their processed forms. TCM products include extracts, crude drug, herbal pieces, TCM preparations, health foods, and cosmetics (1). The efficacy of TCM has been observed in preventing and treating various ailments such as autoimmune disorders (2, 3), cardiovascular diseases (4) and cancers (5). The history of TCM trade dates back thousands of years. From the 2nd century BCE to the 14th century CE, China disseminated numerous medicinal herbs along the Silk Road to Central Asia, West Asia, Europe, and other regions. Tea, ginseng, ephedra, and goji berries became significant commodities along the Silk Road. Through this route, East Asian TCM culture began to interact and exchange with Western medical knowledge. From the 7th to the 13th century, during the Tang and Song dynasties, TCM spread to Japan, Korea, and Southeast Asia, where it had a profound impact on local medical practices. Between the 14th and 19th centuries, during the Ming and Qing dynasties, China expanded its trade of medicinal herbs such as ginseng, astragalus, and salvia through maritime routes, exporting them to Asia, the Americas, and Europe. Today, TCM has become a significant alternative or complementary treatment to Western medicine, with increasing international recognition and application. The recognition of Tu Youyou’s work and her Nobel Prize win in 2015 brought significant attention to the rich pharmacological effects of TCM on the global stage. Tu Youyou discovered artemisinin, derived from the plant Artemisia annua, which revolutionized malaria treatment (6). Artemisinin’s discovery highlighted the potential of TCM in modern medicine and fueled growing global interest in complementary and alternative medicine. While its primary use is in China, TCM also widely used in East Asia (e.g., Japan, Korea) and Southeast Asia (e.g., Vietnam, Thailand). Some European countries, such as Germany, France, and the United Kingdom, have incorporated aspects of Chinese medicine into their healthcare systems (7, 8). In Germany, for example, Chinese medicine practices such as acupuncture and herbal medicine are recognized and practiced alongside conventional medicine (9).
China boasts nearly 13,000 varieties of wild medicinal resources, with 163 new species discovered during the 4th National Survey of TCM resources (10). As a unique health and economic resource in China, TCM holds significant importance for the nation’s overall economic and social development and has received considerable attention from the government (11). In October 2016, the State Council issued the “Healthy China 2030” Plan, which comprehensively integrated TCM into the national health strategy. Subsequently, in February 2021, the State Council released a notice outlining several policy measures aimed at accelerating the trade of TCM. These measures include drafting the “14th Five-Year Plan” for TCM under the “Belt and Road” initiative and promoting the “Internet plus TCM trade” (12, 13). According to China Customs statistics, in 2023, the import and export value of pharmaceutical products in China reached 195.36 billion US dollars, representing 23% of the global pharmaceutical trade market. However, the TCM sector accounted for only 4% of China’s total pharmaceutical trade value, reflecting a year-on-year decline of 1.9%. Coincidentally, from January to May 2024, the trade value of TCM reached 3.461 billion US dollars, accounting for 4.3% of China’s total pharmaceutical trade value, representing a year-on-year decline of 3.65%. Although the Chinese government attaches great importance to and vigorously promotes the TCM trade, it has not achieved the desired effect in the actual trade performance.
The COVID-19 pandemic has introduced significant fluctuations in demand for medical supplies and medicine. Initial surges in demand were followed by subsequent declines, resulting in an overall impact on market stability (14, 15). The complex and volatile international political and economic landscape has further complicated matters. Developing a more open regional trade framework has become a key focus for many countries. The Regional Comprehensive Economic Partnership (RCEP) is a significant regional trade agreement led by Association of Southeast Asian Nations (ASEAN), characterized by a relatively high level of openness. First proposed at the East Asia Summit in November 2011, RCEP saw significant progress on November 15, 2020, when the ten ASEAN countries, along with China, Japan, New Zealand, South Korea, and Australia, signed the agreement. On January 1, 2022, RCEP came into effect, marking the development of the most free and open trade agreement to date (16). As a free trade agreement encompassing around 3.5 billion people and one-third of the global GDP, RCEP aims to establish a unified market across 15 countries (Indonesia, Malaysia, Philippines, Singapore, Thailand, Brunei, Vietnam, Laos, Myanmar, Cambodia, China, Japan, New Zealand, South Korea, and Australia) by reducing tariffs and non-tariff barriers. Some scholars posit that the signing of RCEP will foster a frequent regional trade. For example, since 2019, Vietnam’s TCM exports to China have shown consistent high growth. The export value has surged from millions to tens of millions of dollars, reaching $35.93 million in 2023. The main exported varieties include Areca nut, Sterculia lychnophora (Malva nut), Poria, and Cinnamon (17). Current trade data indicates that RCEP has contributed to promoting the TCM trade for some specific countries.
However, a comprehensive understanding of the scale, network characteristics, and determinants of TCM trade among RCEP members remains limited. Our research aims to answer the following questions: What is the scale and characteristics of TCM trade among RCEP member countries? Which countries play a pivotal role, and what factors enable them to influence trade? What are the main TCM export products with high recognition in international markets? The remainder of this paper is organized as follows: Section 2 elaborates the theoretical basis. Section 3 introduces the method and data sources. Section 4 focuses on empirical analysis and provides a reasonable explanation of the results. Section 5, 6 concludes discussion and conclusion, respectively.
2 Theoretical basis
The trade of TCM among RCEP member states are intricate and intertwined, forming a complex trade system. The characteristics and influencing factors of TCM trade networks among RCEP participating countries remain under-explored. Social Network Analysis (SNA) offers a robust framework for dissecting these complex trade relationships by constructing trade networks, extracting core subnets based on trade weights, and analyzing the structure and attributes of the interconnected nodes. Based on the literature review, Serrano and Boguná first applied SNA to international trade relations, and identified typical characteristics including scale-free distribution, small-world characteristics and high clustering coefficients (18, 19). Newman and Park discovered the topological characteristics of trade network, such as network density, clustering coefficients, and average path length (20). A further investigation carried by Fagiolo revealed a core-periphery structure that helps in determining the status of participating countries in trade networks (21).
The classical gravity mode have used to explore the factors affecting trade cooperation in previous studies. Hasson and Tinbergen were the first to apply the gravity model to international trade research (22). Subsequently, factor endowments (23), economic size (24), common borders (25) and regional trade agreements (26) have been incorporated into the gravity model. However, these studies only partially explain the influencing factors, and do not consider the interrelationships between these factors. Standard statistical procedures are inadequate for parameter estimation and statistical tests, due to the risk of calculating incorrect standard deviations. To address this issue, scholars employ randomized detection methods to test, and quadratic assignment procedure (QAP) is one such approach. QAP compares the similarity of each element in the two matrices, calculates the correlation coefficient between the matrices, and conducts non-parametric test on the coefficient (27, 28). QAP mitigates problems related to multi-collinearity and structural autocorrelation.
Spatial proximity, includes geographic distance and shared border, are considered the primary determinants affecting trade. The geographic proximity between economic entities significantly influences the formation of trade linkages by reducing transaction costs. Studies conducted by Anderson and Wincoop have demonstrated that closer physical distance often facilitates more efficient exchanges, thereby strengthening economic ties (29). Additionally, a shared land border is considered as a crucial factor in measuring trade cost, often serving as a proxy variable for geographical distance. The second factor is linguistic differences. Language can directly impact the way and cost of communication in international trade. Unimpeded communication facilitate a reduction in information acquisition costs and cognitive blind spots on both sides, leading to improved credit enhancement and increased international trade (30). The third factor is economy and population scale. Countries with larger economies and populations exhibit greater market demand and possess stronger production and export capacities, which in turn influence the flow and scale of trade (31). The fourth factor is Fixed Trade Costs (FTC). FTC refer to the non-variable expenses incurred by firms when entering and maintaining participation in international trade, regardless of the trade volume. These costs encompass expenses related to regulatory compliance, establishing distribution networks, and overcoming market entry barriers. Market access and regulatory systems vary across countries, influenced by distinct economic structures, non-tariff barriers, and levels of government intervention (32). Generally, countries with higher levels of economic freedom are associated with lower FTC.
Based on the above analysis, we propose the following hypotheses on the factors influencing TCM trade among RCEP members:
Hypothesis 1 (H1). Countries that are geographically closer or with shared boundaries are more likely to trade with each other.
Hypothesis 2 (H2). Countries with same language are more likely to trade with each other.
Hypothesis 3 (H3). Countries with large economies and population scale have greater demand for TCM.
Hypothesis 4 (H4). Countries with high economic freedom index are more likely to establish trade relations.
Over the past decade, researches combined SNA with QAP have accumulated substantial research experiences and cases, such as crude oil (33, 34), fossil energy (35, 36), electricity (37), etc. However, there is no relevant application of TCM trade. This paper aims to use SNA to establish TCM trade networks among RCEP members and study the network structures and node attributes. We also adopt QAP to explore the determinants of TCM trade networks among RCEP members.
3 Materials and methods
3.1 Research methodology
3.1.1 Network construction
In this study, we utilize UCINET 6.504 software to construct a weighted network of TCM trade among RCEP members. Each node represents a country, the edge Eij denotes the trade relation between country i and j. If there is no trade relationship between country i and j, then Eij = 0, otherwise, Eij = 1.The trade value from country i to j denoted as Wij (38). Considering the asymmetries in the trade data, we adopt the maximum value as the weight of the edge between country i and j.
3.1.2 Statistic indicators
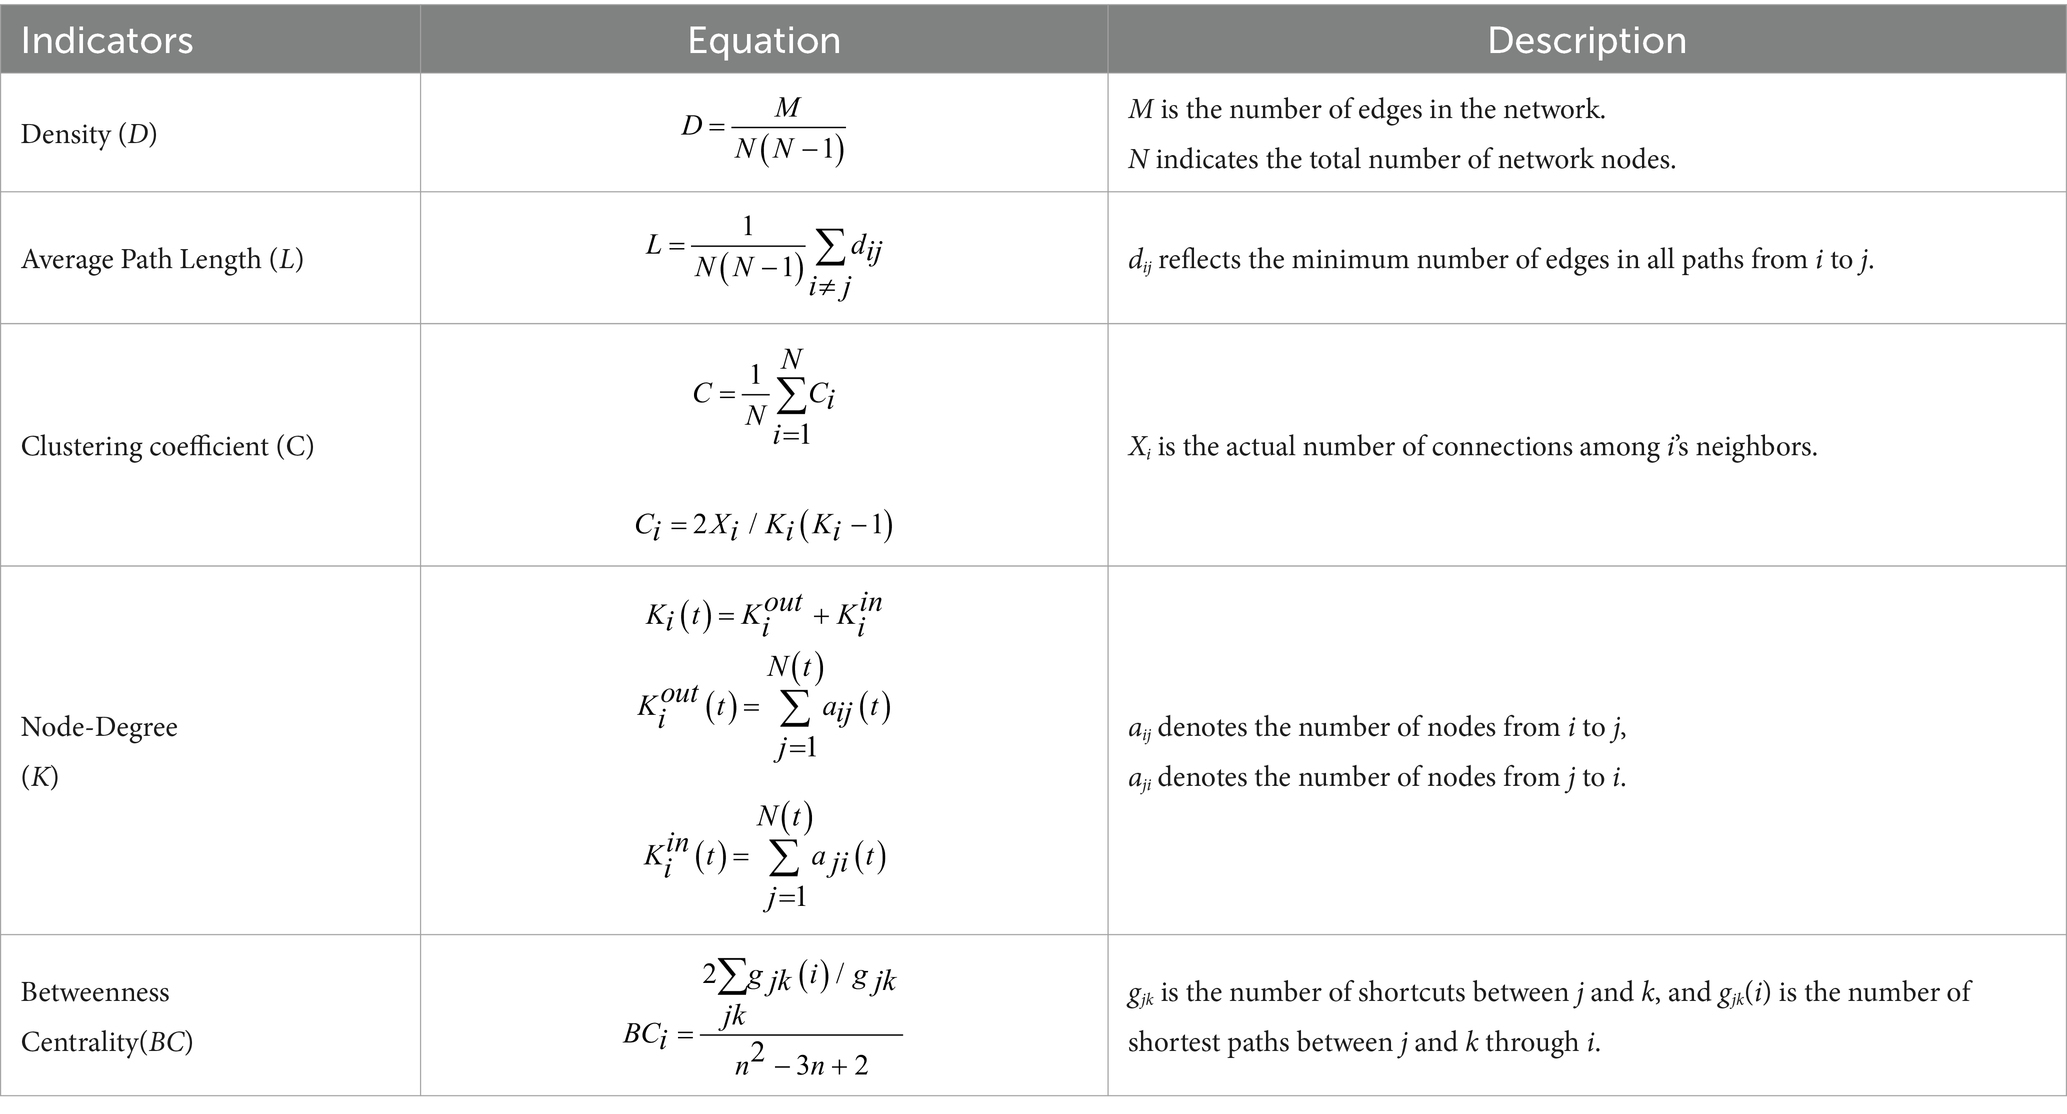
To characterize the structural properties of the network, this paper sets up two levels of indicators. The first tier outlines the overall structural features. Network density (D) quantifies the extent to which nodes are interconnected, with higher density signifying a greater intensity of commercial activity. Average path length (L) represents the mean number of intermediary nodes traversed within the network when moving from one node to another. It is a critical metric for evaluating the efficiency of information or resource flow within a network, reflecting the overall connectivity and potential bottlenecks in the system. The clustering coefficient (C) reflects the extent to which a node’s connections are tightly knit with its neighboring nodes. If the network has a shorter L and a larger C, the network exhibits small world property, indicating efficient connectivity with localized clusters (39). The second tier of indicators describes the structural attributes of individual nodes, focusing on node degree and betweenness centrality. Node degree (K) refers to the number of direct connections a specific node has within the network. In a directed network, this can be further categorized into out-degree and in-degree. The node degrees for 2013, 2018, and 2023 were ranked from smallest to largest in this study. Betweenness centrality (BC) measures the likelihood that the shortest paths between nodes pass through a particular node, reflecting its control capability within the network (Table 1).
3.1.3 Core-peripheral analysis
Core-peripheral analysis is used to study the contribution and status of participating countries in the networks. This approach facilitates to identify closely connected centers as well as scattered peripheries. Core regions typically consist of member countries with high trade activity and strong interconnections, whereas peripheral regions are characterized by fewer and more scattered trade linkages. The algorithm for core-peripheral analysis was first proposed by Borgatti and Everett and can be categorized into discrete and continuous model (40, 41). In this study, we adopt a continuous core-peripheral model by calculating the cores of each node. The specific calculation formula is as follows:
In calculation formula, Ci and Cj represent the cores of nodes i and j, respectively. δij represents the element of the pattern matrix δ corresponding to the ideal core-edge model, while aij represents the element of the actual adjacency weight relation matrix. The correlation index ρ measures the correlation between the pattern matrix and the actual adjacency matrix. When ρ reaches the maximum value, δ represents the edge-core structure matrix that closely approximates the actual situation and corresponds to the nearest quasi-ideal model (42).
3.1.4 QAP analysis and factor selection
QAP analysis is a randomized detection method that consists of correlation analysis and regression analysis. The correlation analysis examines the relationship between each influencing factor and the trade network, while the regression analysis investigates the statistical significance and magnitude of the influencing factors (43). The QAP algorithm proceeds in three steps. Firstly, it calculates the Pearson correlation coefficient between corresponding cells of the two data matrices. Secondly, it randomly permutes rows and columns of one matrix and recalculates the correlation and other measures. Lastly, step 2 is repeated thousands of times to determine the proportion of times that the randomly generated measure is equal to or greater than the observed measure calculated in step 1.
Based on the QAP model, this paper selects four primary variables to analyze the factors influencing the export flow of TCM products among RCEP members. The model constructed in this study is as follows:
where the dependent variable T represents the matrix of TCM trade network, Diff_distance, Diff_GDP, Diff_population and Diff_economic freedom index are matrices that represent the absolute differences in the corresponding indexes. These four variables are standardized by the columns of the matrix. Binary_border and Binary_language are binary matrices. If two countries are the same, the value takes 1, otherwise it takes 0.
3.2 Data resource
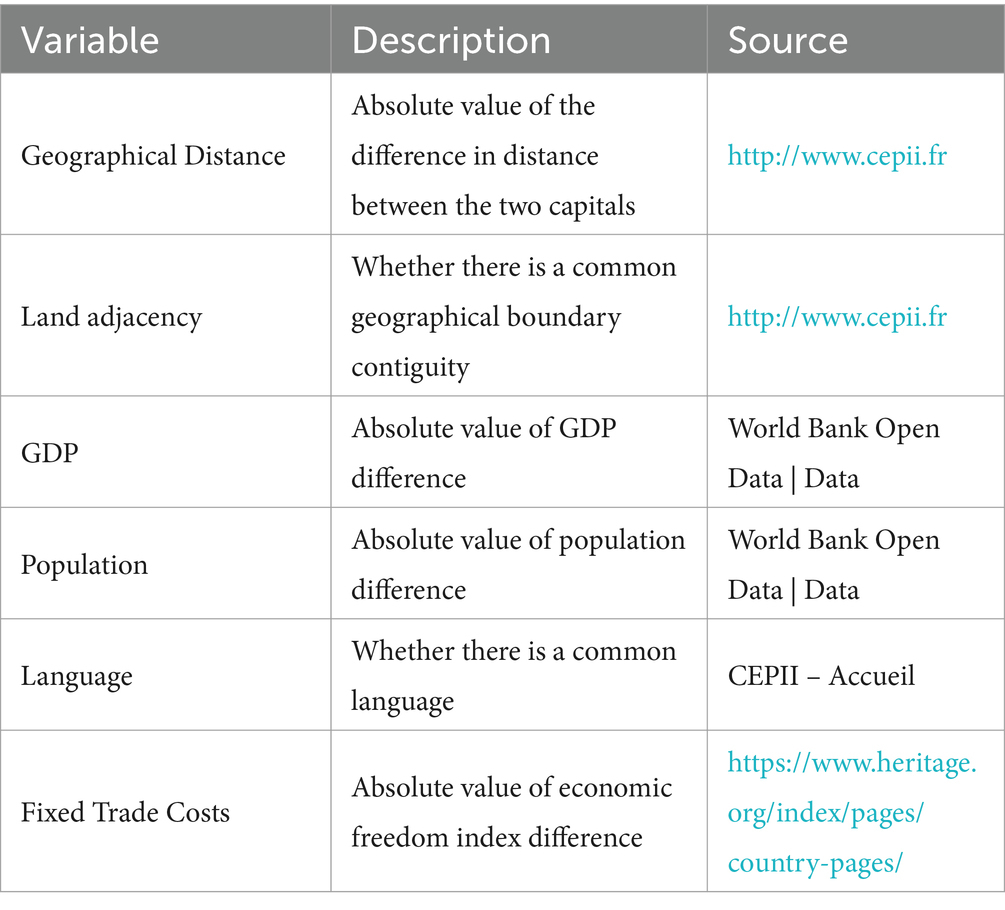
The TCM trade data of RCEP members were extracted from the UN-Comtrade database spanning from 2013 to 2023. The specific trade data is identified by the HS code. HS121190, which representing plants and parts of plants, used primarily in pharmacy, fresh or dried, whether or not cut, crushed or powdered. HS1302.19, which typically referring to plant extracts not specified for a particular use, including but not limited to natural gums, resins, and other plant extracts. HS 3301.90, which pertains to extracts and derivatives of aromatic plants, commonly used in perfumes, cosmetics, and food additives. Re-export and re-import quantities were not considered, because of their tiny proportion in the overall trade. Table 2 presents the variables used in QAP analysis. Data on GDP and total population were acquired from the World Bank database. Geographical distance, land boundary, and language were obtained from the Cep II database. The economic freedom index, published by the American Heritage Foundation, provides a comprehensive assessment of FTC by evaluating trade policies, government intervention, monetary policy, and the financial sector in 155 countries.
4 Results
4.1 An overview of TCM trade
The TCM trade value among RCEP members has undergone three notable phases. From 2013 to 2015, TCM exports experienced a rapid growth period, surging from $1.856 billion to a peak of $3.397 billion. This was followed by an adjustment phase from 2016 to 2020, during which the export value decreased to around $1.5 billion. Despite the positive global impact of Tu youyou’s discovery of artemisinin, which earned her Nobel Prize in 2015, TCM trade did not show significant growth between 2016 and 2018. This could be attributed to the complexity and diversity of TCM, which poses substantial challenges to its standardization and normalization during the process of internationalization. Although Tu Youyou’s discovery highlighted the substantial potential of TCM in modern medical applications, its use remains primarily limited to specific fields, such as malaria treatment. Overall, TCM still lacks sufficient clinical trials and contemporary scientific evidence to substantiate its efficacy, leading to its limited acceptance in global markets, particularly in Europe and the United States. Starting in 2020, the COVID-19 pandemic led to a significant increase in demand for TCM, driving export values up to $2.612 billion. The export value of plant extracts, the main subcategory of TCM, has consistently increased, culminating in a peak of $870 million in 2022. However, in 2023, the first year of normalized post-pandemic conditions, the global market has exhibited a general decline in demand coupled with a trend towards inventory reduction. As a result, the plant extract industry has experienced the dissipation of the “pandemic dividend,” leading to a substantial year-on-year decrease in export volumes (Figure 1).

Figure 1. Changes in the value of TCM exports among RCEP members, variation in China’s exports of TCM products, and fluctuations in the export value of plant extract.
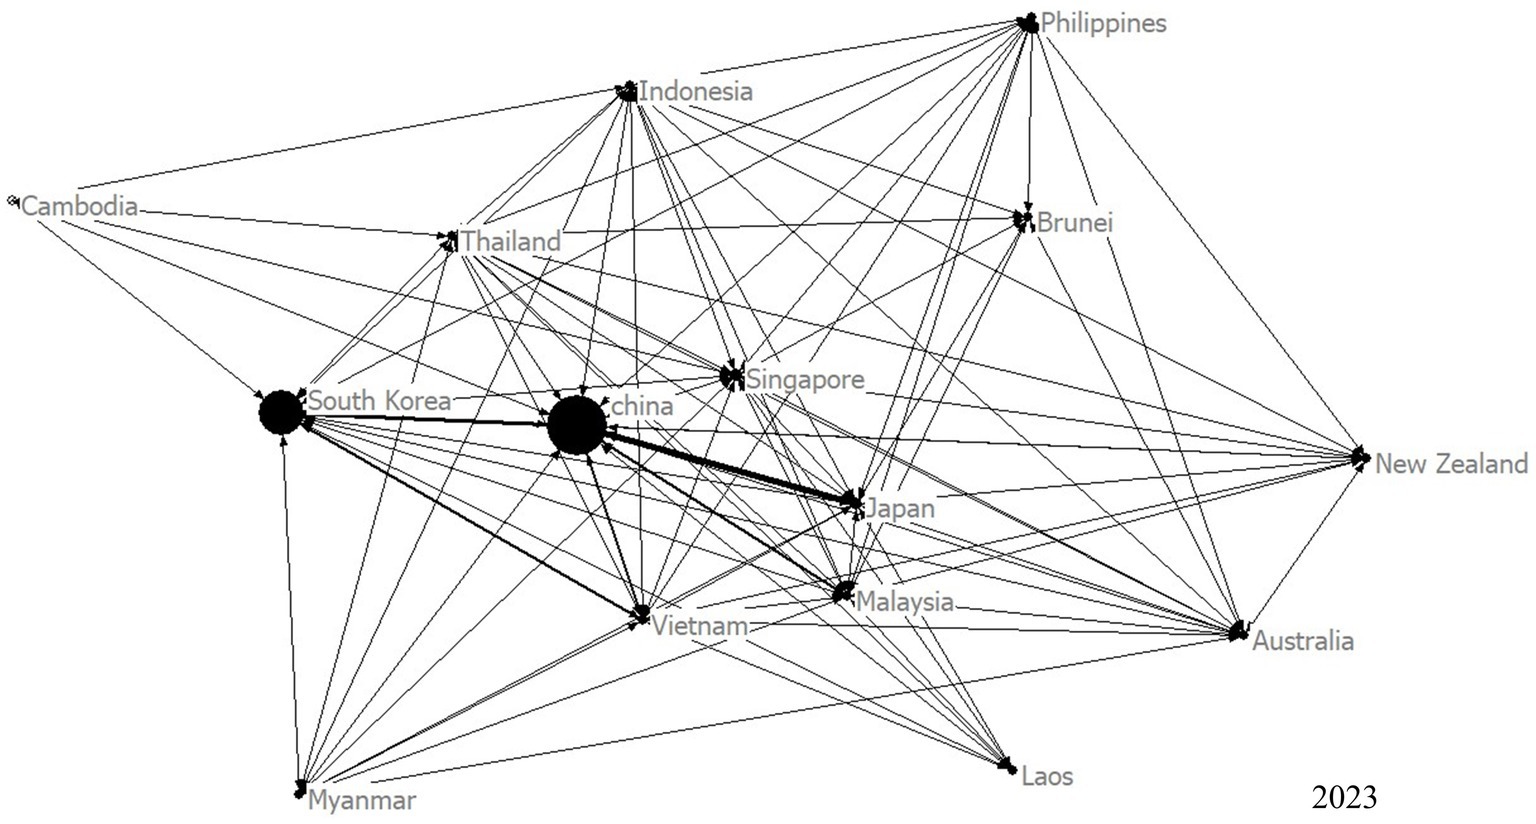
To gain a comprehensive understanding of the trade relationships among RCEP members, we constructed a visualized TCM trade network, and analyzed several key indicators. Figure 2 shows the network of TCM trade among RCEP member countries in 2023. The network density remained relatively stable, with a maximum value of 0.811 in 2022 and a minimum of 0.762 in 2014, indicating close trade relationships among RCEP members. Additionally, the L value ranged from 1.19 to 1.25, while the C value varied between 0.873 and 0.897 (Figure 3). Notably, the maximum L value was only marginally higher than the minimum C value, suggesting that the TCM trade network does not exhibit small-world characteristics, thereby reflecting a well-balanced trade relationship among the RCEP member states.

Figure 3. Network density (D), average path length (APL) and Clustering coefficient (C) from 2013 to 2023.
4.2 Nodes attribution
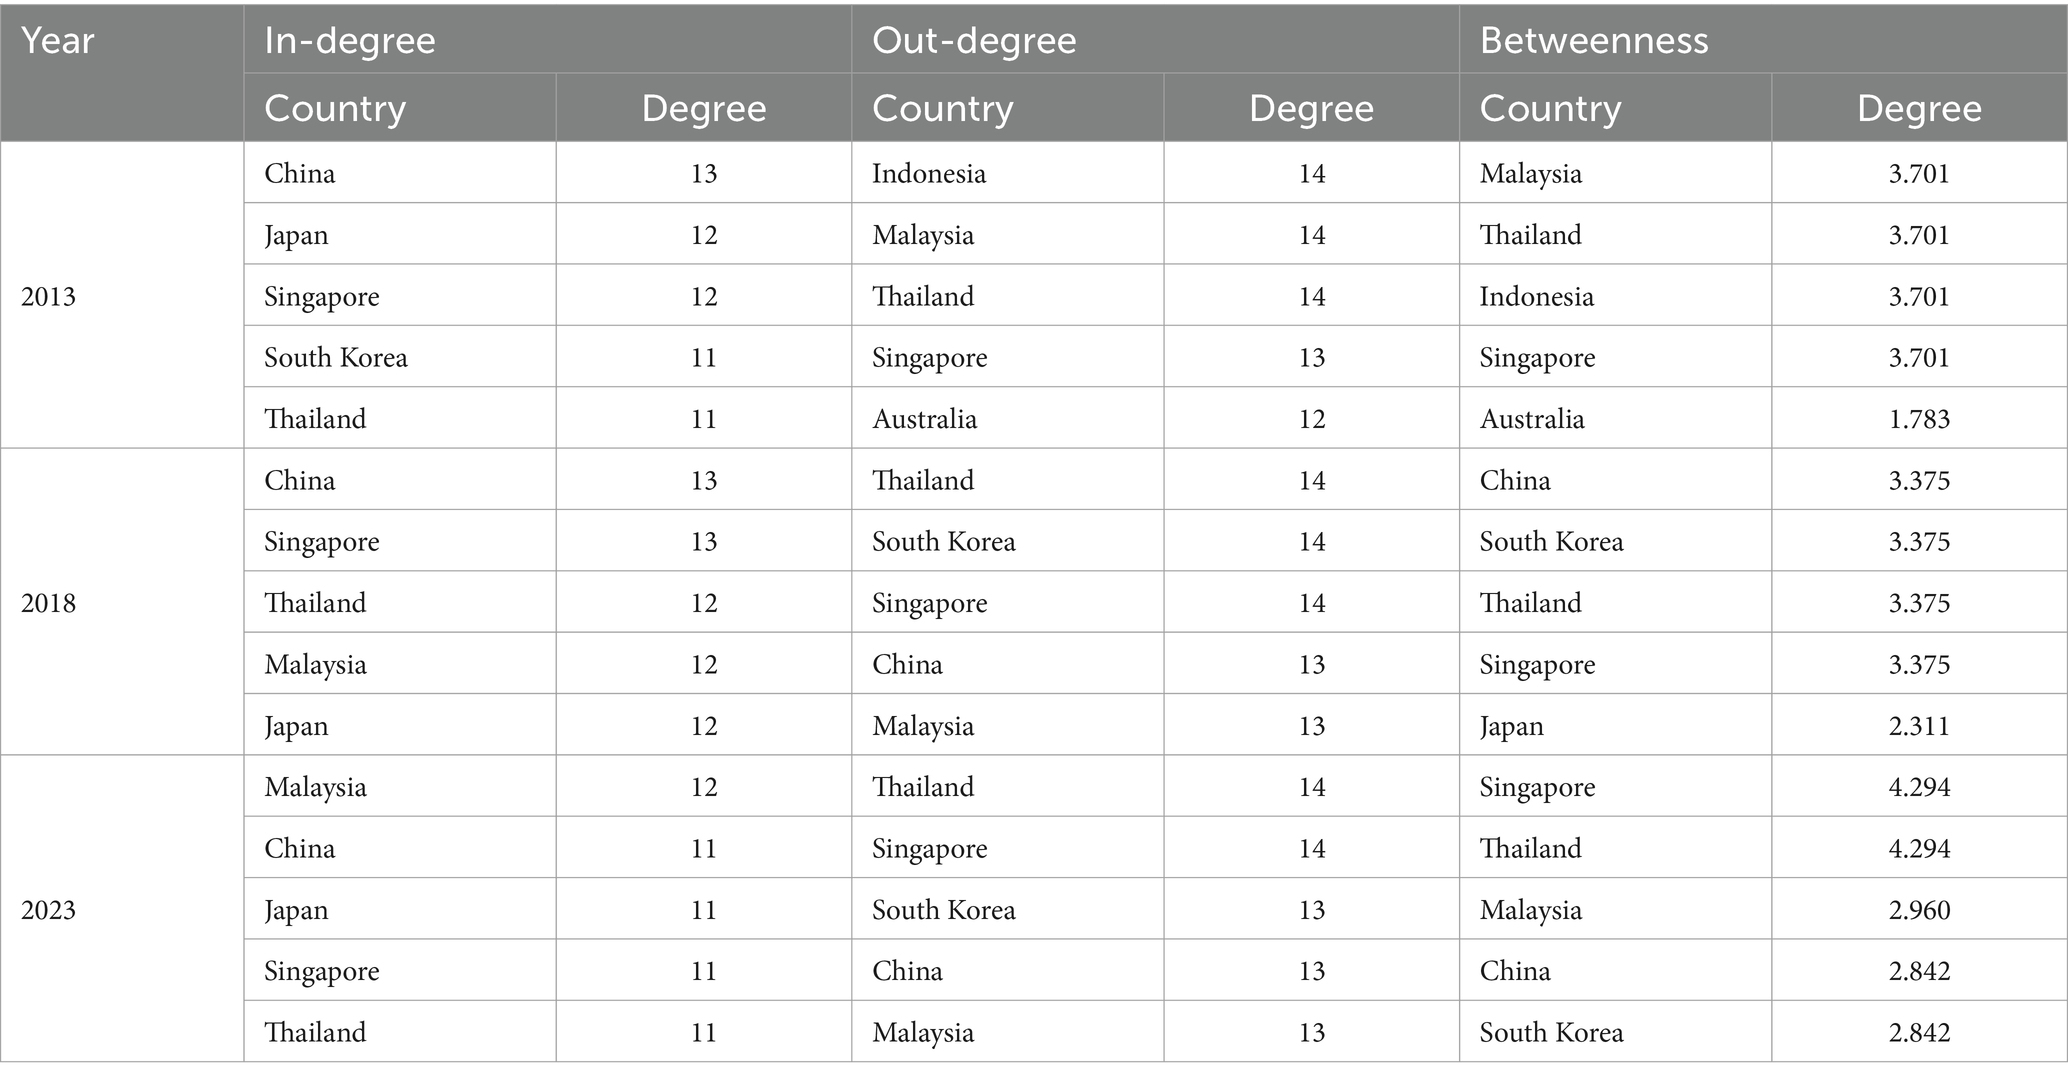
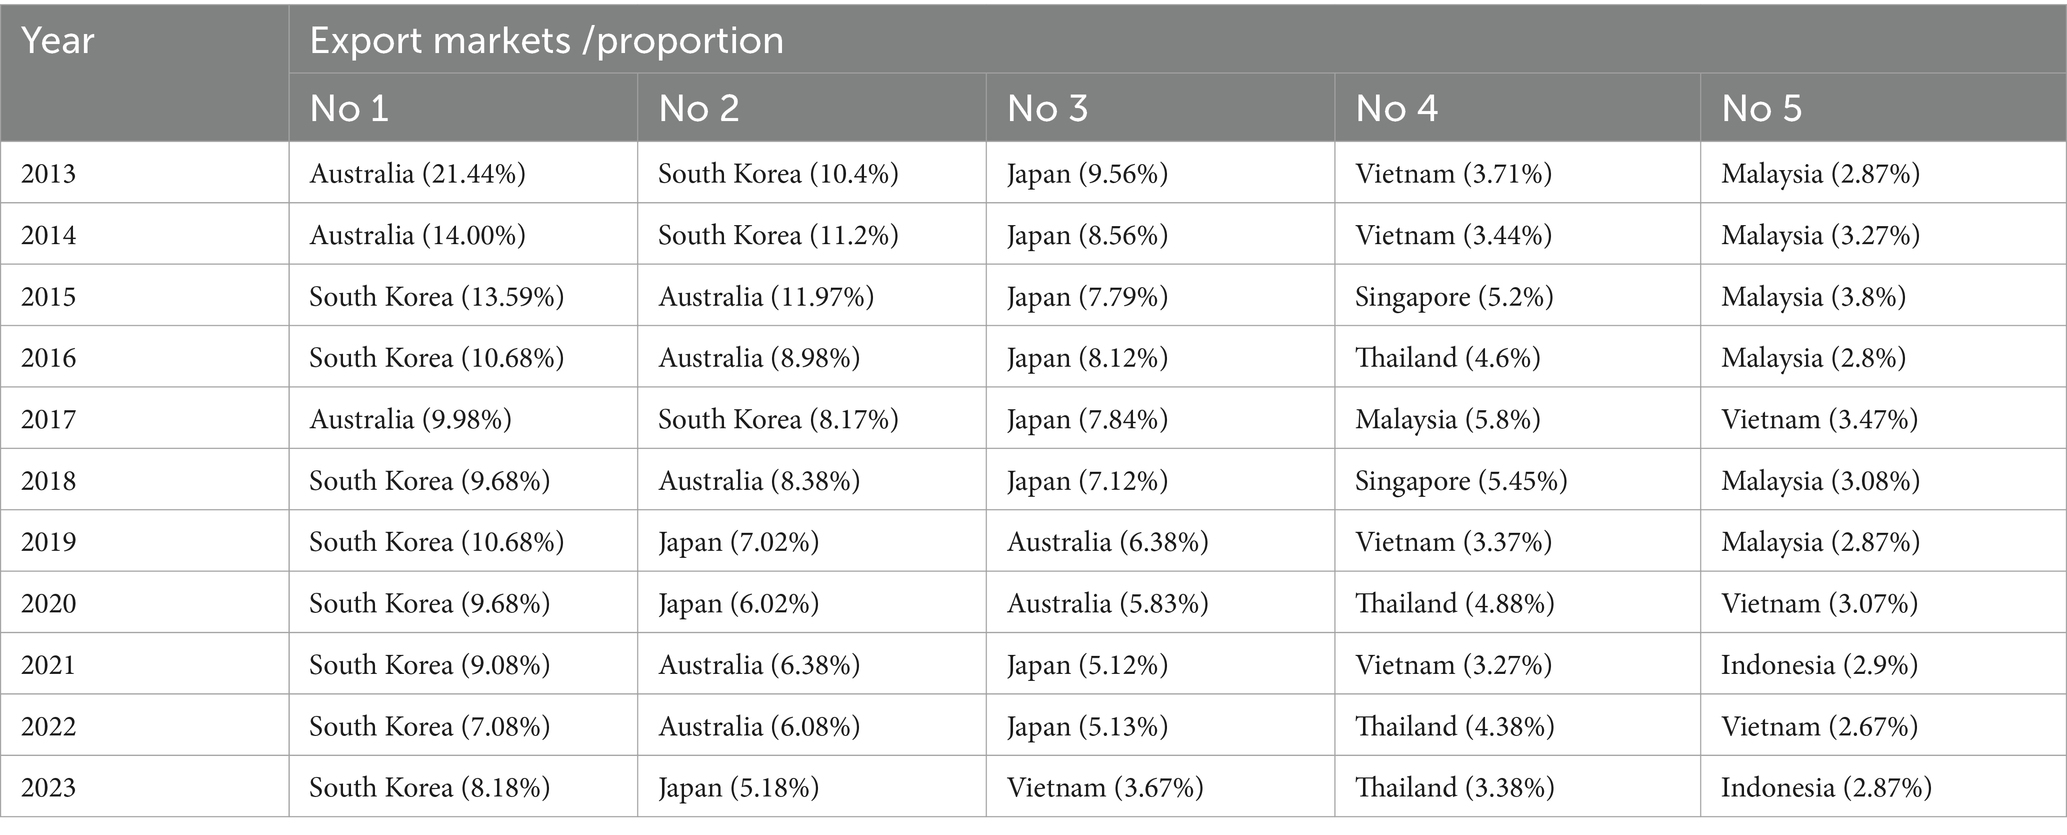
In this study, the node degree was ranked from small to large, and the top 5 nodes in 2013, 2018 and 2023 were identified and shown in Table 3. Although the node degree ranking varies in different times, some key countries, for example, China, South Korea, Japan, Singapore and Thailand remained at the forefront of ranking. The results indicate their relatively large market demand, great export advantage and strong market control ability. Among the RCEP members, China plays a central role in the TCM trade network, given its position as both a leading producer and exporter of TCM products. China’s extensive production capabilities, coupled with its established trade relations, enable it to influence trade patterns significantly. From 2013 to 2023, the export value of TCM, encompassing both medicinal materials and plant extracts, increased from $1.4424 billion to $1.933 billion, reflecting a compound annual growth rate (CAGR) of 3.4% (Figure 1). Notably, during the COVID-19 pandemic (2020–2023), TCM exports exhibited a marked acceleration, with an average annual growth rate of 25.2%. The principal export destinations are always in Japan, South Korea, and Australia. In 2023, South Korea for 8.18% of the total export value, followed by Japan (5.18%), Vietnam (3.67%), Thailand (3.38%). On the import front, Indonesia and Vietnam emerged as significant contributors. Imports from Indonesia reached a peak value of $1.43 billion. In comparison, imports from Vietnam amounted to $0.36 billion, demonstrating the highest year-on-year growth rate of 78% (see Table 4).
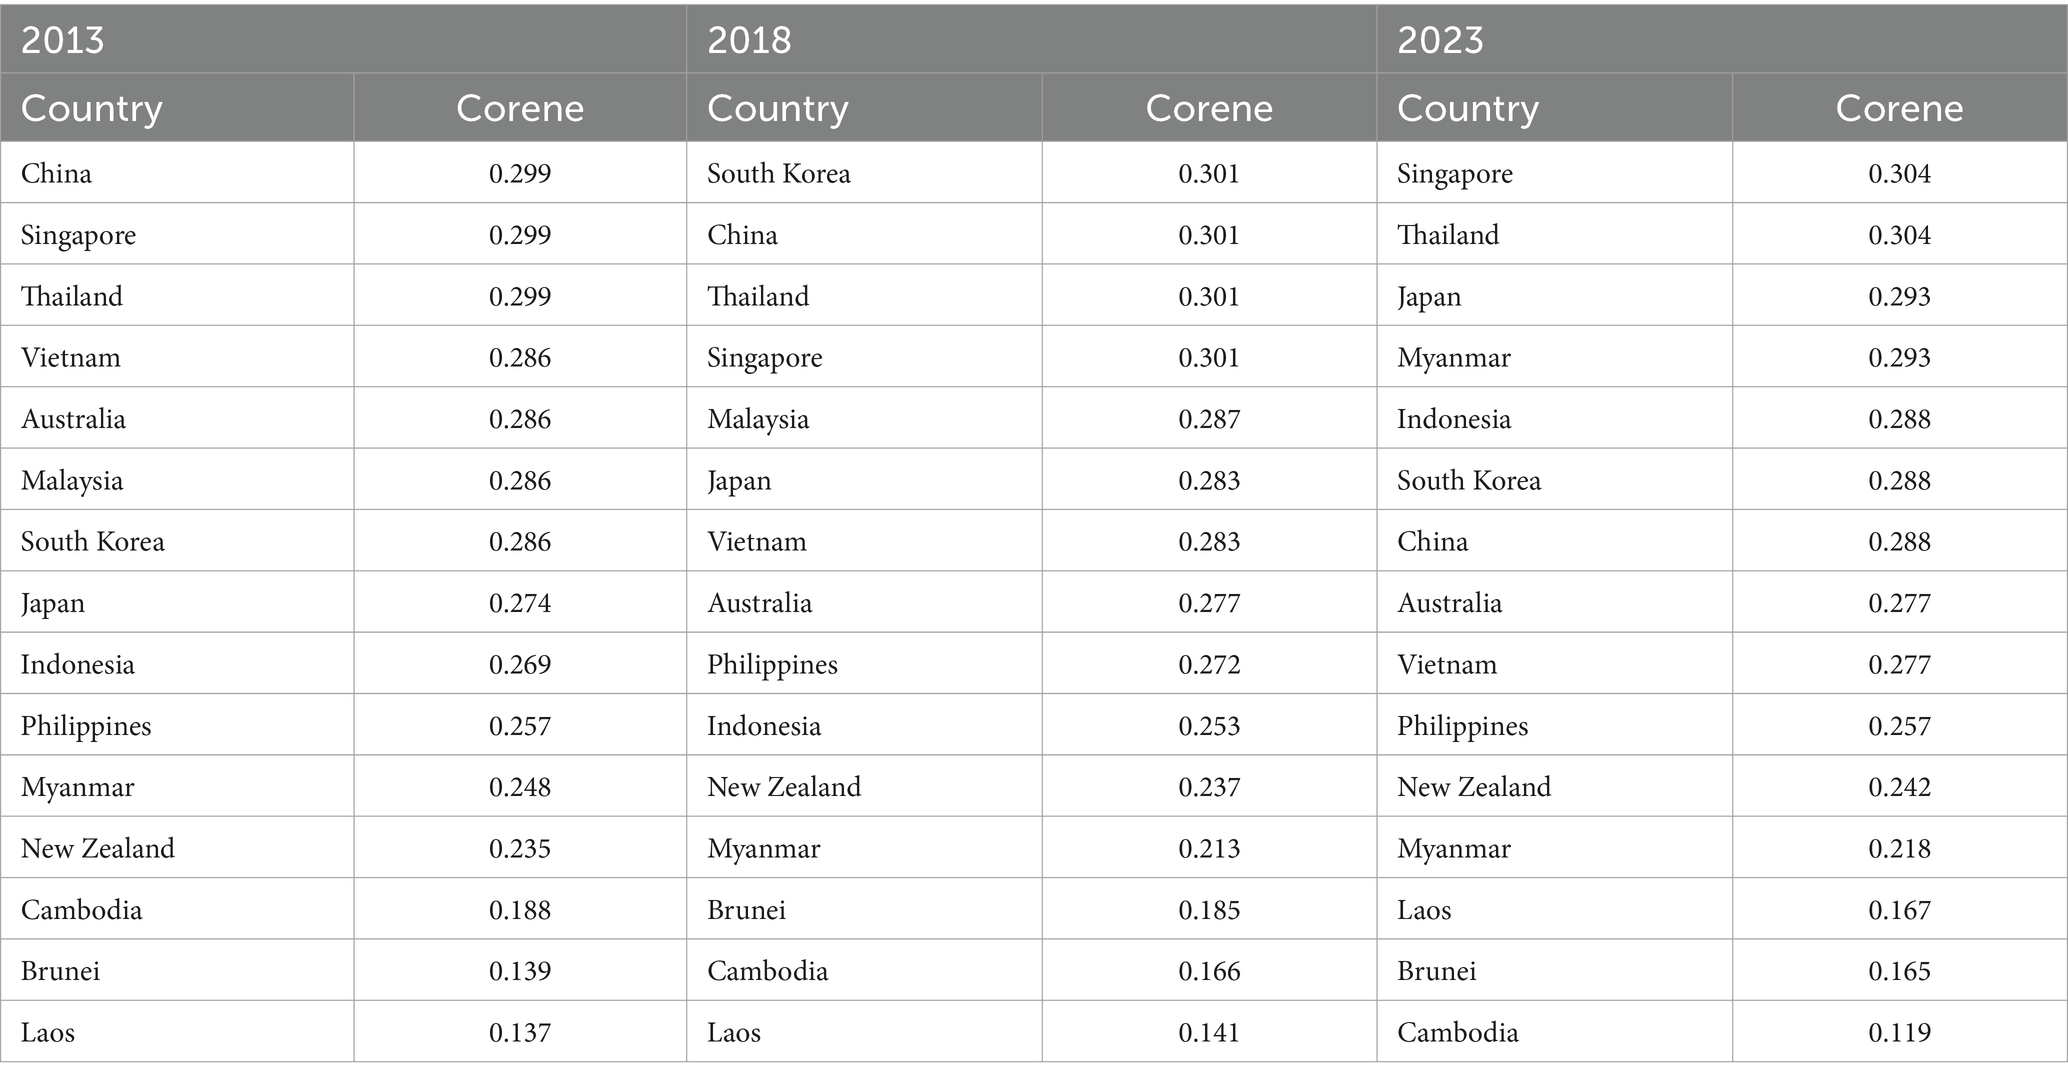
4.3 Core-periphery structure analysis
The RCEP member countries were divided into three categories through the core value (Table 5). The countries with core value greater than 0.3 were considered as core, those between 0.2 and 0.3 were considered as semi-periphery, and those less than 0.2 were considered as periphery. By calculating the core values of RCEP member countries from 2013 to 2023, we found that nations with core values exceeding 0.3 are predominantly clustered in Singapore, Thailand, South Korea, and China. Conversely, those with core values below 0.2 are primarily found in Laos, Myanmar, Brunei, and Cambodia. Additionally, the two Oceania members, Australia and New Zealand, are positioned within the semi-core region, with New Zealand exhibiting marginally lower levels of activity. These findings indicate that, while it is crucial to maintain stable trade relations with core nations, there is significant strategic potential in expanding market engagement with countries such as Laos, Myanmar, Brunei, Cambodia, and New Zealand.
4.4 Analysis of influencing factors
4.4.1 QAP correlation analysis
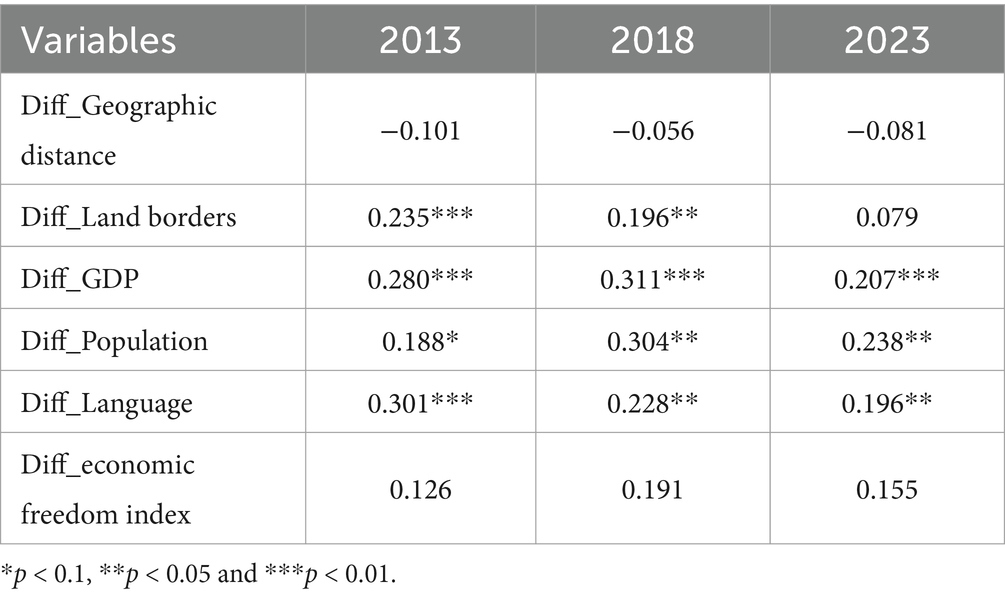
In this paper, 5,000 random permutations were conducted and TCM trade matrix among RCEP members and its impact factors in 2013, 2018 and 2023 were selected for correlation analysis.
Analysis reveals that land borders, GDP, population, and language significantly impacted TCM trade in 2013, 2018, and 2023, with these variables showing statistical significance at the 1% level (Table 6). Geographic distance were the factors negatively correlated with the trade network, indicating that greater distances correspond to lower trade volumes. The economic freedom index exhibited a positive correlation, indicating FTC were also negatively correlated with trade.
4.4.2 QAP regression analysis
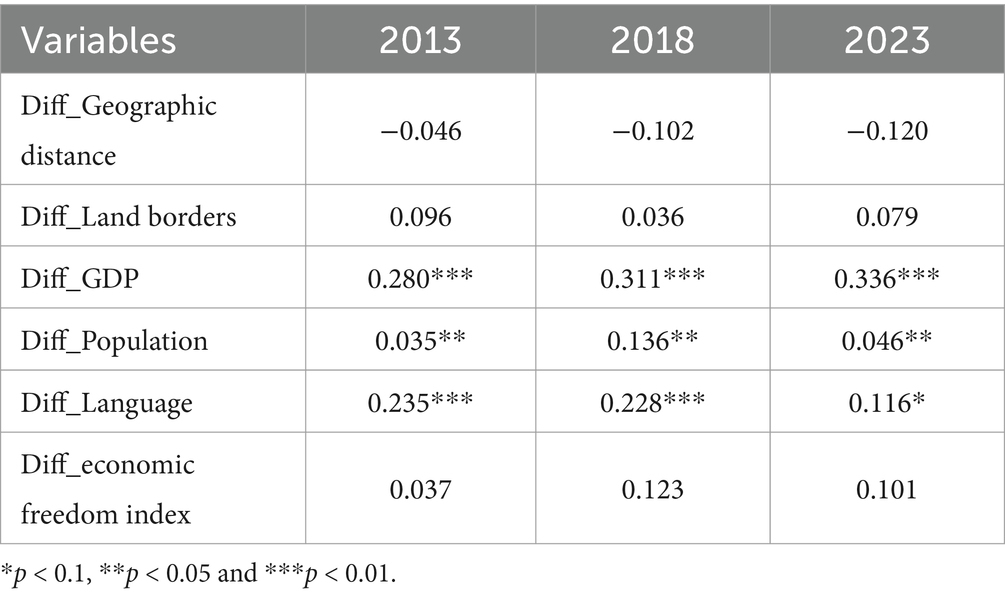
Considering correlation analysis only provided preliminary results, QAP regression analysis was then applied to further investigate the statistical significance of the six explanatory variables. The regression results in 2013, 2018 and 2023 are shown in Table 7.
Firstly, geographic distance and land adjacency did not show significant effects on TCM trade. Since most RCEP members are located in Asia, with major regions such as some ASEAN countries sharing borders, the impact of spatial distance on trade is minimal. In addition, transportation, such as marine and air freight also reduce the restrictions of space distance on trade. Secondly, the coefficient of economy and population scale were positive and statistically significant. TCM products are both resource-intensive and labor-intensive. A developed economy often reflects advanced technical processing capabilities and consumption power, while a large population not only signifies greater demand but also provides a substantial labor force engaged in TCM processing. These factors collectively enhance the flow of trade in TCM products. Thirdly, language were the positive elements and statistically significance. This finding implied that TCM trade benefited from a similar culture background, with the countries with same language are more likely to trade with each other. Finally, economic freedom index show positive effect on trade, which means countries with higher levels of economic freedom have higher trade activity.
In addition to considering the above-mentioned factors, we also explored whether there is a connection between medicinal resources and TCM trade. The RCEP member countries are rich in medicinal plant resources. We obtained a list of plant species and their geographic distribution records for RCEP member countries from Plants of the World Online (POWO, https://powo.science.kew.org). The scientific names of the medicinal plants from the RCEP member countries were cross-referenced with the Medicinal Plant Names Services system (MPNS, https://www.kew.org/science/our-science/science-services/medicinal-plant-names-services), which allowed us to estimate the approximate number of medicinal plant species in these countries. Table 8 demonstrates that China possesses a relatively abundant supply of medicinal plant resources, which confers a natural advantage in the provision of raw materials for TCM trade. These resource advantages may be another factor contributing to China’s leadership in the TCM trade within the RCEP member countries.
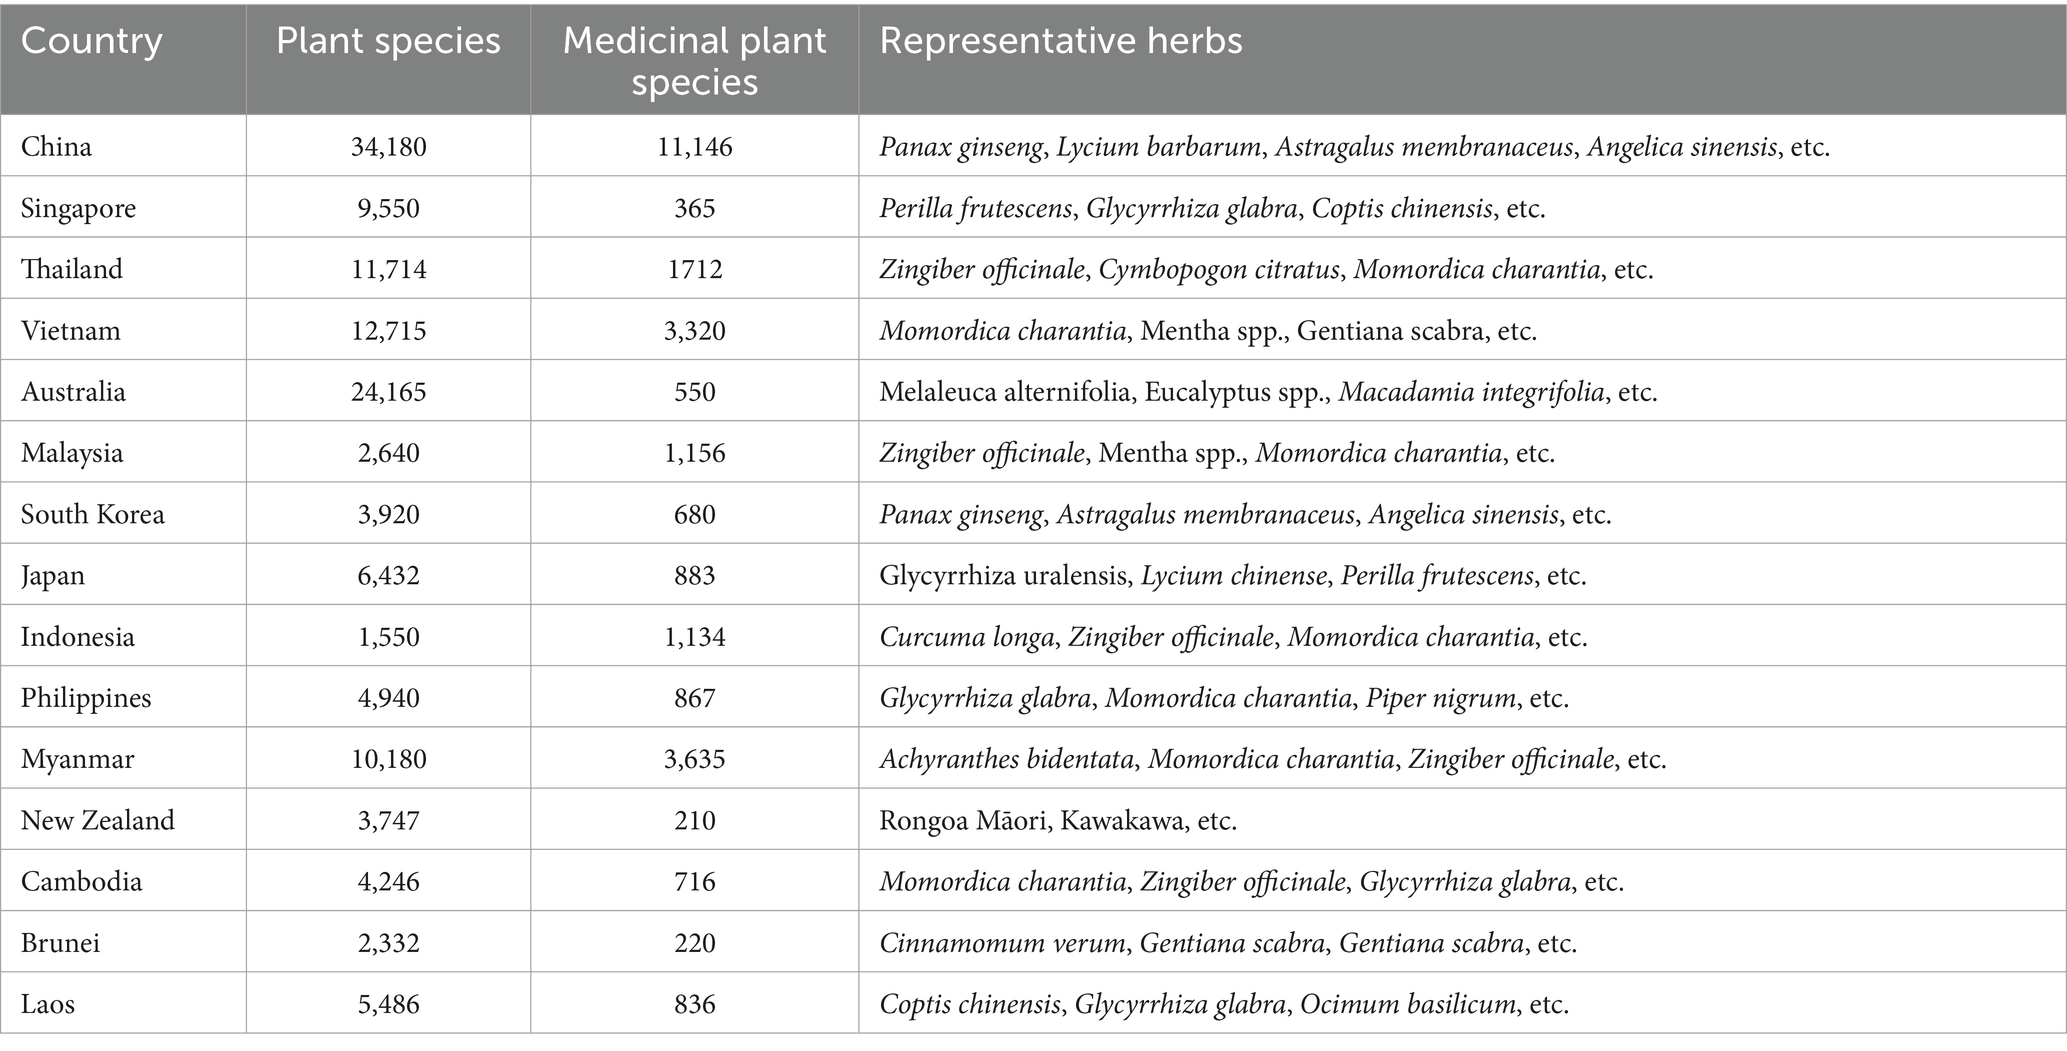
Table 8. The approximate number of plant species and medicinal plants, and the representative herbs in RCEP countries.
4.5 Major export products
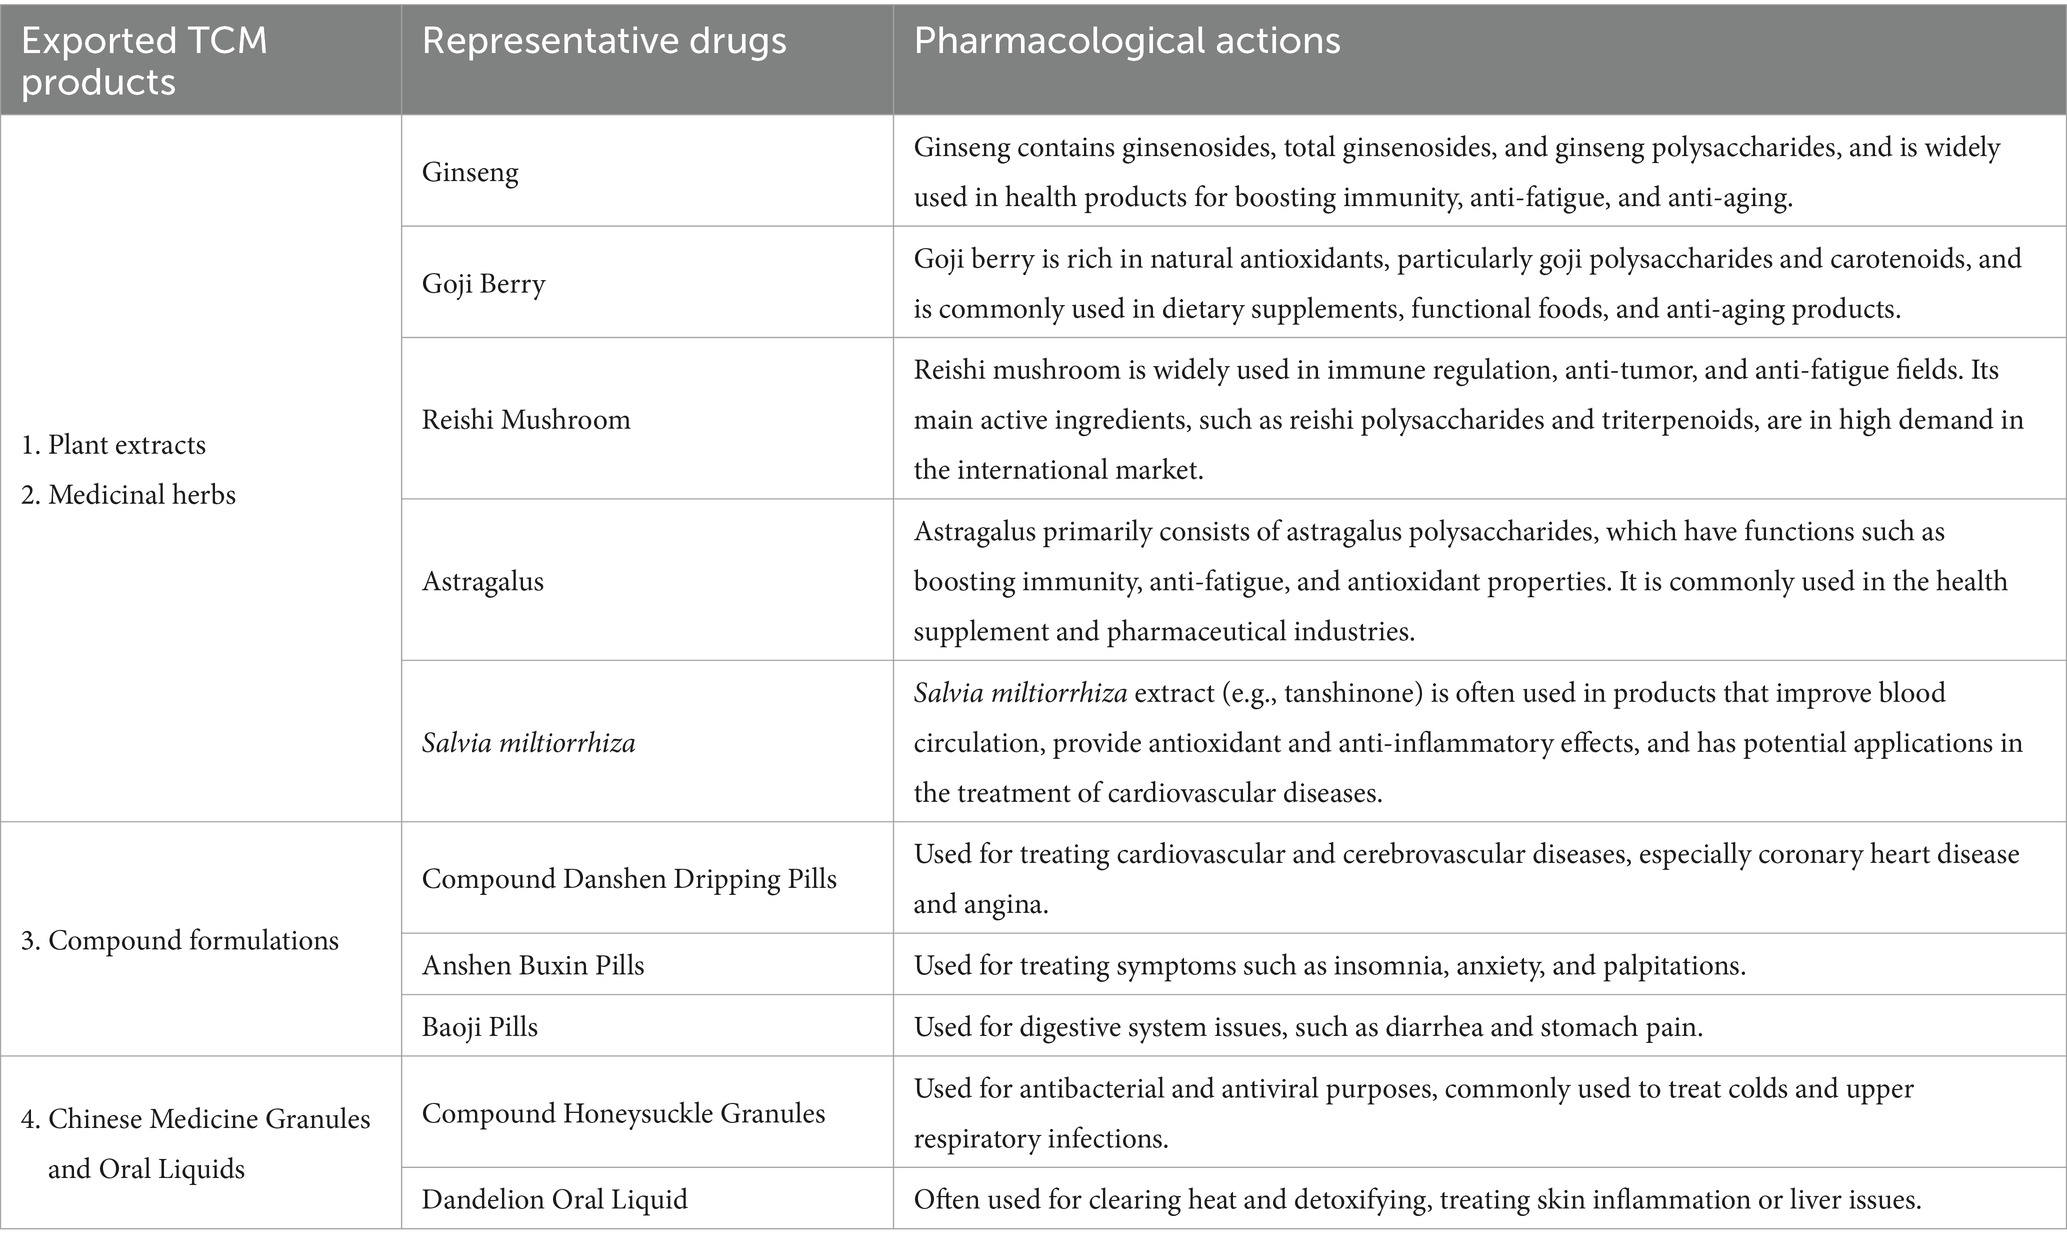
Taking China as an example, we summarize the main TCM products exported in recent years. These exported TCM products include plant extracts, medicinal herbs, Chinese patent medicines, including compound formulations and Chinese Medicine Granules and Oral Liquids. As shown in Table 9, among the RCEP member countries, TCM products containing ginseng, goji berries, astragalus, and Salvia miltiorrhiza, are widely accepted in foreign markets due to their antioxidant properties and immune-enhancing effects.
5 Conclusion and discussion
5.1 Conclusion
The TCM trade among RCEP member countries exhibits distinct characteristics compared to other commodity trade. Firstly, TCM trade did not experience a substantial surge following Tu Youyou’s Nobel Prize award. However, the COVID-19 pandemic induced a temporary spike in exports, which later returned to pre-pandemic levels. This trend indicates that the factors influencing TCM trade are primarily long-term and structural in nature, rather than being driven by the occurrence of any single, isolated event. Secondly, the trade network of TCM does not exhibit small-world characteristics, indicating a relatively balanced trade relationship among member states. Thanks to its resource advantages, China occupies a pivotal position in the TCM trade network, being both a dominant producer and a leading exporter of TCM products. Vietnam’s export performance in recent years has been exceptional, with the highest year-on-year growth rate among member nations. Countries such as Laos, Myanmar, Cambodia, and New Zealand possess substantial untapped market potential. Thirdly, economic size and population scale exert a significant positive influence on trade value, whereas geographic distance and land adjacency appear to have no statistically significant effects. Trade activity is enhanced by cultural and linguistic similarities, and countries with higher levels of economic freedom tend to exhibit greater trade activity. Tonifying TCM products with antioxidant and immune-boosting properties are more widely recognized in international markets.
5.2 Discussion
5.2.1 Commerce and conservation
The interplay between resource sustainability and trade requires careful consideration. The prudent management of resources is essential for the long-term sustainability of the economy, while patterns of economic development influence the dynamics of resource utilization (44). Trade should not advance at the expense of species extinction. It is recommended to enhance the protection of TCM resources by adopting environmentally friendly cultivation and harvesting practices. This approach will ensure a sustainable supply of raw materials and minimize negative environmental impacts.
5.2.2 Dominant markets and emerging markets
While TCM dominates the Asian market, its potential in emerging markets such as Europe, the Americas, and Africa is growing with the rising global awareness of health and the popularity of natural therapies. RCEP offers opportunities for TCM to enter emerging markets, such as Southeast Asia and Oceania. In these markets, conducting cross-border marketing campaigns and strengthening collaborations with local distributors can help TCM companies establish stable sales channels. Additionally, trade exhibitions and seminars among RCEP member countries can serve as platforms to showcase the uniqueness and efficacy of TCM, thereby enhancing global consumer recognition and acceptance of these products.
5.2.3 Regional cooperation and policy coordination
RCEP encompasses 15 countries across East Asia, Southeast Asia, and Oceania, offering a vast market. By leveraging the trade agreements and tariff concessions among RCEP member states, TCM enterprises can reduce tariff barriers, streamline approval processes, and enhance market access for their products. It is also important to note that due to varying perceptions and quality standards of TCM across different countries, market entry barriers for TCM remain relatively high. Promoting coordination among RCEP member countries in TCM production, testing, and regulatory standards to establish regionally or internationally recognized TCM standards (45). Governments should strengthen policy coordination, simplify the import and export procedures for TCM products, and facilitate smoother trade flows among member countries.
Data availability statement
The datasets presented in this study can be found in online repositories. The names of the repository/repositories and accession number(s) can be found in the article/supplementary material.
Author contributions
YF: Conceptualization, Writing – original draft. MXT: Data curation, Software, Writing – review & editing. XL: Data curation, Methodology, Software, Writing – review & editing.
Funding
The author(s) declare that financial support was received for the research, authorship, and/or publication of this article. This study was supported by Philosophy and Social Science Planning Project of Anhui Province, Grant/Award Number: 2022AH050424 and Excellent Youth Fund project of Anhui Provincial Education Department, Grant/Award Number: YQYB2023008.
Conflict of interest
The authors declare that the research was conducted in the absence of any commercial or financial relationships that could be construed as a potential conflict of interest.
Generative AI statement
The authors declare that no Gen AI was used in the creation of this manuscript.
Publisher’s note
All claims expressed in this article are solely those of the authors and do not necessarily represent those of their affiliated organizations, or those of the publisher, the editors and the reviewers. Any product that may be evaluated in this article, or claim that may be made by its manufacturer, is not guaranteed or endorsed by the publisher.
Abbreviations
TCM, Traditional Chinese Medicine; RCEP, Regional Comprehensive Economic Partnership; ASEAN, Association of Southeast Asian Nations; SNA, Social Network Analysis; QAP, Quadratic Assignment Procedure; D, Density; L, Average Path Length; C, Clustering Coefficient; K, Node-Degree; BC, Betweenness Centrality; FTC, Fixed Trade Costs.
References
1. Xu, HY, Zhang, YQ, Liu, ZM, Chen, T, Lv, CY, Tang, SH, et al. ETCM: an encyclopaedia of traditional Chinese medicine. Nucleic Acids Res. (2018) 47:D976–82. doi: 10.1093/nar/gky987
2. Wang, J, Zhu, F, Huang, W, Chen, Z, Zhao, P, Lei, Y, et al. Therapeutic effect and mechanism of acupuncture in autoimmune diseases. Am J Chin Med. (2022) 50:639–52. doi: 10.1142/S0192415X22500252
3. Novikov, YO, and Akopyan, AP. The value of traditional medicine should not be underestimated—traditional Chinese medicine in treatment of autoimmune diseases. Chin Med Cult. (2024) 7:167–73. doi: 10.1097/MC9.0000000000000102
4. Jiang, Y, Zhao, Q, Li, L, Huang, S, Yi, S, and Hu, Z. Effect of traditional Chinese medicine on the cardiovascular diseases. Front Pharmacol. (2022) 13:806300. doi: 10.3389/fphar.2022.806300
5. Xiang, Y, Guo, Z, Zhu, P, Chen, J, and Huang, Y. Traditional Chinese medicine as a cancer treatment: modern perspectives of ancient but advanced science. Cancer Med. (2019) 8:1958–75. doi: 10.1002/cam4.2108
6. Lyu, H-N, Ma, N, Meng, Y, Zhang, X, Wong, Y-K, Xu, C, et al. Study towards improving artemisinin-based combination therapies. Nat Prod Rep. (2021) 38:1243–50. doi: 10.1039/D0NP00079E
7. Dong, J. The relationship between traditional Chinese medicine and modern medicine. Evid Based Complement Alternat Med. (2013) 2013:153148:1–10. doi: 10.1155/2013/153148
8. Liu, Y, Yang, Z, Cheng, J, and Fan, D. Barriers and countermeasures in developing traditional Chinese medicine in Europe. Front Med. (2016) 10:360–76. doi: 10.1007/s11684-016-0455-x
9. Chan, K, Hu, X-Y, Razmovski-Naumovski, V, and Robinson, N. Challenges and opportunities of integrating traditional Chinese medicine into mainstream medicine: a review of the current situation. Eur J Integr Med. (2015) 7:67–75. doi: 10.1016/j.eujim.2014.12.006
10. Li, M, Cao, M, Sun, J, Jiang, Y, and Liu, Y. Pharmaceutical care in Chinese public tertiary hospitals: findings from the 4th National Healthcare Improvement Initiative Survey. Hum Resour Health. (2020) 18:1–10. doi: 10.1186/s12960-020-00473-z
11. Wang, W-Y, Zhou, H, Wang, Y-F, Sang, B-S, and Liu, L. Current policies and measures on the development of traditional Chinese medicine in China. Pharmacol Res. (2021) 163:105187:105187. doi: 10.1016/j.phrs.2020.105187
12. Hinsley, A, Milner-Gulland, EJ, Cooney, R, Timoshyna, A, Ruan, X, and Lee, TM. Building sustainability into the belt and road Initiative’s traditional Chinese medicine trade. Nat Sustain. (2020) 3:96–100. doi: 10.1038/s41893-019-0460-6
13. Xie, R, and Lv, M. A study on the development of traditional Chinese medicine service trade facilitated by digital technology. 2022 2nd international conference on economic development and business culture (ICEDBC 2022); (2022). Atlantis Press; 1672–1677.
14. Grépin, KA, Song, M, Piper, J, Worsnop, CZ, and Lee, K. The adoption of international travel measures during the first year of the COVID-19 pandemic: a descriptive analysis. Glob Health. (2024) 20:72. doi: 10.1186/s12992-024-01071-7
15. Mena, C, Karatzas, A, and Hansen, C. International trade resilience and the Covid-19 pandemic. J Bus Res. (2022) 138:77–91. doi: 10.1016/j.jbusres.2021.08.064
16. Shimizu, K. The ASEAN economic community and the RCEP in the world economy. J Contemp East Asia stud. (2021) 10:1–23. doi: 10.1080/24761028.2021.1907881
17. Zhao, Z. Research on green barriers and countermeasures for Chinese Materia Medica entering ASEAN countries under the background of the belt and road initiative. Pac Int J. (2023) 6:01–8. doi: 10.55014/pij.v6i3.338
18. Serrano, MA, and Boguñá, M. Topology of the world trade web. Phys Rev E Stat Nonlinear Soft Matter Phys. (2003) 68:015101. doi: 10.1103/PhysRevE.68.015101
19. Zhong, W, An, H, Gao, X, and Sun, X. The evolution of communities in the international oil trade network. Phys A Stat Mech Appl. (2014) 413:42–52. doi: 10.1016/j.physa.2014.06.055
20. Newman, ME, and Park, J. Why social networks are different from other types of networks. Phys Rev E Stat Nonlinear Soft Matter Phys. (2003) 68:036122. doi: 10.1103/PhysRevE.68.036122
21. Fagiolo, G. The international-trade network: gravity equations and topological properties. J Econ Interac Coord. (2010) 5:1–25. doi: 10.1007/s11403-010-0061-y
22. Leibenstein, H, and Tinbergen, J. Shaping the world economy: suggestions for an international economic policy. Econ J. (1966) 76:92–5. doi: 10.2307/2229041
23. Bergstrand, JH. The generalized gravity equation, monopolistic competition, and the factor-proportions theory in international trade. Rev Econ Stat. (1989) 71:143–53. doi: 10.2307/1928061
24. Ristanovic, V, Primorac, D, and Kozina, G. Applying gravity model to analyse trade direction. Teh Vjesn. (2020) 27:1670–7. doi: 10.17559/tv-20200217101315
25. Vu, TTH, Tian, G, Zhang, B, and Nguyen, TV. Determinants of Vietnam's wood products trade: application of the gravity model. Med Literat. (2020) 39:445–60. doi: 10.1080/10549811.2019.1682011
26. Sui, G, Zou, J, Wu, S, and Tang, D. Comparative studies on trade and value-added trade along the “belt and road”: a network analysis. Complexity. (2021) 2021:3994004. doi: 10.1155/2021/3994004
27. Dekker, D, Krackhardt, D, and Snijders, TA. Sensitivity of MRQAP tests to collinearity and autocorrelation conditions. Psychometrika. (2007) 72:563–81. doi: 10.1007/s11336-007-9016-1
28. Xu, H, and Cheng, L. The QAP weighted network analysis method and its application in international services trade. Phys A Statist Mech Appl. (2016) 448:91–101. doi: 10.1016/j.physa.2015.12.094
29. Anderson, JE, and Van Wincoop, E. Gravity with gravitas: a solution to the border puzzle. Amer Econ Rev. (2003) 93:170–92. doi: 10.1257/000282803321455214
30. Walker, S. Cultural barriers to market integration: evidence from 19th century Austria. J Comp Econ. (2018) 46:1122–45. doi: 10.1016/j.jce.2018.05.001
31. Rahman, MM. Exploring the effects of economic growth, population density and international trade on energy consumption and environmental quality in India. Int J Energy Sec Manag. (2020) 14:1177–203. doi: 10.1108/IJESM-11-2019-0014
32. Medin, H. Firms’ export decisions—fixed trade costs and the size of the export market. J Int Econ. (2003) 61:225–41. doi: 10.1016/S0022-1996(02)00076-4
33. Guan, Q, An, H, Gao, X, Huang, S, and Li, H. Estimating potential trade links in the international crude oil trade: a link prediction approach. Energy. (2016) 102:406–15. doi: 10.1016/j.energy.2016.02.099
34. Wu, X, and Chen, G. Global overview of crude oil use: from source to sink through inter-regional trade. Energy Policy. (2019) 128:476–86. doi: 10.1016/j.enpol.2019.01.022
35. Gao, C, Sun, M, and Shen, B. Features and evolution of international fossil energy trade relationships: a weighted multilayer network analysis. Appl Energy. (2015) 156:542–54. doi: 10.1016/j.apenergy.2015.07.054
36. Li, J, Chen, G, Hayat, T, and Alsaedi, A. Mercury emissions by Beijing′ s fossil energy consumption: based on environmentally extended input–output analysis. Renew Sust Energ Rev. (2015) 41:1167–75. doi: 10.1016/j.rser.2014.08.073
37. Ji, L, Jia, X, Chiu, AS, and Xu, M. Global electricity trade network: structures and implications. PLoS One. (2016) 11:e0160869:e0160869. doi: 10.1371/journal.pone.0160869
38. Wang, C, Huang, X, Lim, MK, Tseng, M-L, and Ghadimi, P. Mapping the structural evolution in the global scrap copper trade network. J Clean Prod. (2020) 275:122934:122934. doi: 10.1016/j.jclepro.2020.122934
39. Nobi, A, Lee, TH, and Lee, JW. Structure of trade flow networks for world commodities. Phys A Statis Mech Appl. (2020) 556:124761. doi: 10.1016/j.physa.2020.124761
40. Borgatti, S, and Everett, M. Models of Core/periphery structures. Soc Netw. (1999) 21:375–95. doi: 10.1016/S0378-8733(99)00019-2
41. Yanchenko, E, and Sengupta, S. Core-periphery structure in networks: a statistical exposition. (2022) Available at: https://ui.adsabs.harvard.edu/abs/2022arXiv220204455Y (Accessed February 01, 2022).
42. Elliott, A, Chiu, A, Bazzi, M, Reinert, G, and Cucuringu, M. Core–periphery structure in directed networks. Proc R Soc A. (2020) 476:20190783. doi: 10.1098/rspa.2019.0783
43. Liu, J. An introduction to social network analysis. Beijing: Social Sciences Academic Press (2004).
44. Fang, Y, Tang, M, Wei, H, Feng, Z, and Yu, N. Global ginseng trade networks: structural characteristics and influencing factors. Front Pharmacol. (2023) 14:1119183. doi: 10.3389/fphar.2023.1119183
Keywords: traditional Chinese medicine trade, regional comprehensive economic partnership, structural characteristics, influencing factors, social network analysis, quadratic assignment procedure
Citation: Fang Y, Tang MX and Liu X (2025) Traditional Chinese medicine trade among RCEP countries: structural characteristics and determinants. Front. Public Health. 12:1508839. doi: 10.3389/fpubh.2024.1508839
Edited by:
Sam Agatre Okuonzi, Ministry of Health, UgandaReviewed by:
Adolfo Andrade-Cetto, National Autonomous University of Mexico, MexicoQian Li, Beijing Technology and Business University, China
Copyright © 2025 Fang, Tang and Liu. This is an open-access article distributed under the terms of the Creative Commons Attribution License (CC BY). The use, distribution or reproduction in other forums is permitted, provided the original author(s) and the copyright owner(s) are credited and that the original publication in this journal is cited, in accordance with accepted academic practice. No use, distribution or reproduction is permitted which does not comply with these terms.
*Correspondence: Yue Fang, cnNjc3prQGFodGNtLmVkdS5jbg==
 Yue Fang
 Meng Xue Tang1
 Xu Liu