 Min Li
 Ying Liu2
 Yan Wang
94% of researchers rate our articles as excellent or good
Learn more about the work of our research integrity team to safeguard the quality of each article we publish.
Find out more
ORIGINAL RESEARCH article
Front. Public Health, 07 January 2025
Sec. Aging and Public Health
Volume 12 - 2024 | https://doi.org/10.3389/fpubh.2024.1475330
This article is part of the Research TopicDiagnosing and Treating Frailty and Sarcopenia in Middle-aged and Older AdultsView all 7 articles
Purpose: Sarcopenia, an age-related complication, constitutes a major public health problem given the aging of the population. However, it is frequently overlooked and undertreated in mainstream practice. The study aimed to investigate the correlations between triglyceride-glucose (TyG) index and TyG-body mass index (BMI) and sarcopenia in non-diabetic middle-aged and older women and whether they would be helpful indicators of sarcopenia.
Patients and methods: This cross-sectional study was conducted in the Department of Endocrinology, Hebei Medical University Third Hospital. This study prospectively enrolled 460 non-diabetic postmenopausal women aged ≥50 years.
Results: As TyG and TyG-BMI increased, the prevalence of sarcopenia decreased. In multivariate analysis, the TyG index and TyG-BMI index were inversely associated with sarcopenia (OR: 0.492; 95% CI: 0.256–0.944 and OR: 0.948; 95% CI: 0.934–0.962). Women in the fourth TyG-BMI quartiles showed decreased OR of 0.009 (95% CI: 0.001–0.072) for sarcopenia with respect to first quartiles after adjusting confounding factors. The area under the curve (AUC) for TyG index in the diagnosis of sarcopenia was 0.598 (95% CI: 0.529–0.666), while the AUC for TyG-BMI index was 0.858 (95% CI: 0.816–0.899).
Conclusion: Higher TyG index and TyG-BMI index protected against sarcopenia in non-diabetic middle-aged and older females. Moreover, the TyG-BMI index was a reliable and cost-efficient biomarker to predict sarcopenia.
Sarcopenia is recognized as an important nutritional problem accompanying age-related loss of muscle mass and function that reduces mobility, diminishes quality of life, and can lead to death (1). Estrogen contributes to skeletal muscle health by promoting muscle stem cell proliferation, differentiation, and regeneration (2). Owing to aging and estrogen deficiency, sarcopenia is found to be more prevalent in postmenopausal middle-aged and older women (2). In a population of postmenopausal women, the prevalence of sarcopenia ranges from 10 to 40% (3), undoubtedly increasing the health burden and socioeconomic costs. Sarcopenia has been overlooked in mainstream practice, due to the complexity of determining what variables to measure. Hence, it is critically significant to detect postmenopausal individuals with sarcopenia in advance by a reliable, inexpensive and convenient marker, thus implementing early intervention strategies to lower risk of sarcopenia.
The sarcopenia phenotype has many contributing causes beyond aging. Previous studies reported that insulin resistance (IR) may be contribute to the decline in muscle mass (4), progressively giving rise to sarcopenia. Skeletal muscle is a primary organ for insulin disposal. Insulin plays a major role in boosting muscle protein gain and muscle growth through increasing muscle protein synthesis coupled with inhibiting proteolysis (5). Due to a defect in the insulin signal transduction pathway, the anabolic action of insulin is afflicted, which could result in skeletal muscle loss (5). Moreover, development of IR may induce mitochondrial alterations leading to a reduction in energy production required for muscle contraction (5). Menopause is a natural event for women during their lifespan caused by the cessation of spontaneous menses or ovariectomy with estrogen decreasing and androgen increasing in circulation (6). Several researches have revealed that endogenous estrogens can protect against IR (7, 8). Lower incidence of IR diminishes severely when women reach the postmenopausal situation (9).
Traditional methods for evaluating IR, including hyperinsulinemic-euglycemic clamp and the homeostasis model assessment−estimated insulin resistance (HOMA-IR), are invasive and unavailable in most developing countries, and they may be interfered with by exogenous insulin levels, which limits their applications in clinical practice. The triglyceride-glucose (TyG) index−which formulated by fasting triglycerides and plasm glucose−can accurately assess IR (10) and has been shown to be superior to the HOMA-IR for the identification of several IR related conditions like type 2 diabetes mellitus (T2DM) (11). Obesity, identified by body mass index (BMI), is another principal factor linked to IR. Recently, a combination of TyG and BMI (TyG-BMI) index has been proposed as a reliable and highly sensitive and specific alternative marker of IR (12). Several studies have reported that higher TyG-BMI index is proportionally related to cardiac and cerebrovascular events in the older or female patients (13) and non-alcoholic fatty liver disease incidents in a healthy population (14).
Considering the relationship between IR and low muscle mass, the elevated TyG index and TyG-BMI index may be risk predictors for sarcopenia. However, recent clinical studies reached contradictory results due to different participants. A research based on Korean populations aged ≥ 40 showed that increased TyG index is associated with the risk of low muscle mass (15). A Chinese investigation reported that TyG index was positively correlated with muscle mass in female subjects with T2DM when TyG index was <9 (16). These outcomes suggested that the degree of IR may have different effects on muscle mass. Besides, T2DM is a disorder of glucose metabolism on the basis of severe IR, which may lead to muscle damage beyond IR itself. Moreover, TyG index and TyG-BMI index are not only IR markers, but also indicators of the body’s nutritional status. Hence, further study on the effect of TyG index and TyG-BMI index on muscle mass in the population without significant IR will be helpful for the prevention and management of sarcopenia in clinical practice. To the best of our knowledge, no relevant studies have investigated the association between the TyG index and TyG-BMI index and sarcopenia in non-diabetic Chinese postmenopausal women. Given the important existing gap in this field and its clinical implications, the purpose of the present study was to investigate whether the TyG index and TyG-BMI index are related to sarcopenia and whether they would be suitable for use as indicators of sarcopenia in Chinese non-diabetic postmenopausal women.
This cross-sectional study was conducted in the Department of Endocrinology, Hebei Medical University Third Hospital from 21th August 2021 to 21th September 2023. The minimum sample size of 378 was calculated using t-tests in G*Power statistical analysis software version 3.1.9.7 considering an effect size of 0.5, alpha error probability of 0.05, power of 0.95, and allocation ratio of N2/N1 of 5, having a sample of 63 sarcopenia and 315 non-sarcopenia. A total of 520 subjects were included based on the following criteria: (1) age more than 50 years old and (2) no menstruation for at least 1 year by self-reporting or at least 6 months after bilateral oophorectomy. We excluded 60 participants who could meet the following criteria: (1) diagnosis of diabetes mellitus by doctors (n = 15); (2) chronic liver disease (n = 4) or kidney disease (n = 4) or cancer (n = 2); (3) thyroid disease (n = 10) or taking steroid (n = 5) that could affect muscle metabolism; (4) cognitive impairment or physical dysfunction (n = 2); (5) lack of complete data (n = 18) (Figure 1). Finally, there were total 460 postmenopausal women enrolled in the analysis, of which 73 participants were diagnosed with sarcopenia. None of the study participants used hormone therapy or specific supplements for menopause. The study was carried out in accordance with the Declaration of Helsinki and approved by the Ethics Committee of Hebei Medical University Third Hospital (No. ke2023-080-1 and ke2021-045-1). Written informed consents were signed by all individuals prior to participation.
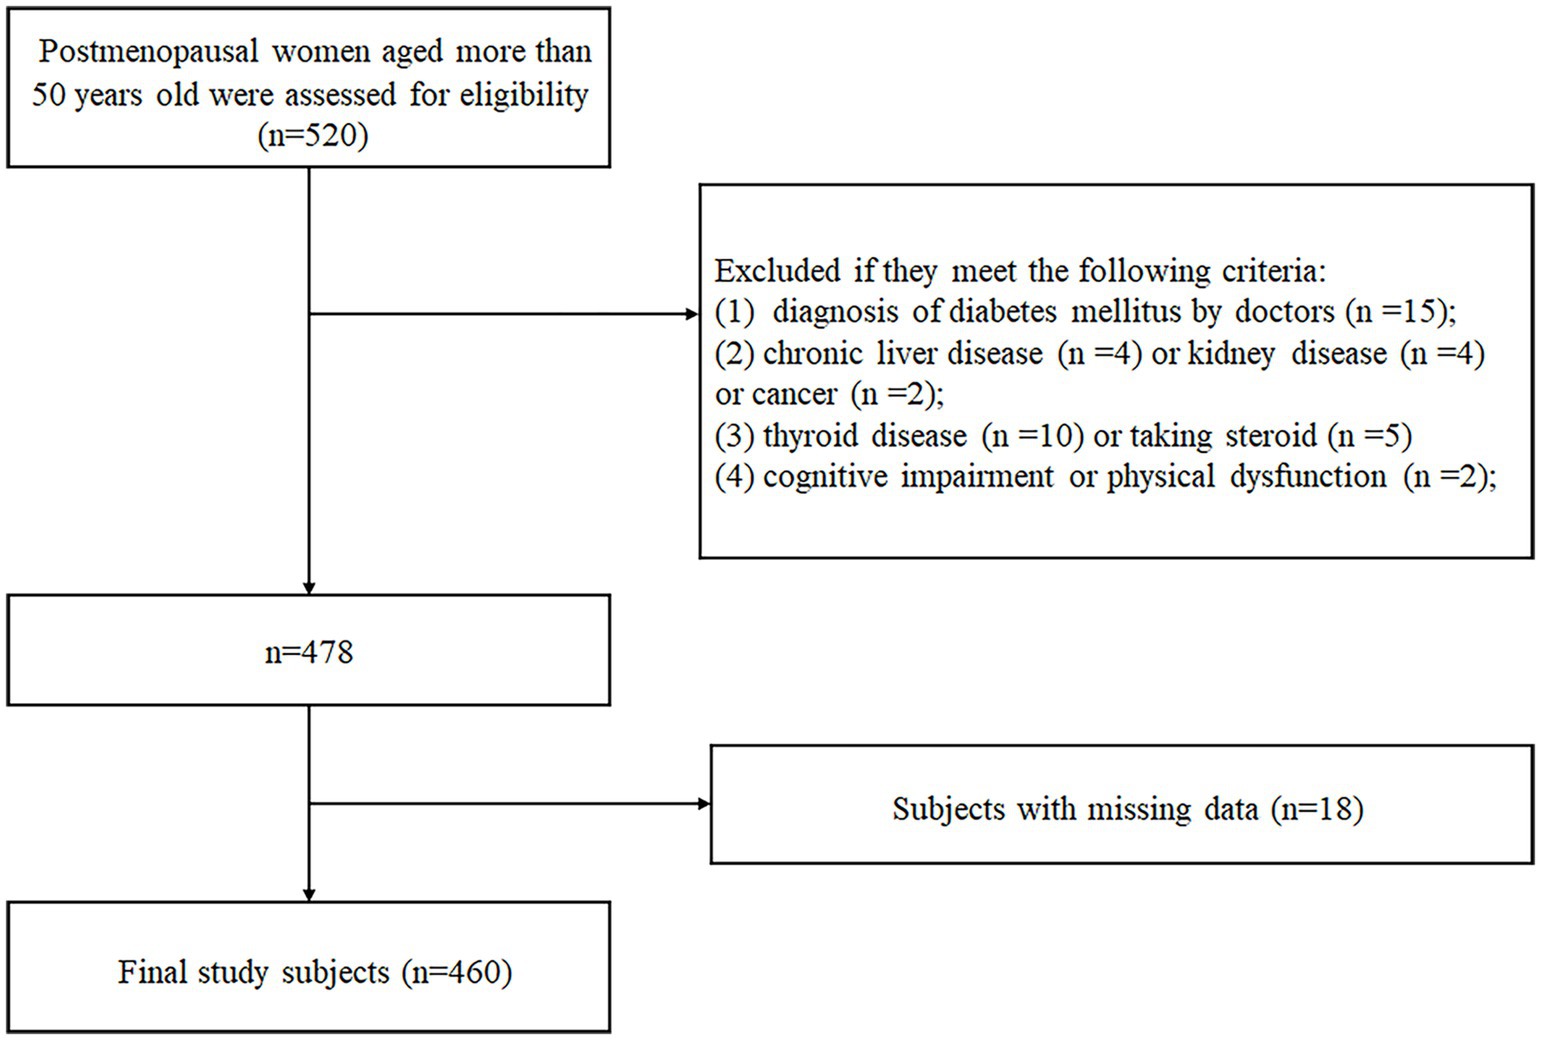
Figure 1. Flow diagram of participant enrollment.
Baseline data including date of birth, menopausal age, height and weight of patients were collected. Total 5 mL fasting blood samples were collected. Levels of fasting plasma glucose (FPG), triglycerides (TG), total cholesterol (TC), low density lipoprotein cholesterol (LDL-C), high density lipoprotein cholesterol (HDL-C), uric acid (UA), creatinine (Cr), alanine aminotransferase (ALT), aspartate aminotransferase (AST) and albumin (ALB) were measured enzymatically by an auto-analyzer (Olympus AU 2700, Japan) in the biochemical laboratory. The TyG index was calculated as ln [triglyceride (mg/dL) × fasting plasma glucose (mg/dL)/2]. BMI was calculated as weight (kg)/height in meters squared (m2). The TyG-BMI index was calculated as TyG × BMI.
Appendicular skeletal muscle mass (ASM) was measured using the Dual-energy X-ray absorptiometry (DXA: Lunar IDXAGE, GE, United States). Relative ASM index (RSMI, ASM/height2) was calculated. Handgrip strength (HS) was determined by a dynamometer (Jamar, United States). Measurements were taken twice and the mean values were calculated. Six meter walking test was completed by measuring the time taken to walk 6-meter at a normal pace from a moving start, without deceleration, and taking the average result of at least 2 trials as the recorded gait speed (GS). Based on the updated consensus by the Asian Working Group for Sarcopenia 2019 (AWGS, 2019) (17), sarcopenia was defined as (1) low muscle mass (RSMI, women: <5.4 kg/m2) plus (2) low muscle strength (HS, women: <18 kg) and/or low physical performance (6 m walking test <1 m/s).
Statistical analysis was performed using SPSS software (version 24) and graphs were performed using GraphPad Prism 8.0 software. The Shapiro–Wilk test was performed to assess the distribution of continuous data. Normally distributed data were presented as mean ± standard deviation (mean ± SD) and compared using independent sample t-test. Non-normally distributed data were expressed as median and inter-quartile range (IQR) and compared using Mann–Whitney U tests to check the differences between groups. Categorical variables were expressed as numbers and percentages and compared using the chi-square test. The participants were divided into four groups based on their TyG and TyG-BMI quartiles in order to assess the independent impact factors of sarcopenia. Univariate and adjusted multivariate logistic regression analyses were performed to investigate the associations between the TyG index and TyG-BMI index and the risk of sarcopenia according to their quartiles, respectively. Receiver operating characteristic (ROC) curve analysis was done to evaluate the diagnostic value of TyG index and TyG-BMI index for sarcopenia. The best cut-off values were calculated using the Youden index, which were calculated according to the corresponding sensitivity, specificity for each index. A two-sided p-value <0.05 was considered statistically significant.
Among the 460 participants, 73 individuals had sarcopenia, whereas other participants did not have sarcopenia. Table 1 shows the baseline characteristics of participants and the differences between the two groups. Compared with non-sarcopenia women, women with sarcopenia were significantly older, had significantly lower level of BMI, RSMI, HS, GS, ALB, UA, FPG, ALT, and higher level of HDL-C (all p < 0.05). Meanwhile, there were no differences in other biochemical parameters including Cr, TC, TG, LDL-C and AST between the two groups (all p > 0.05). Compared with women without sarcopenia, both TyG index and TyG-BMI index were significantly decreased in women with sarcopenia (all p < 0.05).

Table 1. Characteristics of the study participants and differences between women with sarcopenia and non-sarcopenia.
The TyG index and TyG-BMI index were divided into four groups according to quartiles, respectively. As shown in Figure 2, the prevalence of sarcopenia was 20, 17.4, 17.4, and 8.7% in the first, second, third, and fourth quartile of the TyG index, respectively. Meanwhile, the prevalence of sarcopenia was 44.3, 14.8, 3.5, and 0.9% in the first, second, third, and fourth quartile of the TyG-BMI index, respectively. The prevalence of sarcopenia decreased precipitously with increasing quartiles of the TyG-BMI index (p < 0.05).
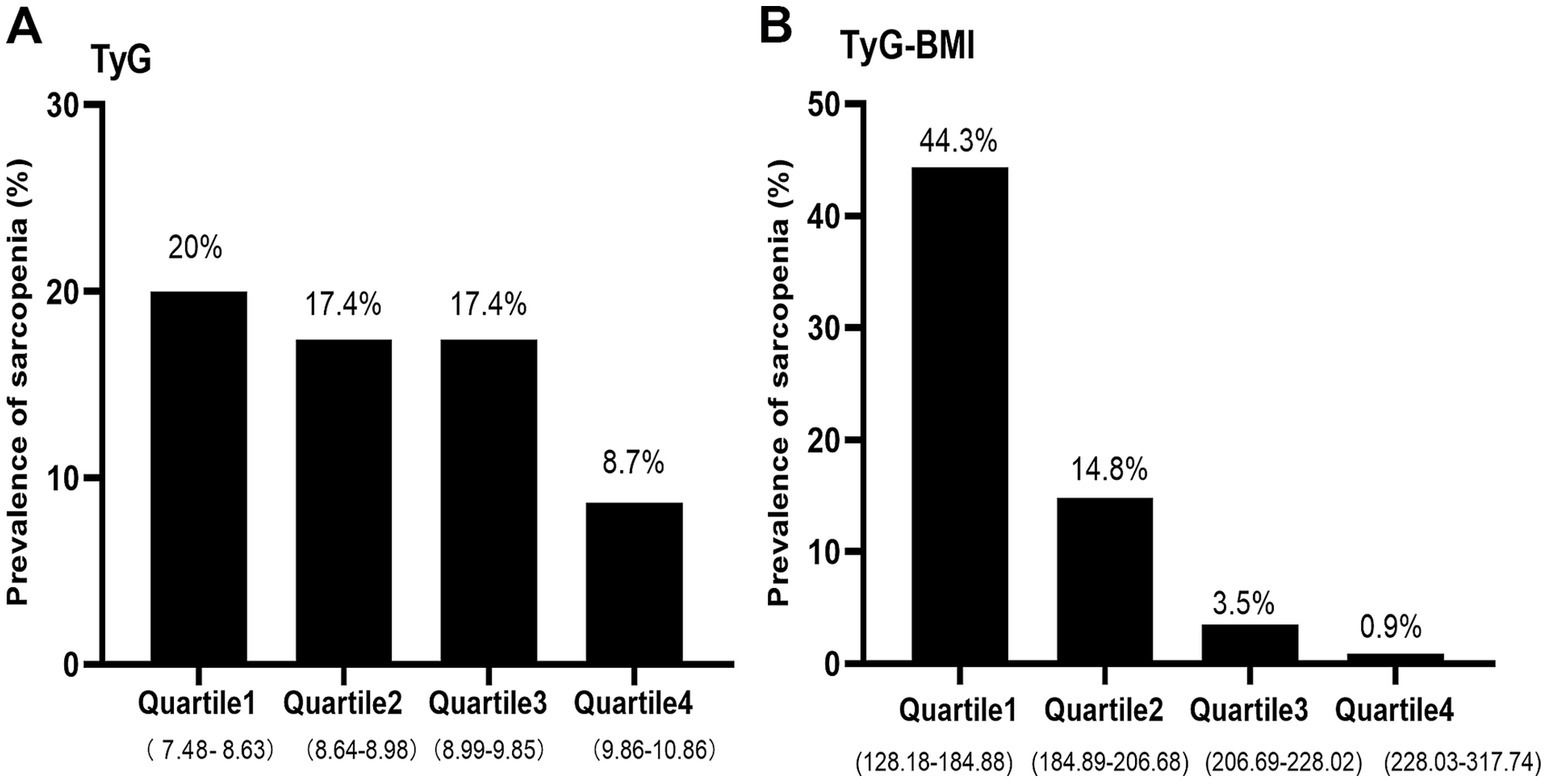
Figure 2. The prevalence of sarcopenia by quartiles of TyG (A) and TyG-BMI (B) index in non-diabetic, postmenopausal women. TyG, triglyceride-glucose; TyG-BMI, triglyceride glucose–body mass index.
Binary logistic regression analysis was done to assess the associations between TyG and TyG-BMI and sarcopenia. As shown in Table 2, in the univariate analysis, the TyG and TyG-BMI index were significantly inversely associated with sarcopenia (odds ratio [OR]: 0.486; 95% confidence interval [CI]: 0.290–0.815; p = 0.006) and (OR: 0.948; 95% CI: 0.935–0.961; p < 0.001) respectively. In multivariate analysis, the TyG and TyG-BMI index were inversely associated with sarcopenia (OR: 0.492; 95% CI: 0.256–0.944; p = 0.033) and (OR: 0.948; 95% CI: 0.934–0.962; p < 0.001) respectively after adjusting for confounding variables including age, ALB, Cr, UA, TC, ALT, and AST. As shown in Table 3, in the unadjusted and fully adjusted models, fourth quartile of TyG-BMI showed significantly decreased OR of 0.011 (95% CI: 0.001–0.082; p < 0.001) and 0.009 (95% CI: 0.001–0.072, p < 0.001) respectively for sarcopenia with respect to its first quartile value. However, there was no significant difference between the quartile 1–4 of TyG index and sarcopenia after rectifying the covariates.
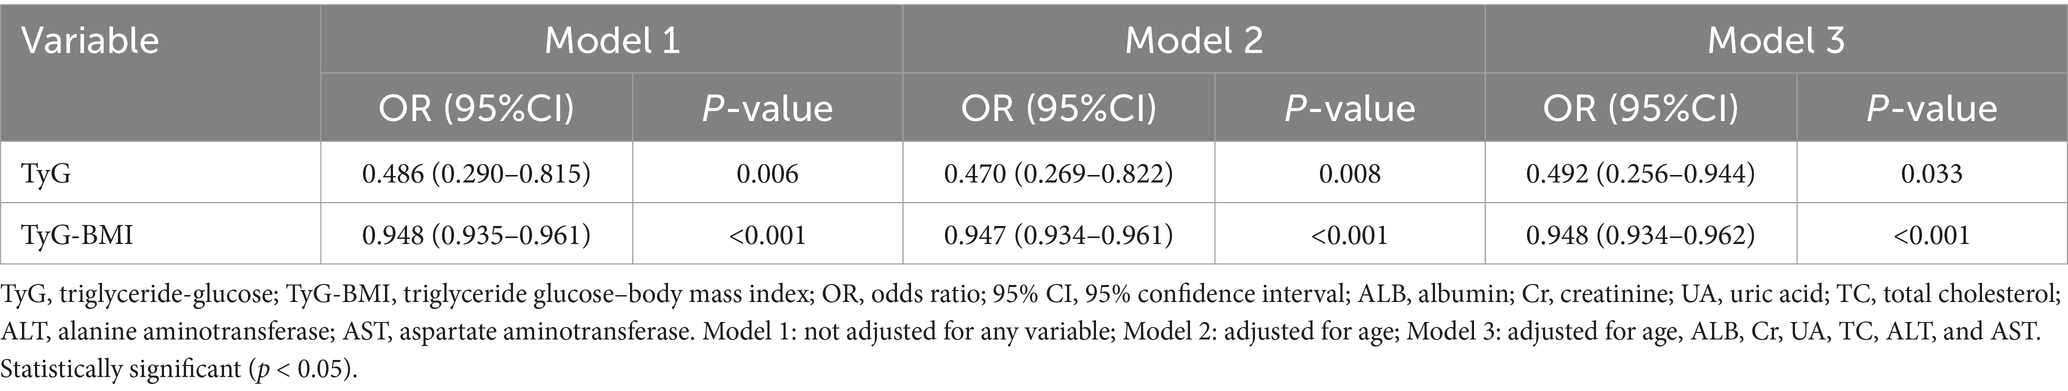
Table 2. Binary logistic regression analysis of the independent factors for sarcopenia (TyG and TyG-BMI as continuous variables).
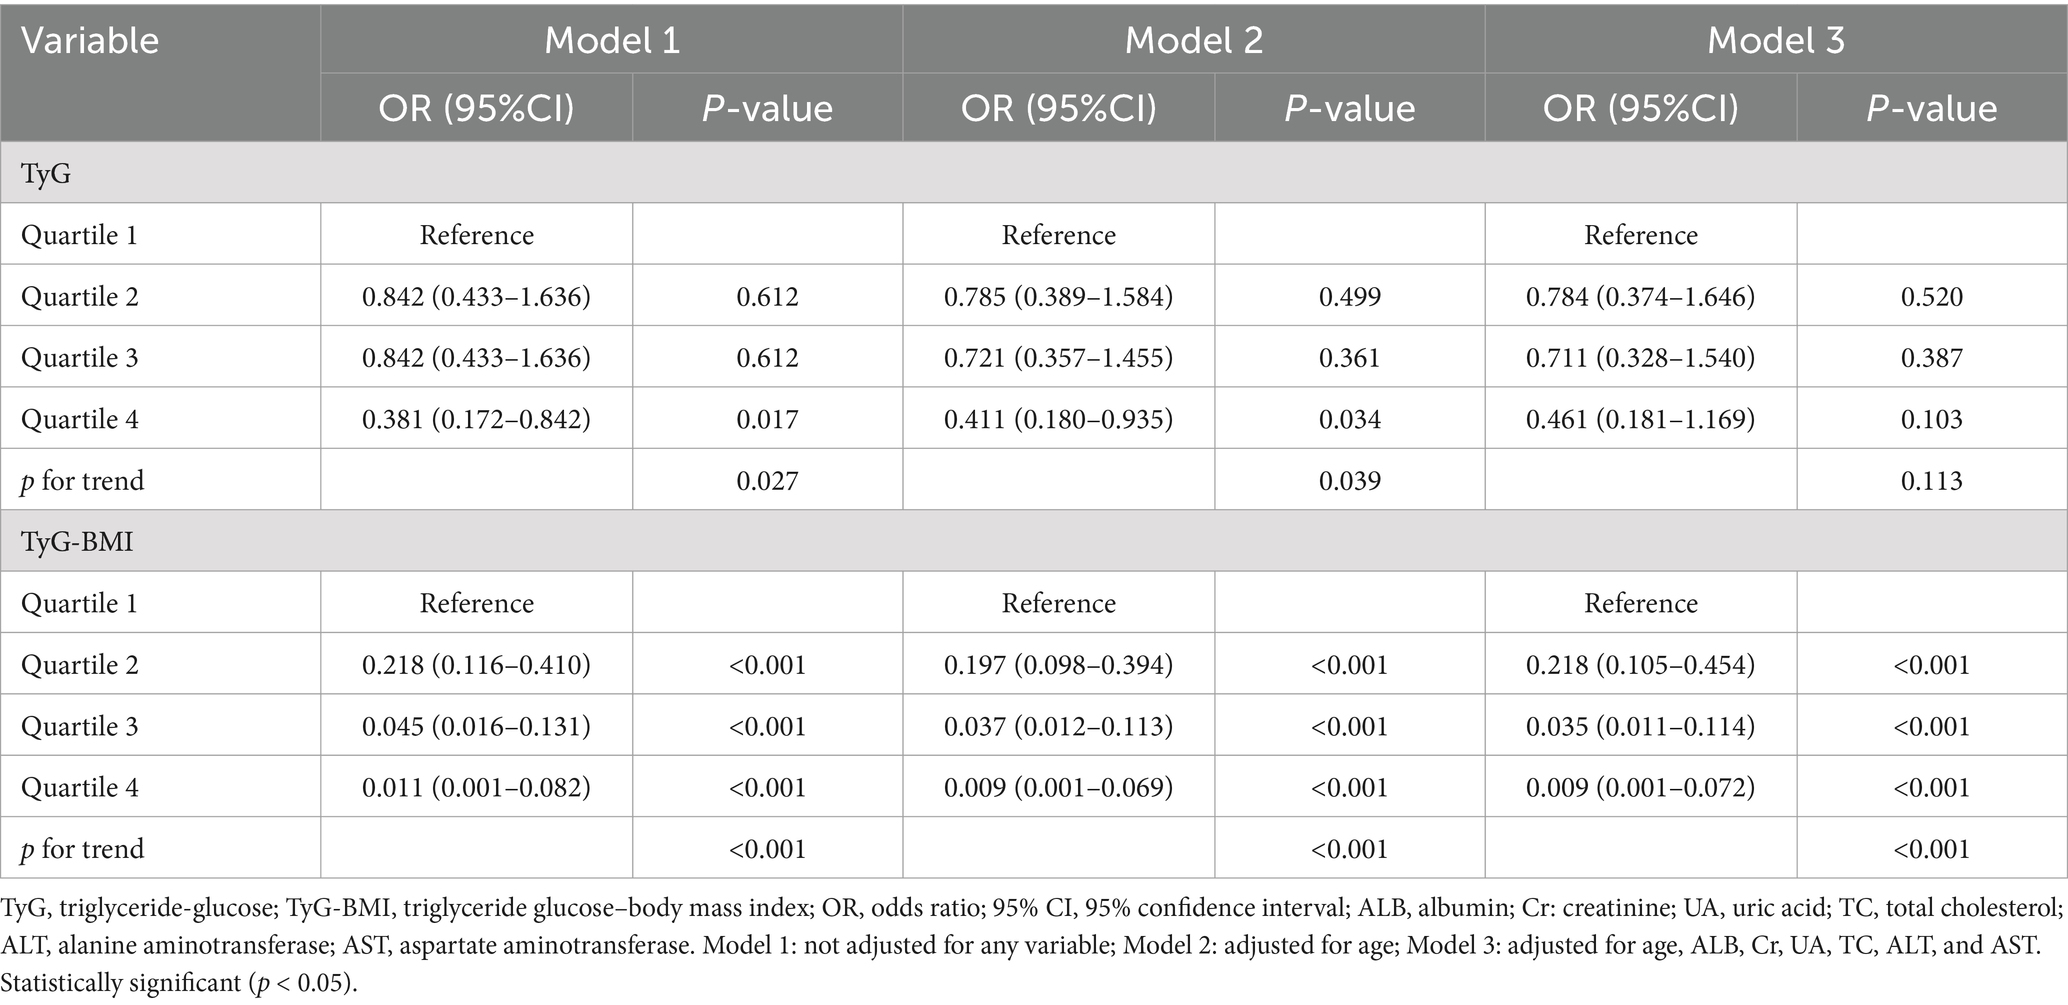
Table 3. Binary logistic regression analysis of the independent factors for sarcopenia (TyG and TyG-BMI as categorical variables).
The ROC curves were performed to check the diagnostic value of TyG index and TyG-BMI index for sarcopenia. The area under the curve (AUC) for TyG index in the diagnosis of sarcopenia was 0.598 (95% CI: 0.529–0.666; p = 0.008), and at a cut-off point set at 8.88, the sensitivity was 84.9% and specificity was 35.9%. The AUC for TyG-BMI index was 0.858 (95% CI: 0.816–0.899; p < 0.001), and at a cut-off point set at 192.92, the sensitivity was 82.2% and specificity was 74.2% (Figure 3).
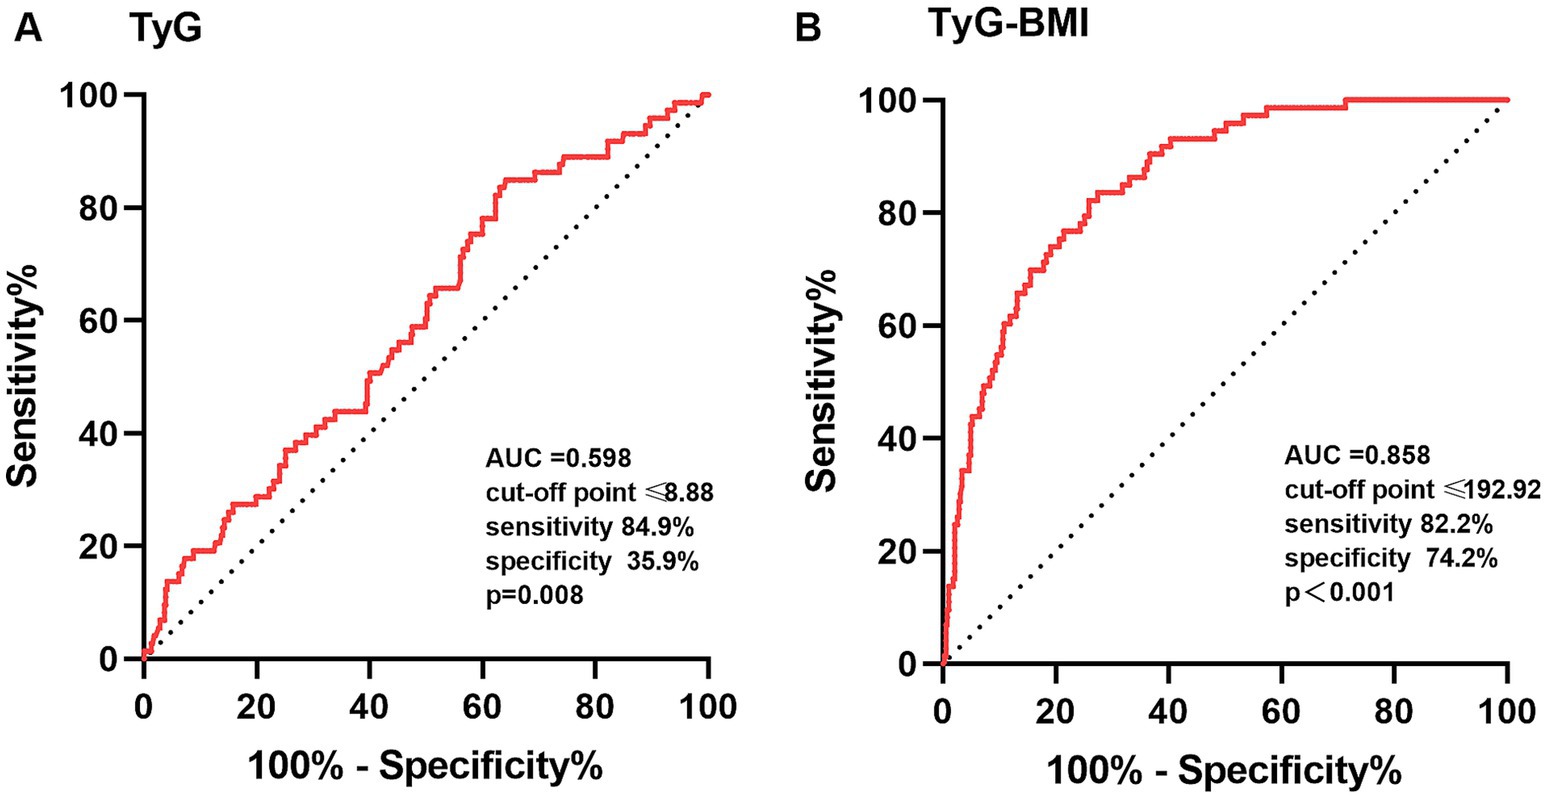
Figure 3. The ROC curves of TyG (A) and TyG-BMI (B) index for the diagnosis of sarcopenia. TyG, triglyceride-glucose; TyG-BMI, triglyceride glucose–body mass index; ROC, receiver operating characteristic; AUC, area under the curve. The comparison of the AUC was performed by a p-value<0.05.
The current study revealed that sarcopenic women had lower levels of ALB, ALT and UA but higher level of HDL-C, which was consistent with some previous results (18–20). Recent studies have suggested that excessively high HDL-C levels may negatively affect the survival of older adults (21, 22). This negative effect may be stronger than the protective effect of normal HDL-C levels (22, 23). UA, an important antioxidant, was positively associated with muscle mass (24), muscle strength (25) and nutrition score (26). ALT, a transaminase enzyme found in the liver and muscle tissue, has been revealed to be positively associated with muscle mass (27) and negatively with sarcopenia (28) and mortality risk (27). ALB is an indicator of protein metabolic balance and nutrient status. In a meta-analysis, low ALB levels were found to be associated with sarcopenia among older individuals (29).
The BMI is a composite index that reflects body composition, including fat, muscle, and bone tissue. The relationship between BMI and skeletal muscle mass has been intensively studied in different populations but results have been inconsistent. Some studies concluded that higher BMI were significantly related to loss of skeletal muscle and sarcopenia (30, 31) due to systemic inflammation and insulin resistance (32). Quite the reverse, other studies showed that higher BMI protected against sarcopenia in older adults (33, 34) and patients with diabetes (35). Zhang et al. (36) conducted a 4 years of follow-up study in older Chinese populations (females with a mean age of 67 ± 6 in baseline) and found that BMI was positively associated with muscle mass and negatively associated with sarcopenia. In agreement with these studies, our study (females with a mean age of 64 ± 7 years) also showed that BMI is remarkably lower in non-diabetic postmenopausal individuals with sarcopenia with respect to non-sarcopenia group. Overweight may be more beneficial than lower level of normal weight in older-old and vulnerable older people (37). Possible mechanism by which obesity protected muscle mass was as follows. Firstly, skeletal muscle stimulation was increased as a higher level of muscle mass was observed in the obese group (33). Over time, there is less loss of muscle mass owing to the greater load required for exercise (33). Secondly, as hormone levels change with aging, the proportion of fat increases in older individuals (33). Adipose tissue is an essential endocrine organ that regulates hormonal levels like estrogen (34), and abdominal fat in women stores high levels of sex hormones and positively affects skeletal muscle mass (33, 34).
The IR was regarded as a prominent risk factor for sarcopenia or low muscle mass (4, 38). The TyG index is determined as a convenient, cost-effective and reliable indicator for identifying individuals with IR and metabolic syndrome (MetS) in the general population. Higher TyG index has been recently revealed as a potential marker with sarcopenia and low muscle mass in particular individuals (15, 39). TyG-BMI index, which combines serum triglycerides, fasting plasma glucose, and obesity status, is considered more reliable than TyG index for the identification of IR (12). We conducted the study to investigate the association of TyG and TyG-BMI index with muscle mass and sarcopenia in non-diabetic, postmenopausal individuals. Contrary to some previous studies, the present study demonstrated that the TyG index and TyG-BMI index were positively associated with RSMI, and negatively associated with risk of sarcopenia. Similar findings have also been described by Kim et al. (11), in which increased TyG index and BMI were inversely correlated with the incidence of sarcopenia. Nevertheless, the AUCs of TyG index yielded by the ROC curve analysis were only 0.598 for females, which limits its value for early detection of sarcopenia in clinical applications. TyG-BMI index, which incorporates TyG and BMI, appear to be a more useful predictor of sarcopenia than single TyG index for postmenopausal women, with AUC of 0.858.
One explanation was that there was a threshold or saturation effect for TyG index or TyG-BMI index as an indicator of IR. Currently, it was thought that the TyG index ≥8.7 may indicate the presence of IR, regardless of age and sex. Lee et al. reported that non-diabetic and normal weight Korea women with the TyG index ≥8.73 was at a higher risk of metabolic syndrome (40). Similarly, Li et al. (41) reported that the TyG index ≥8.7 was associated with metabolic syndrome in middle-aged and older Chinese, which implied that values above this range were connected with IR. Zhu et al. (42) reported that the TyG index >8.73 and the TyG-BMI index >222.45, respectively, was associated with poor glycemic control in Chinese older individuals with T2DM, which also suggested that it might be related to the development of IR. In our study, the major values of TyG index and TyG-BMI index were less than 8.7 and 222 respectively, which did not meet the threshold for IR. Consist with our results, Hu et al. (16) found that TyG index was positively correlated with SMI in female subjects when the TyG index was <9.
TyG-BMI index—which incorporates fasting blood glucose, serum triglyceride levels and BMI—is also a nutritional indicator within a certain threshold in addition to indicating IR. Nutritional supplementation is required to maintain or improve muscle quality and muscle strength. The present study found that women with sarcopenia showed lower TG than women with non-sarcopenia, however, the difference was not statistically significant. Similar result was found by Yin et al. (19) and Hu et al. (16). Several follow-up studies in Chinese older adults found decreased TG level seem to be associated with increased all-cause mortality risk, which suggests the clinical importance of revisiting the concept of “the lower the better” for the oldest old (23, 43). Lower TG values may be a consequence of poor health status associated with sarcopenia (18). In addition, our investigation also revealed that women with sarcopenia showed dramatically decreased FPG level compared with non-sarcopenia group. Previous study reported that higher glycemic values (glycosylated hemoglobin Alc, HbA1c ≥ 8.5%) in older patients with diabetes were associated with lower muscle mass and muscle quality (44). However, no correlation was found between hyperglycemia and muscle loss in diabetic patients with a mean HbA1c value of 7.0% (45). This discrepancy may be owing to different TG and glycemic concentrations in the study population. Hyperlipidemia and hyperglycemia are widely recognized as risk factors for sarcopenia, nonetheless, the levels of lipid and glucose in our study population are in the normal range. There were no glucotoxic or lipotoxic effects exist but the nutritive supportive effects on muscle synthesis by proper glucose and lipid control.
A relatively higher TyG index is usually accompanied by higher insulin level. Insulin has anabolic effects on muscle mass and protein metabolism in non-insulin resistant men and women (46). In situations where amino acids (AAs) delivery is unchanged, supraphysiological concentrations of insulin are needed to achieve skeletal muscle anabolism (47). Meanwhile, insulin also plays a clear role in reducing muscle protein breakdown independent of AA availability (47). In a cross-sectional study of older Chinese females aged over 50 years, lower-insulin was associated with sarcopenia and risk factors for low muscle mass (19). Sugimoto et al. (48) and Bouchi et al. (49) have also reported that the insulin treatment could improve muscle mass and gait speed and attenuate the progression of sarcopenia in T2DM. All of these results suggested that insulin at the upper limit of the normal range was necessary to maintain muscle mass and function.
In brief, our findings suggested that reasonable weight management should be promoted to guard against muscle damage caused by low body weight in non-diabetic postmenopausal women without apparent IR. Moreover, the risk of sarcopenia caused by hypolipidemia should be considered in patients who require long-term use of lipid-lowering agents. This study provided evidence to support the prevention and treatment of sarcopenia in non-diabetic postmenopausal women.
There were both strengths and limitations to the current study. To our knowledge, this is the first study to investigate the relationship between TyG index and TyG-BMI index and sarcopenia in Chinese non-diabetic, postmenopausal women. However, this study had some limitations. First, it was a cross-sectional design, which need future longitudinal studies to conclude the cause-and-effect relationship. Second, as a one-center study with a relatively small sample size conducted in Chinese middle-aged and older females, it is unclear whether the findings are applicable to individuals of other ethnicities or in other countries. Therefore, multi-center and multi-ethnic studies with larger sample sizes should be performed to validate conclusions’ reproducibility. Third, some potential covariates, such as dietary intake and supplements, were not examined. The influence of potential unmeasured confounders on the effect of the study indicators on sarcopenia risk needs to be investigated in future studies.
This cross-sectional study confirmed that there seemed no obvious IR existed in non-diabetic Chinese postmenopausal women. As nutritional indicators, higher TyG index and TyG-BMI index protected against sarcopenia in non-diabetic middle-aged and older females without IR status. Moreover, the TyG-BMI index, with both sensitivity and specificity, was a simple, robust surrogate and cost-efficient biomarker to predict the risk of sarcopenia in non-diabetic Chinese middle-aged and older women. In addition, the current study revealed that sarcopenic individuals had lower values of BMI, ALB, TG, FPG, ALT, and UA, that is to say, individuals with sarcopenia had relative malnutrition. Given this, it may be pertinent to clinically assess nutritional status in older individuals who are at risk for sarcopenia, so as to provide adequate nutritional profile to preserve muscle mass and physical function.
The raw data supporting the conclusions of this article will be made available by the authors, without undue reservation.
The studies involving humans were approved by The Ethics Committee of Hebei Medical University Third Hospital (No. ke2023-080-1 and ke2021-045-1). The studies were conducted in accordance with the local legislation and institutional requirements. The participants provided their written informed consent to participate in this study.
ML: Conceptualization, Formal analysis, Investigation, Methodology, Writing – original draft. YL: Investigation, Writing – original draft. LG: Investigation, Methodology, Writing – original draft. YZ: Formal analysis, Writing – original draft. LC: Formal analysis, Writing – original draft. YW: Conceptualization, Methodology, Writing – review & editing. WZ: Conceptualization, Writing – review & editing.
The author(s) declare that financial support was received for the research, authorship, and/or publication of this article. This study was funded by Medical Applicable Technology Tracking Project of Hebei Province (Grant no. GZ2023047) and Government-funded Clinical Medical Outstanding Talent Project (Grant no. ZF2023102).
We thank all of the individuals for their agreement to participate in this study.
The authors declare that the research was conducted in the absence of any commercial or financial relationships that could be construed as a potential conflict of interest.
All claims expressed in this article are solely those of the authors and do not necessarily represent those of their affiliated organizations, or those of the publisher, the editors and the reviewers. Any product that may be evaluated in this article, or claim that may be made by its manufacturer, is not guaranteed or endorsed by the publisher.
1. Cruz-Jentoft, AJ, and Sayer, AA. Sarcopenia. Lancet. (2019) 393:2636–46. doi: 10.1016/S0140-6736(19)31138-9
2. Lu, L, and Tian, L. Postmenopausal osteoporosis coexisting with sarcopenia: the role and mechanisms of estrogen. J Endocrinol. (2023) 259:e230116. doi: 10.1530/joe-23-0116
3. Maghbooli, Z, Mozaffari, S, Dehhaghi, Y, Rezaei Amirkiasar, P, Malekhosseini, AA, Rezanejad, M, et al. The lower basal metabolic rate is associated with increased risk of osteosarcopenia in postmenopausal women. BMC Womens Health. (2022) 22:171. doi: 10.1186/s12905-022-01754-6
4. Srikanthan, P, and Karlamangla, AS. Relative muscle mass is inversely associated with insulin resistance and prediabetes. Findings from the third National Health and nutrition examination survey. J Clin Endocrinol Metab. (2011) 96:2898–903. doi: 10.1210/jc.2011-0435
5. Guillet, C, and Boirie, Y. Insulin resistance: a contributing factor to age-related muscle mass loss? Diabetes Metab. (2005) 31:5S20–6. doi: 10.1016/s1262-3636(05)73648-x
6. Liang, H, Qi, W, Jiajue, R, Chi, Y, Liu, W, Wang, O, et al. Serum Irisin level is associated with fall risk, muscle strength, and cortical porosity in postmenopausal women. Front Endocrinol. (2023) 14:1096950. doi: 10.3389/fendo.2023.1096950
7. Zidon, TM, Padilla, J, Fritsche, KL, Welly, RJ, McCabe, LT, Stricklin, OE, et al. Effects of ERβ and ERα on OVX-induced changes in adiposity and insulin resistance. J Endocrinol. (2020) 245:165–78. doi: 10.1530/JOE-19-0321
8. Ikeda, KH-IK, and Inoue, S. Functions of estrogen and estrogen receptor signaling on skeletal muscle. J Steroid Biochem Mol Biol. (2019) 191:105375. doi: 10.1016/j.jsbmb.2019.105375
9. Tramunt, B, Smati, S, Grandgeorge, N, Lenfant, F, Arnal, JF, Montagner, A, et al. Sex differences in metabolic regulation and diabetes susceptibility. Diabetologia. (2020) 63:453–61. doi: 10.1007/s00125-019-05040-3
10. Yu, X, Wang, L, Zhang, W, Ming, J, Jia, A, Xu, S, et al. Fasting triglycerides and glucose index is more suitable for the identification of metabolically unhealthy individuals in the Chinese adult population: a nationwide study. J Diabetes Investig. (2018) 10:1050–8. doi: 10.1111/jdi.12975
11. Kim, B, Kim, G, Lee, Y, Taniguchi, K, Isobe, T, and Oh, S. Triglyceride-glucose index as a potential Indicator of Sarcopenic obesity in older people. Nutrients. (2023) 15:555. doi: 10.3390/nu15030555
12. Wen, Z, Li, Y, Xu, L, Yue, C, Wang, Q, Chen, R, et al. Triglyceride glucose-body mass index is a reliable Indicator of bone mineral density and risk of osteoporotic fracture in middle-aged and elderly nondiabetic Chinese individuals. J Clin Med. (2022) 11:5694. doi: 10.3390/jcm11195694
13. Cheng, Y, Fang, Z, Zhang, X, Wen, Y, Lu, J, He, S, et al. Association between triglyceride glucose-body mass index and cardiovascular outcomes in patients undergoing percutaneous coronary intervention: a retrospective study. Cardiovasc Diabetol. (2023) 22:75. doi: 10.1186/s12933-023-01794-8
14. Kitae, A, Hashimoto, Y, Hamaguchi, M, Obora, A, Kojima, T, and Fukui, M. The triglyceride and glucose index is a predictor of incident nonalcoholic fatty liver disease: a population-based cohort study. Can J Gastroenterol Hepatol. (2019) 2019:5121574–7. doi: 10.1155/2019/5121574
15. Kim, JA, Hwang, SY, Yu, JH, Roh, E, Hong, SH, Lee, YB, et al. Association of the triglyceride and glucose index with low muscle mass: KNHANES 2008–2011. Sci Rep. (2021) 11:450. doi: 10.1038/s41598-020-80305-1
16. Hu, W, Ma, Y, and Xing, D. Association of triglyceride-glucose index and the presence of low muscle mass in type 2 diabetes patients. Clin Exp Med. (2023) 23:943–9. doi: 10.1007/s10238-022-00834-z
17. Chen, LK, Woo, J, Assantachai, P, Auyeung, TW, Chou, MY, Iijima, K, et al. Asian working Group for Sarcopenia: 2019 consensus update on sarcopenia diagnosis and treatment. J Am Med Dir Assoc. (2020) 21:300–307.e2. doi: 10.1016/j.jamda.2019.12.012
18. He, Y, Ding, F, Yin, M, Zhang, H, Hou, L, Cui, T, et al. High serum AST/ALT ratio and low serum INS*PA product are risk factors and Can diagnose sarcopenia in middle-aged and older adults. Front Endocrinol. (2022) 13:843610. doi: 10.3389/fendo.2022.843610
19. Yin, M, Zhang, H, Liu, Q, Ding, F, Hou, L, Deng, Y, et al. Determination of skeletal muscle mass by aspartate aminotransferase/alanine aminotransferase ratio, insulin and FSH in Chinese women with sarcopenia. BMC Geriatr. (2022) 22:893. doi: 10.1186/s12877-022-03491-9
20. Can, B, Kara, O, Kizilarslanoglu, MC, Arik, G, Aycicek, GS, Sumer, F, et al. Serum markers of inflammation and oxidative stress in sarcopenia. Aging Clin Exp Res. (2017) 29:745–52. doi: 10.1007/s40520-016-0626-2
21. Zhong, GC, Huang, SQ, Peng, Y, Wan, L, Wu, YQ, Hu, TY, et al. HDL-C is associated with mortality from all causes, cardiovascular disease and cancer in a J-shaped dose-response fashion: a pooled analysis of 37 prospective cohort studies. Eur J Prev Cardiol. (2020) 27:1187–203. doi: 10.1177/2047487320914756
22. Li, ZH, Lv, YB, Zhong, WF, Gao, X, Byers Kraus, V, Zou, MC, et al. High-density lipoprotein cholesterol and all-cause and cause-specific mortality among the elderly. J Clin Endocrinol Metab. (2019) 104:3370–8. doi: 10.1210/jc.2018-02511
23. Wang, R, Yu, X, Wang, Z, Liu, Y, Chen, H, Liu, S, et al. Blood lipid levels and all-cause mortality in older adults: the Chinese longitudinal healthy longevity survey 2008-2018. Epidemiol Health. (2022) 44:e2022054. doi: 10.4178/epih.e2022054
24. Oncel Yoruk, E, Dost, FS, Ontan, MS, Ates Bulut, E, Aydin, AE, and Isik, AT. Hyperuricemia may be associated with muscle wellness in older adults. Int Urol Nephrol. (2023) 55:2981–8. doi: 10.1007/s11255-023-03588-z
25. Nehme, R, Nahas, PC, and de Oliveira, EP. Association between serum uric acid and muscle strength in older adults with or without gout diagnosis: NHANES 2011-2014. Aging Clin Exp Res. (2023) 35:1967–72. doi: 10.1007/s40520-023-02462-3
26. Kalantar-Zadeh, K, Kopple, JD, Humphreys, MH, and Block, G. Comparing outcome predictability of markers of malnutrition-inflammation complex syndrome in haemodialysis patients. Nephrol Dial Transplant. (2004) 19:1507–19. doi: 10.1093/ndt/gfh143
27. Ruhl, CE, and Everhart, JE. The association of low serum alanine aminotransferase activity with mortality in the US population. Am J Epidemiol. (2013) 178:1702–11. doi: 10.1093/aje/kwt209
28. Vespasiani-Gentilucci, U, De Vincentis, A, Ferrucci, L, Bandinelli, S, Antonelli Incalzi, R, and Picardi, A. Low alanine aminotransferase levels in the elderly population: frailty, disability, sarcopenia, and reduced survival. J Gerontol A Biol Sci Med Sci. (2018) 73:925–30. doi: 10.1093/gerona/glx126
29. Silva-Fhon, JR, Rojas-Huayta, VM, Aparco-Balboa, JP, Cespedes-Panduro, B, and Partezani-Rodrigues, RA. Sarcopenia and blood albumin: a systematic review with meta-analysis. Biomedica. (2021) 41:590–603. doi: 10.7705/biomedica.5765
30. Du, Y, Oh, C, and No, J. Associations between sarcopenia and metabolic risk factors: a systematic review and Meta-analysis. J Obes Metab Syndr. (2018) 27:175–85. doi: 10.7570/jomes.2018.27.3.175
31. Murai, J, Nishizawa, H, Otsuka, A, Fukuda, S, Tanaka, Y, Nagao, H, et al. Low muscle quality in Japanese type 2 diabetic patients with visceral fat accumulation. Cardiovasc Diabetol. (2018) 17:112. doi: 10.1186/s12933-018-0755-3
32. Li, C, Kang, B, Zhang, T, Gu, H, Man, Q, Song, P, et al. High visceral fat area attenuated the negative association between high body mass index and sarcopenia in community-dwelling older Chinese people. Healthcare. (2020) 8:479. doi: 10.3390/healthcare8040479
33. Yoo, MC, Won, CW, and Soh, Y. Association of high body mass index, waist circumference, and body fat percentage with sarcopenia in older women. BMC Geriatr. (2022) 22:937. doi: 10.1186/s12877-022-03643-x
34. Liu, C, Cheng, KY, Tong, X, Cheung, WH, Chow, SK, Law, SW, et al. The role of obesity in sarcopenia and the optimal body composition to prevent against sarcopenia and obesity. Front Endocrinol. (2023) 14:1077255. doi: 10.3389/fendo.2023.1077255
35. Nakanishi, S, Iwamoto, M, Shinohara, H, Iwamoto, H, and Kaneto, H. Significance of body mass index for diagnosing sarcopenia is equivalent to slow gait speed in Japanese individuals with type 2 diabetes: cross-sectional study using outpatient clinical data. J Diabetes Investig. (2020) 12:417–24. doi: 10.1111/jdi.13366
36. Zhang, Y, Chen, X, Hou, L, Lin, X, Qin, D, Wang, H, et al. Prevalence and risk factors governing the loss of muscle function in elderly sarcopenia patients: a longitudinal study in China with 4 years of follow-up. J Nutr Health Aging. (2020) 24:518–24. doi: 10.1007/s12603-020-1361-0
37. Kuzuya, M. Nutritional status related to poor health outcomes in older people: which is better, obese or lean? Geriatr Gerontol Int. (2021) 21:5–13. doi: 10.1111/ggi.14088
38. Park, JH, Lee, MY, Shin, HK, Yoon, KJ, Lee, J, and Park, JH. Lower skeletal muscle mass is associated with diabetes and insulin resistance: a cross-sectional study. Diabetes Metab Res Rev. (2023) 39:e3681. doi: 10.1002/dmrr.3681
39. Chen, R, Zhang, L, Zhang, M, Wang, Y, Liu, D, Li, Z, et al. The triglyceride-glucose index as a novel marker associated with sarcopenia in non-diabetic patients on maintenance hemodialysis. Ren Fail. (2022) 44:1616–22. doi: 10.1080/0886022X.2022.2128373
40. Lee, SH, Han, K, Yang, HK, Kim, HS, Cho, JH, Kwon, HS, et al. A novel criterion for identifying metabolically obese but normal weight individuals using the product of triglycerides and glucose. Nutr Diabetes. (2015) 5:e149. doi: 10.1038/nutd.2014.46
41. Li, R, Li, Q, Cui, M, Yin, Z, Li, L, Zhong, T, et al. Clinical surrogate markers for predicting metabolic syndrome in middle-aged and elderly Chinese. J Diabetes Investig. (2018) 9:411–8. doi: 10.1111/jdi.12708
42. Zhu, HT, Yu, M, Hu, H, He, QF, Pan, J, and Hu, RY. Factors associated with glycemic control in community-dwelling elderly individuals with type 2 diabetes mellitus in Zhejiang, China: a cross-sectional study. BMC Endocr Disord. (2019) 19:57. doi: 10.1186/s12902-019-0384-1
43. Lv, YB, Mao, C, Gao, X, Yin, ZX, Kraus, VB, Yuan, JQ, et al. Triglycerides paradox among the oldest old: “the lower the better?”. J Am Geriatr Soc. (2019) 67:741–8. doi: 10.1111/jgs.15733
44. Yoon, JW, Ha, YC, Kim, KM, Moon, JH, Choi, SH, Lim, S, et al. Hyperglycemia is associated with impaired muscle quality in older men with diabetes: the Korean longitudinal study on health and aging. Diabetes Metab J. (2016) 40:140–6. doi: 10.4093/dmj.2016.40.2.140
45. Fukuoka, Y, Narita, T, Fujita, H, Morii, T, Sato, T, Sassa, MH, et al. Importance of physical evaluation using skeletal muscle mass index and body fat percentage to prevent sarcopenia in elderly Japanese diabetes patients. J Diabetes Investig. (2019) 10:322–30. doi: 10.1111/jdi.12908
46. Mesinovic, J, Zengin, A, De Courten, B, Ebeling, PR, and Scott, D. Sarcopenia and type 2 diabetes mellitus: a bidirectional relationship. Diabetes Metab Syndr Obes. (2019) 12:1057–72. doi: 10.2147/DMSO.S186600
47. Abdulla, H, Smith, K, Atherton, PJ, and Idris, I. Role of insulin in the regulation of human skeletal muscle protein synthesis and breakdown: a systematic review and meta-analysis. Diabetologia. (2016) 59:44–55. doi: 10.1007/s00125-015-3751-0
48. Sugimoto, K, Ikegami, H, Takata, Y, Katsuya, T, Fukuda, M, Akasaka, H, et al. Glycemic control and insulin improve muscle mass and gait speed in type 2 diabetes: the MUSCLES-DM study. J Am Med Dir Assoc. (2021) 22:e1:834–838.e1. doi: 10.1016/j.jamda.2020.11.003
Keywords: sarcopenia, triglyceride-glucose index, triglyceride glucose-body mass index, insulin resistance, middle-aged and older non-diabetic women
Citation: Li M, Liu Y, Gao L, Zheng Y, Chen L, Wang Y and Zhang W (2025) Higher triglyceride-glucose index and triglyceride glucose-body mass index protect against sarcopenia in Chinese middle-aged and older non-diabetic women: a cross-sectional study. Front. Public Health. 12:1475330. doi: 10.3389/fpubh.2024.1475330
Edited by:
Diogo Luís Marques, University of Beira Interior, PortugalCopyright © 2025 Li, Liu, Gao, Zheng, Chen, Wang and Zhang. This is an open-access article distributed under the terms of the Creative Commons Attribution License (CC BY). The use, distribution or reproduction in other forums is permitted, provided the original author(s) and the copyright owner(s) are credited and that the original publication in this journal is cited, in accordance with accepted academic practice. No use, distribution or reproduction is permitted which does not comply with these terms.
*Correspondence: Yan Wang, d2FuZ3lhbjY2MjAwQDE2My5jb20=
Disclaimer: All claims expressed in this article are solely those of the authors and do not necessarily represent those of their affiliated organizations, or those of the publisher, the editors and the reviewers. Any product that may be evaluated in this article or claim that may be made by its manufacturer is not guaranteed or endorsed by the publisher.
Research integrity at Frontiers
Learn more about the work of our research integrity team to safeguard the quality of each article we publish.