 Guojun Huang
 Zuhui Xu3
- 1Chinese Center for Disease Control and Prevention, Beijing, China
- 2Department of Science and Education, Hunan Chest Hospital, Changsha, China
- 3Department of Tuberculosis Control and Prevention, Hunan Chest Hospital, Changsha, China
- 4Hunan Chest Hospital, Changsha, China
Background: Pulmonary tuberculosis (PTB) is a major infectious disease that threatens human health. China is a high tuberculosis-burden country and the Hunan Province has a high tuberculosis notification rate. However, no comprehensive analysis has been conducted on the spatiotemporal distribution of PTB in the Hunan Province. Therefore, this study investigated the spatiotemporal distribution of PTB in the Hunan Province to enable targeted control policies for tuberculosis.
Methods: We obtained data about cases of PTB in the Hunan Province notified from January 2014 to December 2022 from the China Information System for Disease Control and Prevention. Time-series analysis was conducted to analyze the trends in PTB case notifications. Spatial autocorrelation analysis was conducted to detect the spatial distribution characteristics of PTB at a county level in Hunan Province. Space-time scan analysis was conducted to confirm specific times and locations of PTB clustering.
Results: A total of 472,826 new cases of PTB were notified in the Hunan Province during the 9-year study period. The mean PTB notification rate showed a gradual, fluctuating downward trend over time. The number of PTB notifications per month showed significant seasonal variation, with an annual peak in notifications in January or March, followed by a fluctuating decline after March, reaching a trough in November or December. Moran’s I index of spatial autocorrelation revealed that the notification rate of PTB by county ranged from 0.117 to 0.317 during the study period, indicating spatial clustering. The hotspot areas of PTB were mainly concentrated in the Xiangxi Autonomous Prefecture, Zhangjiajie City, and Hengyang City. The most likely clustering region was identified in the central-southern part of the province, and a secondary clustering region was identified in the northwest part of the province.
Conclusion: This study identified the temporal trend and spatial distribution pattern of tuberculosis in the Hunan Province. PTB clustered mainly in the central-southern and northwestern regions of the province. Disease control programs should focus on strengthening tuberculosis control in these regions.
1 Introduction
Pulmonary tuberculosis (PTB) is a major infectious disease that seriously threatens human health. According to the WHO Global Tuberculosis Report 2023 (1), an estimated 10.6 million new cases of PTB occurred globally in 2022, with 1.3 million deaths. PTB remains an important public health problem. After decades of efforts, the incidence of tuberculosis has gradually declined in China. However, the incidence of tuberculosis within the country varies by region, with some areas still experiencing major outbreaks (2, 3). The Hunan Province, located in central-southern China, has reported high numbers of cases and PTB notification rates. In 2022, 43,976 new PTB cases were notified, with a notification rate of 66.40/100,000, which was higher than the national average. Therefore, more effective control strategies are urgently needed to curb the spread of tuberculosis in the Hunan Province.
Spatiotemporal analysis methods have been used extensively to investigate the distribution and variation patterns of PTB in recent years. Studies have been conducted in several countries, including Russia (4), Brazil (5, 6), Uganda (7), and Peru (8). In China, researchers such as Zhang et al. (9) have studied the spatiotemporal distribution characteristics of tuberculosis at a provincial level, whereas others such as Liu et al. (3) have conducted similar analyses at a prefecture level. Studies of the spatiotemporal distribution of tuberculosis have been conducted in Beijing (10), Zhejiang (11, 12), Chongqing (13), and Qinghai (14) Provinces. In the Hunan Province, Alene et al. (15) examined spatiotemporal distribution patterns, and Zheng et al. (16) investigated the spatial clustering and hotspot areas of smear-positive PTB notifications in the Hunan Province in 2012 and 2013. However, to our knowledge, no comprehensive analysis has been conducted on the spatiotemporal distribution of PTB in the whole of the Hunan Province. The current spatiotemporal distribution and trends in the spatiotemporal distribution of PTB in the Hunan Province remain unclear and warrant further investigation.
This study aimed to analyze the temporal distribution characteristics of tuberculosis in the Hunan Province, examining the clustering of PTB notifications at a county level to identify hotspot and cold-spot areas of incidence. Through spatiotemporal scanning analysis, this study aimed to pinpoint specific locations of tuberculosis incidence clustering and assess the magnitude of disease risk in these clusters. By identifying the key regions of PTB incidence in the Hunan Province, these results provide a source of reference for developing targeted tuberculosis control strategies.
2 Materials and methods
2.1 Overview of the study area
The Hunan Province is in the central-southern region of China (Figure 1), which covers an area of 211,800 square kilometers. Its terrain is characterized by mountains and hills, with mountainous areas covering 51.2%, hills and plateaus covering 29.3%, plains covering 13.1%, and water surfaces covering 6.4% of the total provincial area. The number of permanent residents was 66.04 million in 2022. The Hunan Province includes 14 prefecture-level administrative divisions, with 122 county-level administrative divisions (17).
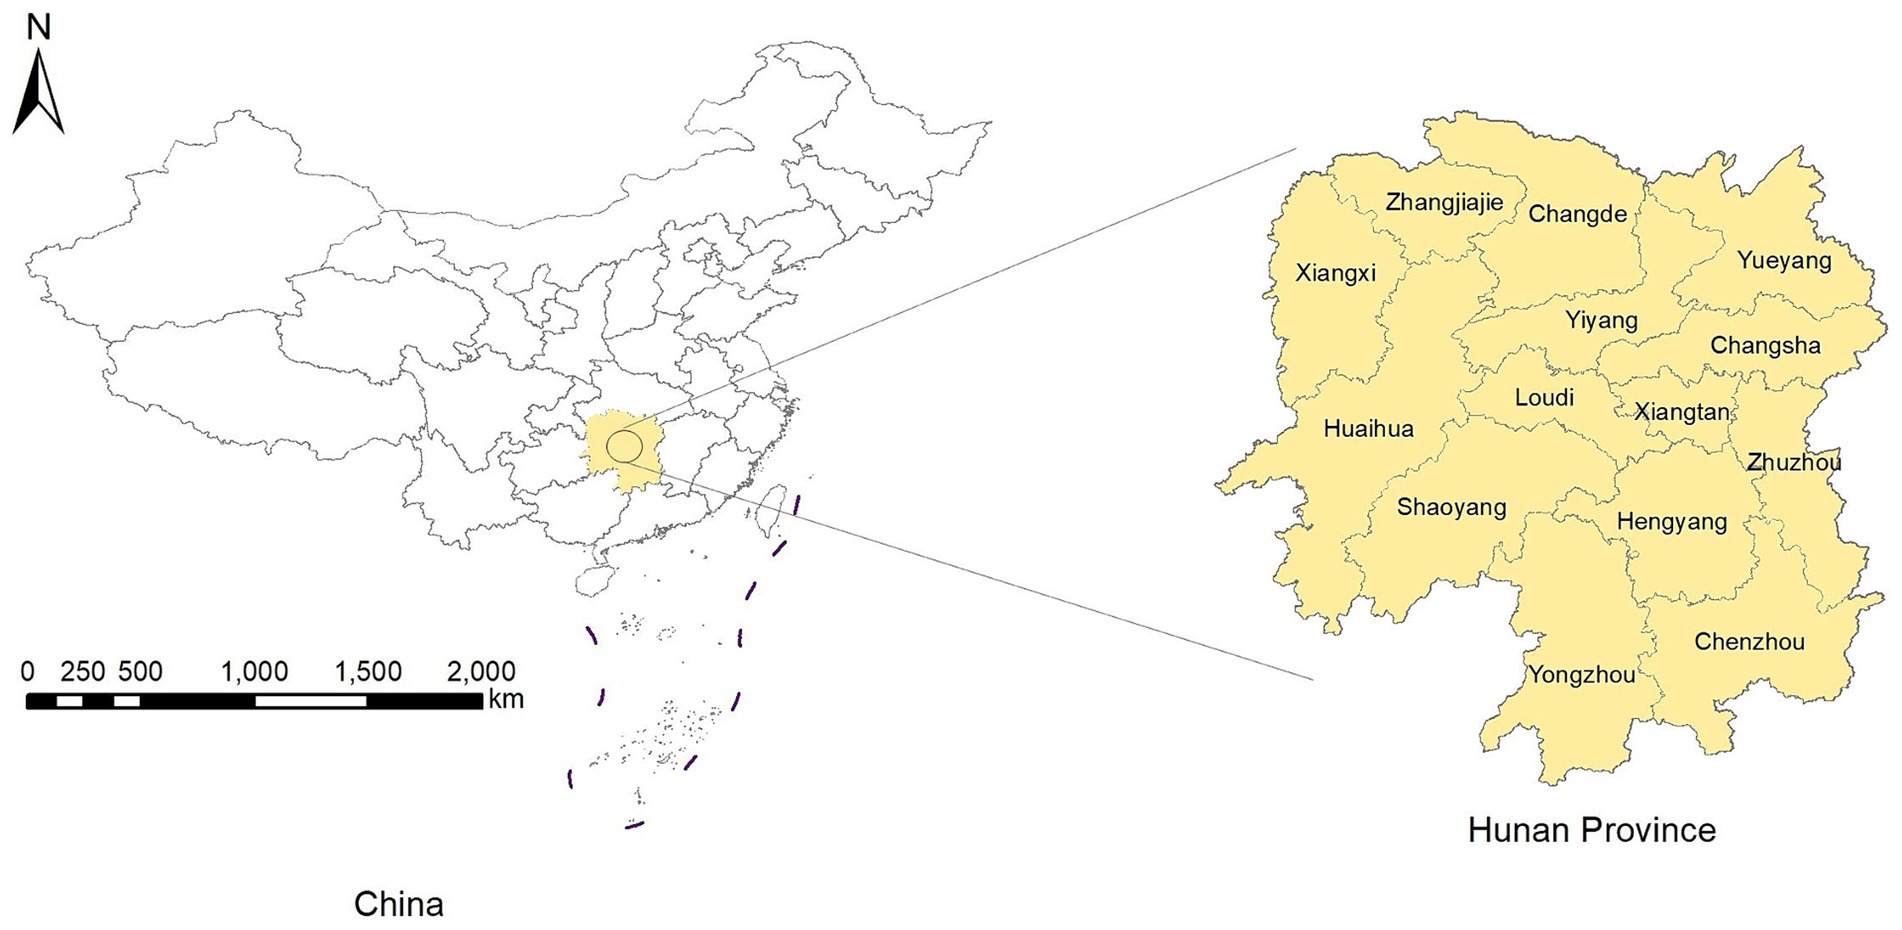
Figure 1. Location of the Hunan Province.
2.2 Data collection
Data on PTB notifications for each county in the Hunan Province from January 2014 to December 2022 were download from the China Information System for Disease Control and Prevention (CISDCP). The dataset included the number of PTB notifications for each county by month. PTB notifications included both laboratory-confirmed and clinically diagnosed cases. From January 2014 to April 2018, the diagnostic criteria for tuberculosis were based on the National Health Commission of the People’s Republic of China WS 288-2008, and from May 2018 to December 2022, the diagnostic criteria for tuberculosis were based on the National Health Commission of the People’s Republic of China WS 288-2017 (18). Population data for each county in the Hunan Province from 2014 to 2022 were obtained from the Hunan Statistical Yearbook (2015–2023). To calculate the mean PTB notification rate, we summed the number of cases notified by county for the 9-year period and divided them by the total population of each county for the same period.
The overall PTB notification rate and the notification rate of laboratory-confirmed cases of PTB were used as indicators of the effectiveness of control programs. The overall PTB notification rate included laboratory-confirmed cases, laboratory-negative cases, and cases with no laboratory results. According to the 2019 notification on the adjustment of the classification of infectious disease reports for PTB (19), laboratory-confirmed cases of PTB include smear-positive cases; smear-negative, culture-positive cases; and cases testing positive on nucleic acid amplification tests (NAATs). Since January 1, 2017, cases of rifampicin-resistant tuberculosis have been recorded in CISDCP (20). Laboratory-negative PTB refers to patients with PTB whose sputum smears and cultures are both negative, and NAAT results are negative or unavailable. PTB with no laboratory results refers to patients with tuberculosis symptoms or tuberculous pleurisy, but no sputum smear, culture, or NAAT results.
2.3 Statistical analysis
2.3.1 Time-series analysis
In the time-series analysis, we analyzed the number of notified PTB cases in the Hunan Province from January 2014 to December 2022 (108 months). Using time as the horizontal axis and the number of notified PTB cases per month as the vertical axis, we plotted a curve showing the monthly PTB cases in the Hunan Province over time. The tuberculosis incidence was analyzed by observing the trend in the curve. The analyses were conducted using Microsoft Excel 2019 (Microsoft Corporation, Redmond, WA, United States).
2.3.2 Spatial autocorrelation analysis
Spatial autocorrelation analysis was conducted to investigate whether the observed values at a particular location in a spatial area were correlated with similar observed values in neighboring areas. The analysis included global and local spatial autocorrelation. Global spatial autocorrelation can be classified into positive spatial autocorrelation, negative spatial autocorrelation, and spatial randomness (i.e., random distribution) based on the spatial distribution characteristics. Spatial autocorrelation analysis quantifies the type of spatial data correlation, explores clustering, and examines the process through which spatial features change over time, thereby identifying risk factors for disease in the study region. For the global spatial autocorrelation analysis, we used Moran’s I (21), which is widely applied as a statistical index in spatial epidemiology (11, 13). The Moran’s I index can range between −1 and 1. A positive Moran’s I value closer to 1 indicates higher clustering, whereas a negative value closer to −1 suggests a more dispersed distribution. A value of zero indicates a random distribution. We used this method to confirm the spatial distribution characteristics of the PTB notification rate at a county level in Hunan Province from 2014 to 2022. The Z-score was calculated to assess the significance of the Moran’s I estimate. If Moran’s I is greater than 0 and the Z-score is greater than or equal to 1.96, the distribution of disease is assumed to be spatially clustered and statistically aggregated (22).
Local spatial autocorrelation analysis is used to describe spatial correlation patterns, locate specific clustering areas, and investigate local spatial instability, thus revealing spatial heterogeneity among data. In this study, the local Gi* statistic was calculated to assess local spatial autocorrelation (23) and to identify hotspot and cold-spot areas of PTB notifications. A significant positive value, such as Gi* ≥ 1.96, indicates that high values in the locality are clustered more than those in other areas. Conversely, a significant negative value, such as Gi* ≤ −1.96, indicates that low values in the locality are clustered less than those in other areas. These analyses were conducted using ArcGIS 10.2 software (ESRI Inc., Redlands, CA, United States).
2.3.3 Space-time scan statistic
The space-time scan statistic was proposed by Kulldorff (24) in 1995 to observe and infer the spatiotemporal clustering of diseases. It can detect abnormal changes in the number of occurrences of a specific event (disease) within a spatiotemporal range and test whether these changes are due to random variation. That is, it investigates whether disease clustering exists within the study region, the exact location of the clustering, and the magnitude of clustering risk, and tests whether this clustering has statistical significance. Currently, it is widely used in tuberculosis research (3, 11, 13).
In this study, the space-time scan statistic model used a Poisson model and focused on areas with high PTB notification rates. The space-time scan window is a cylinder in which both spatial and temporal dimensions are constantly changing, corresponding to changes in the radius and height of the cylinder base. Simultaneously, the center of the circle at the base of the cylinder moves between the center points of each spatial unit. Each time the center, radius, and height of the cylindrical window change, a log-likelihood ratio (LLR) is calculated to compare the risk inside and outside the window. The space-time scan uses the Poisson model for every position and scale of the space-time scan window. The null hypothesis assumes that the spatial distribution of the disease is completely random, whereas the alternative hypothesis suggests an increased risk of disease occurrence inside the scan window relative to outside the scan window. For each scan window, the LLR test statistic is calculated based on the disease occurrences inside and outside the window to compare the risk. The window with the maximum LLR is considered the most likely cluster, known as the primary cluster, whereas other windows displaying statistically significant LLR values are defined as secondary clusters (25). These analyses were conducted using SaTScan version 9.5 (Kulldorff, Boston, MA, United States).
2.4 Ethical review
This study was approved by the Medical Ethics Committee of Hunan Chest Hospital. All personal information and privacy protection were carried out in accordance with the ethical requirements. The requirement for informed consent did not apply because the notification data were aggregated, and no individual-level data were analyzed.
3 Results
3.1 Overview of PTB in the Hunan Province
From 2014 to 2022, 472,826 cases of PTB were notified in the Hunan Province; of them, 205,176 cases were laboratory-confirmed, 243,571 cases were laboratory-negative, and 24,079 cases did not have information available on microbiological status. The percentage of laboratory-confirmed PTB increased from 38.43% in 2014 to 57.74% in 2022, whereas the percentage of cases with negative results decreased from 55.49% in 2014 to 38.56% in 2022 (Table 1). The mean annual PTB notification rate in the Hunan Province between 2014 and 2022 was 77.55/100,000. The mean annual PTB notification rate in the province decreased from 85.88/100,000 in 2014 to 66.40/100,000 in 2022, showing a gradual downward trend with fluctuations. The annual notification rate of laboratory-confirmed PTB increased from 33.00/100,000 in 2014 to 38.34/100,000 in 2022, showing a fluctuating gradual upward trend (Figure 2). In contrast, the notification rate of laboratory-negative PTB decreased from 47.65/100,000 in 2014 to 25.60/100,000 in 2022, showing a downward trend (Figure 2).
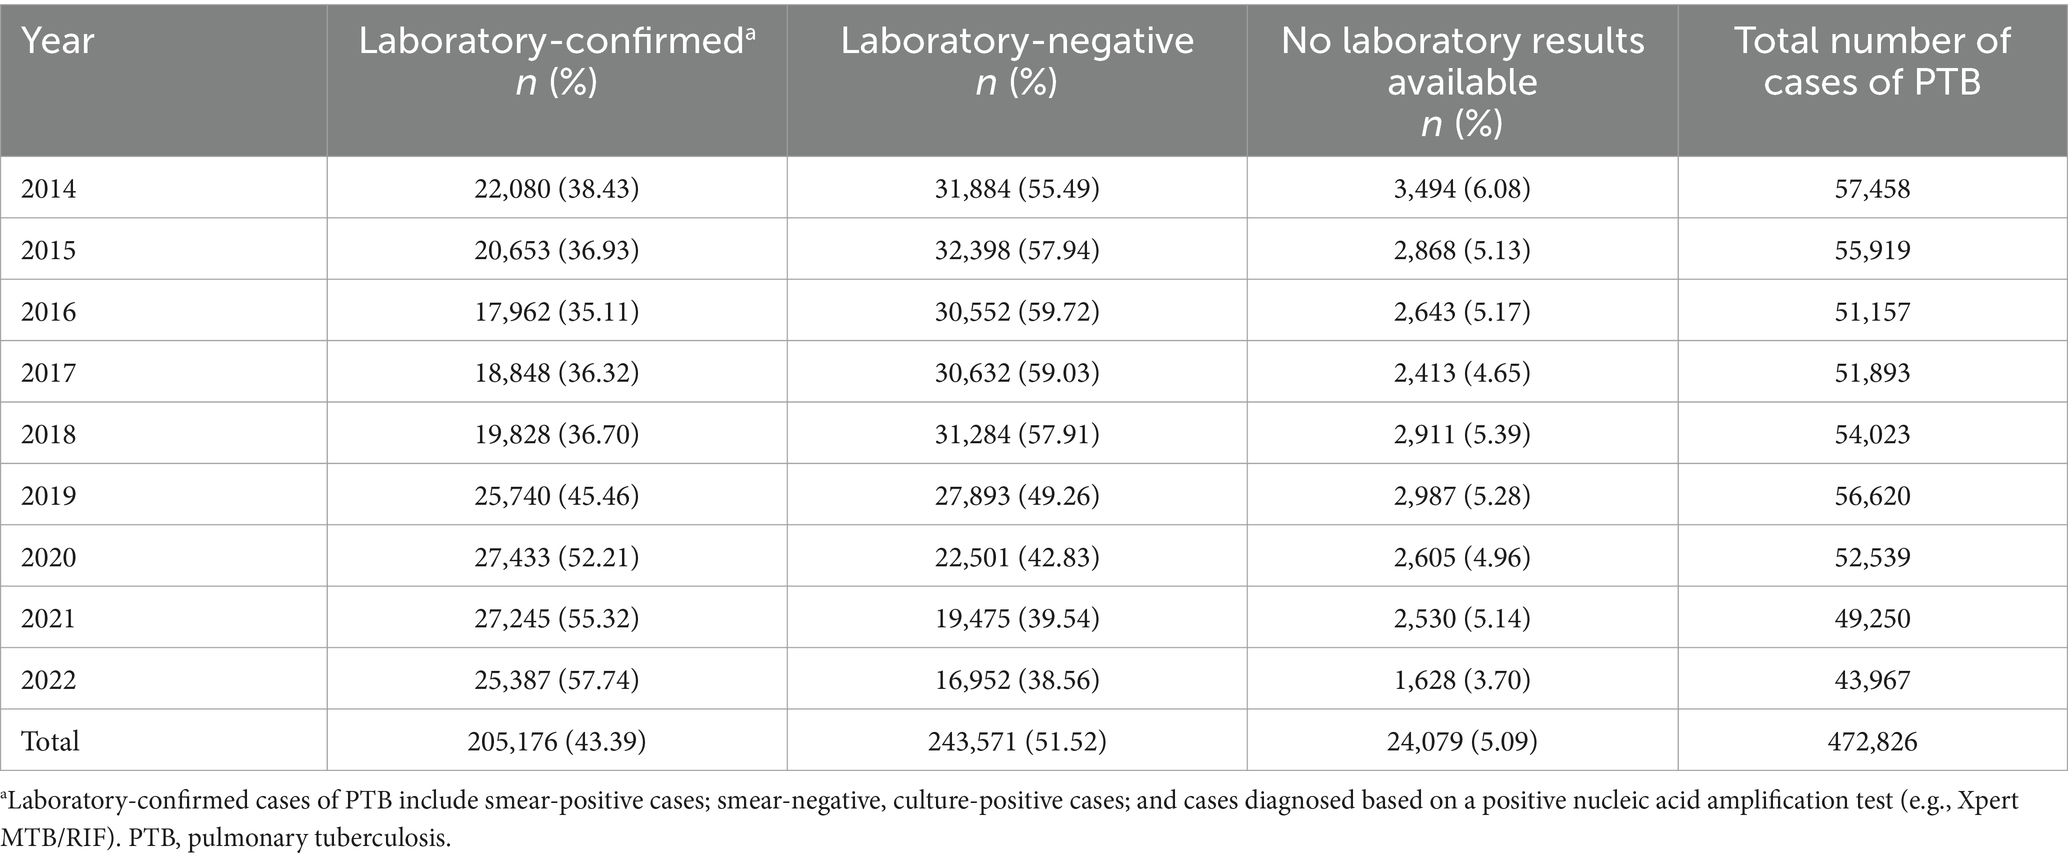
Table 1. Laboratory confirmation of cases of PTB notified in the Hunan Province, China from 2014 to 2022.
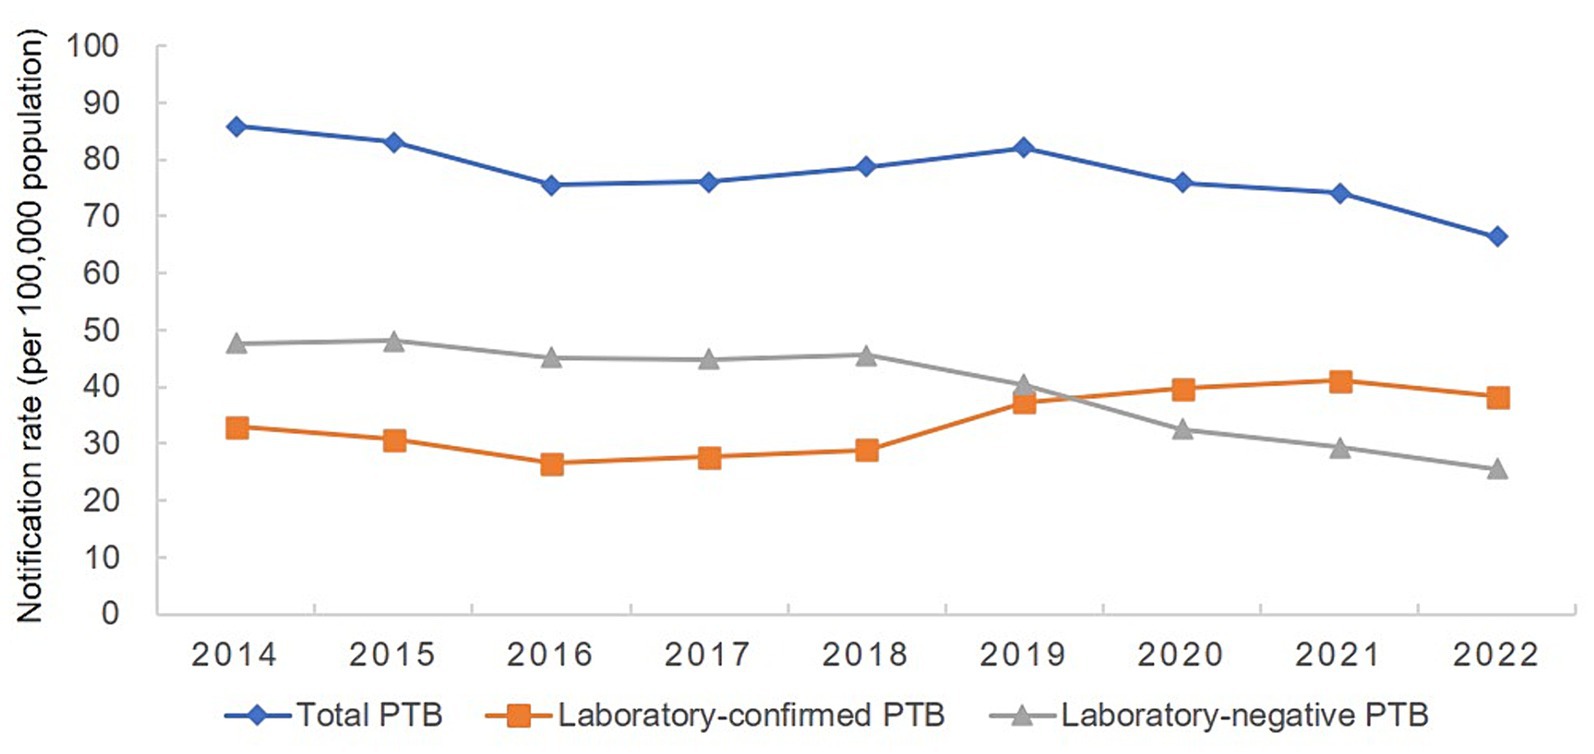
Figure 2. Annual pulmonary tuberculosis notification rate in the Hunan Province, China from 2014 to 2022.
3.2 Temporal trends in PTB case notifications
The number of PTB notifications per month showed significant seasonal variation from 2014 to 2019 (Figure 3). The number of notifications peaked in January or March every year, followed by a fluctuating decline after March, and reached a trough in November or December. However, this pattern was disrupted from 2020 to 2022, with peaks occurring in June, April, and July, in 2020, 2021, and 2022, respectively, although the troughs still occurred in December each year.
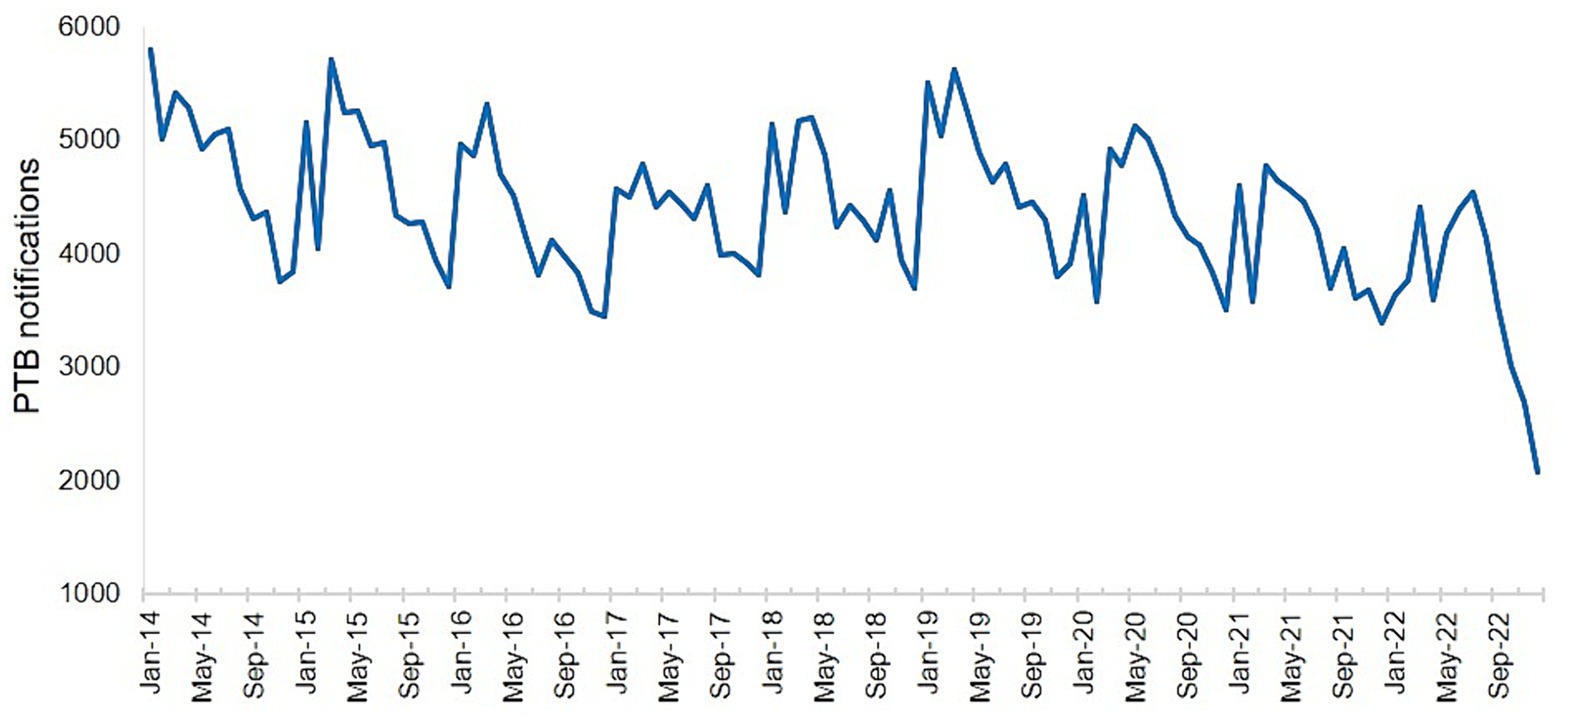
Figure 3. Number of notified cases of pulmonary tuberculosis in the Hunan Province by month from January 2014 to December 2022.
3.3 Spatial distribution of PTB case notifications
The PTB notification rate in the Hunan Province between 2014 and 2022 varied by county and district (Figure 4). Over the 9-year period, the counties with the highest mean PTB notification rates were the Hengdong, Sangzhi, Cili, Hengshan, and Fenghuang Counties. The global spatial autocorrelation analysis results showed that Moran’s I of the annual PTB notification rate at a county level ranged from 0.117 to 0.317 between 2014 and 2022 (p < 0.05) (Table 2), indicating that the occurrence of PTB exhibited a positive global spatial autocorrelation and was clustered.
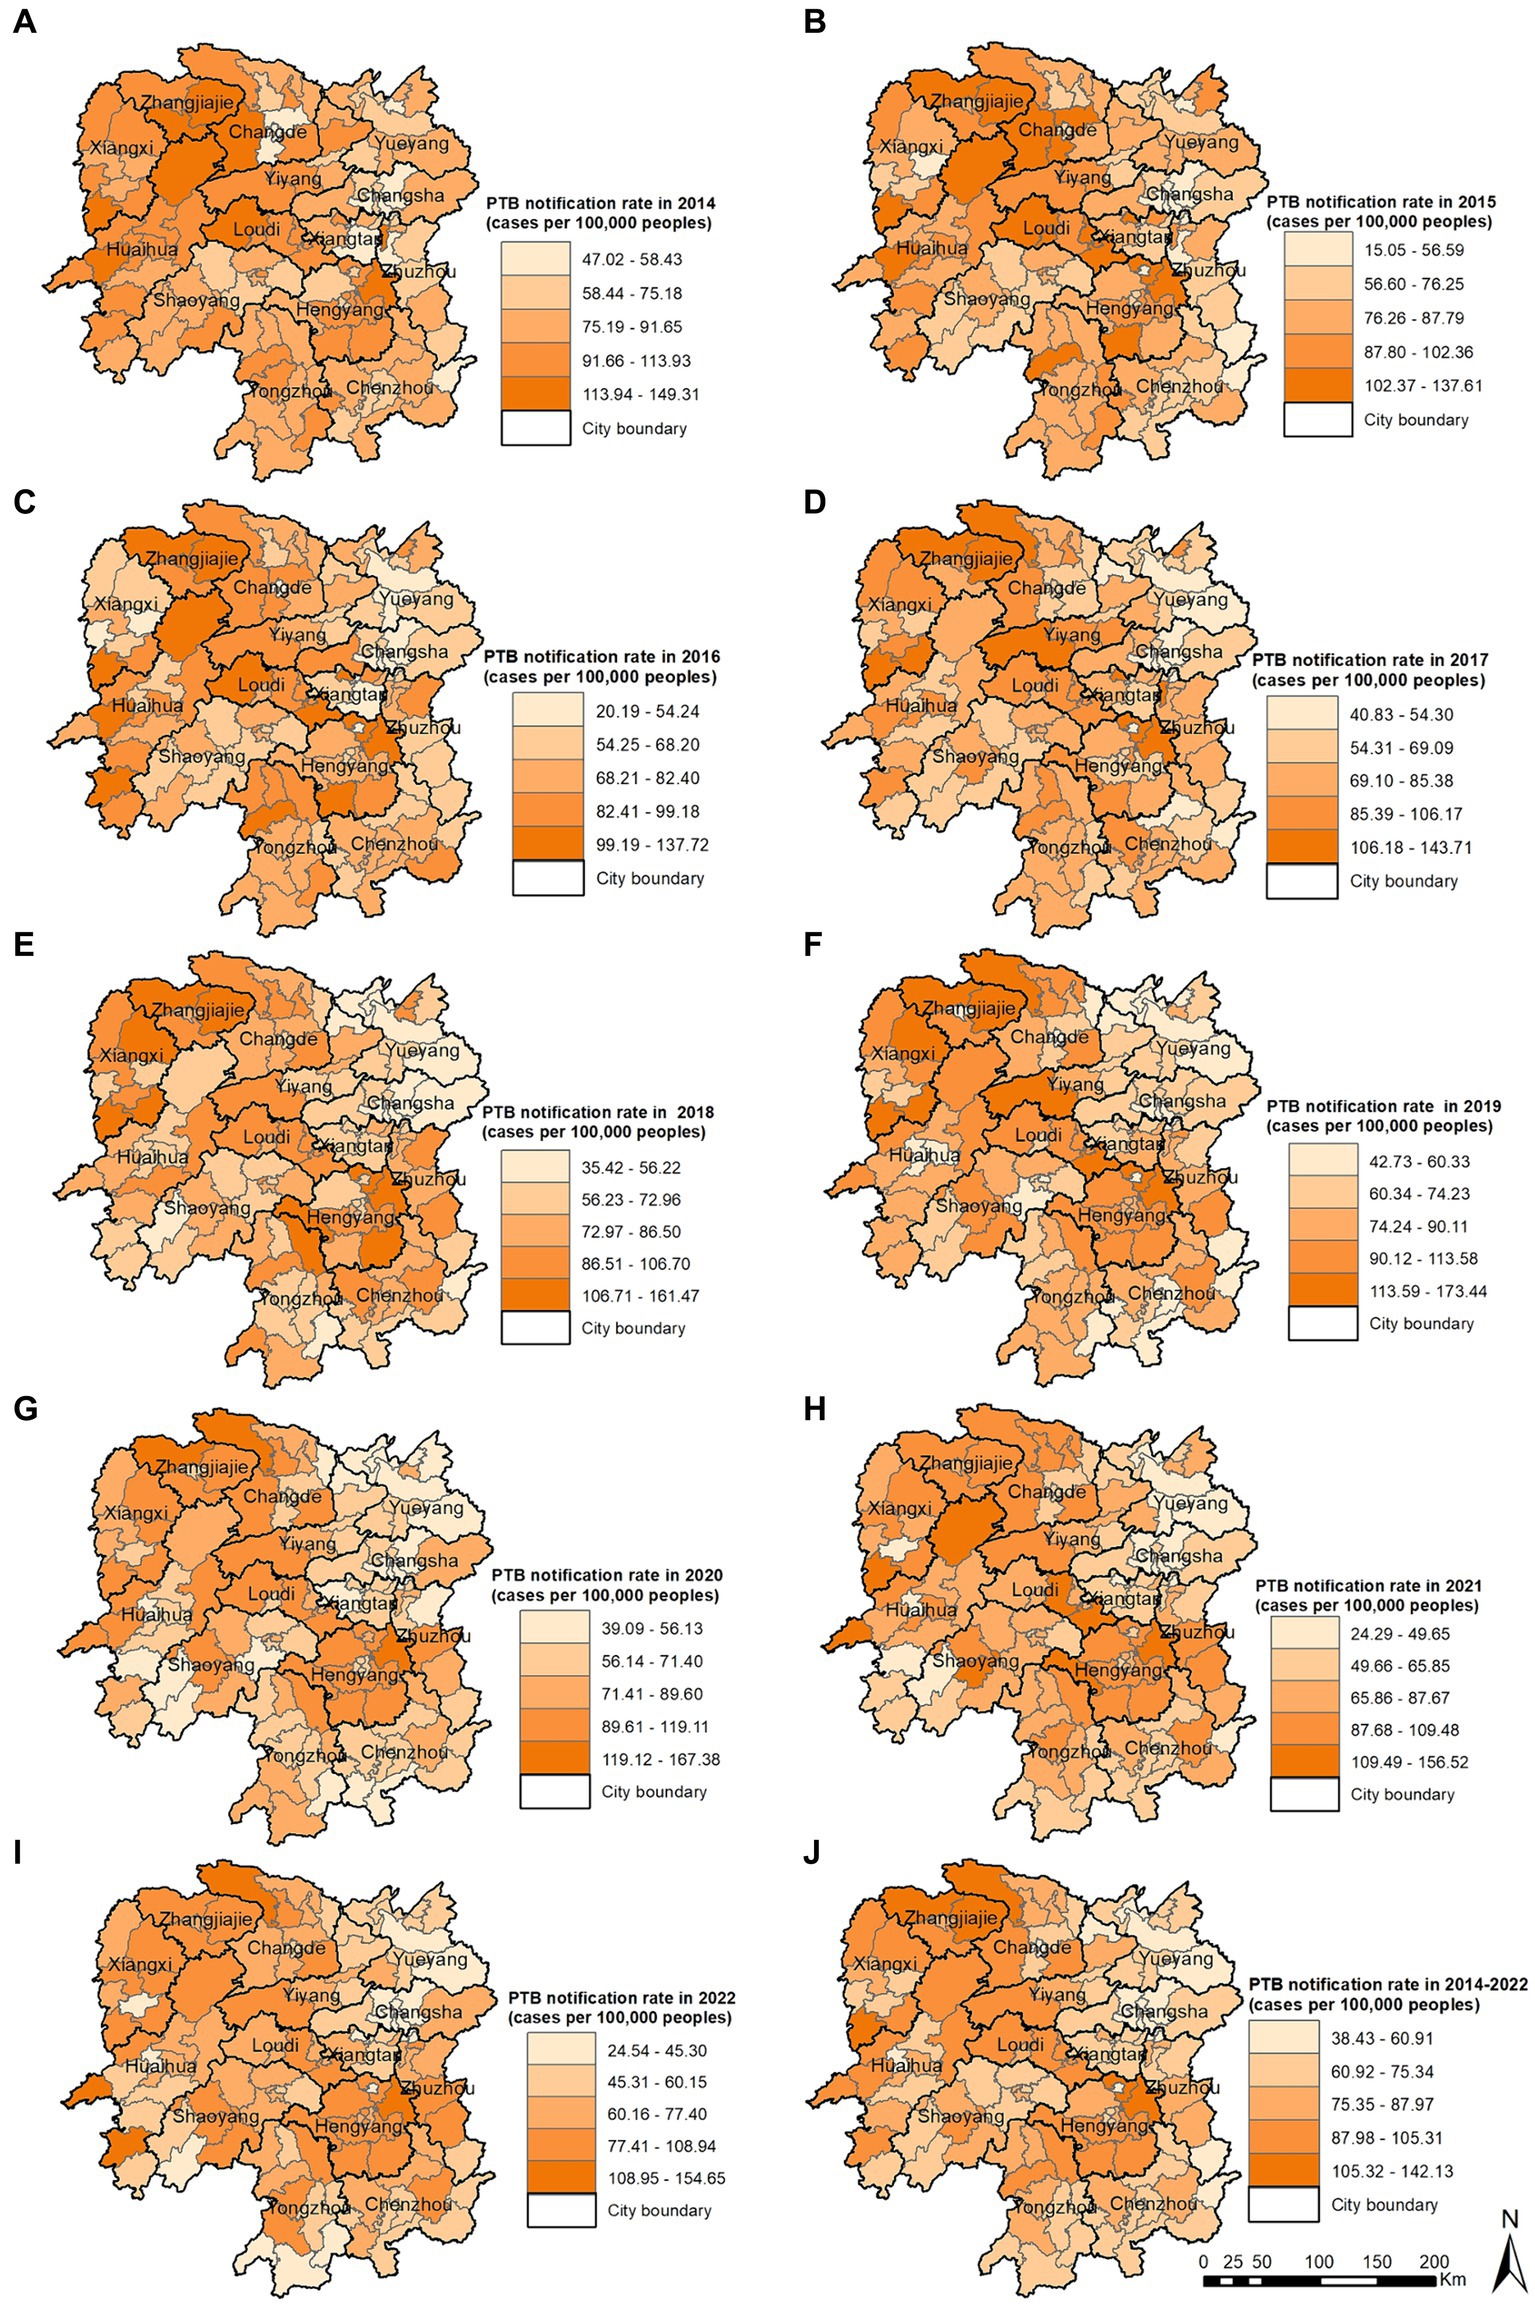
Figure 4. Pulmonary tuberculosis notification rate in 2014 (A), 2015 (B), 2016 (C), 2017 (D), 2018 (E), 2019 (F), 2020 (G), 2021 (H), 2022 (I), 2014–2022 (J).
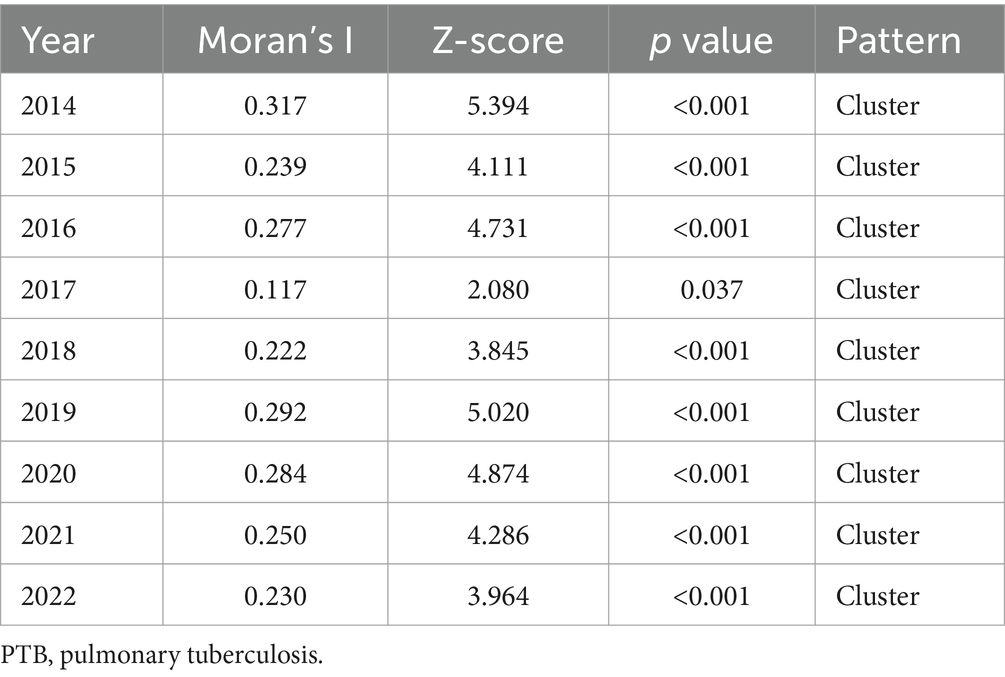
Table 2. Global spatial autocorrelation analysis of the annual PTB notification rate in the Hunan Province, China from 2014 to 2022.
The local spatial autocorrelation analysis results revealed that the hotspot and cold-spot areas of disease incidence in the Hunan Province changed annually from 2014 to 2022. The hotspot areas were mainly concentrated in the Xiangxi Autonomous Prefecture, Zhangjiajie City, and Hengyang City, and in some adjacent areas such as the Yuanling County in Huaihua City, Shimen County in Changde City, Xinhua County in Loudi City, Anhua County in Yiyang City, Qiyang City in Yongzhou City, and You County in Zhuzhou City. From 2018 to 2022, the hotspot areas in the Xiangxi Autonomous Prefecture gradually decreased annually and disappeared in 2021 and 2022; however, hotspot areas gradually formed in the Hengyang City from 2018 to 2022. The cold-spot areas of disease incidence gradually expanded from the urban zones of Changsha, Zhuzhou, and Xiangtan in 2014 to the entire cities of Changsha, Zhuzhou, and Xiangtan, and some areas of Yueyang, by 2022 (Figures 5A–I). Comparison of the mean PTB notification rate and the clustering of laboratory-confirmed cases of PTB over the 9-year study period revealed patterns in hotspot and cold-spot areas. However, the hotspot areas of laboratory-confirmed cases of PTB also included the Jishou City and Fenghuang County in the Xiangxi Autonomous Prefecture, and the Mayang Miao Autonomous County and Chenxi County in Huaihua City (Figures 5J,K).
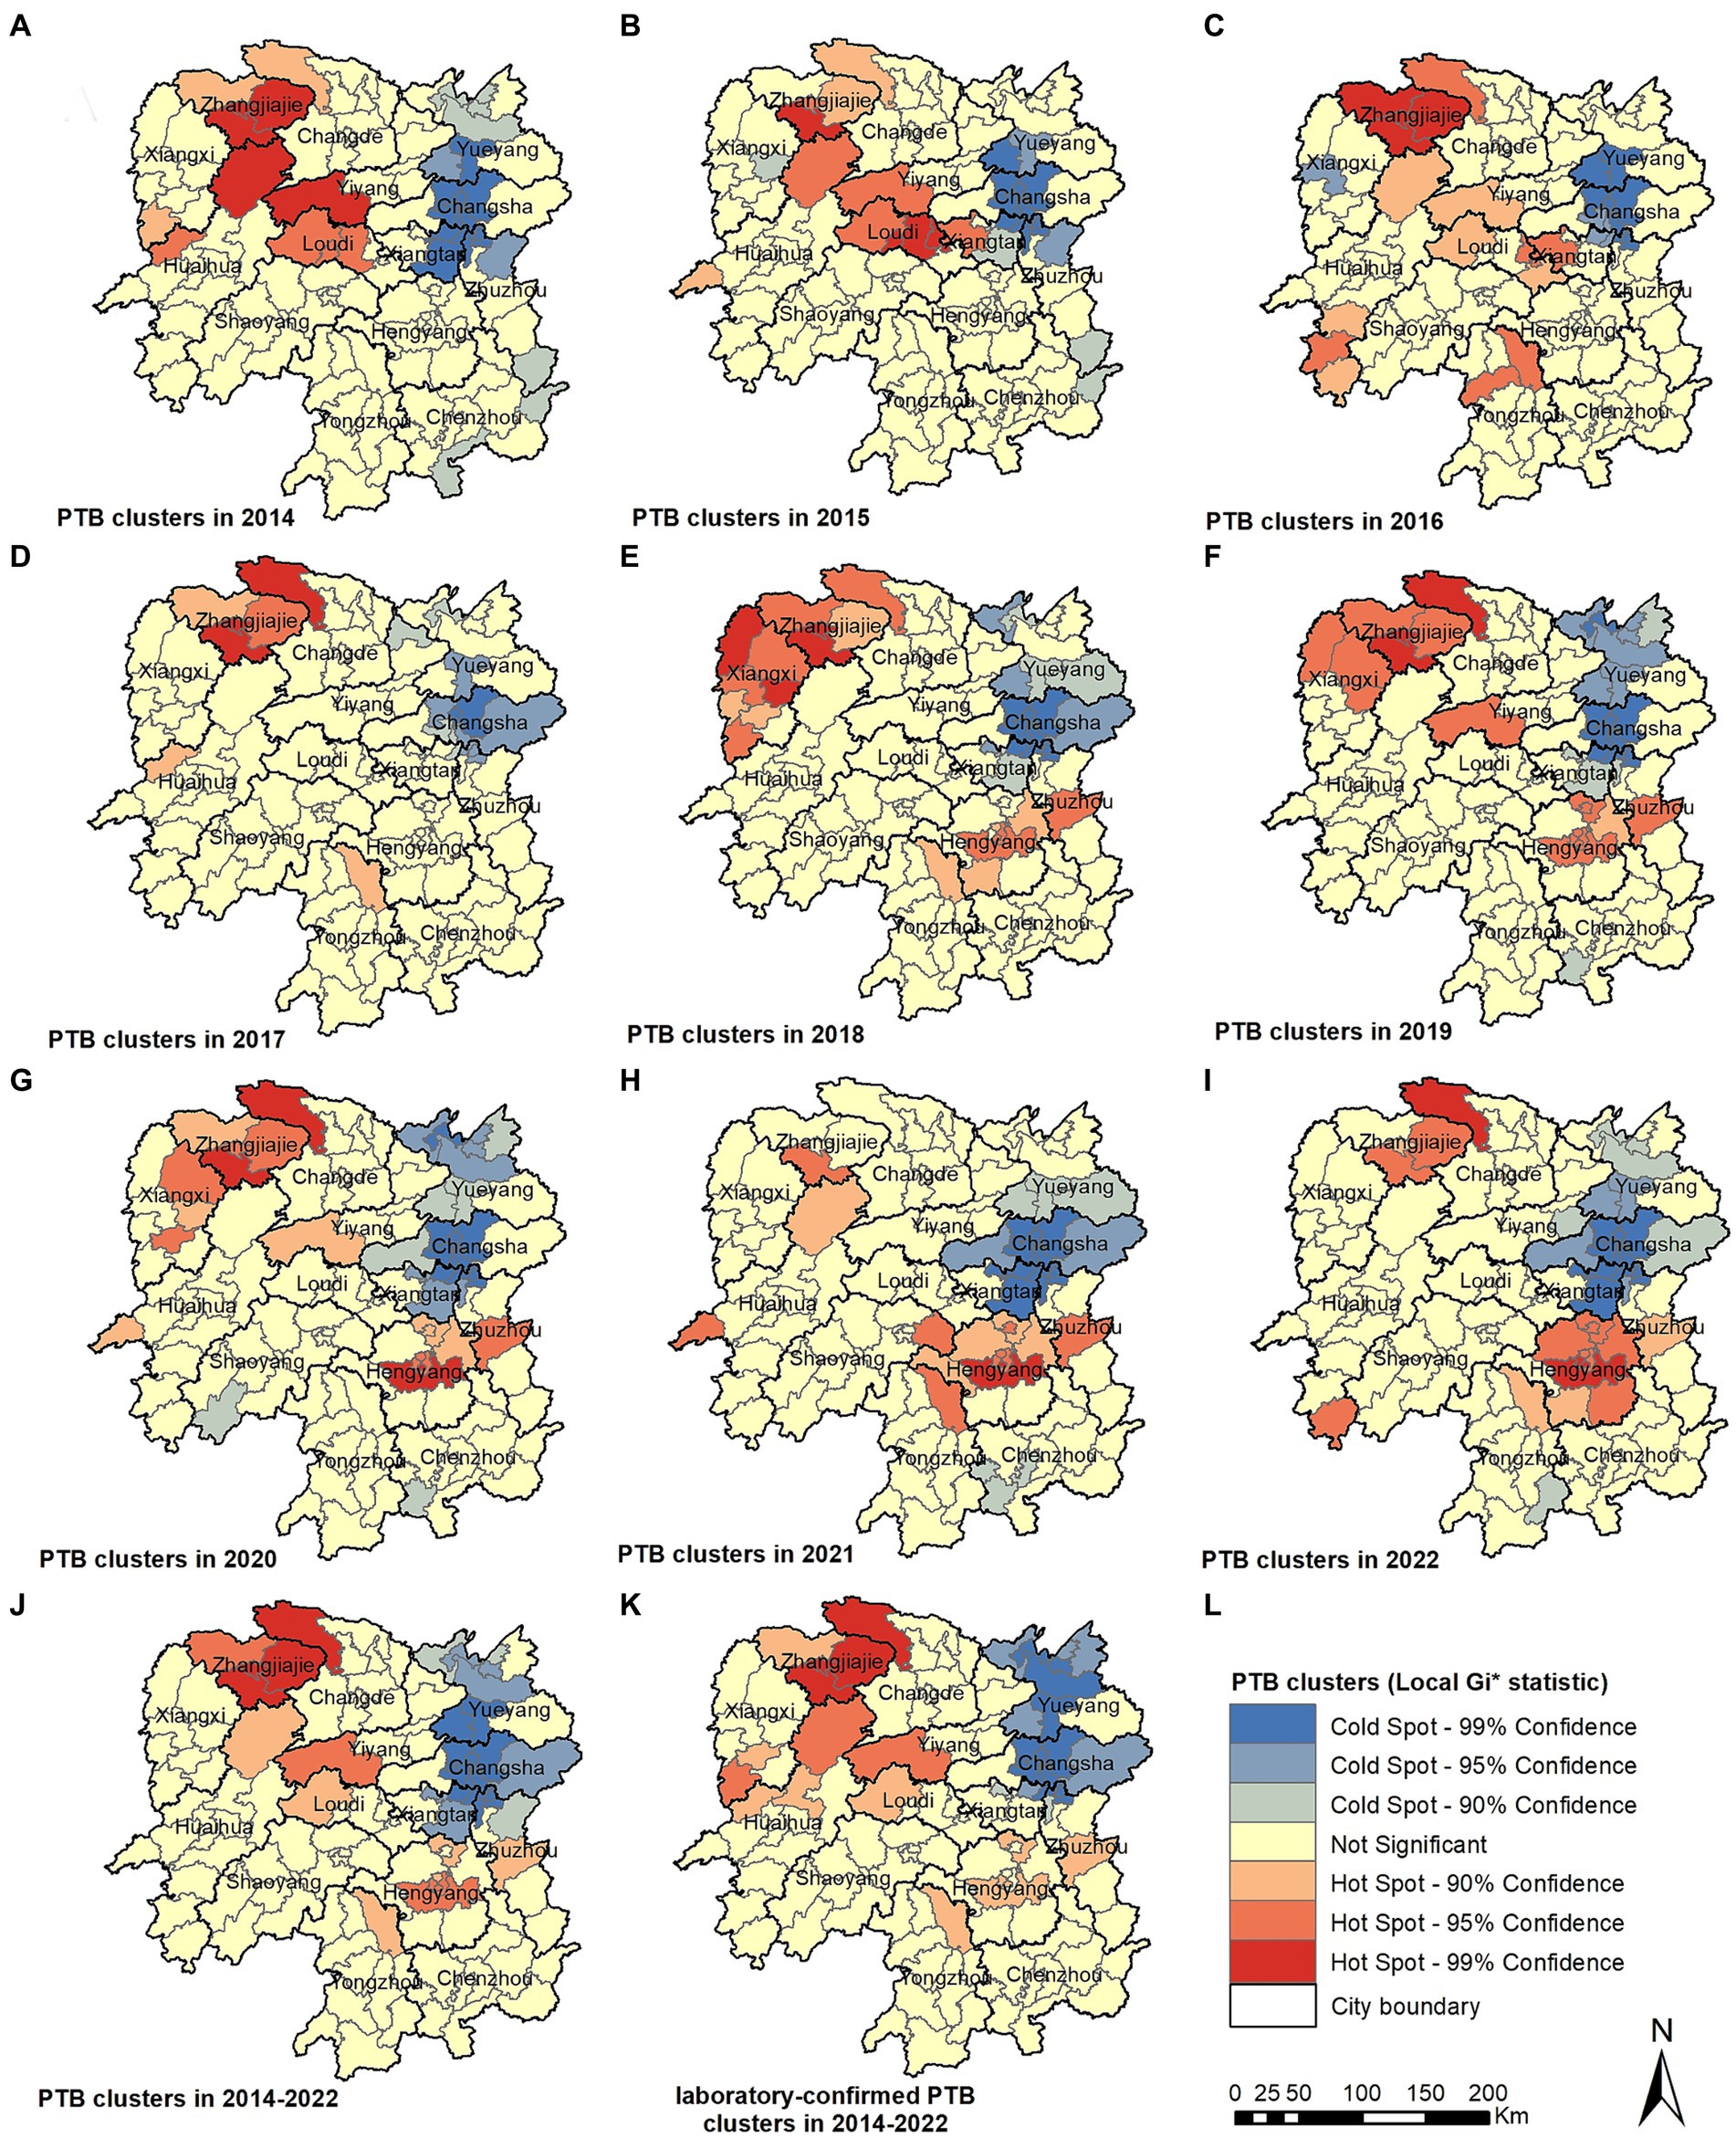
Figure 5. Pulmonary tuberculosis clusters in 2014 (A), 2015 (B), 2016 (C), 2017 (D), 2018 (E), 2018 (F), 2020 (G), 2021 (H), 2022 (I), 2014–2022 (J), laboratory-confirmed PTB clusters in 2014–2022 (K).
3.4 Spatiotemporal clustering analysis using SaTScan
The spatiotemporal scanning analysis results showed two distinct clusters of PTB incidence in the Hunan Province between 2014 and 2022. The most likely cluster was in the central-southern part of the Hunan Province, including the entire area of the Hengyang City, Anren County in Chenzhou City, Chaling County and You County in Zhuzhou City, Shuangfeng County in Loudi City, and Qiyang City in Yongzhou City, comprising 17 counties and districts. The clustering period was from March 1, 2018, to August 31, 2022, during which 47,338 cases of PTB were confirmed. The PTB notification rate within the clustered area was 1.36 times higher than that in areas outside the cluster. The secondary cluster was situated in the northwest region of the Hunan Province, encompassing the entire Xiangxi Autonomous Prefecture, Zhangjiajie City, eight county-level administrative regions in Huaihua City, Taoyuan County and Shimen County in Changde City, Anhua County in Yiyang City, and Xinhua County in Loudi City, comprising 25 counties and districts. The clustering period was from January 1, 2014, to May 31, 2018, during which 50,877 cases of PTB were notified. The PTB notification rate within the clustered area was 1.3 times higher than that in areas outside the cluster (Table 3; Figure 6).
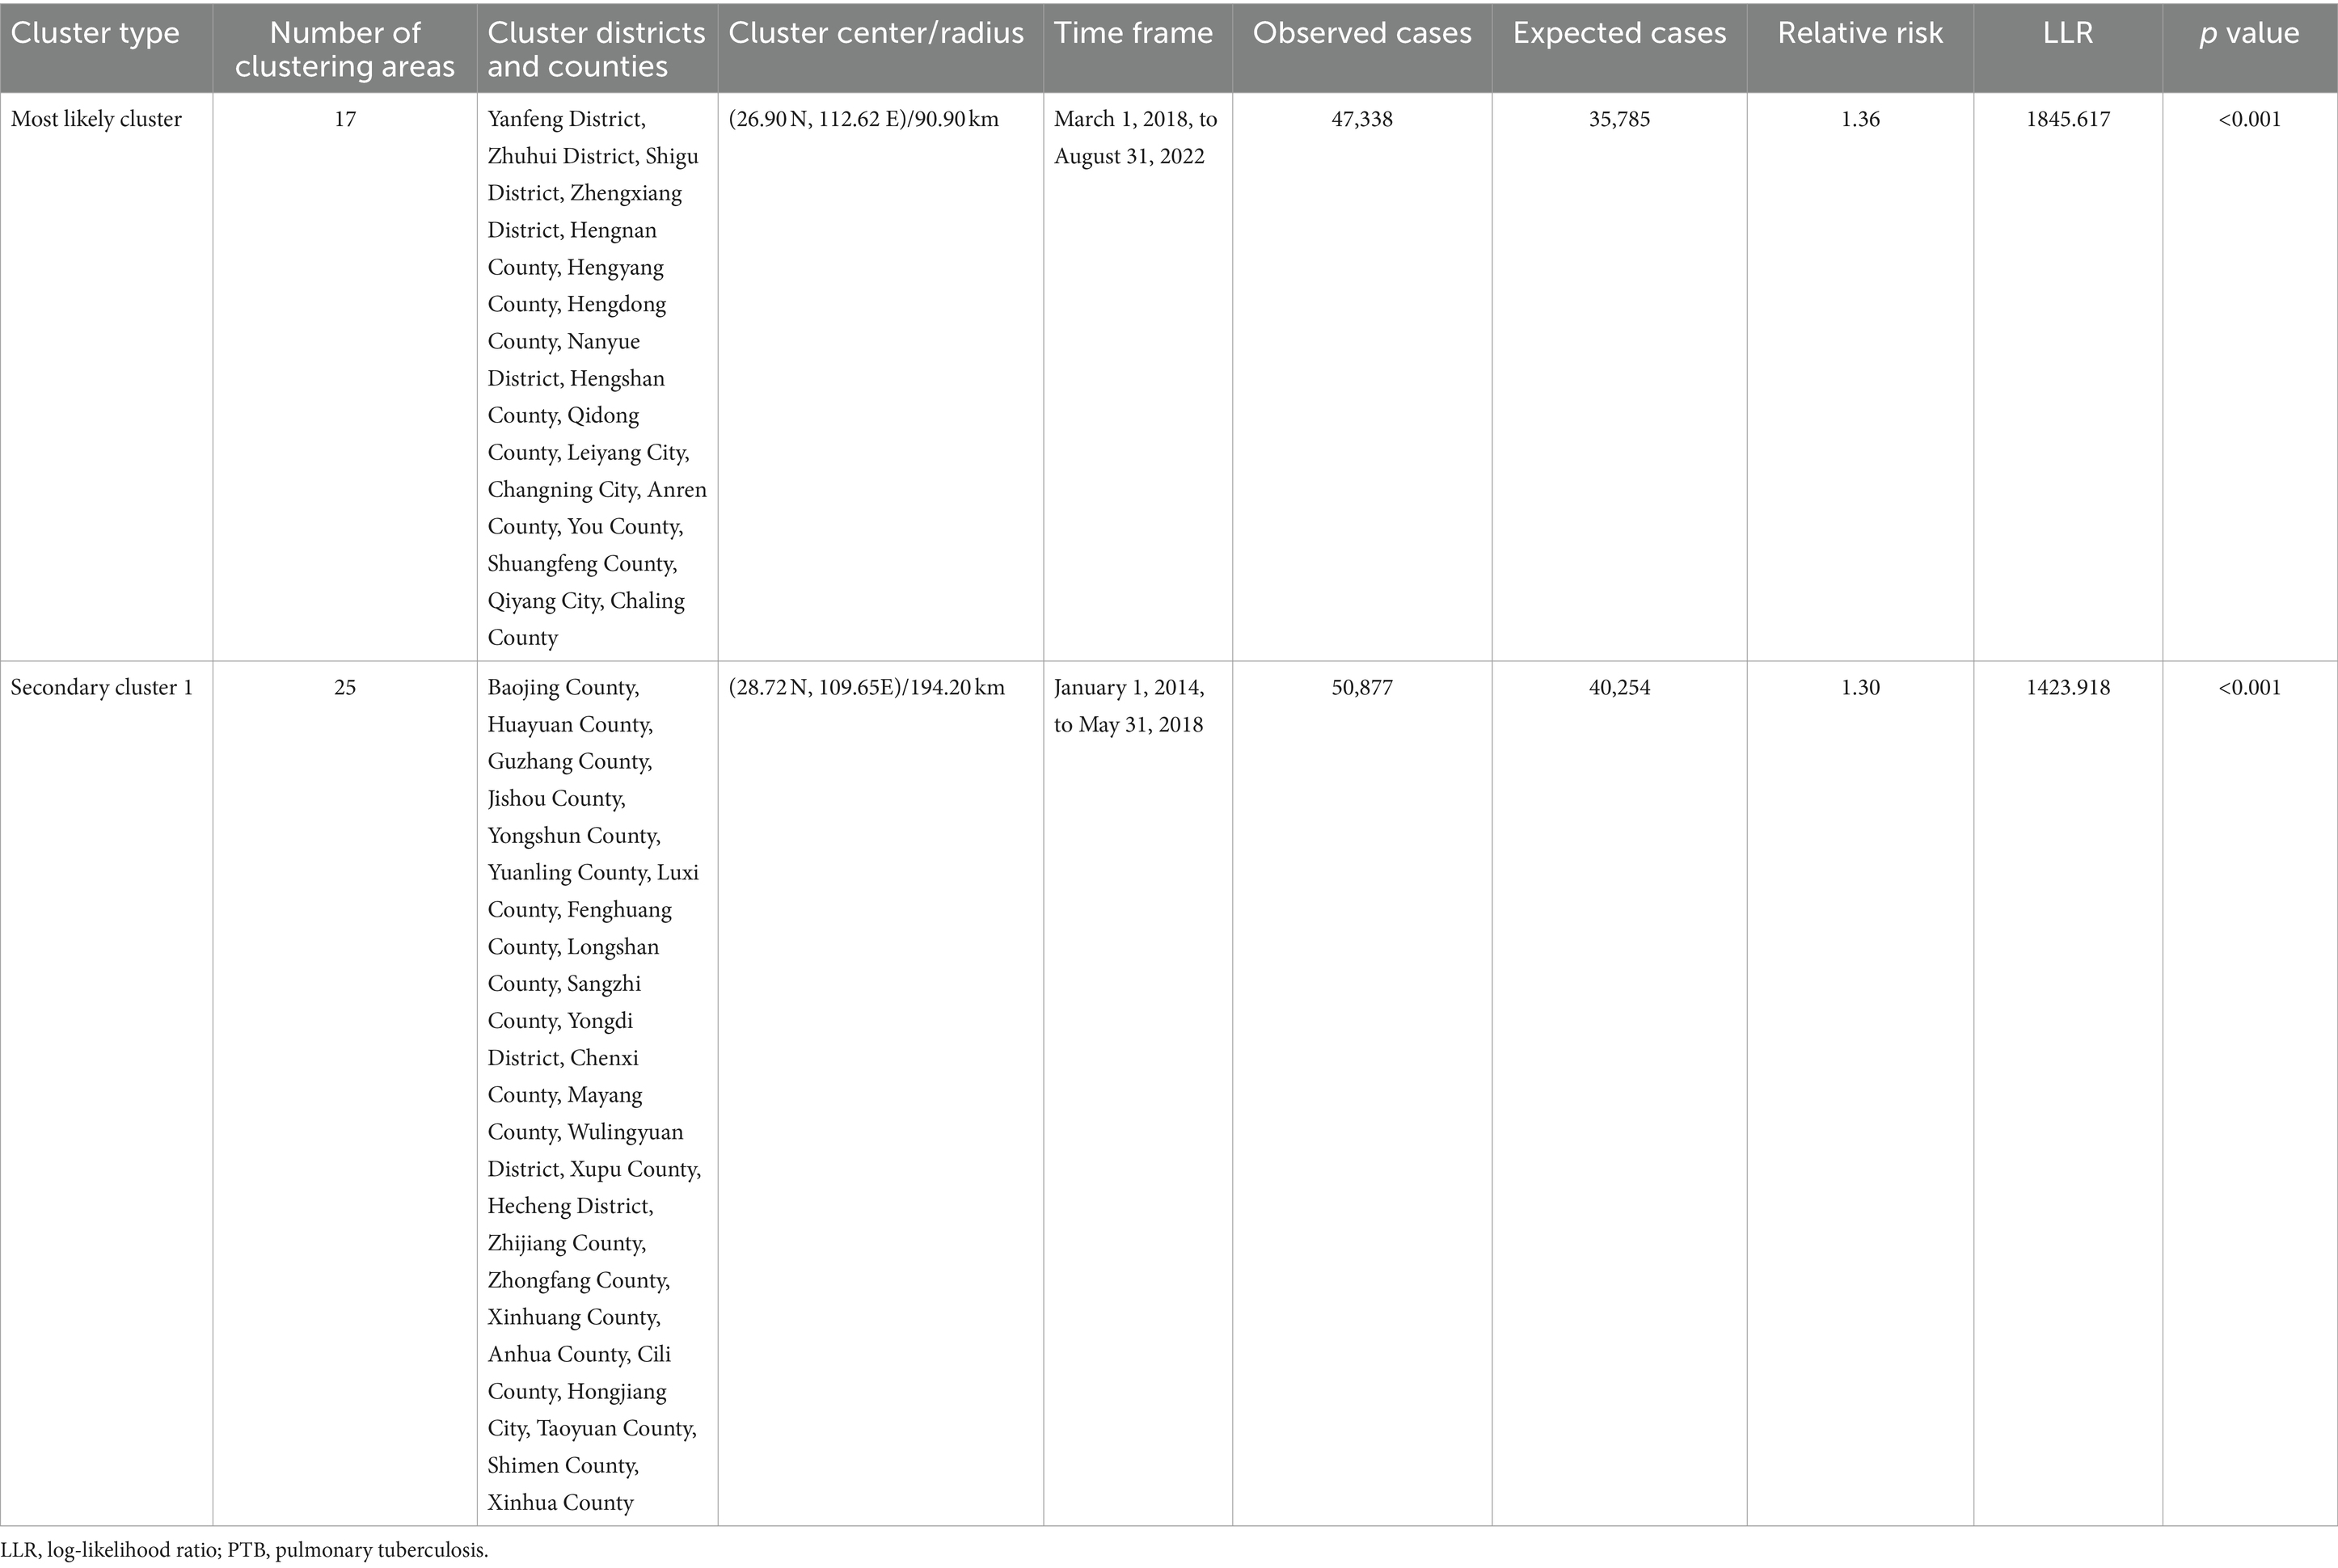
Table 3. Space-time clustering of cases of PTB in the Hunan Province, China from January 2014 to December 2022.
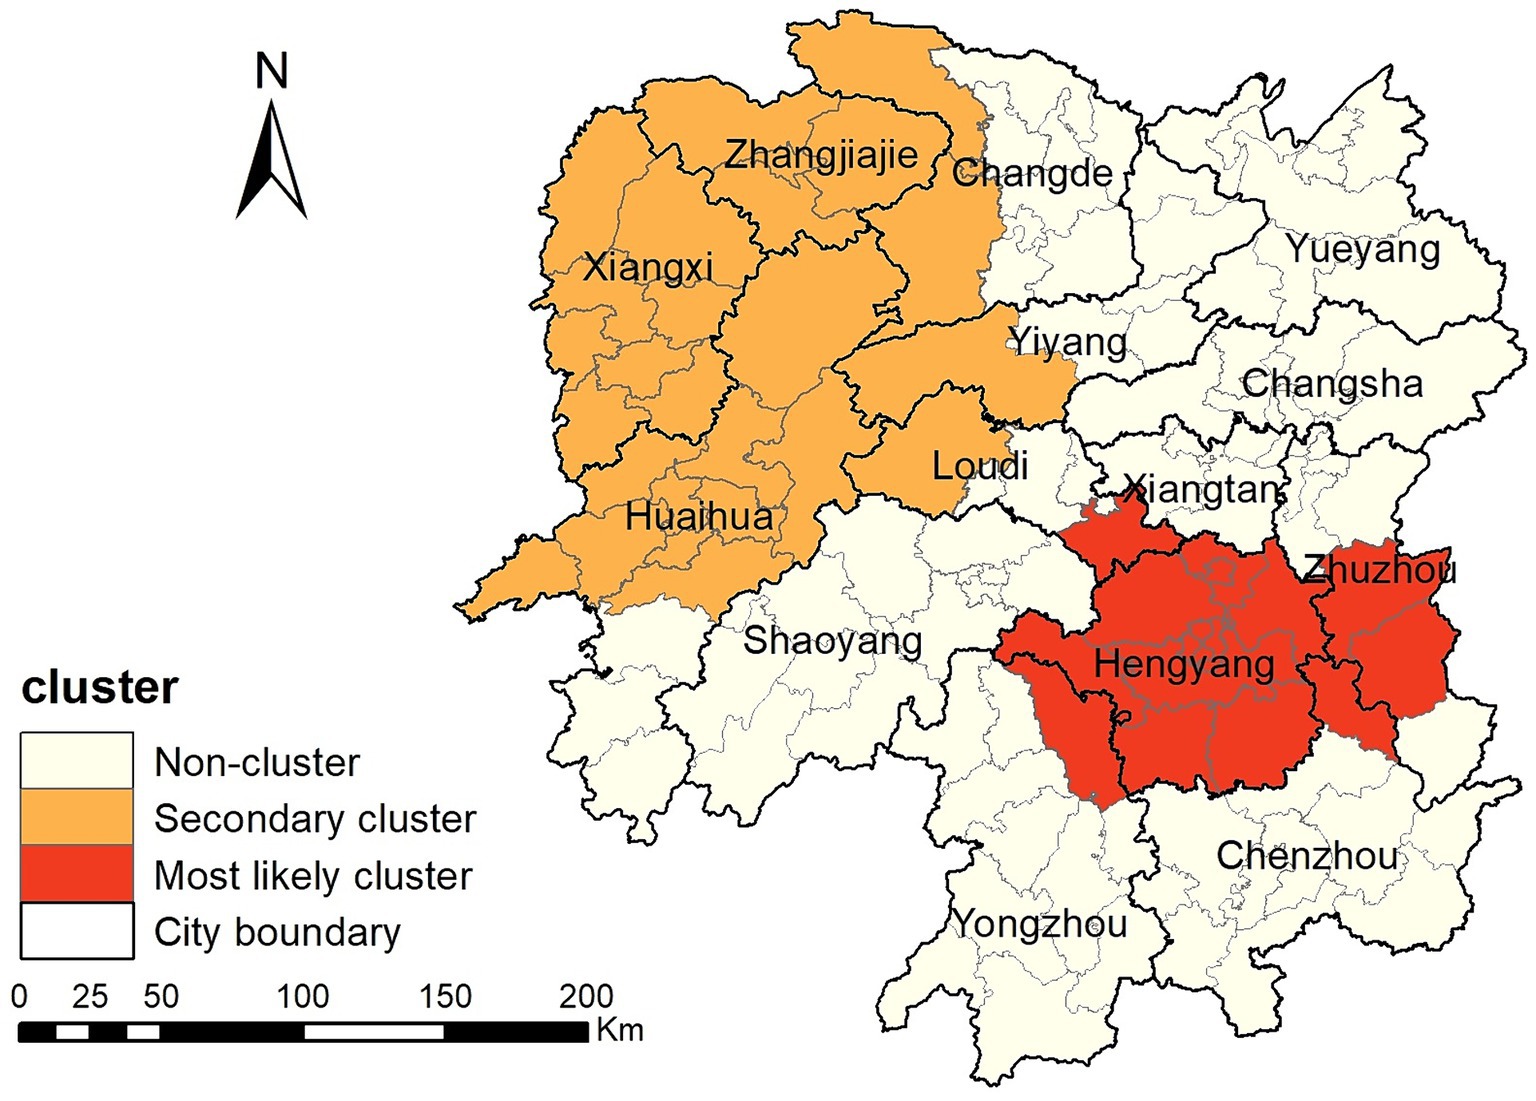
Figure 6. Space-time clusters of cases of pulmonary tuberculosis at a county level in the Hunan Province from 2014 to 2022.
4 Discussion
This study found that the PTB notification rate decreased from 2014 to 2022 in the Hunan Province. PTB case notifications exhibited spatial clustering, with clustering occurring predominantly in the central-southern and northwestern regions of the province. The PTB notification rate in the Hunan Province decreased from 85.88/100,000 in 2014 to 66.40/100,000 in 2022, showing a slow downward trend with fluctuations. This declining trend mirrors observations made in various provinces and cities across China in a national study (26), including the Chongqing Municipality (13), Shandong Province (27), and Hubei Province (28). The decrease in the tuberculosis epidemic is mainly attributable to the efforts made by the national and local governments in tuberculosis control. The Hunan Province has implemented multiple measures to enhance its capacity for tuberculosis control across the province, establishing a novel tuberculosis control system. It actively conducts health education to raise awareness among the population about tuberculosis prevention and treatment. Molecular biology testing is widely promoted in prefectures and counties to achieve rapid diagnosis of PTB, leading to a gradual increase in the proportion of patients with microbiological confirmation and further improvement in the quality of tuberculosis diagnosis. Active screening is performed among key populations such as close contacts of patients with laboratory-confirmed PTB, older adults, and patients with diabetes patients to diagnose cases early, promptly initiate treatment, and reduce the spread of tuberculosis. In educational institutions, tuberculosis management has been strengthened by implementing PTB screening for students before entry into primary schools, middle schools, and high schools, as well as universities, controlling the entry of students with a high risk of developing tuberculosis. Additionally, preventive treatment for latent tuberculosis infection with a high risk of disease progression is promoted, reducing the occurrence of tuberculosis outbreaks in schools.
Our study found that the monthly PTB notifications showed significant seasonal variation, with peaks in January or March and troughs in December. The Hunan Province is located between 25° and 30° north latitude and has a subtropical monsoon climate. January is typically a winter month and is characterized by damp and rainy weather with little sunlight. Lack of exposure to ultraviolet light and poor ventilation are known risk factors for tuberculosis transmission (29). February coincides with the Chinese Lunar New Year holiday, when traditional customs discourage seeking medical care, leading to a higher PTB notification rate in March after the holiday period. This cyclical pattern is similar to research findings in the Chongqing Municipality (13), Hubei Province (28), Guangxi Province (30), and Hunan Province (15) but differs from the results observed in the Zhejiang Province (11), Taiwan (31) and Hong Kong (32). However, this pattern was disrupted from 2020 to 2022, with the peak in notifications delayed to June, April, and July in 2020, 2021, and 2022, respectively, although the trough still occurred in December each year. This may be attributed to the COVID-19 pandemic, which led to successive enforcement of control measures by the national and local governments based on the prevalence of COVID-19. People’s movements were affected, leading to delays in accessing healthcare services and diagnosis in individuals with PTB, thus disrupting the seasonal pattern of PTB notifications (33, 34).
This study identified significant spatial clustering of PTB notifications in the Hunan Province, with hotspot areas primarily concentrated in the Xiangxi Autonomous Prefecture, Zhangjiajie City, and Hengyang City, similar to the findings of a previous study carried out in the Hunan Province in 2012 and 2013 (16). The hotspot areas in the Xiangxi Autonomous Prefecture gradually decreased over the years, disappearing by 2021 and 2022, whereas hotspot areas gradually formed in the Hengyang City from 2018 to 2022. Space-time scan analysis revealed that the most likely clustering area was around the Hengyang City, encompassing 17 adjacent counties and districts, with clustering occurring from March 1, 2018, to August 31, 2022. A secondary clustering area was identified around the Xiangxi Autonomous Prefecture and Zhangjiajie City, covering 25 adjacent counties and districts, with clustering occurring from January 1, 2014, to May 31, 2018. Local spatial autocorrelation analysis of hotspot areas was consistent with the clustering areas identified by space-time scan analysis, confirming the stability and reliability of the research results. The Xiangxi Autonomous Prefecture and Zhangjiajie City, located in the northwestern region of the province, are economically underdeveloped, with poor living conditions for residents and a lack of medical and health resources. Patients in these areas often come from impoverished families and may not receive timely diagnosis and treatment, causing the transmission of PTB and contributing to a higher incidence of the disease (35, 36). In contrast, the Xiangxi Prefecture is an area in which ethnic minorities (Tujia and Miao) are concentrated. People belonging to ethnic minorities have an increased risk of delayed diagnosis of tuberculosis (37). In 2021, the PTB notification hotspot in the Zhangjiajie City decreased significantly, which may have been related to the COVID-19 epidemic in the Zhangjiajie City in July and August 2021 and the implementation of epidemic control measures. The COVID-19 pandemic resulted in reduced healthcare-seeking behavior among individuals with tuberculosis, affecting the diagnosis and treatment (34, 38). This study also identified a cold-spot area that gradually expanded from the urban zones of Changsha, Zhuzhou, and Xiangtan in 2014 to encompass the entire city of Changsha, the urban zones of Zhuzhou and Xiangtan, and parts of Yueyang. This finding is generally similar to that of a previous study (15). These areas are the most economically developed region in the Hunan Province, with abundant medical resources and strong public awareness of disease prevention and treatment.
To our knowledge, this is the first space-time scan analysis of spatiotemporal clustering of PTB notifications at a county level in the Hunan Province. It identified regions with high PTB notification rates in the Hunan Province, providing valuable insights for formulating more effective control strategies.
This study has few limitations. First, the data were sourced from the National Disease Surveillance System, which may have resulted in an underestimation of the PTB epidemic in the Hunan Province due to some cases not being notified. Second, due to the adjustment of the national tuberculosis diagnostic criteria, cases of tuberculous pleurisy have been included in the pulmonary tuberculosis reporting system since May 1, 2018, which may introduce a slight bias in the research results. Third, this study used the space-time scan method to investigate PTB clustering. This method depends on circular spatial scan windows and space-time cylinders, which may not work well in irregular spaces, potentially leading to instability in determining clusters. Finally, this research examined only the spatiotemporal distribution patterns of tuberculosis without investigating individual factors and socioeconomic factors that may influence the incidence of tuberculosis. Some studies have found that personal factors such as smoking (39), alcohol consumption (40, 41), HIV (42), and diabetes (43), as well as social factors such as poverty (36), population mobility (44, 45), healthcare resources (46), and environmental pollution (47, 48) may influence the distribution of tuberculosis. Future studies should aim to restrict the geographical unit of analysis to the township level and explore how these factors affect the incidence of PTB.
5 Conclusion
This study characterized the temporal trend and spatial distribution of tuberculosis in the Hunan Province. PTB diagnosis peaked in the spring. The PTB notification rate in the Hunan Province exhibited spatial clustering, concentrated mainly in the central-southern and northwestern regions of the province. This suggests that priority should be given to strengthening tuberculosis control efforts in these regions.
Data availability statement
The datasets presented in this article are not readily available because they are sourced from the Infectious Disease Information System and all data remain confidential. Requests to access the datasets should be directed to GH, MTg3NzQ5OTQyOTZAMTYzLmNvbQ==.
Ethics statement
The studies involving humans were approved by Medical Ethics Committee of Hunan Chest Hospital. The studies were conducted in accordance with the local legislation and institutional requirements. Written informed consent for participation was not required from the participants or the participants’ legal guardians/next of kin in accordance with the national legislation and institutional requirements.
Author contributions
GH: Data curation, Funding acquisition, Methodology, Software, Visualization, Writing – original draft. ZX: Data curation, Writing – review & editing. LB: Supervision, Writing – review & editing. JL: Conceptualization, Supervision, Writing – review & editing. SY: Software, Supervision, Writing – review & editing. HY: Methodology, Supervision, Writing – review & editing.
Funding
The author(s) declare that financial support was received for the research, authorship, and/or publication of this article. This study was supported by the Natural Science Foundation of Hunan Province (grant number: 2021JJ40281).
Acknowledgments
The authors thank the staff at all Centers for Disease Control and Prevention, tuberculosis-designated hospitals, and community healthcare centers in Hunan Province for implementing tuberculosis reporting and notification in their daily work.
Conflict of interest
The authors declare that the research was conducted in the absence of any commercial or financial relationships that could be construed as a potential conflict of interest.
Publisher’s note
All claims expressed in this article are solely those of the authors and do not necessarily represent those of their affiliated organizations, or those of the publisher, the editors and the reviewers. Any product that may be evaluated in this article, or claim that may be made by its manufacturer, is not guaranteed or endorsed by the publisher.
References
1. World Health Organization . Global Tuberculosis Report 2023. Geneva: World Health Organization (2023).
2. Xue, M, Zhong, J, Gao, M, Pan, R, Mo, Y, Hu, Y, et al. Analysis of spatial-temporal dynamic distribution and related factors of tuberculosis in China from 2008 to 2018. Sci Rep. (2023) 13:4974. doi: 10.1038/s41598-023-31430-0
3. Liu, MY, Li, QH, Zhang, YJ, Ma, Y, Liu, Y, Feng, W, et al. Spatial and temporal clustering analysis of tuberculosis in the mainland of China at the prefecture level, 2005–2015. Infect Dis Poverty. (2018) 7:106. doi: 10.1186/s40249-018-0490-8
4. Romanyukha, AA, Karkach, AS, Borisov, SE, Belilovsky, EM, Sannikova, TE, and Krivorotko, OI. Small-scale stable clusters of elevated tuberculosis incidence in Moscow, 2000–2015: Discovery and spatiotemporal analysis. Int J Infect Dis. (2020) 91:156–61. doi: 10.1016/j.ijid.2019.11.015
5. Lima, SVMA, Dos Santos, AD, Duque, AM, de Oliveira Goes, MA, da Silva Peixoto, MV, da Conceição, AD, et al. Spatial and temporal analysis of tuberculosis in an area of social inequality in Northeast Brazil. BMC Public Health. (2019) 19:873. doi: 10.1186/s12889-019-7224-0
6. Mesquita, CR, da Conceição, ML, de Oliveira, RAC, Conceição, EC, Garcez, JCD, Sousa, IFR, et al. Spatial analysis of tuberculosis patient flow in a neglected region of Northern Brazil. Trop Med Infect Dis. (2023):8. doi: 10.3390/tropicalmed8080397
7. Aceng, FL, Kabwama, SN, Ario, AR, Etwom, A, Turyahabwe, S, and Mugabe, FR. Spatial distribution and temporal trends of tuberculosis case notifications, Uganda: A ten-year retrospective analysis (2013–2022). BMC Infect Dis. (2024) 24:46. doi: 10.1186/s12879-023-08951-0
8. Huang, CC, Trevisi, L, Becerra, MC, Calderón, RI, Contreras, CC, Jimenez, J, et al. Spatial scale of tuberculosis transmission in Lima, Peru. Proc Natl Acad Sci USA. (2022) 119:e2207022119. doi: 10.1073/pnas.2207022119
9. Zhang, Y, Wang, XL, Feng, T, and Fang, CZ. Analysis of spatial-temporal distribution and influencing factors of pulmonary tuberculosis in China, during 2008–2015. Epidemiol Infect. (2018) 147:e25. doi: 10.1017/S0950268818002765
10. Li, L, Xi, Y, and Ren, F. Spatio-temporal distribution characteristics and trajectory similarity analysis of tuberculosis in Beijing, China. Int J Environ Res Public Health. (2016):13. doi: 10.3390/ijerph13030291
11. Ge, E, Zhang, X, Wang, X, and Wei, X. Spatial and temporal analysis of tuberculosis in Zhejiang Province, China, 2009–2012. Infect Dis Poverty. (2016) 5:11. doi: 10.1186/s40249-016-0104-2
12. Zhang, M, Chen, S, Luo, D, Chen, B, Zhang, Y, Wang, W, et al. Spatial-temporal analysis of pulmonary tuberculosis among students in the Zhejiang Province of China from 2007–2020. Front Public Health. (2023) 11:1114248. doi: 10.3389/fpubh.2023.1114248
13. Yu, Y, Wu, B, Wu, C, Wang, Q, Hu, D, and Chen, W. Spatial-temporal analysis of tuberculosis in Chongqing, China 2011–2018. BMC Infect Dis. (2020) 20:531. doi: 10.1186/s12879-020-05249-3
14. Rao, H, Shi, X, and Zhang, X. Using the Kulldorff’s scan statistical analysis to detect spatio-temporal clusters of tuberculosis in Qinghai Province, China, 2009–2016. BMC Infect Dis. (2017) 17:578. doi: 10.1186/s12879-017-2643-y
15. Alene, KA, Xu, Z, Bai, L, Yi, H, Tan, Y, Gray, DJ, et al. Spatiotemporal patterns of tuberculosis in Hunan Province, China. Int J Environ Res Public Health. (2021):18. doi: 10.3390/ijerph18136778
16. Zheng, J, Tang, Y, Zha, W, Liu, Y, Zhang, G, Hu, J, et al. Spatial distribution of tuberculosis in Hunan Province between 2012–2013: Analysis with geographic information system. Chin J Public Health. (2015) 31:1590–3. doi: 10.11847/zgggws2015-31-12-20
17. The People’s Government of Hunan Province, Introduction of Hunan. (2024). Available at: https://www.hunan.gov.cn/hnszf/jxxx/hngk/sqjs/sqjs.html (Accessed March 20, 2024).
18. National Health Commission of the People’s Republic of China . WS 288-2017 (2017). Beijing. Available at: http://www.nhc.gov.cn/cms-search/xxgk/getManuscriptXxgk.htm?id=0819ad84540b4d97a1644bbc6ec4306d (Accessed June 18, 2024).
19. National Health commission of the People’s Republic of China . Notice from the General Office of the National Health Commission on Adjusting the classification of infectious disease reports for pulmonary tuberculosis (2019). Beijing. Available at: http://www.nhc.gov.cn/jkj/s3589/201903/d779ae48db6446c28d1f5371ef09f5ab.shtml (Accessed March 1, 2024).
20. National Health commission of the People’s Republic of China . Notification of an adjustment to the classification of pulmonary tuberculosis reports (2017). Beijing. Available at: http://www.nhc.gov.cn/jkj/s3589/201707/e65698978c984013aa01b017f93dd75c.shtml (Accessed March 1, 2024).
21. Huo, XN, Li, H, Sun, DF, Zhou, LD, and Li, BG. Combining geostatistics with Moran’s I analysis for mapping soil heavy metals in Beijing, China. Int J Environ Res Public Health. (2012) 9:995–1017. doi: 10.3390/ijerph9030995
22. Anselin, L, Syabri, I, and Kho, Y. GeoDa: An introduction to spatial data analysis. Geogr Anal. (2006) 38:5–22. doi: 10.1111/j.0016-7363.2005.00671.x
23. Getis, A, and Ord, J. The analysis of spatial association by use of distance statistics. Geogr Analys. (1995) 27:93–115.
24. Kulldorff, M . A spatial scan statistic. Commun. Stat. (1997) 26:1481–96. doi: 10.1080/03610929708831995
25. Deng, T, Huang, Y, Yu, S, Gu, J, Huang, C, Xiao, G, et al. Spatial-temporal clusters and risk factors of hand, foot, and mouth disease at the district level in Guangdong Province, China. PLoS One. (2013) 8:e56943. doi: 10.1371/journal.pone.0056943
26. Dong, Z, Wang, QQ, Yu, SC, Huang, F, Liu, JJ, Yao, HY, et al. Age-period-cohort analysis of pulmonary tuberculosis reported incidence, China, 2006–2020. Infect Dis Poverty. (2022) 11:85. doi: 10.1186/s40249-022-01009-4
27. Duan, Y, Cheng, J, Liu, Y, Fang, Q, Sun, M, Cheng, C, et al. Epidemiological characteristics and spatial-temporal analysis of tuberculosis at the county-level in Shandong Province, China, 2016–2020. Trop Med Infect Dis. (2022) 7:346. doi: 10.3390/tropicalmed7110346
28. Zhang, Y, Ye, J, Hou, S, Lu, X, Yang, C, Pi, Q, et al. Spatial-temporal analysis of pulmonary tuberculosis in Hubei Province, China, 2011–2021. PLoS One. (2023) 18:e0281479. doi: 10.1371/journal.pone.0281479
29. Thorpe, LE, Frieden, TR, Laserson, KF, Wells, C, and Khatri, GR. Seasonality of tuberculosis in India: Is it real and what does it tell us? Lancet. (2004) 364:1613–4. doi: 10.1016/S0140-6736(04)17316-9
30. Cui, Z, Lin, D, Chongsuvivatwong, V, Zhao, J, Lin, M, Ou, J, et al. Spatiotemporal patterns and ecological factors of tuberculosis notification: A spatial panel data analysis in Guangxi, China. PLoS ONE. (2019) 14:e0212051. doi: 10.1371/journal.pone.0212051
31. Liao, CM, Hsieh, NH, Huang, TL, Cheng, YH, Lin, YJ, Chio, CP, et al. Assessing trends and predictors of tuberculosis in Taiwan. BMC Public Health. (2012) 12:29. doi: 10.1186/1471-2458-12-29
32. Leung, CC, Yew, WW, Chan, TYK, Tam, CM, Chan, CY, Chan, CK, et al. Seasonal pattern of tuberculosis in Hong Kong. Int J Epidemiol. (2005) 34:924–30. doi: 10.1093/ije/dyi080
33. Zhang, Y, Zhang, L, Gao, W, Li, M, Luo, Q, Xiang, Y, et al. The impact of COVID-19 pandemic on reported tuberculosis incidence and mortality in China: An interrupted time series analysis. J Glob Health. (2023) 13:06043. doi: 10.7189/jogh.13.06043
34. Xu, J, Wang, Y, Liu, F, and Yang, H. Changes of tuberculosis infection in mainland China before and after the COVID-19 pandemic. J Infect. (2023) 86:154–225. doi: 10.1016/j.jinf.2022.12.008
35. Mou, J, Griffiths, SM, Fong, H, and Dawes, MG. Health of China’s rural-urban migrants and their families: A review of literature from 2000 to 2012. Br Med Bull. (2013) 106:19–43. doi: 10.1093/bmb/ldt016
36. Huang, L, Li, XX, Abe, EM, Xu, L, Ruan, Y, Cao, CL, et al. Spatial-temporal analysis of pulmonary tuberculosis in the northeast of the Yunnan Province, People’s Republic of China. Infect Dis Poverty. (2017) 6:53. doi: 10.1186/s40249-017-0268-4
37. Gilmour, B, Xu, Z, Bai, L, Alene, KA, and Clements, ACA. The impact of ethnic minority status on tuberculosis diagnosis and treatment delays in Hunan Province China. BMC Infect Dis. (2022) 22:90. doi: 10.1186/s12879-022-07072-4
38. Zhang, G, Yu, Y, Zhang, W, Shang, J, Chen, S, Pang, X, et al. Influence of COVID-19 for delaying the diagnosis and treatment of pulmonary tuberculosis-Tianjin, China. Front Public Health. (2022) 10:937844. doi: 10.3389/fpubh.2022.937844
39. Feng, Y, Xu, Y, Yang, Y, Yi, G, Su, H, Chen, H, et al. Effects of smoking on the severity and transmission of pulmonary tuberculosis: A hospital-based case control study. Front Public Health. (2023) 11:1017967. doi: 10.3389/fpubh.2023.1017967
40. Weiangkham, D, Umnuaypornlert, A, Saokaew, S, Prommongkol, S, and Ponmark, J. Effect of alcohol consumption on relapse outcomes among tuberculosis patients: A systematic review and meta-analysis. Front Public Health. (2022) 10:962809. doi: 10.3389/fpubh.2022.962809
41. Wigger, GW, Bouton, TC, Jacobson, KR, Auld, SC, Yeligar, SM, and Staitieh, BS. The impact of alcohol use disorder on tuberculosis: A review of the epidemiology and potential immunologic mechanisms. Front Immunol. (2022) 13:864817. doi: 10.3389/fimmu.2022.864817
42. Zou, S, Tan, Y, Xiang, Y, Liu, Y, Zhu, Q, Wu, S, et al. The role of CD4+CD8+ T cells in HIV infection with tuberculosis. Front Public Health. (2022) 10:895179. doi: 10.3389/fpubh.2022.895179
43. Ssekamatte, P, Sande, OJ, van Crevel, R, and Biraro, IA. Immunologic, metabolic and genetic impact of diabetes on tuberculosis susceptibility. Front Immunol. (2023) 14:1122255. doi: 10.3389/fimmu.2023.1122255
44. Zhang, H, Sun, R, Wu, Z, Liu, Y, Chen, M, Huang, J, et al. Spatial pattern of isoniazid-resistant tuberculosis and its associated factors among a population with migrants in China: A retrospective population-based study. Front Public Health. (2024) 12:1372146. doi: 10.3389/fpubh.2024.1372146
45. Liu, K, Chen, S, Zhang, Y, Li, T, Xie, B, Wang, W, et al. Tuberculosis burden caused by migrant population in Eastern China: Evidence from notification records in Zhejiang Province during 2013–2017. BMC Infect Dis. (2022) 22:109. doi: 10.1186/s12879-022-07071-5
46. Pradipta, IS, Idrus, LR, Probandari, A, Puspitasari, IM, Santoso, P, Alffenaar, JC, et al. Barriers to optimal tuberculosis treatment services at community health centers: A qualitative study from a high prevalent tuberculosis country. Front Pharmacol. (2022) 13:857783. doi: 10.3389/fphar.2022.857783
47. Nardell, EA . Indoor environmental control of tuberculosis and other airborne infections. Indoor Air. (2016) 26:79–87. doi: 10.1111/ina.12232
Keywords: tuberculosis, spatiotemporal analysis, spatial autocorrelation analysis, clustering, China
Citation: Huang G, Xu Z, Bai L, Liu J, Yu S and Yao H (2024) Spatiotemporal analysis of tuberculosis in the Hunan Province, China, 2014–2022. Front. Public Health. 12:1426503. doi: 10.3389/fpubh.2024.1426503
Edited by:
Chiara de Waure, University of Perugia, ItalyReviewed by:
Marie Nancy Séraphin, University of Florida, United StatesLayth Al-Salihi, National Tuberculosis Institute, Iraq
Kui Liu, Zhejiang Provincial Center for Disease Control and Prevention, China
Copyright © 2024 Huang, Xu, Bai, Liu, Yu and Yao. This is an open-access article distributed under the terms of the Creative Commons Attribution License (CC BY). The use, distribution or reproduction in other forums is permitted, provided the original author(s) and the copyright owner(s) are credited and that the original publication in this journal is cited, in accordance with accepted academic practice. No use, distribution or reproduction is permitted which does not comply with these terms.
*Correspondence: Hongyan Yao, eWFvaHlAY2hpbmFjZGMuY24=