 Haonan Tian
 Aozhe Wang
 Han Wu
 Cailiang Zhou2
95% of researchers rate our articles as excellent or good
Learn more about the work of our research integrity team to safeguard the quality of each article we publish.
Find out more
ORIGINAL RESEARCH article
Front. Public Health , 21 June 2024
Sec. Public Health Education and Promotion
Volume 12 - 2024 | https://doi.org/10.3389/fpubh.2024.1425060
This article is part of the Research Topic Exploring the Interaction between Health-promoting and Health Risk Behaviors in Health, Volume II View all 23 articles
Background: Previous observational studies have shown a correlation between leisure sedentary behaviors (LSB) and physical activity (PA) with the incidence of obstructive sleep apnea (OSA). However, the causal associations remain unknown. Therefore, our study used bidirectional two-sample Mendelian randomization (MR) to identify potential causal relationships between LSB/PA and OSA.
Methods: We sourced genetic variation data for LSB and PA from the UK Biobank, while data on OSA were collected from the FinnGen study. The primary analysis method employed was the inverse variance weighted (IVW) approach, complemented by the weighted median and MR-Egger methods. For sensitivity analyses, we conducted Cochran’s Q test, the MR-Egger intercept test, the MR-PRESSO global test, and the leave-one-out analysis.
Results: IVW analyses showed that genetically predicted leisure television watching (odds ratio [OR] = 1.38, 95% confidence interval [CI] = 1.09–1.75, p = 0.007) and computer use (OR = 1.48, 95% CI = 1.15–1.92, p = 0.002) significantly increased the risk of OSA. Conversely, self-reported vigorous physical activity (VPA) (OR = 0.33, 95% CI = 0.11–0.98, p = 0.046) may reduce the risk of OSA. No causal effects on OSA risk were observed for driving or self-reported moderate-to-vigorous physical activity. Furthermore, the reverse MR analysis indicated no significant causal relationship between OSA and any LSB/PA phenotype. Sensitivity tests showed no significant heterogeneity or horizontal pleiotropy.
Conclusion: This study suggests that leisurely television watching and computer use are risk factors for OSA, while VPA may be a protective factor. Additionally, OSA does not affect PA or LSB levels. We recommend reducing sedentary activities, particularly television watching and computer use, and prioritizing VPA to reduce the risk of OSA. Further research in diverse populations and settings is needed to validate these findings.
Obstructive sleep apnea (OSA) is a sleep disorder characterized by repeated collapse or complete obstruction of the upper airway during sleep, resulting in apnea or hypoventilation. The primary pathophysiological characteristics of OSA include intermittent hypoxia and sleep fragmentation (1). OSA is closely associated with metabolic disorders, cardiovascular diseases, and neuropsychiatric diseases (2–6). OSA has become a significant global public health challenge, affecting approximately one billion adults worldwide (7, 8). Therefore, it is crucial to have a comprehensive understanding of the potential risks and protective factors for OSA to develop new prevention and intervention measures.
Leisure sedentary behaviors (LSB) is defined as low-energy expenditure activities in which the metabolic equivalent is ≤1.5 for maintaining body posture by lying supine or sitting during waking hours, including the three phenotypes of television watching, computer use, and driving (9). Physical activity (PA) is defined as musculoskeletal movement that consumes energy (10). Advances in technology have resulted in significant lifestyle changes, including an increased prevalence of LSB and a reduced level of PA. The coronavirus disease 2019 pandemic has further exacerbated this trend by limiting opportunities for PA while promoting LSB (11). Scientific evidence has shown that LSB is associated with higher all-cause mortality rates, while PA can lower this risk (12).
Observational research consistently demonstrates a positive correlation between LSB and an increased risk of OSA (13–15), while PA is inversely associated with OSA risk (16). The nocturnal movement of fluid from the lower extremities toward the neck is a predisposing factor to OSA (1). LSB impedes venous return, leading to fluid accumulation in the lower extremities (17). In contrast, PA reduces the risk of OSA by activating the muscular venous pump, thereby increasing venous return and reducing fluid accumulation in the lower extremities (18). Additionally, some studies suggest that OSA may lead to lower PA levels (19, 20). OSA-induced hypoxia may lead to the transformation of type I muscle fibers into type II muscle fibers (20). Type I muscle fibers are slow muscle fibers that produce energy through oxidative metabolism and are resistant to fatigue. Type II muscle fibers are fast muscle fibers that produce energy through the glycolytic pathway and are more susceptible to fatigue. The OSA-induced transformation of the type of muscle fiber leads to a decrease in overall PA levels. At the same time, OSA increases inflammatory cytokines expression (21). Inflammatory cytokines not only act directly on muscle fibers, interfering with their signaling and metabolic processes, leading to the accelerated breakdown of muscle proteins, but also affect the function of mitochondria in muscle fibers, thereby affecting muscle contraction efficiency and endurance (22, 23). These changes lead to greater muscle fatigue, further reducing PA levels. These mechanisms illustrate the potential bidirectional causality between LSB, PA, and OSA. On the one hand, increased sedentary behavior and reduced physical activity can exacerbate OSA through fluid redistribution and metabolic changes. On the other hand, OSA can contribute to decreased physical activity through muscle fiber transformation, increased fatigue, and inflammation.
However, it is not possible to establish a causal inference between LSB/PA and OSA in observational studies due to the limitations in evidence quality, the potential for reverse causation, and the influence of residual confounders. Mendelian randomization (MR) offers a powerful alternative to overcome these limitations by using genetic variations as instrumental variables (IVs) to explore causal relationships between exposures and outcomes based on data from Genome-Wide Association Studies (GWAS) (24). This approach capitalizes on the random assortment of genetic variants at conception, ensuring that environmental risk factors do not influence these genetic variants (25). This randomization process effectively reduces the impact of confounding variables and reverse causality, providing a more reliable basis for causal inference compared to traditional observational studies (26).
Although there is a wealth of research on the association between LSB/PA and OSA, there is a scarcity of studies employing MR to disentangle these relationships. Recently, a valuable MR study explored the causal associations between 34 modifiable risk factors and OSA (27). This study found that vigorous PA could reduce the risk of developing OSA, whereas moderate PA and sedentary behavior did not significantly affect OSA. However, this study determined the phenotypes of moderate PA and vigorous PA using the criterion of “days per week with at least 10 min of moderate PA or vigorous PA,” which has certain limitations. Additionally, the study did not classify the LSB phenotypes, despite the possibility that different LSB phenotypes might have varying impacts on OSA risk. Moreover, no MR studies have examined the effects of OSA on LSB and PA. Our study addresses these gaps using a bidirectional two-sample MR method to assess the causal relationship between LSB/PA and OSA. In our study, PA is determined by calculating weekly metabolic equivalent minutes, providing a more accurate measure of activity. We also provide detailed classifications of LSB phenotypes, including television watching, non-work-related computer use, and driving, to explore the specific impacts of different LSB phenotypes on OSA. Additionally, we investigate the effects of OSA on PA and LSB. Our study uncovers more precise causal relationships by addressing previous research limitations and employing a more detailed and accurate classification of PA and LSB. This comprehensive understanding provides valuable insight into potential preventive intervention strategies for OSA and informs better-targeted interventions.
Our bidirectional two-sample MR analysis consisted of four key steps. First, we identified single nucleotide polymorphisms (SNPs) associated with exposures from large-scale GWAS in publicly available databases. These SNPs served as IVs to ensure the robustness of the MR analyses. Second, we selected genetic data related to outcomes from different databases to prevent sample overlap and potential biases. In the third step, we conducted the bidirectional two-sample MR analysis, using the identified SNPs as instrumental variables to explore the causal relationships in both directions. Finally, we conducted a sensitivity analysis to confirm the robustness of our result. To ensure the reliability of MR findings, three key assumptions must be met: (i) the IVs are closely associated with the specific exposures; (ii) the IVs are independent of any potential confounders; and (iii) the IVs only affect outcomes through exposures (28). Additionally, to avoid biases arising from racial differences, both the genetic data for exposures and outcomes in our MR study were derived from populations of European ancestry. Figure 1 illustrates the design framework for this study.
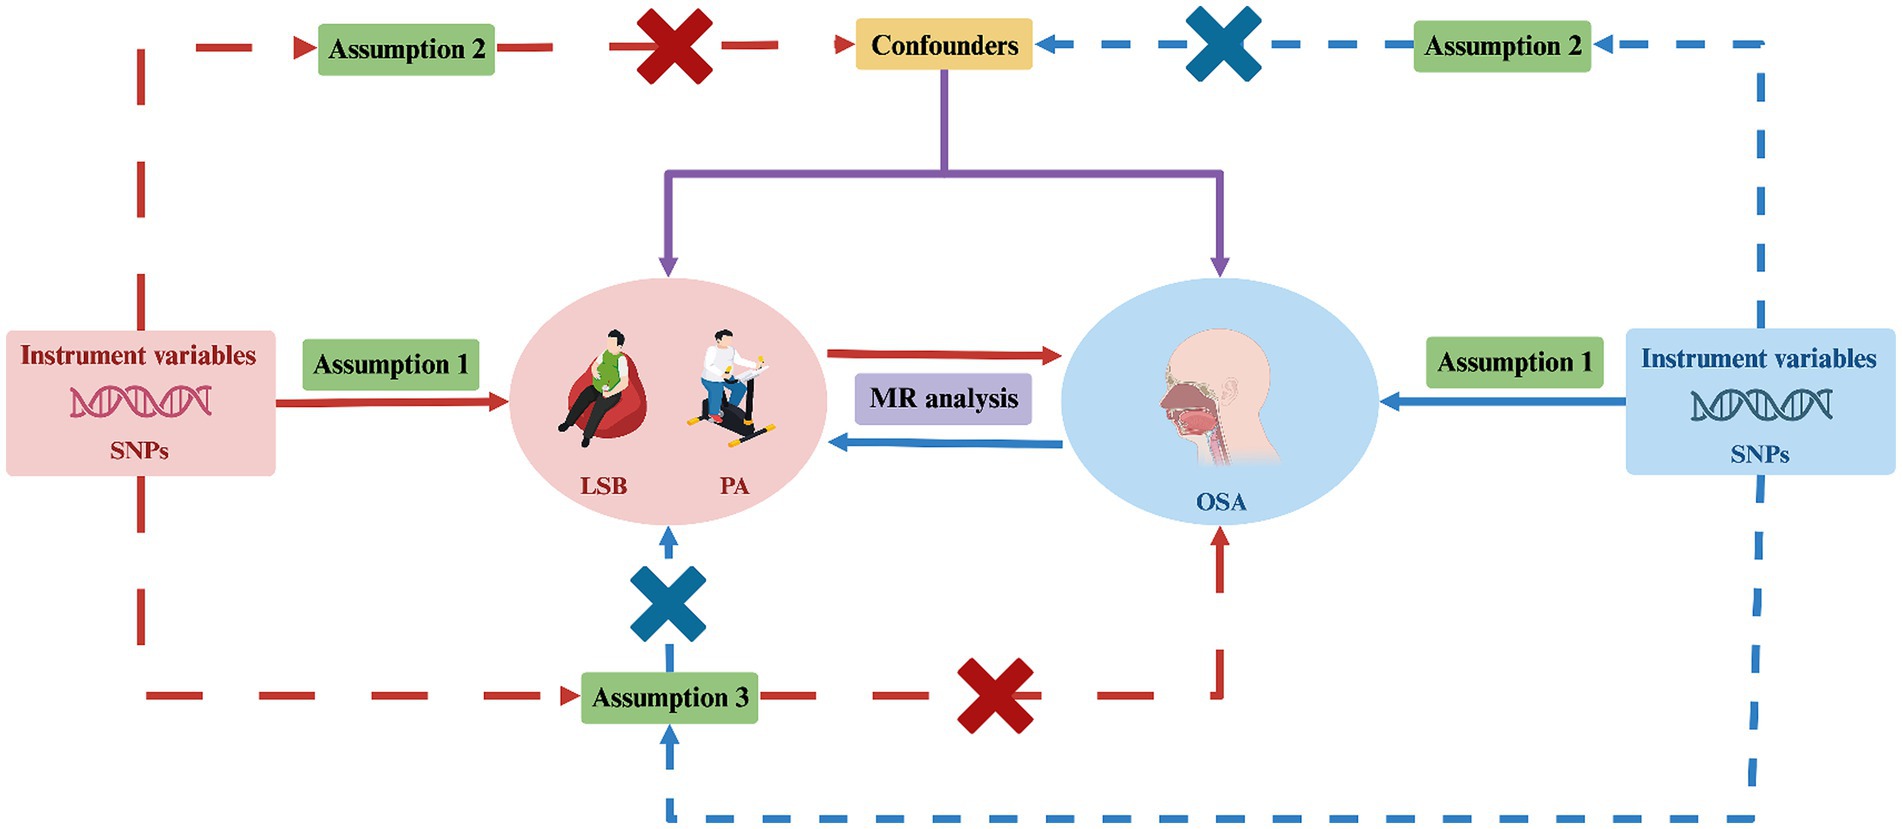
Figure 1. Study design for investigating the causal relationship between LSB/PA and OSA using bidirectional two-sample MR. MR, Mendelian randomization; SNPs, single-nucleotide polymorphisms; LSB, leisure sedentary behavior; PA, physical activity; OSA, obstructive sleep apnea. Created with BioRender.com (agreement number: DY26TQ4FRC).
PA related summary statistics were derived from published GWAS studies (Table 1) based on those conducted by the UK Biobank (29). The UK Biobank is a large-scale prospective cohort research program that includes over 500,000 participants of European ancestry, aged between 40 and 69 years, recruited from across the UK. The data collection period spanned from 2006 to 2010, with comprehensive information gathered on various health and lifestyle factors using validated scales (30). This study used two PA phenotypes: self-reported moderate-to-vigorous physical activity (MVPA) and self-reported vigorous physical activity (VPA). Self-reported PA data were collected using a touch-screen questionnaire, a fully validated short version of the International Physical Activity Questionnaire (31–33). The questionnaire evaluated 377,234 participants’ PA levels. For moderate PA, participants were asked: “On how many days in a typical week do you engage in at least 10 min of moderate physical activity, such as light weight-bearing activities or riding at a normal pace? (excluding walking).” For VPA, participants were asked: “On how many days in a typical week do you perform at least 10 min of vigorous physical activity? (These are activities that make you sweat or have difficulty breathing, such as fast cycling, aerobics, and weight lifting).” After removing outliers, MVPA was obtained by calculating the sum of the metabolic equivalents of moderate PA and the metabolic equivalents of VPA. The skewed distribution of the MVPA data necessitated an inverse normalization before conducting the GWAS analysis. VPA has been shown to have high heritability (29), so it was analyzed separately. It is important to note that the VPA data exhibited high skewness and had zero inflation, so it was processed as a dichotomous result to facilitate subsequent analyses.
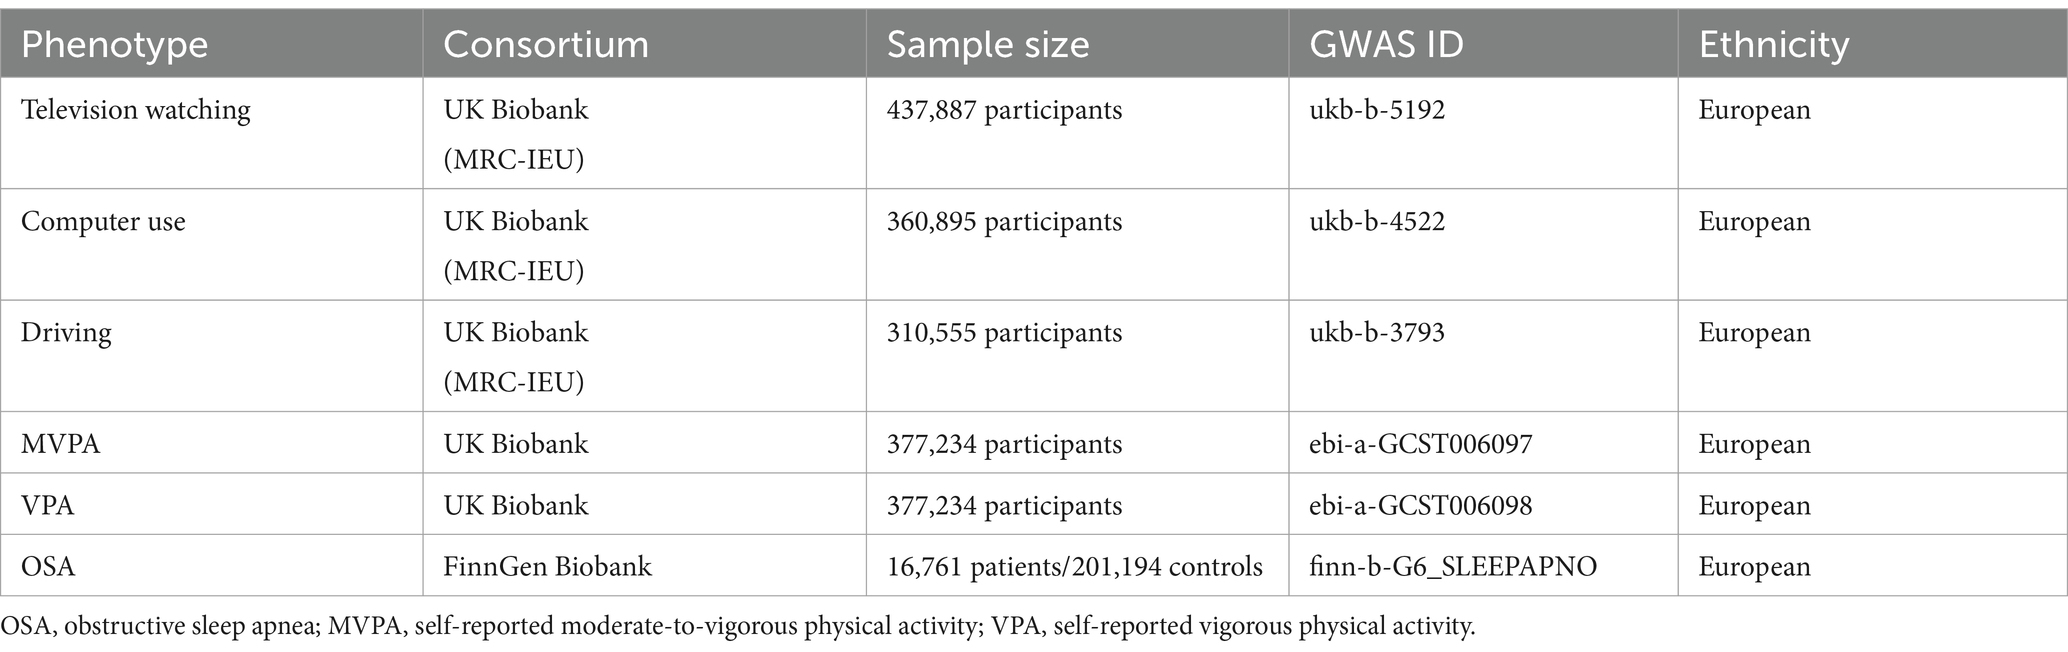
Table 1. MR analyses data sources.
Data related to LSB are derived from the MRC IEU OpenGWAS database,1 developed by the MRC Integrated Epidemiology Unit at the University of Bristol (34). The database currently contains 346.6 billion genetic associations from 50,044 GWAS datasets covering different human phenotypes and disease outcomes in different populations. The LSB consists of three phenotypes: television watching, non-work-related computer use, and driving (Table 1). All three phenotypes were obtained from the UK Biobank data section of the MRC IEU OpenGWAS database (35). To assess the LSB, each participant was asked three questions: “How many hours do you spend watching television each day?,” “How many hours do you spend using a computer for non-work purposes each day?,” and “How many hours do you spend driving each day?.” Based on these questions, the number of individuals exhibiting phenotypes of television watching, non-work-related computer use, and driving is 437,887, 360,895, and 310,555, respectively.
We extracted candidate genetic instruments for OSA from a recent GWAS involving 16,761 patients and 201,194 controls in the FinnGen Study (36). FinnGen2 is a large-scale biobank project in Finland that aims to collect and analyze genomic and health data from 500,000 participants to improve human health through genetic research. OSA diagnoses were based on the International Statistical Classification of Diseases (ICD) codes (ICD-10: G47.3, R06.5; ICD-9:3472A), and were supplemented by clinical examination, subjective symptoms, and sleep registration with an apnoea-hypopnoea index ≥5/h or a respiratory event index ≥5/h. The FinnGen dataset consisted of individuals of European ancestry.
We implemented a meticulous selection process to ensure the quality of IVs, aiming to meet the three core assumptions required for MR analysis (Figure 2). Initially, we identified genome-wide significant SNPs from the GWAS of the targeted exposure (p < 5 × 10⁻⁸). Second, the PLINK algorithm was used to identify SNPs not in linkage disequilibrium (r2 < 0.001; clumping distance = 10,000 kb). Third, we manually screened and excluded any IVs potentially related to the outcome traits using the PhenoScanner V2 database.3 Finally, we excluded SNPs with an F-statistic <10 to prevent biases caused by weak instruments. The F-statistic is calculated using the formula , where N denotes the sample size and R2 represents the proportion of the variance in the exposure that is explained by the IVs (37, 38).
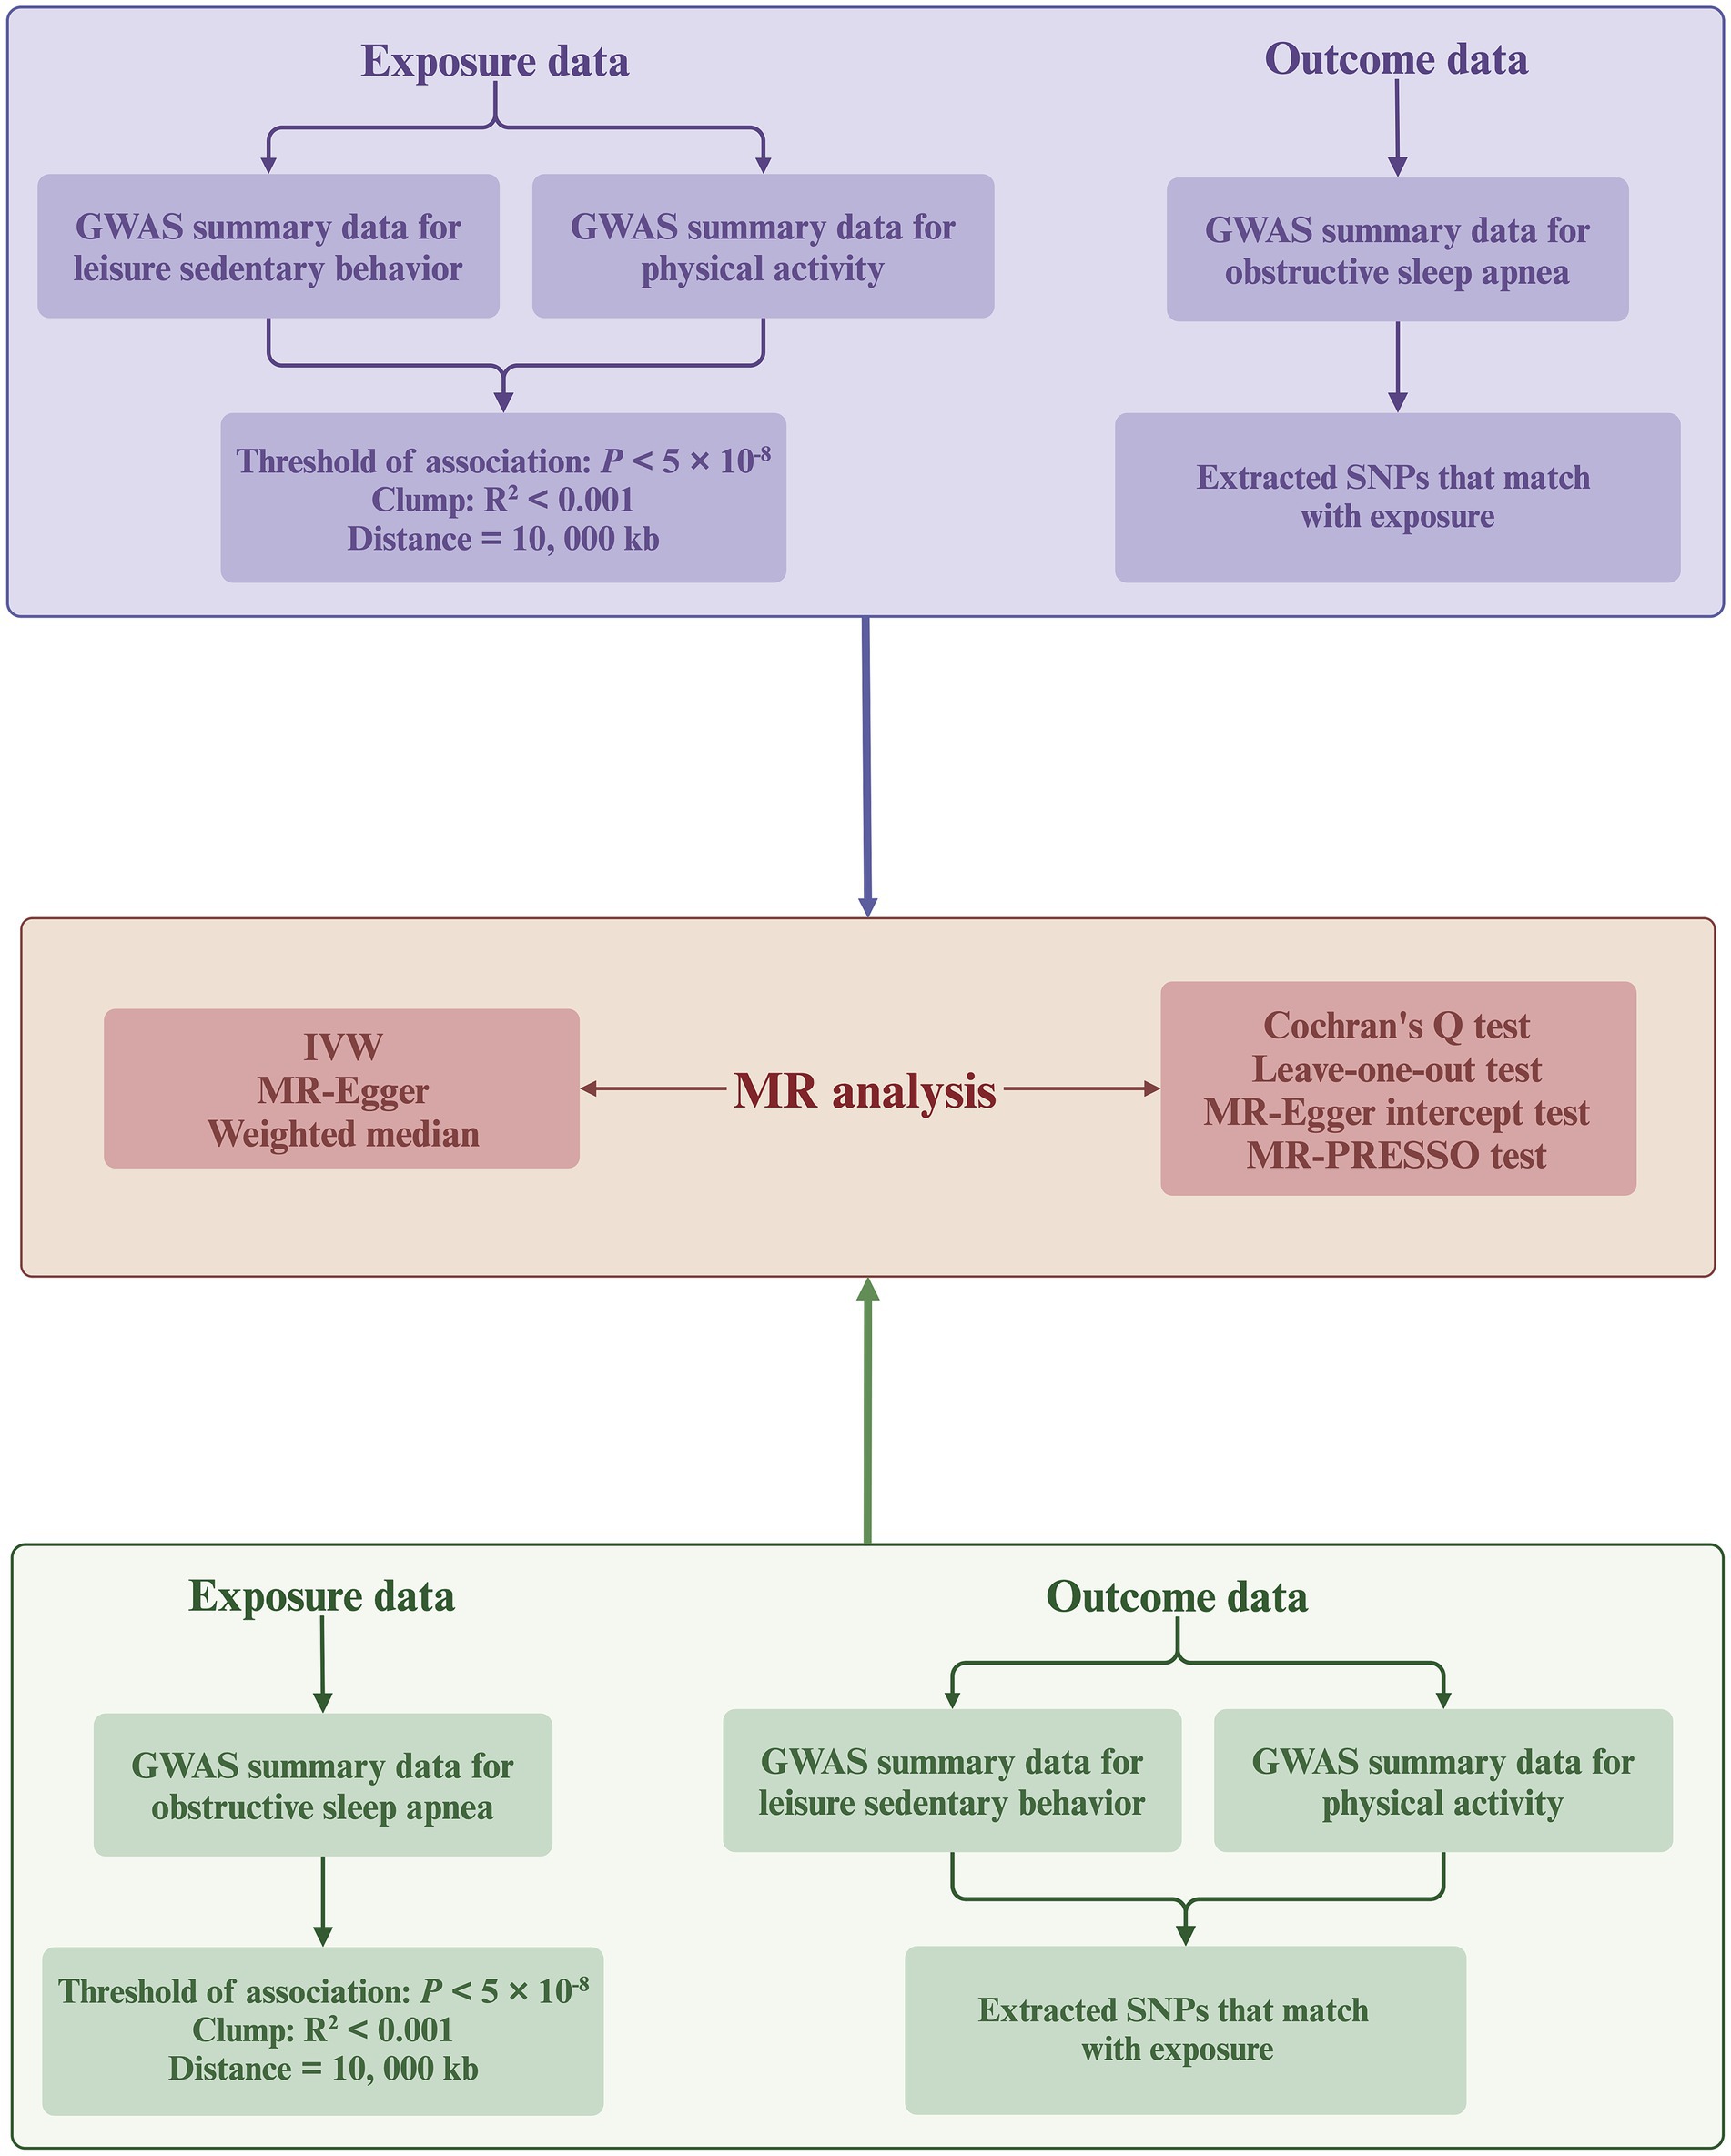
Figure 2. Flowchart of the bidirectional MR analysis. MR, Mendelian randomization; SNPs, single-nucleotide polymorphisms; IVW, inverse-variance weighted; GWAS, genome-wide association study. Created with BioRender.com (agreement number: KT26TQ67AD).
This study utilizes a bidirectional two-sample MR approach (Figure 2), primarily employing the inverse variance weighted (IVW) method to deduce causal relationships. The IVW method utilizes meta-analysis to aggregate Wald ratio estimates from each SNP, deriving a consolidated effect estimate (39). Under the assumption that all SNPs are valid IVs (0% null IVs), meaning there is no horizontal pleiotropy (IVs influence the outcome only through the exposure), the IVW method is considered the most reliable for causal inference among all MR analysis approaches (40). However, the IVW method may lead to biased conclusions in the presence of horizontal pleiotropy (41). Therefore, we supplement the IVW method with the weighted median and MR-Egger methods. The weighted median method can provide consistent causal estimates even if up to 50% of the SNPs violate the IVs validity assumption (50% null IVs) (42). The MR-Egger method provides robust estimates under the scenario where all SNPs violate the IVs validity assumption (100% null IVs) (43). In cases of inconsistency across the directional results of different MR analyses, we establish a stricter instrument p-value threshold to ensure reliability (44).
To ensure the robustness and reliability of the MR results, we performed various sensitivity analyses. Initially, Cochran’s Q test assessed heterogeneity among SNPs in the IVW analysis (45). The p-value > 0.05 indicates no significant heterogeneity, allowing the use of a fixed effect model. We employed the IVW method with a multiplicative random effects model in the presence of heterogeneity (p-value < 0.05). Subsequently, we applied the Mendelian randomization pleiotropy residual sum and outlier (MR-PRESSO) test to identify SNPs outliers with pleiotropic effects. After removing outliers, we performed an outlier-adjusted MR analysis to produce unbiased causal effect estimates (46). Third, the MR-Egger regression intercept test was used to evaluate horizontal pleiotropy. MR-Egger regression, developed from Egger regression, uses the formula , where represents the effect of the IVs on the outcome, represents the indirect effect of the IVs on the outcome through the exposure, and represents the estimated average horizontal pleiotropic effect. An intercept with p-value < 0.05 indicates the presence of horizontal pleiotropy (43). Finally, we conducted a leave-one-out (LOO) analysis to investigate whether specific SNPs strongly drive the causal relationship. This method sequentially excluded SNPs associated with the exposure and repeated the IVW analysis to observe if there were statistical differences in the results before and after exclusion.
All statistical analyses were conducted using the TwoSampleMR (version 0.5.7) and MR-PRESSO (version 1.0) packages within R (version 4.3.3). In this study, due to the multiple tests involving five exposure variables, a Bonferroni-adjusted p-value < 0.01 was used as the significance threshold to rigorously control the overall Type I error rate. Associations with a p-value below 0.05 but above 0.01 were regarded as nominal evidence of association, indicating potential relationships that may merit further investigation. The results of the MR analyses are presented as odds ratios (OR) with the corresponding 95% confidence interval (CI).
All data used in this study were derived from publicly accessible online GWAS databases. The original authors of these GWAS had already secured all necessary ethical approvals and participant consents. Because our research does not involve direct interaction with human subjects or the collection of new data, but rather re-analyzes existing datasets, it does not require additional ethical or moral review.
We applied strict selection criteria to identify 187 SNPs associated with LSB, which were subsequently used as IVs. Of these SNPs, 106 were associated with television watching, 76 with computer use, and 5 with driving. All F-statistics used for the IVs of LSB were > 10, ranging from 16.60 to 83.85. The median F-statistics for television watching, computer use, and driving were 20.61, 21.43, and 17.69, respectively, suggesting that there is no weak instrument bias. Supplementary Tables S1–S3 present detailed data. For PA, a total of 24 independent SNPs were selected as IVs. Of these, 17 SNPs were associated with MVPA and 7 SNPs with VPA. All F-statistics for the IVs used for PA exceeded 10, ranging from 27.51 to 58.64. The median F-statistics for MVPA and VPA were 29.39 and 39.67, respectively, suggesting that the weak instrumental bias was absent. Supplementary Tables S4, S5 list the results. The reverse MR analysis included a total of 5 independent SNPs as IVs of OSA. All F-statistics used for the IV of OSA were > 10, ranging from 504.94 to 1117.14, with a median of 542.04. This suggests that the weak instrumental bias is not present. Supplementary Table S6 presents the results.
IVW analysis revealed that television watching significantly increased the risk of OSA (OR = 1.38, 95% CI = 1.09–1.75, p = 0.007) as shown in Figure 3. In addition, the weighted median and MR-Egger methods showed a consistent direction, although the observed trends were not statistically significant. For the causality between computer use and OSA, IVW analysis revealed a significant association between computer use and increased risk of OSA (OR = 1.48, 95% CI = 1.15–1.92, p = 0.002). Similarly, weighted median analysis supported this causal association (OR = 1.78, 95% CI = 1.22–2.58, p = 0.002). The MR-Egger method analysis showed a consistent direction, although the observed trends were not statistically significant. However, among these three methods of MR analysis, there was no evidence to suggest a causal association between driving and OSA.
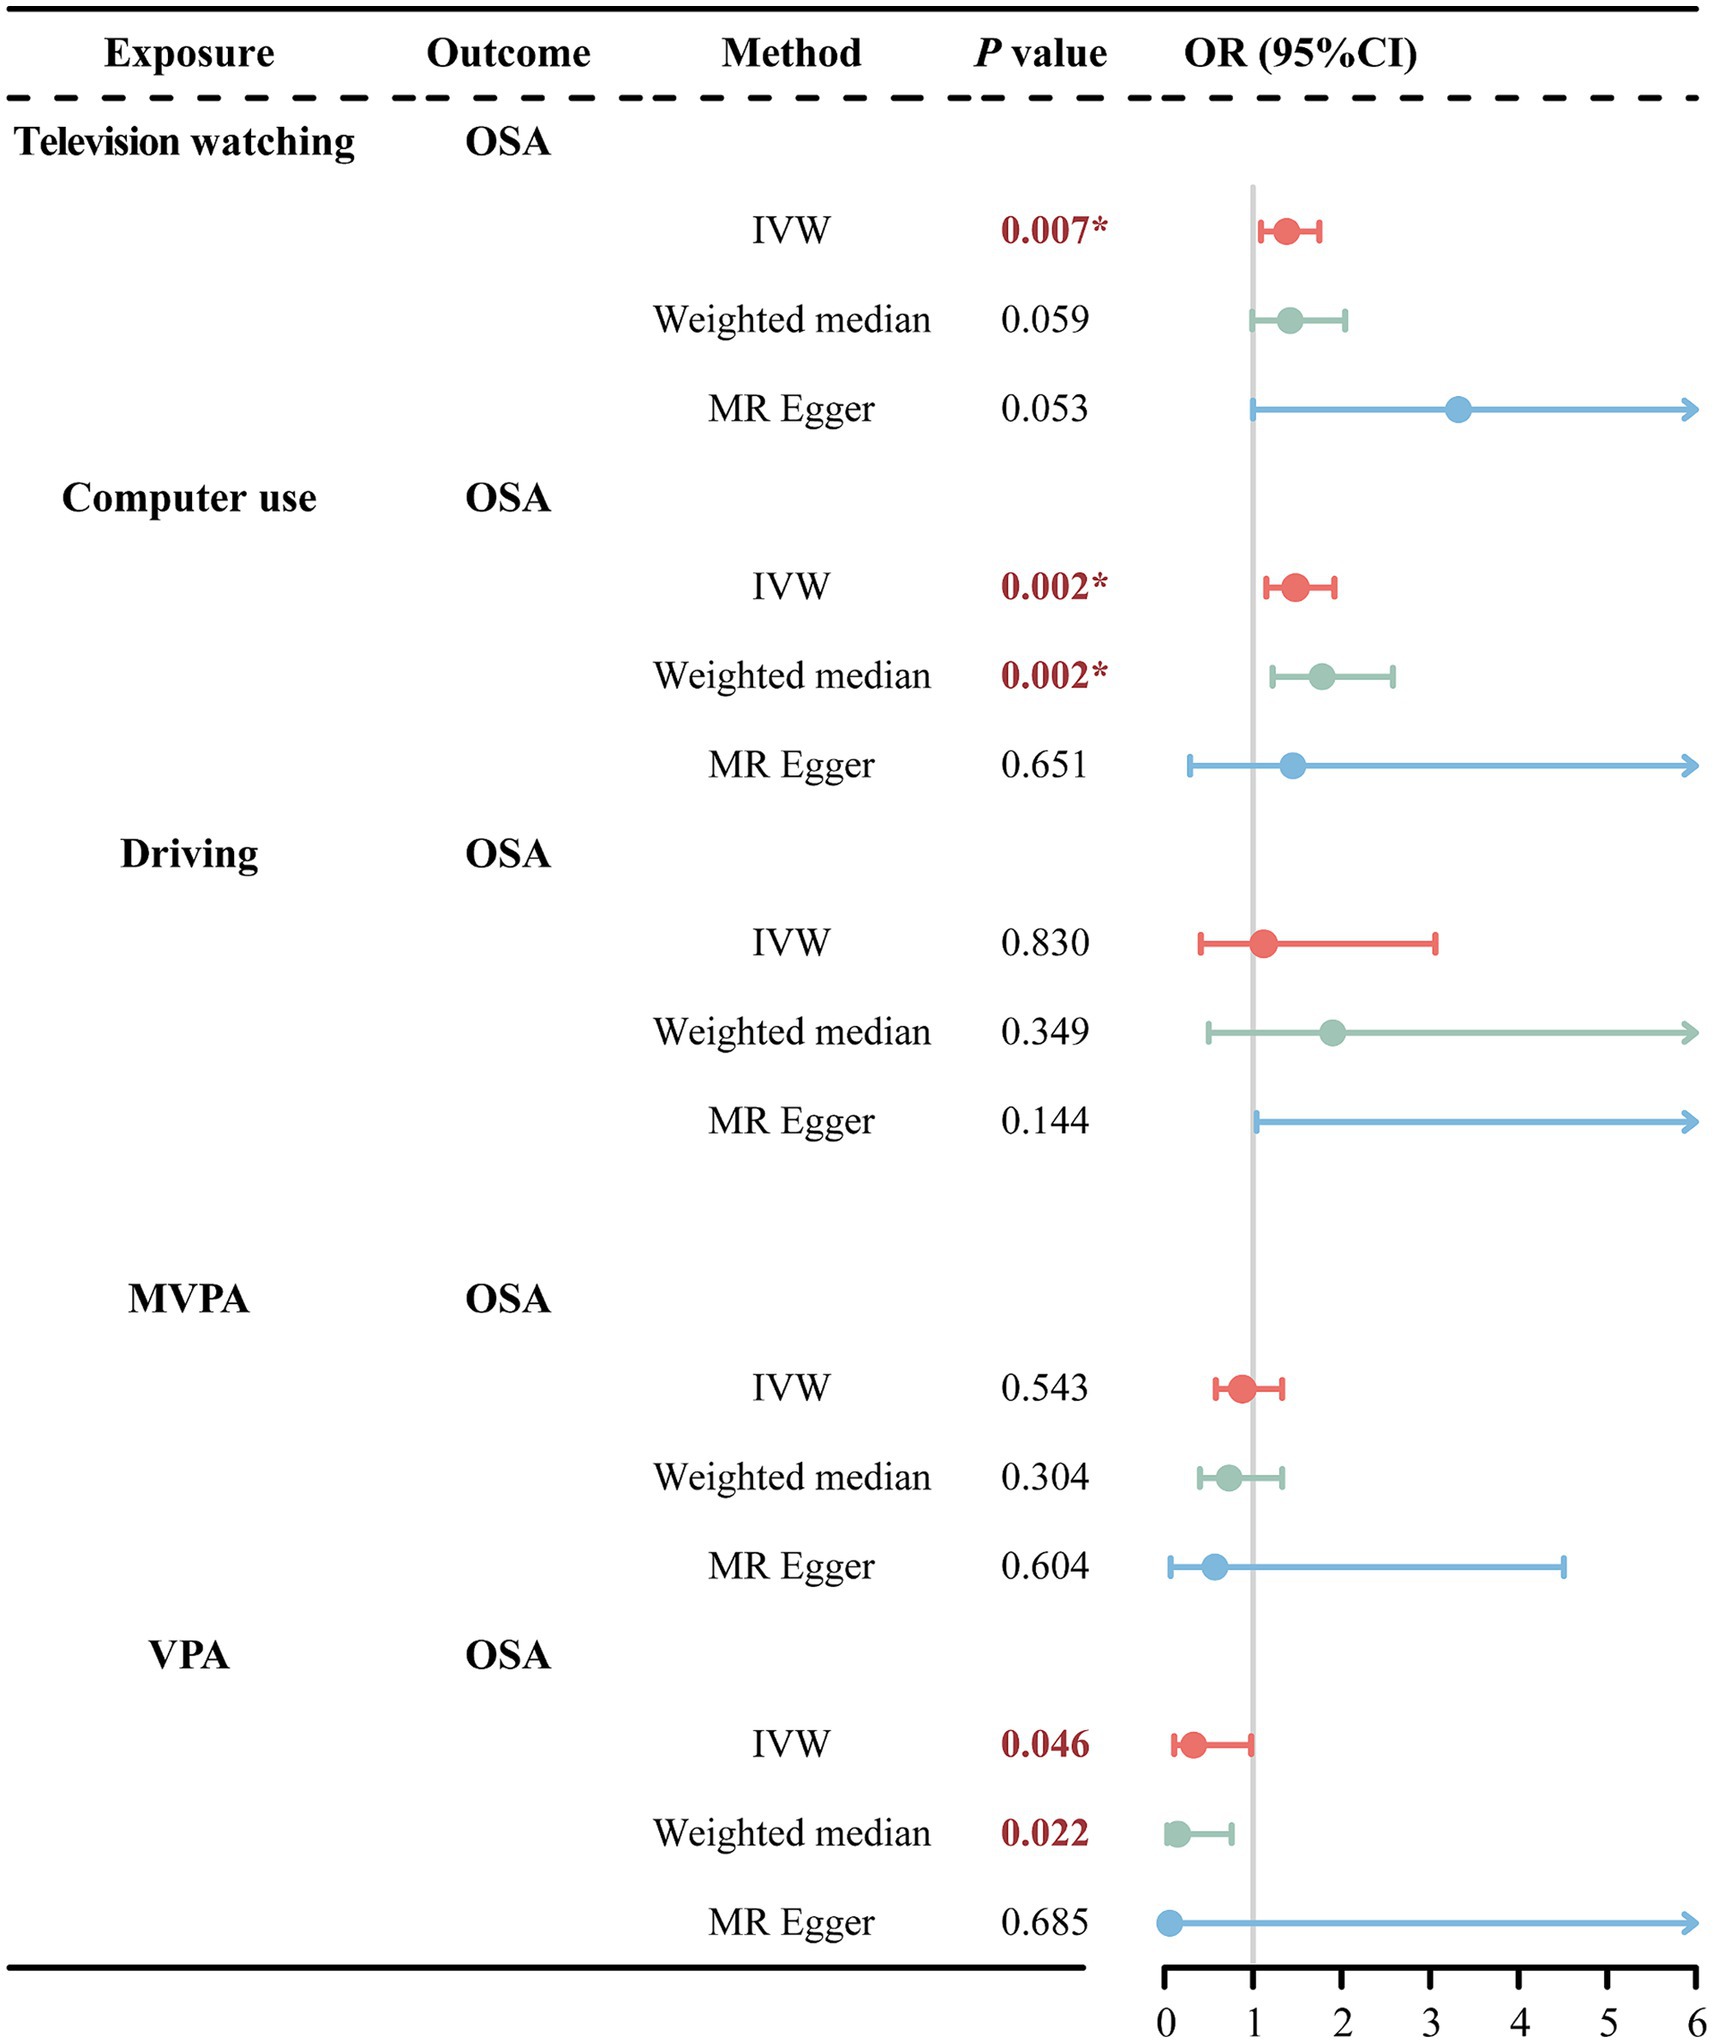
Figure 3. MR estimates results of causal effect of LSB/PA on OSA. OSA, obstructive sleep apnea; MVPA, self-reported moderate-to-vigorous physical activity; VPA, self-reported vigorous physical activity; IVW, inverse variance weighted; OR, odds ratios; 95%CI, 95% confidence interval; *p < 0.01.
In the PA phenotype, IVW analysis showed a nominal association between VPA and reduced risk of OSA (OR = 0.33, 95% CI = 0.11–0.98, p = 0.046). The weighted median analysis also presented the nominal association (OR = 0.15, 95% CI = 0.03–0.76, p = 0.022). Consistently, the MR-Egger method showed a similar direction, though not statistically significant. However, among these three methods of MR analysis—IVW, Weighted Median, and MR-Egger—there was no statistically significant evidence (p > 0.05) to suggest a causal association between driving and OSA.
IVW analysis revealed a nominally significant association between OSA and MVPA (OR = 0.97, 95% CI = 0.94–0.99, p = 0.048). However, the MR-Egger method showed inconsistent directions (Supplementary Figure S1). Therefore, we used a more stringent genome-wide significance level (p < 3 × 10⁻⁸) while keeping the rest of the screening conditions unchanged. Re-performing the MR analysis after excluding rs142006783 (p = 4.8 × 10⁻⁸) showed that the previously observed significant association between OSA and MVPA disappeared (Figure 4). Additionally, the weighted median and MR-Egger methods remained in a consistent direction. This suggests that there is no causal association between OSA and MVPA. Furthermore, our analyses failed to reveal that OSA causally affects changes in TV watching, computer use, and VPA (Figure 4).
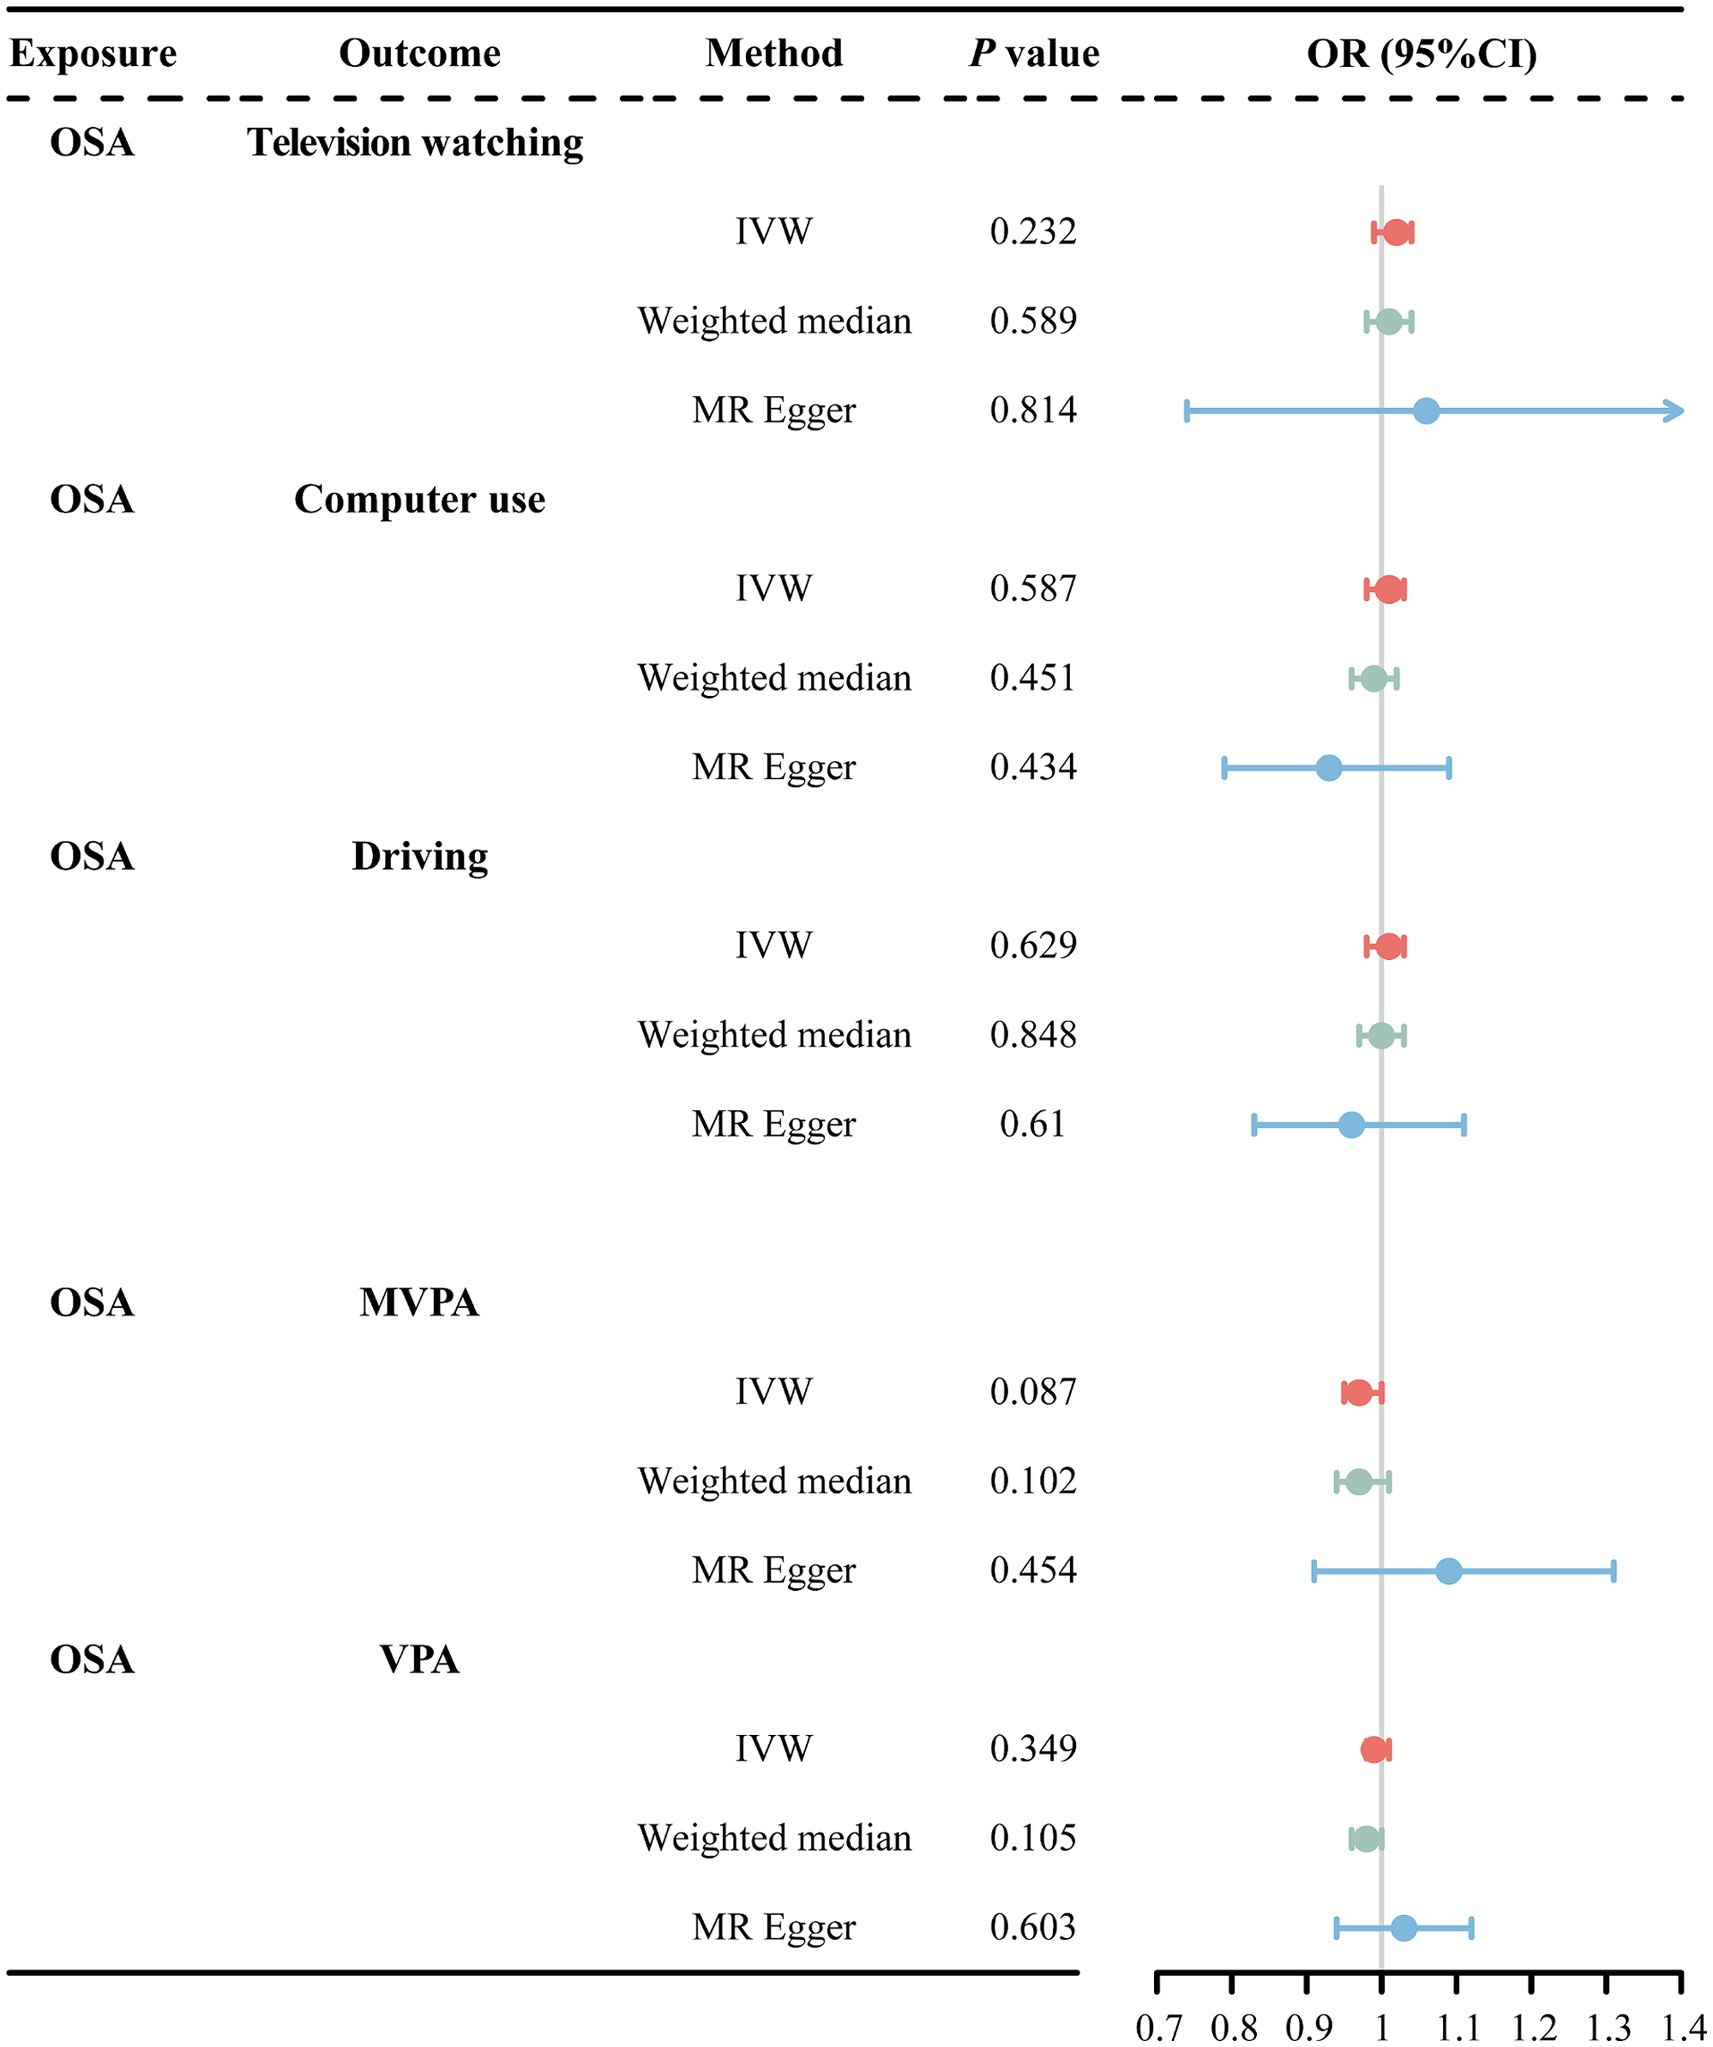
Figure 4. MR estimates results of causal effect of OSA on LSB/PA. OSA, obstructive sleep apnea; MVPA, self-reported moderate-to-vigorous physical activity; VPA, self-reported vigorous physical activity; IVW, inverse variance weighted; OR, odds ratios; 95%CI, 95% confidence interval.
In the forward MR analyses, all p-values from Cochran’s Q test were > 0.05, indicating no significant heterogeneity (Table 2). Similarly, no horizontal pleiotropy was detected between LSB/PA and OSA, as indicated by p-values > 0.05 for both the MR-Egger intercept test (Figure 5; Supplementary Figures S2, S3) and the MR-PRESSO global test (Table 2). Furthermore, the LOO analyses showed that no single SNP significantly influenced the results (Supplementary Figures S4–S8).
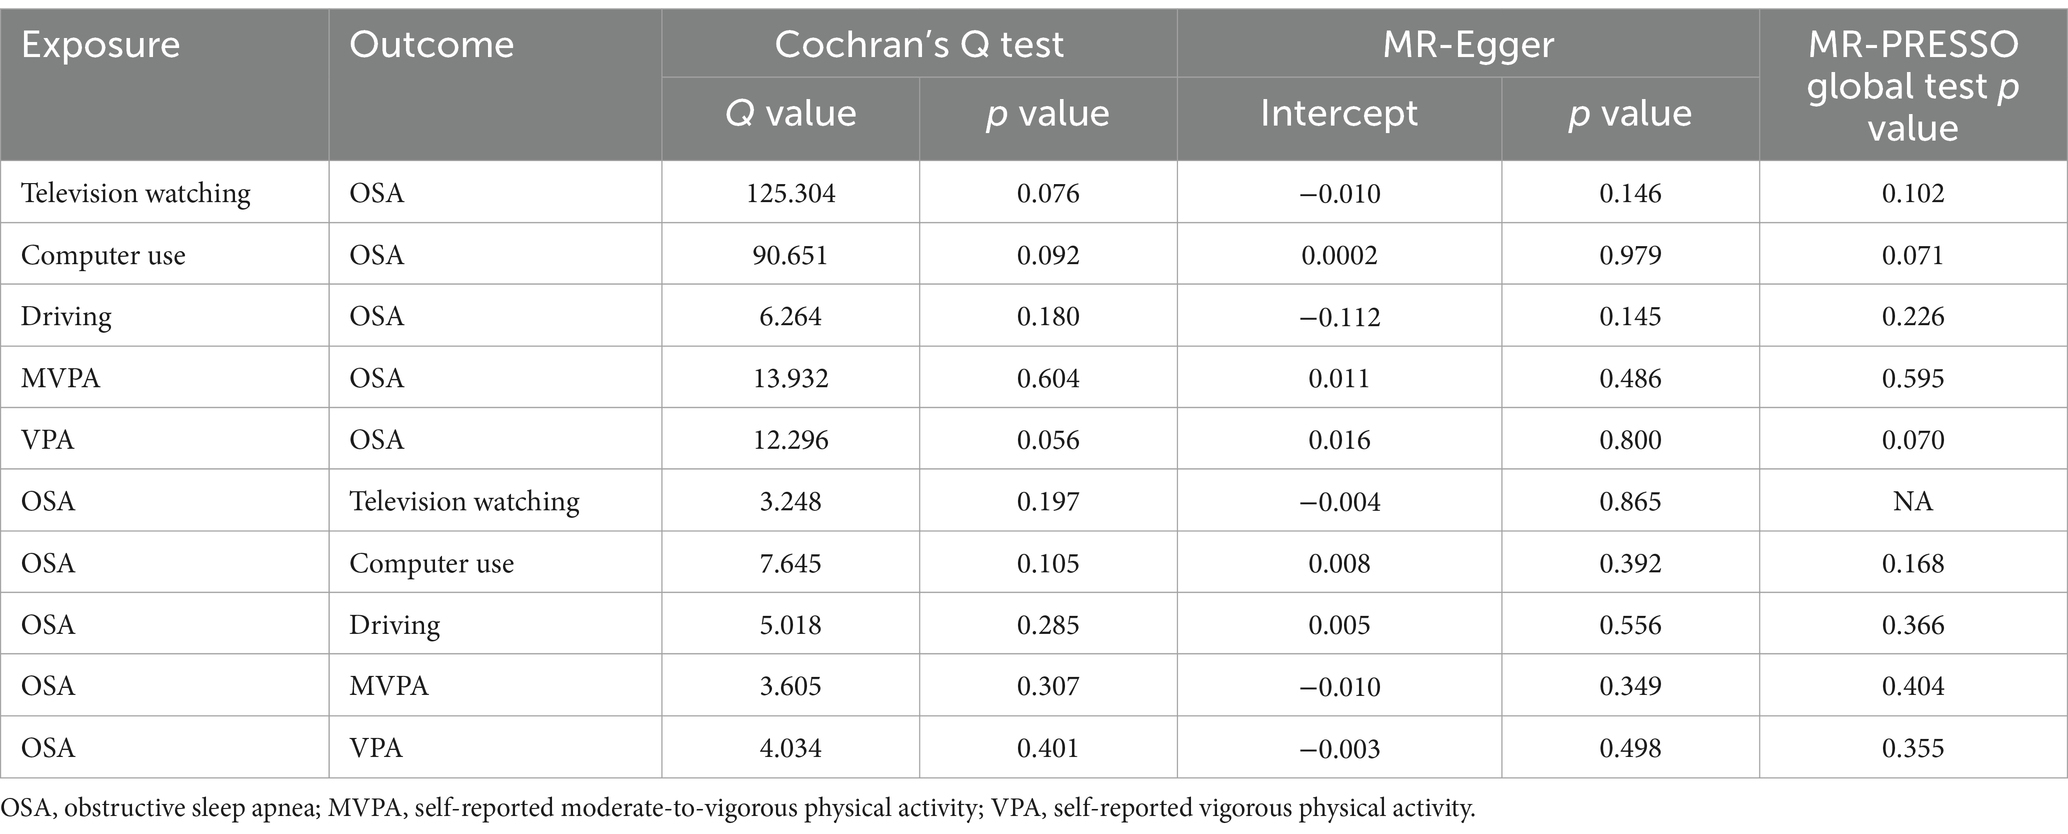
Table 2. Sensitivity analysis of the causal association between LSB, PA and the risk of OSA.
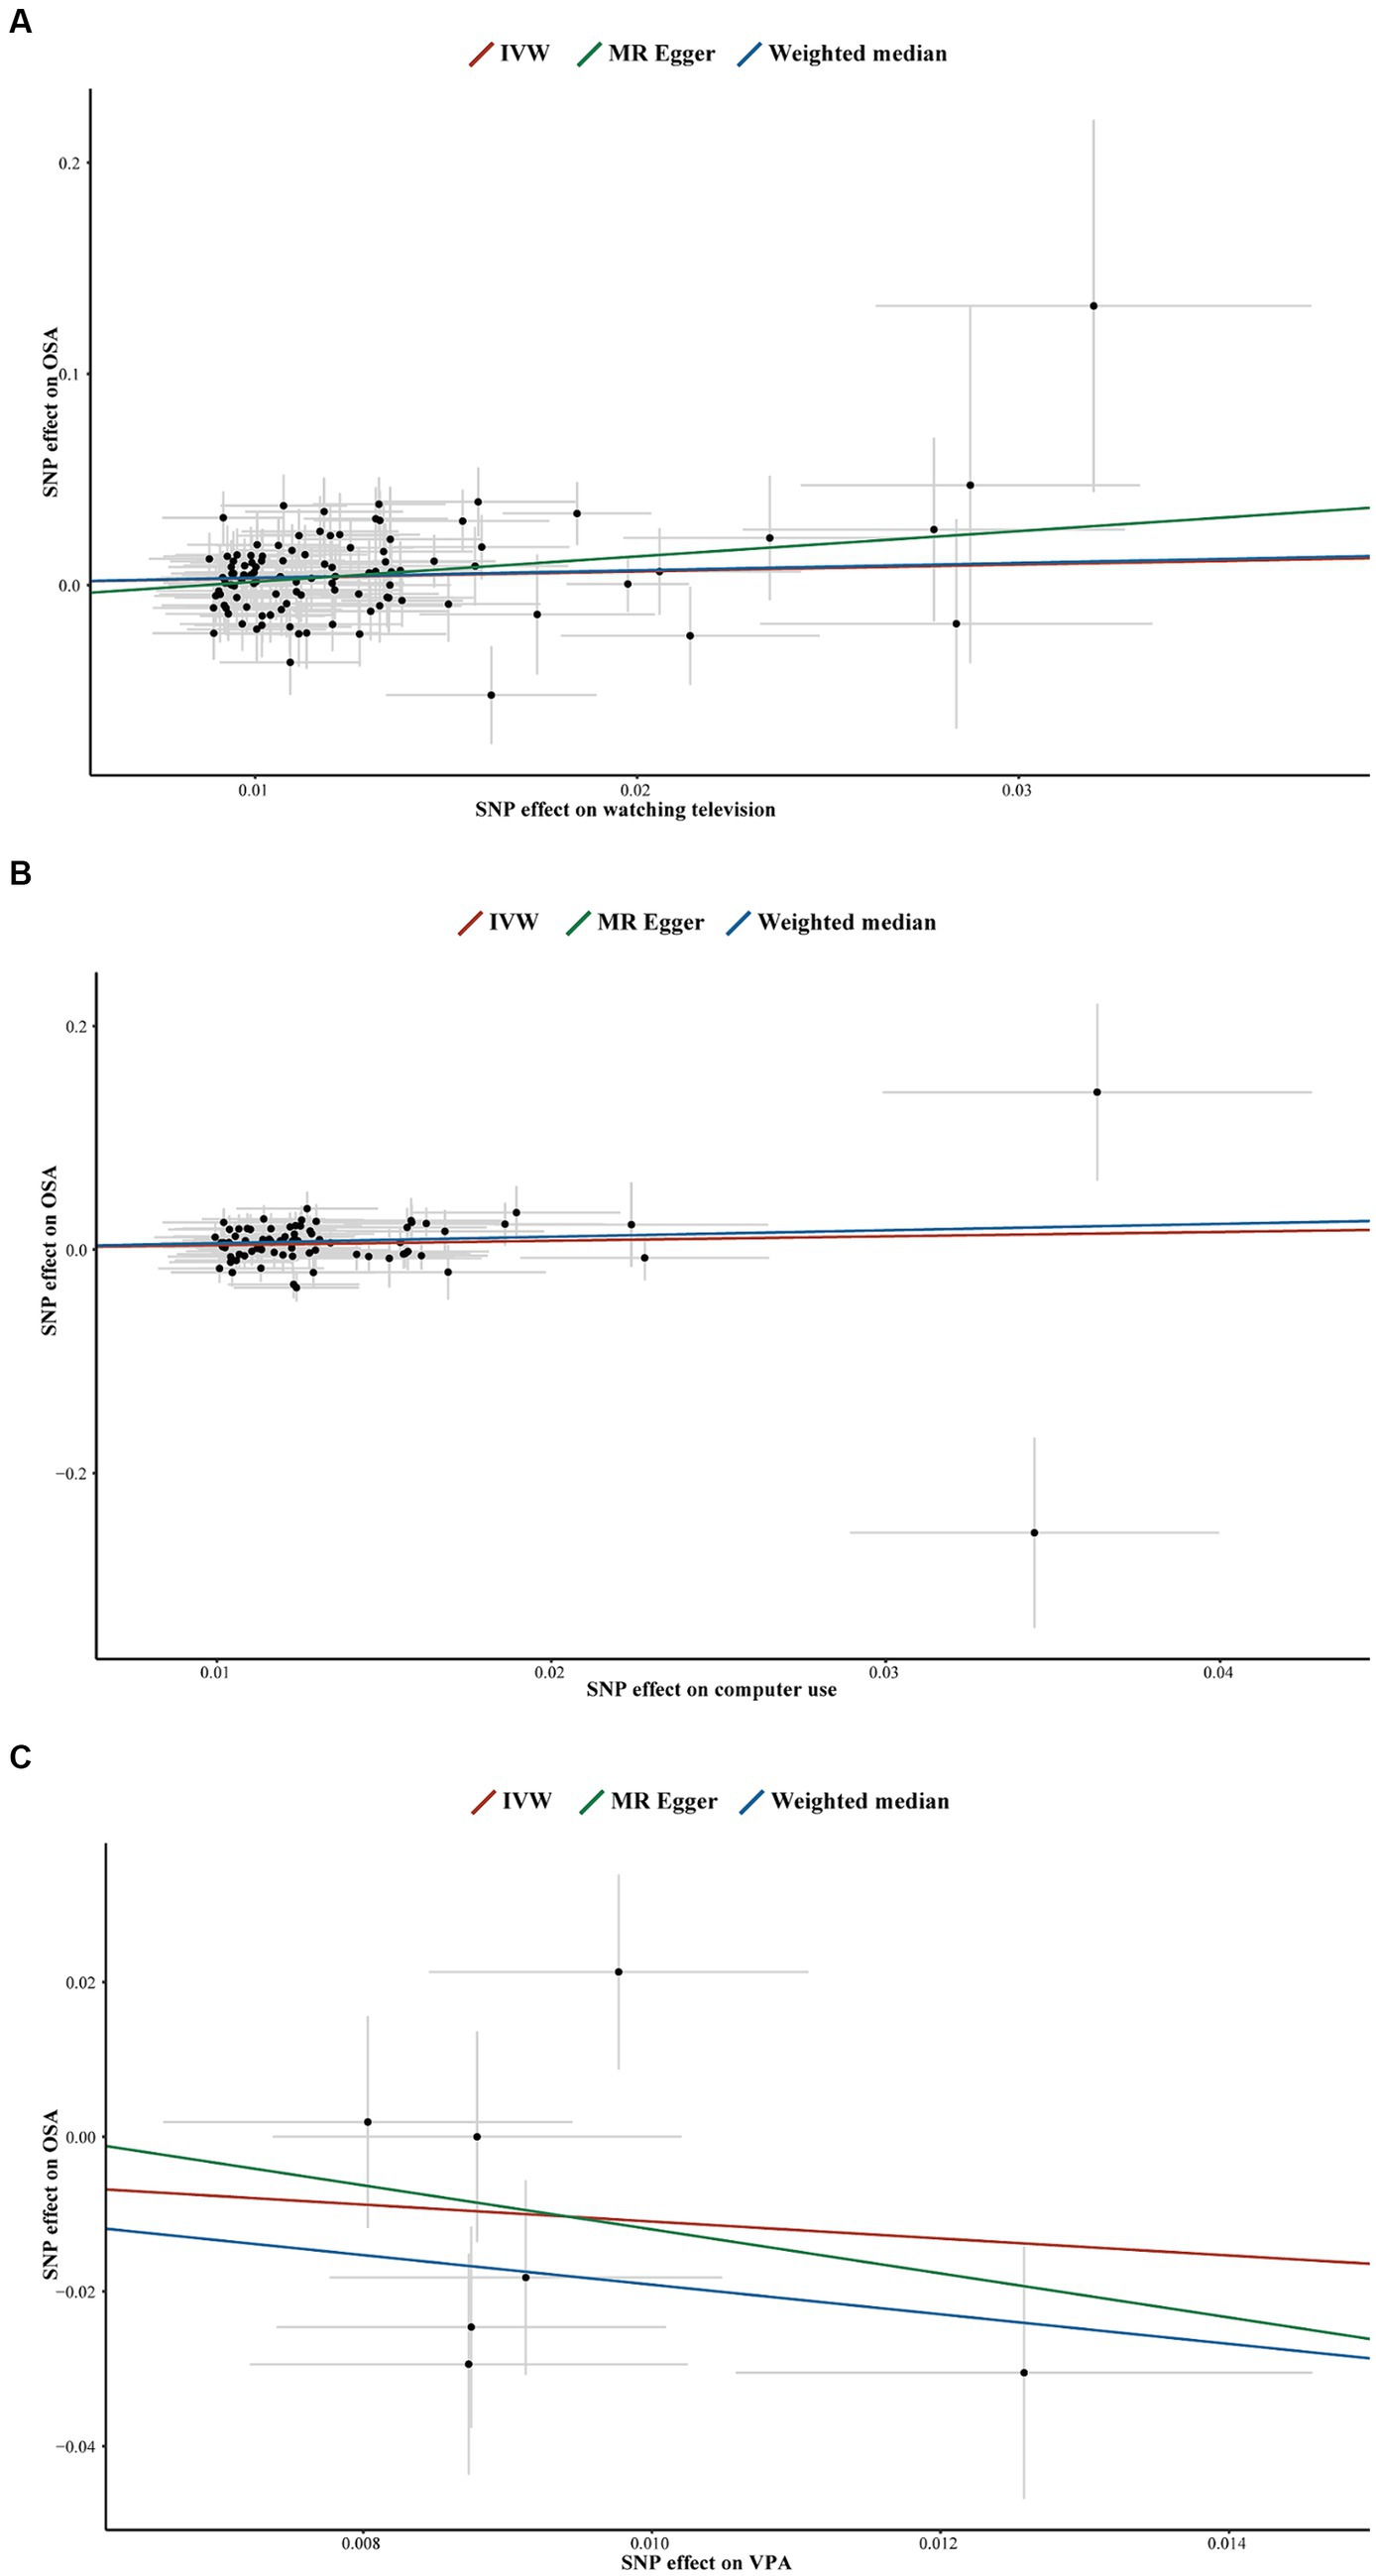
Figure 5. Scatter plots for television watching on OSA (A), computer use on OSA (B), VPA on OSA (C). SNP, single-nucleotide polymorphisms; OSA, obstructive sleep apnea; IVW, inverse variance weighted; VPA, self-reported vigorous physical activity.
In the reverse MR analyses exploring the causal associations between OSA and computer use, driving, MVPA, and VPA, all p-values from the Cochran’s Q test, the MR-Egger intercept test (Supplementary Figures S9–S12), and the MR-PRESSO global test were > 0.05 (Table 2). This indicates no significant heterogeneity or horizontal pleiotropy in these analyses. However, the situation was different when investigating the effect of OSA on television watching. The Cochran’s Q test showed heterogeneity (p = 1.94 × 10⁻⁴), and the MR-PRESSO analyses showed that rs10928560 and rs4837016 were sources of bias (Supplementary Table S7). After removing these two SNPs, we re-performed MR analyses and sensitivity tests on the relationship between OSA and television watching (Figure 4; Table 2). Due to the reduction to only three remaining SNPs, conducting the MR-PRESSO test was not feasible. To solve this problem, we appropriately lowered the genome-wide significance threshold to p < 5 × 10⁻⁷, thereby expanding the number of available SNPs while keeping all other screening conditions constant (Supplementary Table S8). This strategy allowed us to include 8 SNPs for a complete sensitivity analysis. Re-analyses after removing outliers (Supplementary Table S9) similarly showed that OSA did not causally affect television watching (Supplementary Figure S13). In addition, all p-values for the Cochran’s Q test, MR-Egger intercept test (Supplementary Figures S14, S15), and MR-PRESSO global test were > 0.05, confirming no significant horizontal pleiotropy or heterogeneity in the analyses (Supplementary Table S10). Supplementary Figures S16–S21 display the LOO analyses.
According to current knowledge, there is still no complete cure for OSA. Continuous positive airway pressure (CPAP) therapy is the most widely used clinical approach (4). However, low patient compliance rates significantly hamper the effectiveness of CPAP therapy. Furthermore, once CPAP therapy is discontinued, OSA symptoms rapidly recur (47). Despite the absence of a complete cure for OSA, adopting proactive preventive measures can mitigate the likelihood of its occurrence. Therefore, acquiring a more profound understanding of the risks and protective factors associated with OSA is imperative. Previous studies have identified several modifiable risk factors as critical targets for the prevention and treatment of OSA, including overall health rating, napping during the day, BMI, body fat mass, body water mass, hypertension, and education (27). Building on these findings, our study further explored the causal relationship between LSB/PA and OSA. We found that leisurely television watching and non-work-related computer use are risk factors for OSA, while VPA may be a protective factor. However, our findings do not support that driving and MVPA causally affect OSA risk.
The present study found that sedentary behavior increases the risk of OSA, aligning with findings from multiple prior observational studies (13–15). Unobstructed venous return is fundamental to maintaining good health. However, persistent sedentary behavior can impede venous return, accumulating fluid in the distal lower extremities’ intravascular and interstitial spaces (1). This accumulated fluid moves toward the neck when lying down to sleep at night, increasing upper airway resistance and contributing to the development of OSA (48). Additionally, a meta-analysis has indicated that sedentary behaviors contribute to obesity (49), which in turn increases the accumulation area and volume of fat deposits in the posterior wall of the maxilla, the pharynx, and the upper airways (50). During nighttime sleep, this accumulation can obstruct the upper respiratory tract, triggering OSA (50). Interestingly, among the three LSB phenotypes, we did not find significant evidence of causality between driving and OSA. The impact of different LSB on OSA risk may vary. In contrast to driving, watching television and using the computer are sedentary behaviors that involve screen exposure (SE-SB). The meta-analysis revealed that SE-SB is linked to an increased risk of depression (51). Depression is often accompanied by increased levels of pro-inflammatory cytokines, which can cause neurological damage and disrupt normal circadian rhythms, increasing the risk of OSA (52, 53). A recently published MR study confirmed the causal relationship between depression and OSA (54). Additionally, watching television and using the computer are more likely to occur later in the day, closer to bedtime. This behavior can lead to sleep deprivation and circadian misalignment, which in turn can exacerbate metabolic dysfunction and inflammation, ultimately influencing the occurrence of OSA (14).
Exercise is recognized as the second most effective treatment for OSA after CPAP (55). Although the mechanisms by which exercise improves OSA are not yet fully understood, several improvement pathways have been suggested. These include reduced fluid accumulation in the neck (56, 57), improved sleep quality (58), increased upper airway dilator muscle tension (59), and fat redistribution (3). It has also been suggested that different phenotypes of PA, such as exercise intensity, may affect OSA risk differently. The available studies have not reached consistent conclusions regarding the relationship between different PA intensities and OSA (16, 60, 61). Therefore, we conducted an MR analysis to evaluate the causal relationship. The results of this MR study suggest that the protective effect of PA against OSA is limited to VPA, while MVPA did not significantly reduce the risk of OSA. This finding indicates that light weight-bearing exercise and slow cycling may not significantly protect against OSA. It is important to recognize that previous studies have primarily used observational designs, which could not completely eliminate confounding factors or reverse causality interferences, potentially leading to different findings. Our analysis showed a causal relationship between VPA and OSA, which may be based on several mechanisms. Firstly, VPA improves slow-wave sleep quality by increasing slow-wave stability (62). Improving slow-wave sleep quality can lead to an improvement in OSA (59). Secondly, VPA can redistribute body fat, reducing the risk of OSA by decreasing fat accumulation around the neck and improving upper airway patency (63). Exercise is recognized as the second most effective treatment for OSA after CPAP (52). Although the mechanisms by which exercise improves OSA are not yet fully understood, several improvement pathways have been suggested. These include reduced fluid accumulation in the neck (53, 54), improved sleep quality (55), increased upper airway dilator muscle tension (56), and fat redistribution (3). It has also been suggested that different phenotypes of PA, such as exercise intensity, may affect OSA risk differently. The available studies have not reached consistent conclusions regarding the relationship between different PA intensities and OSA (13, 57, 58). Therefore, we conducted an MR analysis to evaluate the causal relationship. The results of this MR study suggest that the protective effect of PA against OSA is limited to VPA, while MVPA did not significantly reduce the risk of OSA. This finding indicates that light weight-bearing exercise and slow cycling may not significantly protect against OSA. It is important to recognize that previous studies have primarily used observational designs, which could not completely eliminate confounding factors or reverse causality interferences, potentially leading to different findings. Our analysis showed a causal relationship between VPA and OSA, which may be based on several mechanisms. Firstly, VPA improves slow-wave sleep quality by increasing slow-wave stability (59). Improving slow-wave sleep quality can lead to an improvement in OSA (56). Secondly, VPA can redistribute body fat, reducing the risk of OSA by decreasing fat accumulation around the neck and improving upper airway patency (60). Although both high-intensity interval training (HIIT) and moderate-intensity continuous training (MICT) are effective in reducing body fat (64), HIIT is more effective in promoting fat redistribution in specific populations, such as postmenopausal women (65). HIIT can reduce neck circumference, which may reflect a reduction in fat accumulation in this area, thereby improving upper airway patency. This may explain why the present study found that only VPA has a protective effect against OSA. Thirdly, VPA may improve OSA by enhancing lower limb muscle function and reducing leg fluid retention. A recent study indicates that HIIT significantly improves muscle mass and lower limb muscle function in sedentary individuals, whereas MICT does not yield the same effects (66). This suggests that only VPA may significantly enhance lower limb muscle function, thereby improving OSA. Consequently, the reduced transfer of fluid from the legs to the airway during sleep leads to the expansion of the upper airway. Finally, individuals who engage in VPA may be more likely to follow a healthier diet and be less sedentary for extended periods (67).
Although several studies have suggested that OSA may lead to a reduction in PA (19, 20), our findings indicate that only VPA causally reduces the risk of OSA. This suggests that the association between OSA and PA may be unidirectional, and previous observational studies may have produced false-positive results.
Our study has several significant advantages. Firstly, compared to traditional observational studies, we utilized a bidirectional two-sample MR analysis to minimize the effects of confounders and reverse causality, providing more reliable causality estimates. Secondly, we selected IVW as our primary analysis method due to its higher statistical power compared to other MR analysis methods. However, IVW is susceptible to horizontal pleiotropy. To address this issue, we used the MR-PRESSO global test and the MR-Egger intercept test to ensure that SNPs were free of potential pleiotropy and to guarantee the robustness of our analytical results. Additionally, we minimized the type I error probability by obtaining exposure and outcome data from different cohorts to avoid overlap between samples.
While our study offers new perspectives into the potential causal relationships between LSB/PA and the risk of OSA, we must acknowledge several limitations. Firstly, since all GWAS data were collected from participants with European ancestry, it is important to note that the findings of this study may not be directly generalizable to other ethnic populations. Genetic associations can vary across different populations due to differences in allele frequencies, environmental interactions, and socioeconomic factors. Therefore, further research involving diverse ethnic groups is essential for a more comprehensive understanding of the genetic underpinnings and their potential clinical implications. Secondly, although we investigated the potential causal relationship between LSB/PA and OSA risk, further research is needed to elucidate the underlying mechanisms. Thirdly, our study used a self-reported questionnaire to collect data on LSB and PA. While self-reported questionnaires are cost-effective and suitable for large-scale population-based studies, they are subject to information bias, such as recall bias and social desirability bias. These biases can affect the accuracy and reliability of the reported data (68). Despite these limitations, self-reported questionnaires can directly reflect respondents’ experiences and remain a widely used data collection instrument due to their practicality and relatively high reliability (69). However, future studies should consider incorporating objective measures, such as accelerometers, to obtain more accurate assessments of LSB and PA. Fourthly, although MR helps to reduce confounding and reverse causation, there is still a potential for pleiotropy, where genetic variants influence the outcome through pathways other than the exposure of interest. We employed several sensitivity analyses, including MR-Egger regression, MR-PRESSO, and LOO analysis, to detect and adjust for pleiotropic effects. Nevertheless, these methods may not entirely eliminate pleiotropic bias. Finally, due to the use of GWAS pooled data and the lack of individual measurement raw data, we could not conduct analyses for specific subgroups, such as age and gender. Further studies with access to individual-level data are needed to explore these subgroup-specific effects.
In conclusion, our findings suggest that leisurely watching television and computer use are risk factors for OSA, while VPA may be a protective factor. Additionally, OSA does not affect PA or LSB levels. We recommend reducing sedentary activities, particularly watching television and computer use, and prioritizing VPA to reduce the risk of OSA. However, given that our data are primarily from individuals of European ancestry, further research is needed in diverse populations and settings to validate these findings and understand their broader applicability.
Publicly available datasets were analyzed in this study. This data can be found here: https://gwas.mrcieu.ac.uk.
The studies involving humans were approved by the North West Multi-centre Research Ethics Committee, The Coordinating Ethics Committee of the Hospital District of Helsinki and Uusimaa. The studies were conducted in accordance with the local legislation and institutional requirements. The human samples used in this study were acquired from another research group. Written informed consent for participation was not required from the participants or the participants’ legal guardians/next of kin in accordance with the national legislation and institutional requirements.
HT: Conceptualization, Data curation, Formal analysis, Methodology, Visualization, Writing – original draft, Writing – review & editing. AW: Conceptualization, Validation, Writing – original draft, Writing – review & editing. HW: Data curation, Formal analysis, Visualization, Writing – review & editing. CZ: Conceptualization, Validation, Writing – review & editing. ZZ: Conceptualization, Project administration, Supervision, Writing – review & editing. JW: Conceptualization, Supervision, Validation, Writing – review & editing.
The author(s) declare that financial support was received for the research, authorship, and/or publication of this article. This work was supported by the National Social Science Foundation of China (No. 22BTY011).
The authors sincerely thank all the original authors and their institutions who provided genetic data for this MR study.
The authors declare that the research was conducted in the absence of any commercial or financial relationships that could be construed as a potential conflict of interest.
All claims expressed in this article are solely those of the authors and do not necessarily represent those of their affiliated organizations, or those of the publisher, the editors and the reviewers. Any product that may be evaluated in this article, or claim that may be made by its manufacturer, is not guaranteed or endorsed by the publisher.
The Supplementary material for this article can be found online at: https://www.frontiersin.org/articles/10.3389/fpubh.2024.1425060/full#supplementary-material
LSB, Leisure sedentary behaviors; PA, Physical activity; OSA, Obstructive sleep apnea; MR, Mendelian randomization; IVW, Inverse variance weighted; GWAS, Genome-Wide Association Studies; IVs, Instrumental variables; MVPA, Moderate-to-vigorous physical activity; VPA, Vigorous physical activity; ICD, International Statistical Classification of Diseases; MR-PRESSO, Mendelian randomization pleiotropy residual sum and outlier; SNPs, Single-nucleotide polymorphisms; LOO, Leave-one-out; CPAP, Continuous positive airway pressure; SE-SB, Sedentary behaviors that involve screen exposure; OR, Odds ratios; CI, Confidence interval
1. Lv, R, Liu, X, Zhang, Y, Dong, N, Wang, X, He, Y, et al. Pathophysiological mechanisms and therapeutic approaches in obstructive sleep apnea syndrome. Signal Transduct Target Ther. (2023) 8:218. doi: 10.1038/s41392-023-01496-3
2. Hirotsu, C, Haba-Rubio, J, Togeiro, SM, Marques-Vidal, P, Drager, LF, Vollenweider, P, et al. Obstructive sleep apnoea as a risk factor for incident metabolic syndrome: a joined Episono and HypnoLaus prospective cohorts study. Eur Respir J. (2018) 52:1801150. doi: 10.1183/13993003.01150-2018
3. Gottlieb, DJ, and Punjabi, NM. Diagnosis and management of obstructive sleep apnea: a review. JAMA. (2020) 323:1389–400. doi: 10.1001/jama.2020.3514
4. Yeghiazarians, Y, Jneid, H, Tietjens, JR, Redline, S, Brown, DL, El-Sherif, N, et al. Obstructive sleep apnea and cardiovascular disease: a scientific statement from the American Heart Association. Circulation. (2021) 144:e56–67. doi: 10.1161/CIR.0000000000000988
5. Cai, X, Song, S, Hu, J, Zhu, Q, Yang, W, Hong, J, et al. Body roundness index improves the predictive value of cardiovascular disease risk in hypertensive patients with obstructive sleep apnea: a cohort study. Clin Exp Hypertens. (2023) 45:2259132. doi: 10.1080/10641963.2023.2259132
6. Cai, X, Hu, J, Wen, W, Wang, J, Wang, M, Liu, S, et al. Associations of the Cardiometabolic index with the risk of cardiovascular disease in patients with hypertension and obstructive sleep apnea: results of a longitudinal cohort study. Oxidative Med Cell Longev. (2022) 2022:4914791–15. doi: 10.1155/2022/4914791
7. Benjafield, AV, Ayas, NT, Eastwood, PR, Heinzer, R, Ip, MSM, Morrell, MJ, et al. Estimation of the global prevalence and burden of obstructive sleep apnoea: a literature-based analysis. Lancet Respir Med. (2019) 7:687–98. doi: 10.1016/S2213-2600(19)30198-5
8. Luo, Q, Li, N, Zhu, Q, Yao, X, Wang, M, Heizhati, M, et al. Non-dipping blood pressure pattern is associated with higher risk of new-onset diabetes in hypertensive patients with obstructive sleep apnea: UROSAH data. Front Endocrinol (Lausanne). (2023) 14:1083179. doi: 10.3389/fendo.2023.1083179
9. Tremblay, MS, Aubert, S, Barnes, JD, Saunders, TJ, Carson, V, Latimer-Cheung, AE, et al. Sedentary behavior research network (SBRN) - terminology consensus project process and outcome. Int J Behav Nutr Phys Act. (2017) 14:75. doi: 10.1186/s12966-017-0525-8
10. World Health Organization. Physical activity (2022). Available at: https://www.who.int/news-room/fact-sheets/detail/physical-activity (Accessed April 13, 2024).
11. Hall, G, Laddu, DR, Phillips, SA, Lavie, CJ, and Arena, R. A tale of two pandemics: how will COVID-19 and global trends in physical inactivity and sedentary behavior affect one another? Prog Cardiovasc Dis. (2021) 64:108–10. doi: 10.1016/j.pcad.2020.04.005
12. Ekelund, U, Steene-Johannessen, J, Brown, WJ, Fagerland, MW, Owen, N, Powell, KE, et al. Does physical activity attenuate, or even eliminate, the detrimental association of sitting time with mortality? A harmonised meta-analysis of data from more than 1 million men and women. Lancet. (2016) 388:1302–10. doi: 10.1016/S0140-6736(16)30370-1
13. Cai, S, Li, S, Zhou, Y, Song, J, and Peng, J. The association between sedentary behavior and obstructive sleep apnea: a cross-sectional study from the NHANES (2007-2008 to 2015-2020). BMC Oral Health. (2024) 24:224. doi: 10.1186/s12903-024-03960-0
14. Liu, Y, Yang, L, Stampfer, MJ, Redline, S, Tworoger, SS, and Huang, T. Physical activity, sedentary behaviour and incidence of obstructive sleep apnoea in three prospective US cohorts. Eur Respir J. (2022) 59:2100606. doi: 10.1183/13993003.00606-2021
15. Buman, MP, Kline, CE, Youngstedt, SD, Phillips, B, Tulio de Mello, M, and Hirshkowitz, M. Sitting and television viewing: novel risk factors for sleep disturbance and apnea risk? Results from the 2013 National Sleep Foundation sleep in America poll. Chest. (2015) 147:728–34. doi: 10.1378/chest.14-1187
16. Hall, KA, Singh, M, Mukherjee, S, and Palmer, LJ. Physical activity is associated with reduced prevalence of self-reported obstructive sleep apnea in a large, general population cohort study. J Clin Sleep Med. (2020) 16:1179–87. doi: 10.5664/jcsm.8456
17. Pinto, AJ, Bergouignan, A, Dempsey, PC, Roschel, H, Owen, N, Gualano, B, et al. Physiology of sedentary behavior. Physiol Rev. (2023) 103:2561–622. doi: 10.1152/physrev.00022.2022
18. Redolfi, S, Bettinzoli, M, Venturoli, N, Ravanelli, M, Pedroni, L, Taranto-Montemurro, L, et al. Attenuation of obstructive sleep apnea and overnight rostral fluid shift by physical activity. Am J Respir Crit Care Med. (2015) 191:856–8. doi: 10.1164/rccm.201412-2192LE
19. Rhodes, S, Waters, D, Brockway, B, and Skinner, M. Physical activity behaviour and barriers to activity in adults at high risk of obstructive sleep apnoea. J Prim Health Care. (2020) 12:257–64. doi: 10.1071/HC19102
20. Hargens, TA, Martin, RA, Strosnider, CL, Giersch, GEW, and Womack, CJ. Obstructive sleep apnea negatively impacts objectively measured physical activity. Sleep Breath. (2019) 23:447–54. doi: 10.1007/s11325-018-1700-0
21. Reale, M, Velluto, L, Di Nicola, M, D’Angelo, C, Costantini, E, Marchioni, M, et al. Cholinergic markers and cytokines in OSA patients. Int J Mol Sci. (2020) 21:3264. doi: 10.3390/ijms21093264
22. Nidadavolu, LS, Cosarderelioglu, C, Merino Gomez, A, Wu, Y, Bopp, T, Zhang, C, et al. Interleukin-6 drives mitochondrial dysregulation and accelerates physical decline: insights from an inducible humanized IL-6 Knock-in mouse model. J Gerontol A Biol Sci Med Sci. (2023) 78:1740–52. doi: 10.1093/gerona/glad147
23. Yin, L, Li, N, Jia, W, Wang, N, Liang, M, Yang, X, et al. Skeletal muscle atrophy: from mechanisms to treatments. Pharmacol Res. (2021) 172:105807. doi: 10.1016/j.phrs.2021.105807
24. Sekula, P, Del Greco, MF, Pattaro, C, and Köttgen, A. Mendelian randomization as an approach to assess causality using observational data. J Am Soc Nephrol. (2016) 27:3253–65. doi: 10.1681/ASN.2016010098
25. Davey Smith, G, and Hemani, G. Mendelian randomization: genetic anchors for causal inference in epidemiological studies. Hum Mol Genet. (2014) 23:R89–98. doi: 10.1093/hmg/ddu328
26. Emdin, CA, Khera, AV, and Kathiresan, S. Mendelian randomization. JAMA. (2017) 318:1925–6. doi: 10.1001/jama.2017.17219
27. Li, Y, Miao, Y, Tan, J, and Zhang, Q. Association of modifiable risk factors with obstructive sleep apnea: a Mendelian randomization study. Aging (Albany NY). (2023) 15:14039–65. doi: 10.18632/aging.205288
28. Labrecque, J, and Swanson, SA. Understanding the assumptions underlying instrumental variable analyses: a brief review of falsification strategies and related tools. Curr Epidemiol Rep. (2018) 5:214–20. doi: 10.1007/s40471-018-0152-1
29. Klimentidis, YC, Raichlen, DA, Bea, J, Garcia, DO, Wineinger, NE, Mandarino, LJ, et al. Genome-wide association study of habitual physical activity in over 377,000 UK biobank participants identifies multiple variants including CADM2 and APOE. Int J Obes. (2018) 42:1161–76. doi: 10.1038/s41366-018-0120-3
30. Fry, A, Littlejohns, TJ, Sudlow, C, Doherty, N, Adamska, L, Sprosen, T, et al. Comparison of sociodemographic and health-related characteristics of UK biobank participants with those of the general population. Am J Epidemiol. (2017) 186:1026–34. doi: 10.1093/aje/kwx246
31. Madjedi, KM, Stuart, KV, Chua, SYL, Ramulu, PY, Warwick, A, Luben, RN, et al. The Association of Physical Activity with Glaucoma and related traits in the UK biobank. Ophthalmology. (2023) 130:1024–36. doi: 10.1016/j.ophtha.2023.06.009
32. Zhu, J, Ge, F, Zeng, Y, Qu, Y, Chen, W, Yang, H, et al. Physical and mental activity, disease susceptibility, and risk of dementia: a prospective cohort study based on UK biobank. Neurology. (2022) 99:e799–813. doi: 10.1212/WNL.0000000000200701
33. Guo, W, Key, TJ, and Reeves, GK. Accelerometer compared with questionnaire measures of physical activity in relation to body size and composition: a large cross-sectional analysis of UK biobank. BMJ Open. (2019) 9:e024206. doi: 10.1136/bmjopen-2018-024206
34. Elsworth, B, Lyon, M, Alexander, T, Liu, Y, Matthews, P, Hallett, J, et al. The MRC IEU OpenGWAS data infrastructure. bioRxiv [preprint]. (2020). Available at: https://www.biorxiv.org/content/10.1101/2020.08.10.244293 (Accessed April 15, 2024).
35. Mitchell, R, Elsworth, B, Mitchell, R, Raistrick, C, Paternoster, L, Hemani, G, et al. MRC IEU UK Biobank GWAS pipeline version 2. (2019). Available at: https://data.bris.ac.uk/data/dataset/pnoat8cxo0u52p6ynfaekeigi (Accessed April 15, 2024).
36. Strausz, S, Ruotsalainen, S, Ollila, HM, Karjalainen, J, Kiiskinen, T, Reeve, M, et al. Genetic analysis of obstructive sleep apnoea discovers a strong association with cardiometabolic health. Eur Respir J. (2021) 57:2003091. doi: 10.1183/13993003.03091-2020
37. Xiao, Z, Huang, G, Li, G, Wang, H, Zheng, X, Li, Y, et al. No causal association between the volume of strenuous exercise and coronary atherosclerosis: a two-sample Mendelian randomization study. Front Cardiovasc Med. (2024) 11:1344764. doi: 10.3389/fcvm.2024.1344764
38. Liu, Y, Ling, L, Shen, Y, and Bi, X. Metabolome-wide Mendelian randomization reveals causal effects of betaine and N-acetylornithine on impairment of renal function. Front Nutr. (2024) 11:1371995. doi: 10.3389/fnut.2024.1371995
39. Pagoni, P, Dimou, NL, Murphy, N, and Stergiakouli, E. Using Mendelian randomisation to assess causality in observational studies. Evid Based Ment Health. (2019) 22:67–71. doi: 10.1136/ebmental-2019-300085
40. Burgess, S, and Thompson, SG. Interpreting findings from Mendelian randomization using the MR-egger method. Eur J Epidemiol. (2017) 32:377–89. doi: 10.1007/s10654-017-0255-x
41. Burgess, S, Davey Smith, G, Davies, NM, Dudbridge, F, Gill, D, Glymour, MM, et al. Guidelines for performing Mendelian randomization investigations: update for summer 2023. Wellcome Open Res. (2019) 4:186. doi: 10.12688/wellcomeopenres.15555.3
42. Bowden, J, Davey Smith, G, Haycock, PC, and Burgess, S. Consistent estimation in Mendelian randomization with some invalid instruments using a weighted median estimator. Genet Epidemiol. (2016) 40:304–14. doi: 10.1002/gepi.21965
43. Bowden, J, Davey Smith, G, and Burgess, S. Mendelian randomization with invalid instruments: effect estimation and bias detection through egger regression. Int J Epidemiol. (2015) 44:512–25. doi: 10.1093/ije/dyv080
44. Ong, J-S, and MacGregor, S. Implementing MR-PRESSO and GCTA-GSMR for pleiotropy assessment in Mendelian randomization studies from a practitioner’s perspective. Genet Epidemiol. (2019) 43:609–16. doi: 10.1002/gepi.22207
45. Greco, MFD, Minelli, C, Sheehan, NA, and Thompson, JR. Detecting pleiotropy in Mendelian randomisation studies with summary data and a continuous outcome. Stat Med. (2015) 34:2926–40. doi: 10.1002/sim.6522
46. Verbanck, M, Chen, C-Y, Neale, B, and Do, R. Detection of widespread horizontal pleiotropy in causal relationships inferred from Mendelian randomization between complex traits and diseases. Nat Genet. (2018) 50:693–8. doi: 10.1038/s41588-018-0099-7
47. Sánchez-de-la-Torre, M, Gracia-Lavedan, E, Benitez, ID, Sánchez-de-la-Torre, A, Moncusí-Moix, A, Torres, G, et al. Adherence to CPAP treatment and the risk of recurrent cardiovascular events: a Meta-analysis. JAMA. (2023) 330:1255–65. doi: 10.1001/jama.2023.17465
48. McNicholas, WT, and Pevernagie, D. Obstructive sleep apnea: transition from pathophysiology to an integrative disease model. J Sleep Res. (2022) 31:e13616. doi: 10.1111/jsr.13616
49. Guo, C, Zhou, Q, Zhang, D, Qin, P, Li, Q, Tian, G, et al. Association of total sedentary behaviour and television viewing with risk of overweight/obesity, type 2 diabetes and hypertension: a dose-response meta-analysis. Diabetes Obes Metab. (2020) 22:79–90. doi: 10.1111/dom.13867
50. Xu, X, and Xu, J. Effects of different obesity-related adipokines on the occurrence of obstructive sleep apnea. Endocr J. (2020) 67:485–500. doi: 10.1507/endocrj.EJ20-0036
51. Wang, X, Li, Y, and Fan, H. The associations between screen time-based sedentary behavior and depression: a systematic review and meta-analysis. BMC Public Health. (2019) 19:1524. doi: 10.1186/s12889-019-7904-9
52. Kouba, BR, de Araujo, BL, Borges de Souza, P, Gil-Mohapel, J, and ALS, R. Role of inflammatory mechanisms in major depressive disorder: from etiology to potential pharmacological targets. Cells. (2024) 13:423. doi: 10.3390/cells13050423
53. Golshah, A, Sadeghi, E, and Sadeghi, M. Association of Tumor Necrosis Factor-Alpha, interleukin-1β, Interleukin-8, and interferon-γ with obstructive sleep apnea in both children and adults: a Meta-analysis of 102 articles. J Clin Med. (2024) 13:1484. doi: 10.3390/jcm13051484
54. Mi, C, Hou, A, Liu, Y, Qi, X, and Teng, J. Assessing the causal relationship between psychiatric disorders and obstructive sleep apnea: a bidirectional Mendelian randomization. Front Psych. (2024) 15:1351216. doi: 10.3389/fpsyt.2024.1351216
55. Iftikhar, IH, Bittencourt, L, Youngstedt, SD, Ayas, N, Cistulli, P, Schwab, R, et al. Comparative efficacy of CPAP, MADs, exercise-training, and dietary weight loss for sleep apnea: a network meta-analysis. Sleep Med. (2017) 30:7–14. doi: 10.1016/j.sleep.2016.06.001
56. Kline, CE. Exercise: shifting fluid and sleep apnoea away. Eur Respir J. (2016) 48:23–5. doi: 10.1183/13993003.00797-2016
57. Mendelson, M, Lyons, OD, Yadollahi, A, Inami, T, Oh, P, and Bradley, TD. Effects of exercise training on sleep apnoea in patients with coronary artery disease: a randomised trial. Eur Respir J. (2016) 48:142–50. doi: 10.1183/13993003.01897-2015
58. Lins-Filho, OL, Pedrosa, RP, Gomes, JML, Dantas Moraes, SL, Vasconcelos, BCE, Lemos, CAA, et al. Effect of exercise training on subjective parameters in patients with obstructive sleep apnea: a systematic review and meta-analysis. Sleep Med. (2020) 69:1–7. doi: 10.1016/j.sleep.2019.12.022
59. de Andrade, FMD, and Pedrosa, RP. The role of physical exercise in obstructive sleep apnea. J Bras Pneumol. (2016) 42:457–64. doi: 10.1590/S1806-37562016000000156
60. Murillo, R, Reid, KJ, Arredondo, EM, Cai, J, Gellman, MD, Gotman, NM, et al. Association of self-reported physical activity with obstructive sleep apnea: results from the Hispanic community health study/study of Latinos (HCHS/SOL). Prev Med. (2016) 93:183–8. doi: 10.1016/j.ypmed.2016.10.009
61. da Silva, RP, Martinez, D, Pedroso, MM, Righi, CG, Martins, EF, Silva, LMT, et al. Exercise, occupational activity, and risk of sleep apnea: a cross-sectional study. J Clin Sleep Med. (2017) 13:197–204. doi: 10.5664/jcsm.6446
62. Park, I, Díaz, J, Matsumoto, S, Iwayama, K, Nabekura, Y, Ogata, H, et al. Exercise improves the quality of slow-wave sleep by increasing slow-wave stability. Sci Rep. (2021) 11:4410. doi: 10.1038/s41598-021-83817-6
63. Lins-Filho, O, Germano-Soares, AH, Aguiar, JLP, de Almedia, JRV, Felinto, EC, Lyra, MJ, et al. Effect of high-intensity interval training on obstructive sleep apnea severity: a randomized controlled trial. Sleep Med. (2023) 112:316–21. doi: 10.1016/j.sleep.2023.11.008
64. Sanca-Valeriano, S, Espinola-Sánchez, M, Caballero-Alvarado, J, and Canelo-Aybar, C. Effect of high-intensity interval training compared to moderate-intensity continuous training on body composition and insulin sensitivity in overweight and obese adults: a systematic review and meta-analysis. Heliyon. (2023) 9:e20402. doi: 10.1016/j.heliyon.2023.e20402
65. Dupuit, M, Rance, M, Morel, C, Bouillon, P, Pereira, B, Bonnet, A, et al. Moderate-intensity continuous training or high-intensity interval training with or without resistance training for altering body composition in postmenopausal women. Med Sci Sports Exerc. (2020) 52:736–45. doi: 10.1249/MSS.0000000000002162
66. Ho, S-Y, Chung, Y-C, Wu, H-J, Ho, C-C, and Chen, H-T. Effect of high intensity circuit training on muscle mass, muscular strength, and blood parameters in sedentary workers. PeerJ. (2024) 12:e17140. doi: 10.7717/peerj.17140
67. Deng, M-G, Cui, H-T, Lan, Y-B, Nie, J-Q, Liang, Y-H, and Chai, C. Physical activity, sedentary behavior, and the risk of type 2 diabetes: a two-sample Mendelian randomization analysis in the European population. Front Endocrinol (Lausanne). (2022) 13:964132. doi: 10.3389/fendo.2022.964132
68. Healey, EL, Allen, KD, Bennell, K, Bowden, JL, Quicke, JG, and Smith, R. Self-report measures of physical activity. Arthritis Care Res (Hoboken). (2020) 72:717–30. doi: 10.1002/acr.24211
Keywords: physical activity, leisure sedentary behaviors, obstructive sleep apnea, Mendelian randomization, causal relationship
Citation: Tian H, Wang A, Wu H, Zhou C, Zhang Z and Wang J (2024) The causality between leisure sedentary behaviors, physical activity and obstructive sleep apnea: a bidirectional Mendelian randomization study. Front. Public Health. 12:1425060. doi: 10.3389/fpubh.2024.1425060
Edited by:
Feng Jiang, Shanghai Jiao Tong University, ChinaReviewed by:
Jie Chen, Fuzhou NeuroPsychiatric Hospital, ChinaCopyright © 2024 Tian, Wang, Wu, Zhou, Zhang and Wang. This is an open-access article distributed under the terms of the Creative Commons Attribution License (CC BY). The use, distribution or reproduction in other forums is permitted, provided the original author(s) and the copyright owner(s) are credited and that the original publication in this journal is cited, in accordance with accepted academic practice. No use, distribution or reproduction is permitted which does not comply with these terms.
*Correspondence: Zhenglong Zhang, OTM0MzY5MDYwQHFxLmNvbQ==; Jun Wang, YnN1d2FuZ2p1bkBic3UuZWR1LmNu
†These authors have contributed equally to this work and share first authorship
Disclaimer: All claims expressed in this article are solely those of the authors and do not necessarily represent those of their affiliated organizations, or those of the publisher, the editors and the reviewers. Any product that may be evaluated in this article or claim that may be made by its manufacturer is not guaranteed or endorsed by the publisher.
Research integrity at Frontiers
Learn more about the work of our research integrity team to safeguard the quality of each article we publish.