
94% of researchers rate our articles as excellent or good
Learn more about the work of our research integrity team to safeguard the quality of each article we publish.
Find out more
ORIGINAL RESEARCH article
Front. Public Health, 29 January 2025
Sec. Health Economics
Volume 12 - 2024 | https://doi.org/10.3389/fpubh.2024.1422563
This article is part of the Research TopicGender Inequalities, Sexual and Reproductive Health, and Sustainable Development in the Global SouthView all 10 articles
 Nigusu Worku1*
 Amare Mesfin Workie2
 Lamrot Yohannes3
 Mihret Getnet4,5
 Wubshet Debebe Negash1,6
 Adina Yeshambel Belay1
 Lakew Asmare3
 Hiwot Tadesse Alemu1
 Demiss Mulatu Geberu1
 Melak Jejaw1
 Kaleb Assegid Demissie1
 Misganaw Guadie Tiruneh1
 Asebe Hagos1
Background: Globally, inappropriate feeding practices account for more than two-thirds of all cases of child mortality during the first 2 years of a child’s life. For a long time, Ethiopia has suffered from the double burden of malnutrition: overnutrition and undernutrition both pose significant challenges, particularly for children. Undernutrition is mainly caused by wealth and educational disparities across the country. Therefore, this study aimed to assess the socio-economic inequalities in minimum dietary diversity (MDD) practices among Ethiopian children aged 6–23 months and the potential contributing factors.
Methods: The study utilized the recent datasets of the Ethiopia Mini Demographic and Health Survey (EMDHS) of 2019. A total of 1,511 weighted samples were included in the research. Microsoft Excel and STATA v.14 software were employed to extract, clean, and analyze data. A probit model decomposition analysis was performed. The concentration index (CIX) and curve were used to examine household wealth status and maternal education level inequalities in the MDD.
Results: The total weighted prevalence of MDD among children under the age of 5 in Ethiopia was 13.5%. Wealth and educational status show positive CIX values for inequality, as exhibited by the concentration curve under the equality line. The CIX with household and maternal education status were (CIX: 0.1034, p < 0.0029) and (CIX: 0.1057, p < 0.0002), respectively. This indicates a greater concentration of inequalities among privileged women. The decomposition analysis revealed that household wealth status, (58.23%) contributed by wealth status, (36.38%) place of delivery, (30.47%) maternal education, and (21.5%) administration region, explained the pro-rich inequalities in MDD in Ethiopia.
Conclusion: This study identified significant inequalities in terms of wealth and maternal educational level in the context of MDD. Policymakers and healthcare workers should develop effective strategies to tackle the underlying causes of inequalities in attaining MDD, specifically focusing on household wealth and maternal education.
Malnutrition is a crucial public health challenge; more specifically, it results in numerous childhood health issues (1). Ensuring dietary diversity in child-feeding practice is essential for proper child growth and development (2). The Minimum Dietary Diversity (MDD) for Children is commonly used to evaluate the variety of foods consumed by children and breastfeeding practices (3). Malnutrition in children includes both the undernutrition type, such as wasting, stunting, and underweight, and the overweight type, such as obesity, which exposes the individual to different types of diseases, both communicable (pneumonia, measles, and diarrhea), and non-communicable (diabetes mellitus, heart ailments, and kidney diseases) (4, 5).
The “Convention on the Rights of the Child” states that a child has the right to receive a variety of food types (6). A 2022 report indicated that globally, approximately 148 million (22.3%) children are stunted—that is, too thin for their height—and 45 million (6.8%) are wasted—that is, too short for their height—despite many children receiving adequate nutrition and complementary food types (3). In South Asian countries, 23% (7) of the children received MDD; the figure for Burkina Faso was 18% (8). In Ethiopia, where 67% of the adult population suffered from stunting as children, the child nutrition budget is 55.5 billion Ethiopian birr annually—this is equivalent to 16.5% of the country’s GDP (9).
Childhood nutrition is a global concern and significantly impacts a country’s growth and development trajectory (10). Optimal nutrition constitutes the essential groundwork for realizing the rights of every child (11). Household food consumption and food access indices are measured based on dietary diversity (12). Addressing and eliminating malnutrition in Ethiopia is crucial for the growth and success of the health sector transformational plan (9). The government of Ethiopia has formulated a strategy to eliminate stunting among children under 2 years of age by 2030 (13). Initiatives to improve the nutritional status of children under 5 years of age are now included in the national food and nutrition policy and strategy document of Ethiopia. This document incorporates a working framework for the standardization of indicated nutrition interventions (14). Additionally, the health sector transformational plan provides a multi-sectoral coordination and performance management arrangement along with a multi-year implementation roadmap (15). However, the implementation of these policies and strategies in Ethiopia has not produced any significant improvement in childhood nutritional status. Moreover, the 6–23-month age group—a period of rapid physical and cognitive development—is critical in terms of growth and nutrition. During this period, children transition from exclusive breastfeeding to complementary feeding, which is essential for providing the additional nutrients required for their development. Adequate and diverse nutrition during this period is crucial to prevent malnutrition, stunted growth, and developmental delays and lays the foundation for a child’s lifelong health and well-being.
A few priority intervention areas indicated in the health policies and strategies as the determinant factors of MDD include the following: education, wealth status, employment, and media exposure of households (7). Antenatal care (ANC) visits (45%) and type of toilet facility (15%) are also important areas (2). Household wealth (29.8%) and educational status (11.8%) explain the pro-rich inequalities in MDD in Indonesia (16). There exists a minimum acceptable diet intake difference in urban (14%) and rural (10%) areas among children under 5 years of age in Ethiopia (17). Policy formulators should engage, and obtain feedback from, community members to promote more equitable access to all Reproductive, Maternal, Newborn, and Child Health interventions (18). Moreover, as per the researchers’ knowledge, there is no literature that can be accessed in Ethiopia to investigate socioeconomic inequalities in MDD among children. Therefore, this study aimed to assess the prevalence of MDD among children aged 6–23 months in Ethiopia and the contributing factors of inequalities.
The 2019 Ethiopia Mini Demographic and Health Survey (EMDHS) dataset was utilized for this study (https://www.dhsprogram.com/data/dataset_admin/login_main.cfm website). Ethiopia, located at the Horn of Africa, lies between latitudes 3° and 15° North and longitudes 33° and 48° East, encompassing a total area of 1,100,000 square kilometers. It comprises 11 ethnically and politically autonomous regional states, along with two administrative cities. The data were collected through a community-based cross-sectional survey from 21 March to 28 June 2019.
A two-stage stratified sampling design was employed. In the first stage, region-based stratification was performed. Next, the regions were stratified by rural and urban areas. Thereafter, using the probability proportional sampling technique, 94 urban and 211 rural enumeration areas were selected. In the second stage, applying a systematic sampling technique, households were selected from each enumeration area. Regarding child nutritional status, data were collected. In each selected household, women of reproductive age with children under 2 years of age were interviewed using an individual questionnaire after they were informed about the importance of the study, and ethical permission was obtained from each participant. The DHS database provides detailed information regarding the data collection and sampling procedures (19). The study population included children aged 6–23 months.
MDD was the outcome variable. The outcome variable was coded as “yes” if the child aged 6–23 months received at least five out of eight groups of food types and as “no” if the child received four or fewer out of eight food groups during the previous days of the survey. The eight food groups were as follows: (1) breastfeeding, (2) flesh foods (poultry, fish, meat, and liver or organ meats), (3) eggs, (4) dairy products (cheese, yogurt, and milk), (5) tubers, roots, and grains, (6) nuts and legumes, (7) vegetables and fruits rich in vitamin A, and (8) other vegetables and fruits considering the World Health Organization (WHO) 2008 MDD classification approach (20).
The following factors were used to conduct the decomposition of the concentration index (CIX): age of the mother (15–19, 20–34, 35–49), residence (urban, rural), age of the child in months (6–12, 13–18, and 19–23), respondent’s religion (Muslim, Orthodox, Protestant, and others), marital status of the respondent (single, married), sex of the household’s head (male, female), administrative region of Ethiopia (Established regions, city administration, and emerging regions), ANC follow-up (no ANC, < 4 visits, and ≥4 visits), place of delivery (home, facility delivery), birth order of the child (first, second, third, fourth, fifth, and sixth or above). The EMDHS calculated the wealth index of households based on the use of several indicator variables (17).
Two indicators were employed to assess the socio-economic inequality of MDD: the wealth index and educational status. The principal component analysis was applied to calculate the wealth index using household assets. Infrastructures and amenities included key household ownership assets (21). Household wealth status (highest, higher, middle, poorer, or poorest) and maternal educational status (no education, primary, or secondary and above) were measured as the main explanatory variables, as these variables were considered to calculate the CIX of MDD.
Primarily, data were filtered for the age range of 6–23 months, and thereafter, responses marked as “do not know” or missing were deleted. Finally, the figure of 1,518 unweighted children was obtained. Concentration curves were plotted to observe inequality in MDD based on the mother’s wealth status and educational level. The concentration curve of the 45° line represents equality; any deviation from this line indicates inequality. If the line of concentration curve is below 45°, it signifies that MDD was more concentrated among mothers who have good wealth status. Conversely, if it is above the 45° line, it suggests that MDD was concentrated among mothers with poor wealth status. The concentration curve interpretation for maternal education is the same as above. The CIX was calculated to quantify the level of concentration based on the formula developed by Jenkins, Kakwani, and Kakwani et al. (22–24).
The formula is as follows:
The weighted mean of MDD is represented by μ and r represents the distribution of educational status and wealth among individuals; cov(h, r) denotes the covariance between h and r. The value of the CIX is from an interval +1 to −1. The value of the CIX closer to +1 implies the upper quantile of the variable higher concentration. Conversely, the value of the CIX closer to −1 implies the lower quantile of the variable higher the concentration. Finally, to observe the explanatory variables’ contribution to the CIX, a decomposition of the CIX regarding the explanatory variables was conducted. O’Donnell et al. have developed the decomposition analysis method (25).
The formula is as follows:
Here, βk represents the coefficient of the kth explanatory variable, Xk denotes the kth explanatory variable, and ε represents the random error term.
The CIX for MDD can be decomposed as a result of the above regression model, as follows:
Where Xk is the average of the kth explanatory variable, Ck is the concentration for the kth explanatory variable, βkXk/μ represents the elasticity of dietary diversity for the kth explanatory variable, GCє/μ represents the part of the CIX that cannot be explained by the explanatory variables, and all other notations hold their usual meanings.
After performing the decomposition, the percentage contribution of each variable was plotted. Additionally, the concentration of MDD was observed by calculating the concentration curve and index using the wealth status and educational level of the mothers. All p-values were compared at a significance level of 0.05.
After data cleaning, 1,511 (weighted) children along with the background information of their parents were recruited. Approximately three-quarters (74.51%) of the parents were women aged 20–34 years, 44.56% of the women had no education, and 71.68% were rural dwellers. The result indicated that 51.81% of the children were male. A total of 39.05% of the children were in the age group of 6–12 months, 36.26% were in the age group of 13–18 months, and the remaining 24.69% were in the age group of 19–23 months (Table 1).
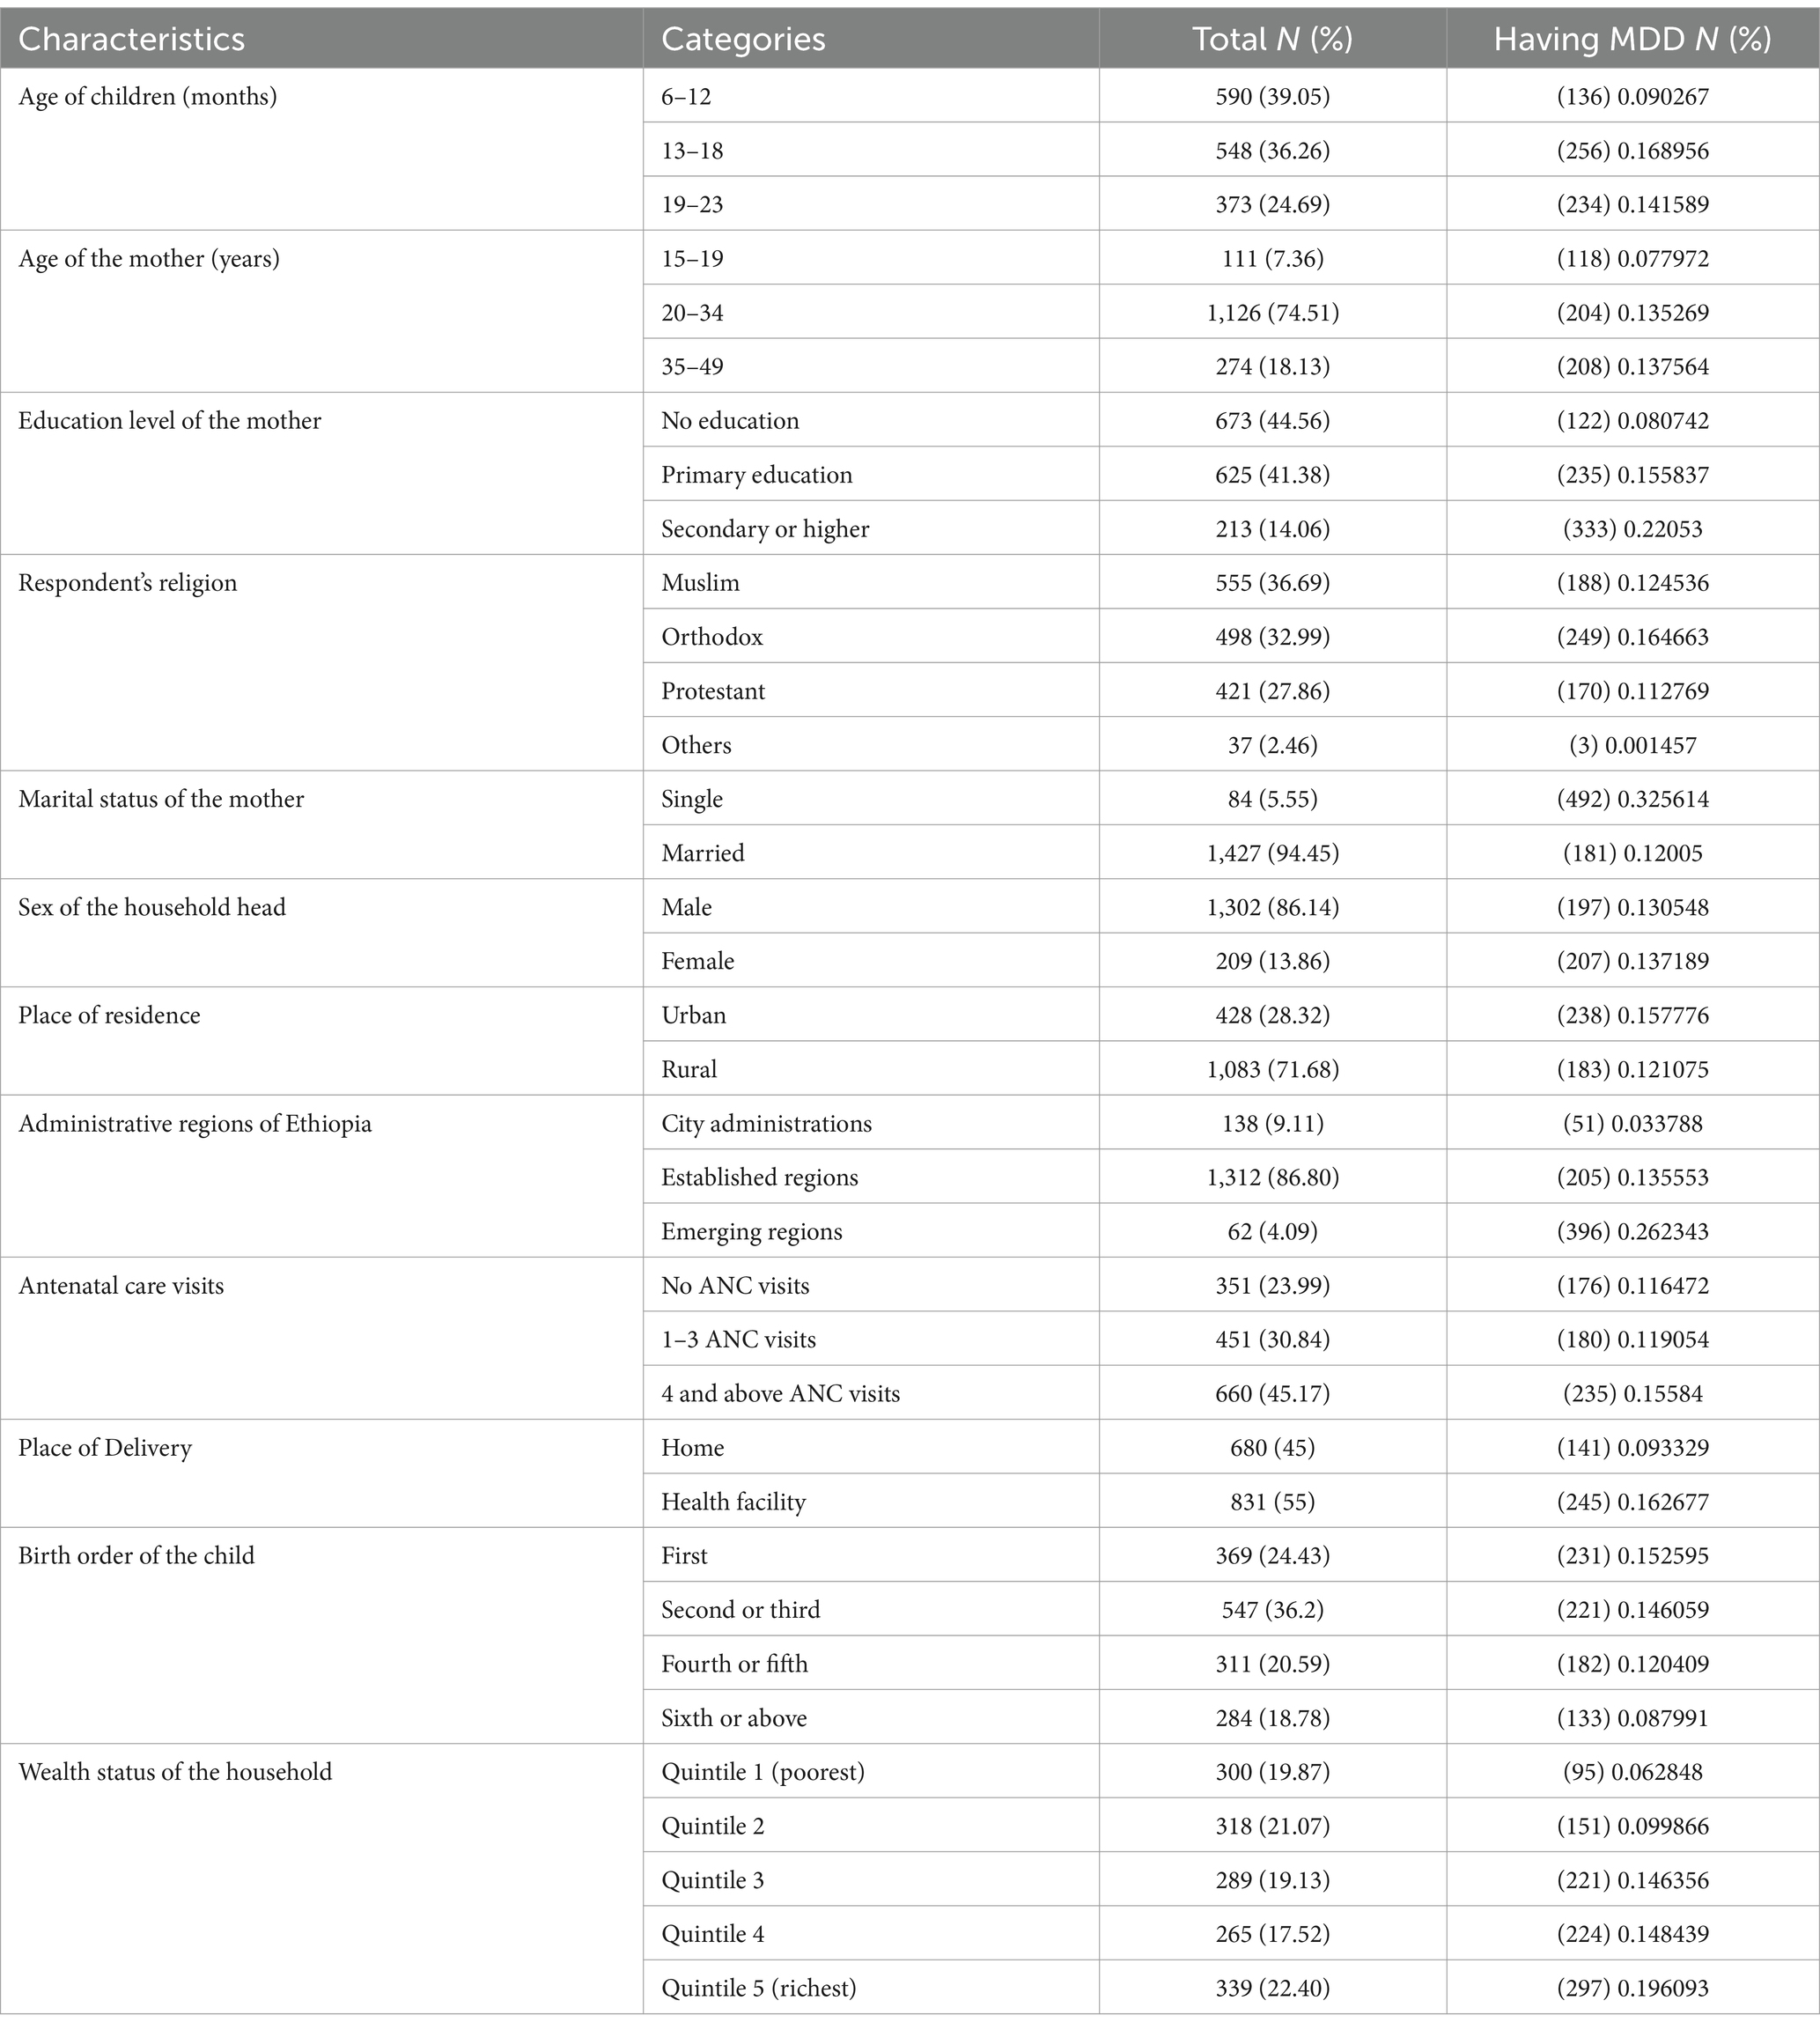
Table 1. Socioeconomic characteristics among children 6–23 months of age in Ethiopia, 2024.
The overall weighted sample size was 1,511 women who had children. The prevalence of MDD was 199 (13.15%). The prevalence of dietary diversity among children was 22% for mothers having higher educational status, 15.5% for mothers having a number of ANC visits totaling four or more, and 16.6% for mothers having health facilities deliveries (Table 1). Those variables were above the mean prevalence of MDD.
From the concentration curve of MDD against the wealth status and maternal education, the concentration curve shows values below the 45° line. Thus, the MDD of children is more concentrated among the mothers with higher wealth status (Figure 1) and higher maternal education (Figure 2). The concentration indices by household wealth status and maternal education were significantly associated: (CIX: 0.1034, p < 0.0029) and (CIX: 0.1057, p < 0.0002) for MDD, respectively. Therefore, higher wealth and education status of the mothers were significantly concentrated with MDD (Figure 3).
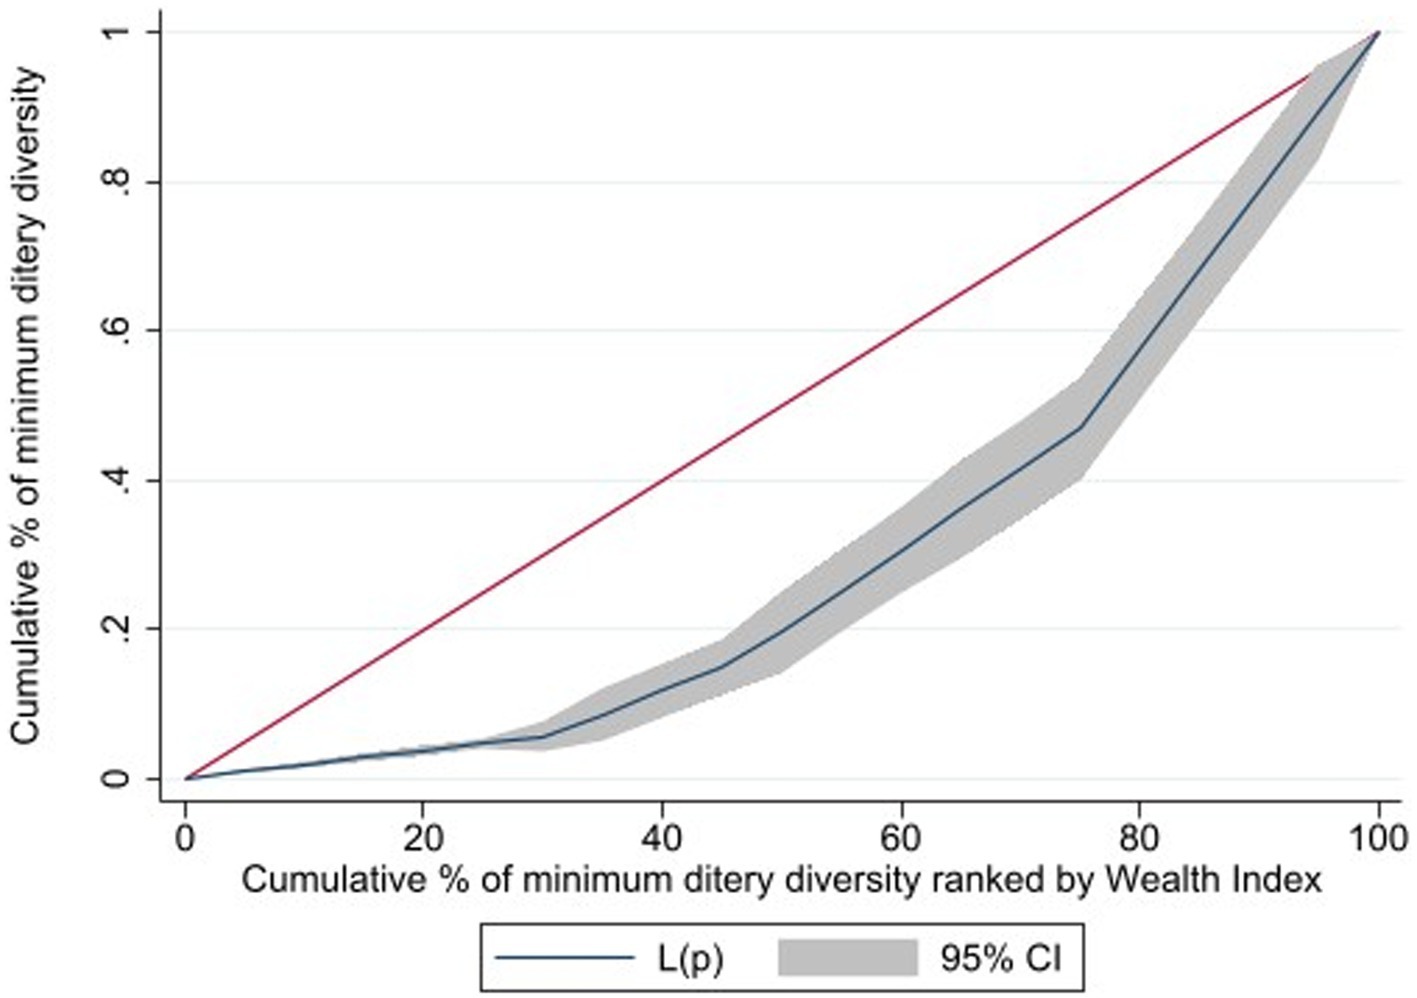
Figure 1. Cumulative percentage of minimum dietary diversity raked by wealth index children 6-23 months of age, in Ethiopia.
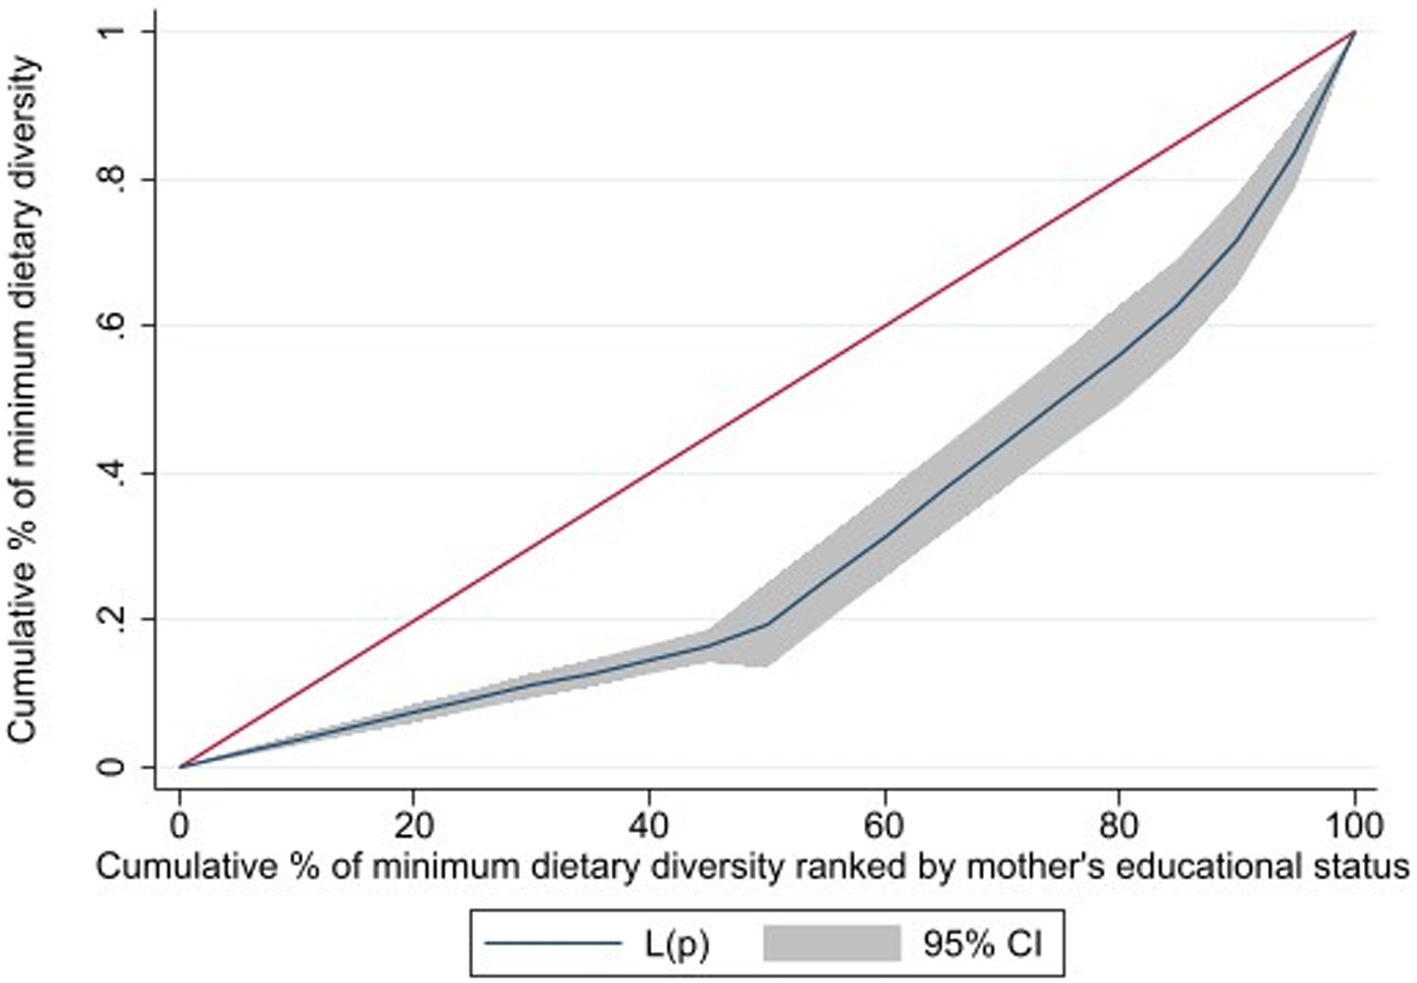
Figure 2. Cumulative percentage of minimum dietary diversity raked by maternal education status of children aged 6-23 months, in Ethiopia.
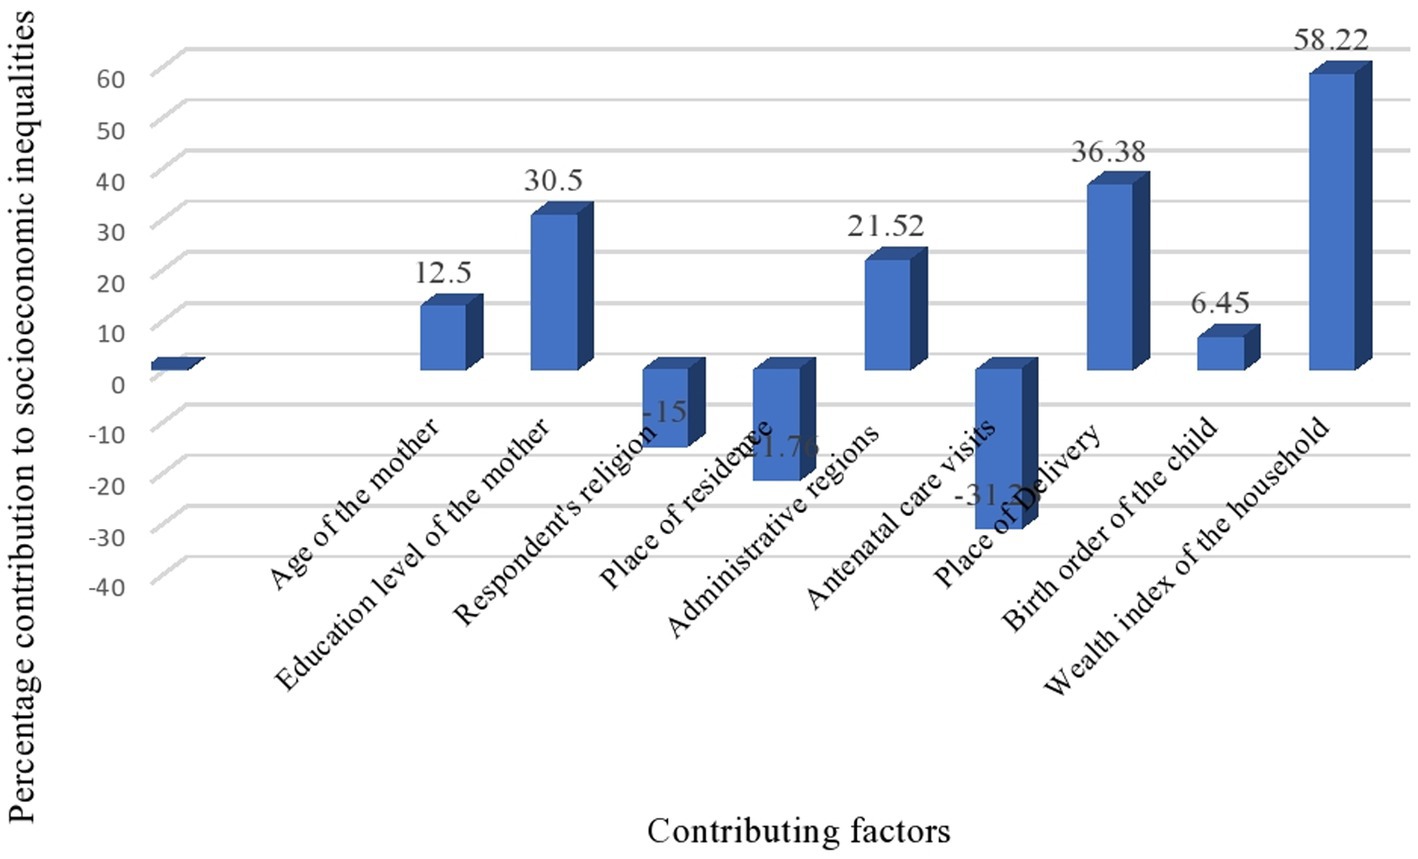
Figure 3. Percentage contribution of socio-economic inequality of MDD in Ethiopia.
Decomposition of the CIX was conducted to observe the contribution of explanatory variables on inequalities. The column percentage contribution in Tables 2, 3 illustrates the relative contribution of each explanatory variable on the overall. A negative contribution indicates factor supports a decrease in concentration, and a positive contribution indicates factor supports an increase in the observed inequality. The wealth and educational levels decomposed with respect to the CIX were presented in Tables 2, 3, respectively. The decomposition analysis revealed the contribution of household wealth status to inequalities in MDD in Ethiopia: 58.23% contributed by wealth status, 36.38% by place of delivery, 30.47% by maternal educational level, and 21.5% by administration region. The contribution of ANC visits is −31.2% and place of residence −21.7%, which indicates that ANC visits and women’s place of residence supports a decrease of the observed CIX. Moreover, the observed CIX cannot explain 5.53% of the explanatory variables.
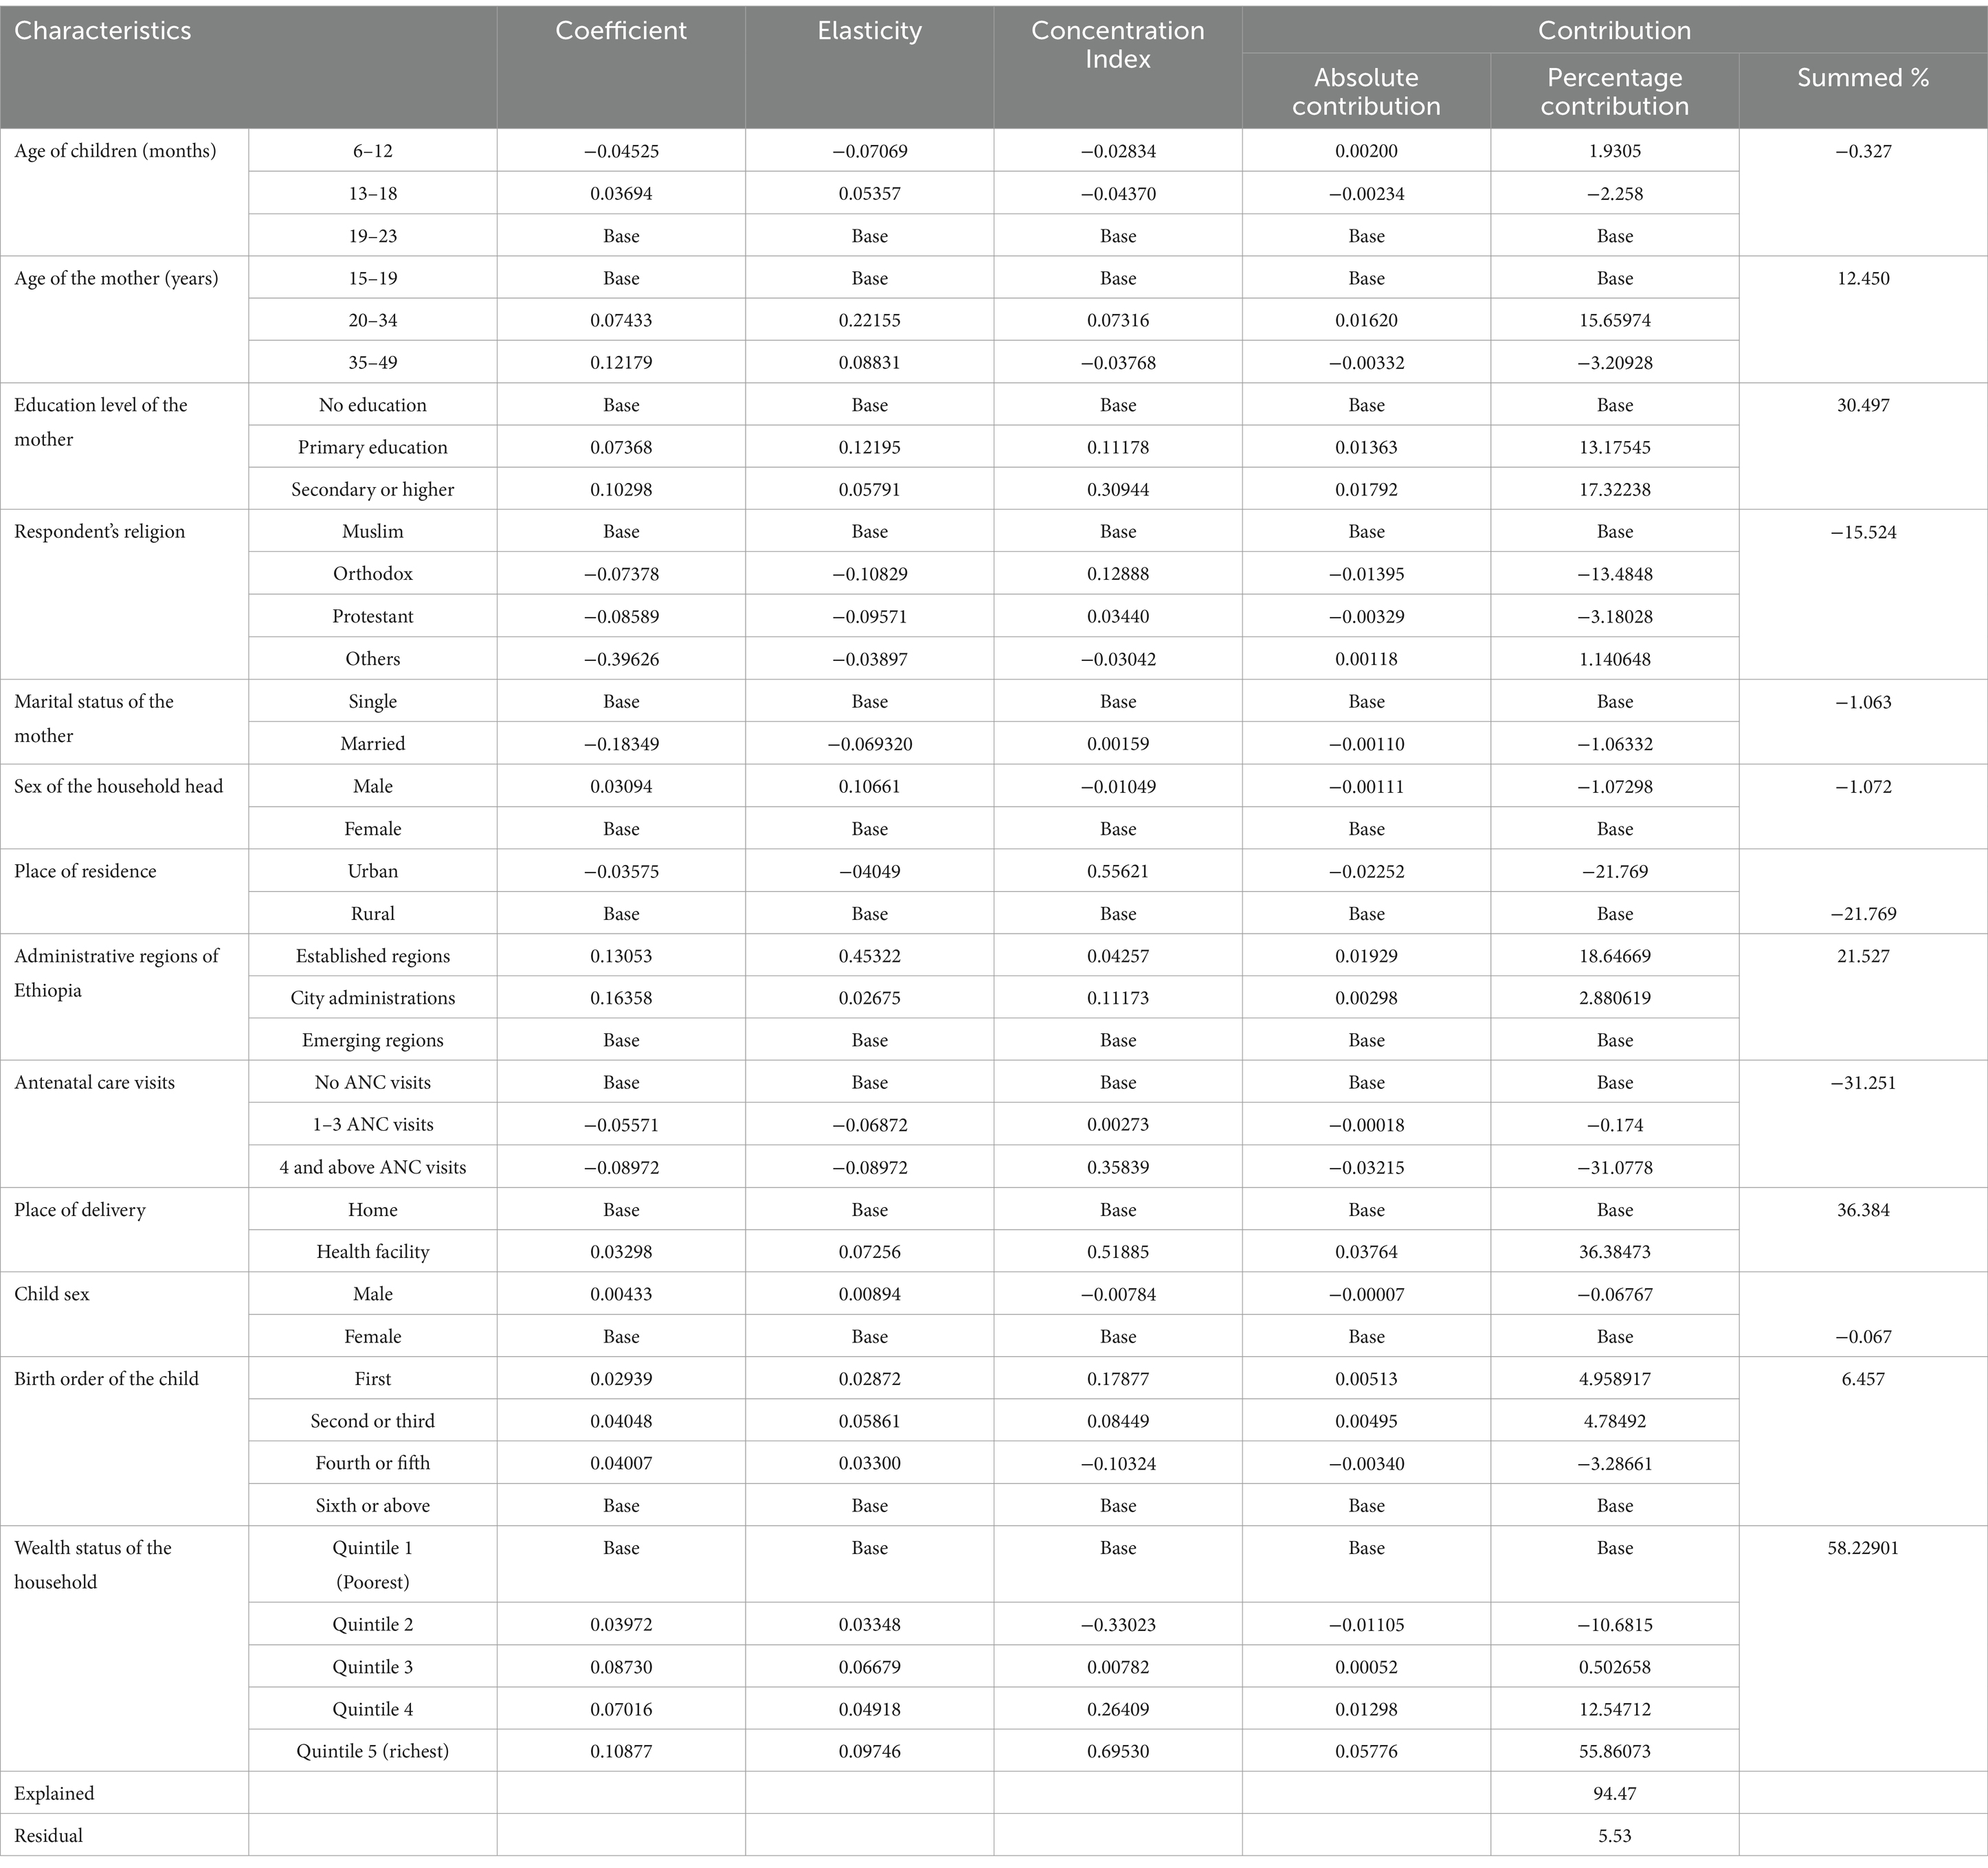
Table 2. A decomposition analysis of wealth status inequalities in MDD in Ethiopia, 2024.
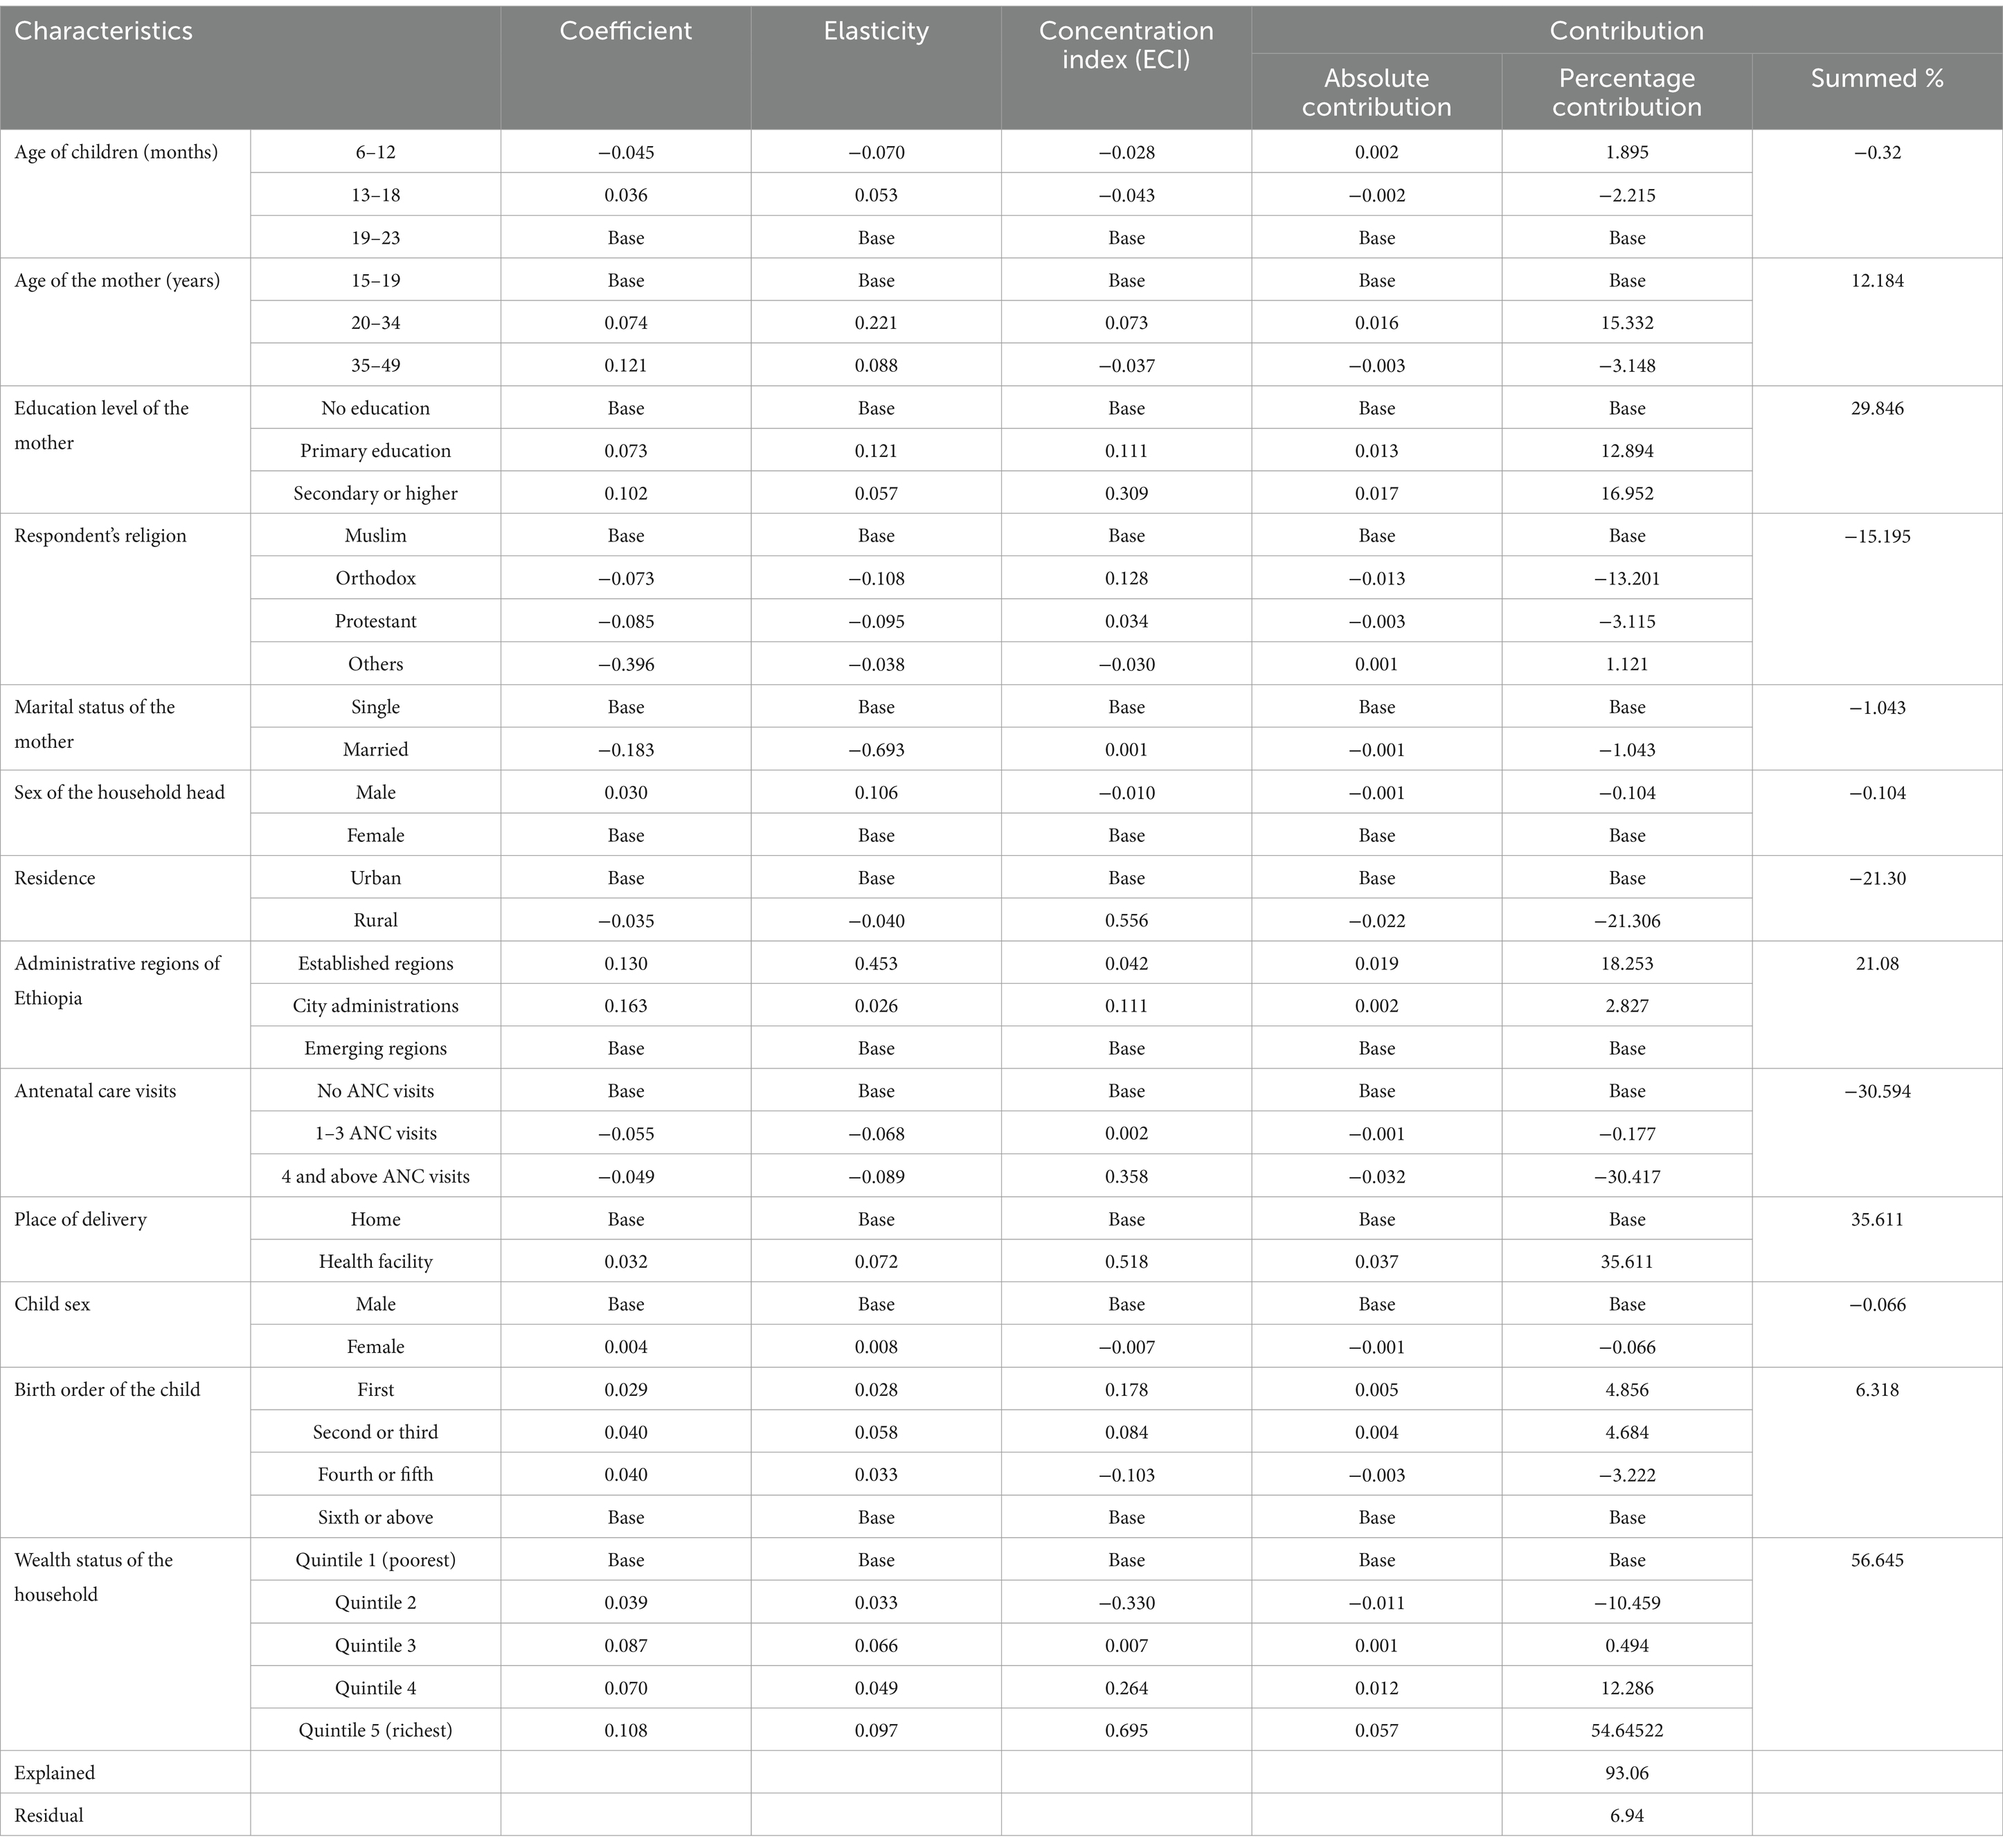
Table 3. A decomposition analysis of educational status inequalities in MDD in Ethiopia, 2024.
Similarly, the decomposition of the CIX was a product of the educational status of the mothers were (CIX: 0.1057, p < 0.0002) where 29.8% were contributed by maternal educational status, 56.64% by wealth status, 35.61% by place of delivery, and 21.1% by place of regional administration. Overall, these factors contributed to MDD inequality among children aged 6–23 months. The contribution by place of residence is −21.3% and − 30.5% by ANC visit, which indicates that place of residence and ANC visits help to decrease the observed CIX. Unexplained factors or residuals contributed to the remaining 6.94% of the inequality observed in this study.
This is a pioneering study to examine the wealth and educational status of the mothers and MDD inequalities among children aged 6–23 months in Ethiopia. It is also decomposed into the contributing factors. MDD prevalence was found to be 13.15% (199)—extremely low in comparison to other national studies (7, 26).
The results indicated that the WHO’s MDD criteria were met in the case of children from wealthier households and those born to mothers with higher educational attainments. The decomposition analysis revealed that 58.23, 36.38, 30.47, and 21.5% contributed by wealth status, place of delivery, maternal education, and region, respectively—this explains the pro-rich inequalities in MDD in Ethiopia. The result of pro-rich wealth-related inequalities in MDD was from previous studies (8, 16, 26–28).
The distribution of child MDD feeding practice was higher for women with higher educational status. The results are in line with those derived from research conducted in Pakistan, Indonesia, and India (2, 16, 29). The possible reason might be that educated women may be more aware of the importance of consuming a variety of food groups, their nutritional content, and the health benefits of dietary diversity. However, these findings do not imply the other way around; instead, they reveal that MDD is unfairly concentrated among children from the richest and most educated households (30).
Household wealth status is the principal factor for (58.23%) of inequalities in MDD—a finding in line with findings obtained in India and Bangladesh (27, 31, 32). Diet diversification depends on the accessibility, availability, and utilization of food groups; wealthier households are more likely to have enough and varied nutritious food groups or resources to consume (15). Therefore, high-income households are more likely to purchase (33) as well as enjoy greater access and availability of various food groups at the household level (34).
Similarly, the decomposition of the CIX computed based on the educational status of the mothers indicated that 29.8% was contributed by maternal educational status. Previous studies have suggested a direct influence of maternal education level on MDD practices for children (18, 35). This is probably because mothers with higher educational status possess better dietary knowledge, health literacy, dietary information-seeking behaviors and understanding, and critical thinking skills related to child nutrition. However, the contributions of the place of residence and ANC visits were − 21.3% and − 30.5, respectively, indicating that these factors help to decrease the observed CIX. Moreover, 6.94% of the observed CIX might not be explained. Initiatives and strategies focusing on enhancing women’s role in society, such as skill-based education, well-paid job opportunities, and better health facilities need to be implemented (2).
The decomposition analysis revealed that household wealth status, of which 36.38% was contributed by place of delivery and 21.5% administration region, explained the pro-rich inequalities in MDD in Ethiopia. Mothers who had delivered in a health institution had better access to information and counseling, received better follow-up care and guidance from healthcare providers, and supported breastfeeding practices. Therefore, it would be a positive contribution to MDD. Counseling by healthcare providers could contribute to improved diet diversification for children (36).
National–regional arrangements also significantly contributed to MDD among mothers with children aged 6–23 months. In the Ethiopian context, regional administration can be categorized as follows: emerging, established, and city administration. Emerging administration could experience challenges related to infrastructure, access to diverse food sources, and cultural and traditional feeding practices considered inappropriate (37, 38). Established and city administrations have relatively better access to a variety of food groups, infrastructure, health information, and health services, resulting in better MDD utilization. However, the contribution of ANC visits is −31.2% and that of place of residence is −21.7%, indicating that these factors had a role in decreasing the observed CIX. Additionally, 5.53% of the observed CIX was not explained by the contributor variables. The imparting of nutrition education to women to improve the practice of diversified diet in Ethiopia began with the Sekota declaration campaign. Despite the palpable improvement, the challenge persists.
This study utilized the latest dataset to assess the wealth- and education-related disparities in MDD in Ethiopia. The nuanced examination of the method of analysis (decomposition) helped ascertain the specific factors contributing to the overall outcome, and provided a quantifiable measure of the extent to which each factor contributes to the observed variation. The generalizability of the findings could be extended to the broader population of Ethiopia. Nonetheless, MDD is assessed based on a 24-h food recall, which could induce inaccuracy and recall bias. Although the analysis of decomposition helps to identify multiple elements influencing MDD inequality, causal links could not be established. This challenge also arises when working with cross-sectional data. To mitigate this limitation, we recommended longitudinal studies for future researchers.
This study indicated significant disparities in the socio-economic inequality related to MDD among children aged 6–23 months in Ethiopia based on differences in the wealth and educational levels of households. The findings highlight the importance of using multi-sectoral strategies to tackle the root causes of socio-economic disparities in MDD. Therefore, policymakers and healthcare workers should prioritize women with low levels of income and education. Improving access to and quality of institutional maternal health services is essential to creating awareness regarding diet diversification for children. Nutrition-sensitive actions require multi-sectoral collaboration among the agriculture, health, and education sectors—among others—to address educational disparities and wealth inequality for significant improvement in MDD among children. By implementing targeted educational programs that promote nutritional awareness and providing financial support to low-income families, policymakers can ensure that all children have access to a diverse and nutritious diet. Additionally, integrating nutrition education into school curricula can empower families and communities to make informed dietary choices, ultimately contributing to better health outcomes for children.
The original contributions presented in the study are included in the article/supplementary material, further inquiries can be directed to the corresponding author.
NW: Conceptualization, Data curation, Formal analysis, Investigation, Methodology, Project administration, Resources, Software, Supervision, Validation, Visualization, Writing – original draft, Writing – review & editing. AW: Data curation, Methodology, Software, Validation, Visualization, Writing – original draft, Writing – review & editing, Formal analysis. LY: Data curation, Formal analysis, Software, Validation, Visualization, Writing – original draft, Writing – review & editing, Methodology. MG: Data curation, Validation, Visualization, Writing – original draft, Writing – review & editing, Formal analysis, Methodology, Software. WN: Data curation, Formal analysis, Methodology, Software, Validation, Visualization, Writing – original draft, Writing – review & editing. AY: Formal analysis, Methodology, Software, Validation, Visualization, Writing – original draft, Writing – review & editing, Data curation. LA: Data curation, Formal analysis, Software, Validation, Visualization, Writing – original draft, Writing – review & editing, Methodology. HA: Data curation, Formal analysis, Methodology, Software, Validation, Visualization, Writing – original draft, Writing – review & editing. DG: Formal analysis, Methodology, Software, Validation, Visualization, Writing – original draft, Writing – review & editing, Data curation. MJ: Data curation, Formal analysis, Methodology, Software, Validation, Visualization, Writing – original draft, Writing – review & editing. KD: Data curation, Formal analysis, Methodology, Software, Validation, Visualization, Writing – original draft, Writing – review & editing. MT: Data curation, Formal analysis, Methodology, Software, Validation, Visualization, Writing – original draft, Writing – review & editing. AH: Data curation, Formal analysis, Methodology, Software, Validation, Visualization, Writing – original draft, Writing – review & editing.
The author(s) declare that no financial support was received for the research, authorship, and/or publication of this article.
We would like to acknowledge the DHS program for granting permission to use the data.
The authors declare that the research was conducted in the absence of any commercial or financial relationships that could be construed as a potential conflict of interest.
All claims expressed in this article are solely those of the authors and do not necessarily represent those of their affiliated organizations, or those of the publisher, the editors and the reviewers. Any product that may be evaluated in this article, or claim that may be made by its manufacturer, is not guaranteed or endorsed by the publisher.
ANC, antenatal care; CIX, concentration index; EMDHS, Ethiopia mini demographic and health survey; MDD, minimum dietary diversity.
1. Institute EPH: Assessment of status of infant and young child feeding (IYCF) practice, policy and programs: achievements and gaps in Ethiopia. (2016). Available at: http://repository.iifphc.org/handle/123456789/475
2. Asif, AM, and Akbar, M. A non-linear decomposition analysis of children’s dietary diversity scores: explaining rural-urban inequality. Qual Quant. (2023) 57:3273–84. doi: 10.1007/s11135-022-01501-x
3. United Nations Children’s Fund. (UNICEF), World Health Organization (WHO), International Bank for Reconstruction and Development/The World Bank. Levels and trends in child malnutrition: UNICEF / WHO / World Bank Group Joint Child Malnutrition Estimates: Key findings of the (2023). New York: UNICEF and WHO.
4. WHO. Global nutrition targets 2025: policy brief series (WHO/NMH/NHD/14.2). Geneva: World Health Organization. (2014).
5. WHO Consultation on Obesity (1999: Geneva, Switzerland) and World Health Organization. (2000) Obesity: preventing and managing the global epidemic: report of a WHO consultation. World Health Organization. Available at: https://iris.who.int/handle/10665/42330
6. Nation, U. (2023) Available at: https://www.ohchr.org/en/special-procedures/sr-food/about-right-food-and-human-rights (Accessed 12 May, 1999).
7. Rahman, MA, Kundu, S, Rashid, HO, Tohan, MM, and Islam, MA. Socio-economic inequalities in and factors associated with minimum dietary diversity among children aged 6–23 months in South Asia: a decomposition analysis. BMJ Open. (2023) 13:e072775. doi: 10.1136/bmjopen-2023-072775
8. Hien, A, Some, J, Toe, L, Sombie, O, Meda, N, Ilboudo, B, et al. Factors associated with minimum dietary diversity, minimum meal frequency and minimum acceptable diet practices among children 6-23 months of age in Bobo-Dioulasso, Burkina Faso. Afr J Food Agric Nutr Dev. (2023) 23:22831–52. doi: 10.18697/ajfand.118.22580
9. WFP. The cost of hunger in Ethiopia. Implications for the Growth and Transformation of Ethiopia. Available at: http://sa.au.int/en/sites/default/files/FINAL%20Ethiopia%20-%20COHA%20Summary%20Report%20June%2020_24pg_72dpi.pdf (2013)
10. Hawkes, C, Demaio, AR, and Branca, F. Double-duty actions for ending malnutrition within a decade. Lancet Glob Health. (2017) 5:e745–6. doi: 10.1016/S2214-109X(17)30204-8
11. Unicef: Annual Results Report. Nutrition (Burbank, Los Angeles County, Calif). Available at: https://www.unicef.org/media/49686/file/2015ARR_Nutrition.pdf (2015)
12. Nations FaAOotU. Guidelines for measuring household and individual dietary diversity. Available at: https://www.fao.org/documents/card/en?details=5aacbe39-068f-513b-b17d-1d92959654ea (2013)
13. Health JHBSoP: Seqota declaration innovation phase- impact assessment. (2021) Available at: http://repository.iphce.org/xmlui/handle/123456789/1981 (Accessed June, 2021).
14. Government of Ethiopia, Federal Ministry of Health. National Guideline for Adolescent, Maternal, Infant and Young child Nutrition, Addis Ababa: FMOH. (2022)
15. Ministry of Health E: Sequota declaration implementation plan (2016–2030). Available at: http://repository.iifphc.org/handle/123456789/1417 (Accessed March, 2016)
16. Paramashanti, BA, Dibley, MJ, Alam, A, and Huda, TM. Wealth-and education-related inequalities in minimum dietary diversity among Indonesian infants and young children: a decomposition analysis. Glob Health Action. (2022) 15:2040152. doi: 10.1080/16549716.2022.2040152
17. Mohammed, A, Tareke, AA, Keleb, A, Kebede, N, Tsega, Y, Endawkie, A, et al. Urban–rural disparities in minimum acceptable diet intake among children aged 6–23 months in Ethiopia: a multivariable decomposition analysis of Ethiopian demographic and health survey 2019. Front Public Health. (2024) 12:1361673. doi: 10.3389/fpubh.2024.1361673
18. Leventhal, DG, Crochemore-Silva, I, Vidaletti, LP, Armenta-Paulino, N, Barros, AJ, and Victora, CG. Delivery channels and socioeconomic inequalities in coverage of reproductive, maternal, newborn, and child health interventions: analysis of 36 cross-sectional surveys in low-income and middle-income countries. Lancet Glob Health. (2021) 9:e1101–9. doi: 10.1016/S2214-109X(21)00204-7
19. Ethiopian Public Health Institute (EPHI) [Ethiopia] and ICF. Ethiopia Mini Demographic and Health Survey 2019: Key Indicators. Rockville, Maryland, USA: EPHI and ICF. (2019).
20. WHO Guideline for complementary feeding of infants and young children 6 -23 months of age. World Health Organization. (2023)
22. Kakwani, NC. Income inequality and poverty. Oxford University Press: World Bank. New York: (1980).
23. Kakwani, N, Wagstaff, A, and Van Doorslaer, E. Socioeconomic inequalities in health: measurement, computation, and statistical inference. J Econ. (1997) 77:87–103. doi: 10.1016/S0304-4076(96)01807-6
24. Jenkins, S. Calculating income distribution indices from micro-data. Natl Tax J. (1988) 41:139–42. doi: 10.1086/NTJ41788716
25. Wagstaff, A, O'Donnell, O, Van Doorslaer, E, and Lindelow, M. Analyzing health equity using household survey data: A guide to techniques and their implementation. NW Washington, DC: World Bank Publications (2007).
26. Kundu, S, Das, P, Rahman, MA, Al Banna, MH, Fatema, K, Islam, MA, et al. Socio-economic inequalities in minimum dietary diversity among Bangladeshi children aged 6–23 months: a decomposition analysis. Sci Rep. (2022) 12:21712. doi: 10.1038/s41598-022-26305-9
27. Bhati, D, Tripathy, A, Mishra, PS, and Srivastava, S. Contribution of socio-economic and demographic factors to the trend of adequate dietary diversity intake among children (6–23 months): evidence from a cross-sectional survey in India. BMC Nutr. (2022) 8:153. doi: 10.1186/s40795-022-00655-z
28. Belay, DG, Taddese, AA, and Gelaye, KA. Does socioeconomic inequality exist in minimum acceptable diet intake among children aged 6–23 months in sub-Saharan Africa? Evidence from 33 sub-Saharan African countries’ demographic and health surveys from 2010 to 2020. BMC Nutr. (2022) 8:30. doi: 10.1186/s40795-022-00521-y
29. Shifti, DM, Chojenta, C, Holliday, EG, and Loxton, D. Socioeconomic inequality in short birth interval in Ethiopia: a decomposition analysis. BMC Public Health. (2020) 20:1–13. doi: 10.1186/s12889-020-09537-0
30. Alamneh, AB, Abate, KH, Assaye, AM, Demlie, YW, Guma, ME, and Belachew, T. Experience of caregivers on the continuum of care and prevention of malnutrition among children with cholera in Ethiopia: a phenomenology study. BMC Public Health. (2024) 24:614. doi: 10.1186/s12889-024-18080-1
31. Bansal, A, Arora, P, Sharma, R, and Misra, A: Dietary diversity among Indian adolescents and young adults: Evidence from UDAYA study. (2021)
32. Kumar, R, Mahmood, T, Naeem, N, Khan, SA, Hanif, M, and Pongpanich, S. Minimum dietary diversity and associated determinants among children aged 6–23 months in Pakistan. Sci Rep. (2024) 14:2639. doi: 10.1038/s41598-024-51705-4
33. Abou-Rizk, J, Jeremias, T, Cocuz, G, Nasreddine, L, Jomaa, L, Hwalla, N, et al. Food insecurity, low dietary diversity and poor mental health among Syrian refugee mothers living in vulnerable areas of greater Beirut, Lebanon. Br J Nutr. (2022) 128:1832–47. doi: 10.1017/S0007114521004724
34. Zebadia, E, and Atmaka, DR. Factors associated with minimum dietary diversity among 6-11-month-old children in Indonesia: analysis of the 2017 Indonesian demographic and health survey. Public Health Prevent Med Archive. (2021) 9:132–8. doi: 10.15562/phpma.v9i2.340
35. Fagbamigbe, AF, Adebola, OG, Dukhi, N, Fagbamigbe, OS, and Uthman, OA. Exploring the socio-economic determinants of educational inequalities in diarrhoea among under-five children in low-and middle-income countries: a Fairlie decomposition analysis. Arch Public Health. (2021) 79:1–17. doi: 10.1186/s13690-021-00639-8
36. Singh, SK, Srivastava, S, and Chauhan, S. Inequality in child undernutrition among urban population in India: a decomposition analysis. BMC Public Health. (2020) 20:1–15. doi: 10.1186/s12889-020-09864-2
37. WHO U. Global nutrition monitoring framework: Operational guidance for tracking progress in meeting targets for 2025. Geneva: World Health Organization (2017).
Keywords: inequities, socioeconomic inequality, dietary diversity, concentration curve, concentration index, decomposition analysis, Ethiopia
Citation: Worku N, Workie AM, Yohannes L, Getnet M, Negash WD, Yeshambel Belay A, Asmare L, Alemu HT, Geberu DM, Jejaw M, Demissie KA, Tiruneh MG and Hagos A (2025) Socio-economic inequalities in minimum dietary diversity among Ethiopian children aged 6–23 months: a decomposition analysis. Front. Public Health. 12:1422563. doi: 10.3389/fpubh.2024.1422563
Edited by:
Tizta Degfie, Bahir Dar University, EthiopiaReviewed by:
Aida Turrini, Independent Researcher, Scansano, ItalyCopyright © 2025 Worku, Workie, Yohannes, Getnet, Negash, Yeshambel Belay, Asmare, Alemu, Geberu, Jejaw, Demissie, Tiruneh and Hagos. This is an open-access article distributed under the terms of the Creative Commons Attribution License (CC BY). The use, distribution or reproduction in other forums is permitted, provided the original author(s) and the copyright owner(s) are credited and that the original publication in this journal is cited, in accordance with accepted academic practice. No use, distribution or reproduction is permitted which does not comply with these terms.
*Correspondence: Nigusu Worku, bmlndXN1d29ya3UyOUBnbWFpbC5jb20=
Disclaimer: All claims expressed in this article are solely those of the authors and do not necessarily represent those of their affiliated organizations, or those of the publisher, the editors and the reviewers. Any product that may be evaluated in this article or claim that may be made by its manufacturer is not guaranteed or endorsed by the publisher.
Research integrity at Frontiers
Learn more about the work of our research integrity team to safeguard the quality of each article we publish.