 Yizhong Ye1,2
 Qunshan Tao
- 1School of Hospital Economics and Management, Anhui University of Chinese Medicine, Hefei, China
- 2Key Laboratory of Data Science and Innovative Development of Chinese Medicine in Anhui Province Philosophy and Social, Hefei, China
Air pollution has long been a significant environmental health issue. Previous studies have employed diverse methodologies to investigate the impacts of air pollution on public health, yet few have thoroughly examined its spatiotemporal heterogeneity. Based on this, this study investigated the spatiotemporal heterogeneity of the impacts of air pollution on public health in 31 provinces in China from 2013 to 2020 based on the theoretical framework of multifactorial health decision-making and combined with the spatial durbin model and the geographically and temporally weighted regression model. The findings indicate that: (1) Air pollution and public health as measured by the incidence of respiratory diseases (IRD) in China exhibit significant spatial positive correlation and local spatial aggregation. (2) Air pollution demonstrates noteworthy spatial spillover effects. After controlling for economic development and living environment factors, including disposable income, population density, and urbanization rate, the direct and indirect spatial impacts of air pollution on IRD are measured at 3.552 and 2.848, correspondingly. (3) China’s IRD is primarily influenced by various factors such as air pollution, economic development, living conditions, and healthcare, and the degree of its influence demonstrates an uneven spatiotemporal distribution trend. The findings of this study hold considerable practical significance for mitigating air pollution and safeguarding public health.
1 Introduction
Human health has long been considered paramount for personal development and social progress (1). Globally, air pollution is acknowledged as the fourth leading threat to human health, resulting in inevitable health repercussions and substantial economic burdens (2). Data indicate that 4.47 and 5.05% of daily hospital emergency room visits in China are attributable to PM1 (particles with a diameter less than 1 micron) and PM2.5 pollution, respectively (3). Additionally, estimates from the Global Burden of Disease Study suggest that air pollution caused 1.85 million deaths in China, with 1.42 million attributed to particulate matter (PM) pollution (4). Clearly, air pollution has emerged as a significant factor jeopardizing public health in China. Therefore, it is imperative at this stage to conduct specific and accurate empirical studies on the relationship between air pollution and public health to mitigate its detrimental effects.
Researchers in the fields of epidemiology and environmental toxicology have conclusively established that air pollution not only poses a substantial threat to public physical health but also detrimentally impacts mental well-being (5, 6). Specifically, air pollution significantly influences the onset of various diseases, including cardiovascular diseases, cancer, pneumonia, and neurocognitive impairments (7–12). However, these studies have predominantly focused on the individual-level pathogenesis of air pollution on public health, neglecting the influence of other crucial determinants, such as economic development, living environment, and healthcare (13). Additionally, air pollution demonstrates significant negative externalities and regional correlations. Thus, it is imperative to adequately consider the spatial relationship between a region and its neighbors when studying the impacts of air pollution on public health outcomes (14–17). Recently, some scholars have highlighted a strong spatial correlation between air pollution and public health outcomes in China (18). However, further empirical evidence is required to substantiate the spatial impacts of air pollution on public health outcomes in China. Furthermore, researchers in socio-economic and other fields have conducted numerous studies on the relationship between air pollution and public health (19–24). Notably, these studies are commonly analyzed using empirical methods such as ordinary least squares, poisson regression, and generalized linear regression (25–28). While these methods can assess the impacts of air pollution on public health, they tend to rely on the assumption of fixed parameters. The estimation of model parameters is typically confined to either temporal or spatial dimensions individually. This limitation prevents the simultaneous consideration of parameter heterogeneity in both temporal and spatial dimensions, resulting in inaccurate estimates (29). To summarize, after fully considering China’s current reality and existing research gaps, the research motivation of this study is mainly reflected in the following three research questions: (1) How do factors such as air pollution, economic development, and the living environment influence public health in China? (2) What are the spatial impacts of air pollution on public health in China over a long time series at the interprovincial scale? (3) Are there spatiotemporal heterogeneities in the impacts of air pollution on public health from the perspective of regional differences in China?
Based on these considerations, the objectives of this study are multifaceted. First, on the basis of the theoretical framework of multifactorial health decision-making, this study comprehensively and systematically examines the role and influence of air pollution, economic development, and other factors on public health. Second, the spatial impacts of air pollution and related control variables on public health are examined thoroughly by constructing a spatial econometric model. Finally, geographically and temporally weighted regression (GTWR) models were employed to further analyze the spatiotemporal heterogeneity of the effects of air pollution and related control variables on public health. In summary, the potential contributions of this study include the following two main aspects: First, this study reexamines environmental health issues from a socioeconomic perspective and comprehensively analyzes the spatial impacts of air pollution and related control variables on public health, thus enriching the study of air pollution and public health. Secondly, considering the spatiotemporal heterogeneity of the variables used, this study constructs the GTWR model based on spatiotemporal relationships to study the spatiotemporal evolution characteristics of the influencing factors, especially in analyzing the spatiotemporal heterogeneity of interregional public health, which not only illustrates the reality of imbalances of regional economic and resource distributions in China, but also provides a useful supplement to previous related studies.
The remainder of the paper is structured as follows. Firstly, the paper reviews the pertinent literature. Subsequently, it describes the study area, research methodology, variable selection, and data sources. Following this, the study results, including the primary findings, are presented and discussed. Finally, the main conclusions and policy recommendations of the paper are summarized.
2 Literature review
2.1 The impact of air pollution on public health
Researchers have extensively focused on the impact of air pollution on public health. Scholars in medicine and public health have conducted numerous studies on this relationship. de Prado Bert et al. (30) conducted an epidemiological study confirming that air pollution adversely affects cognitive behavior and psychomotor activity in children due to exposure to air pollution. Based on Lee et al. (31) air pollution significantly exacerbates respiratory symptoms such as asthma and chronic obstructive pulmonary disease. Fu et al. (32) performed a comprehensive exploration of the effects of air pollutants such as particulate matter, ozone, and sulfur oxides on the nervous system, demonstrating that these pollutants can directly or indirectly damage it. Liang et al. (33) used a meta-analysis showing a significant increase in the risk of gestational diabetes due to air pollution. Shi et al. (34) demonstrated that chronic exposure to PM2.5 is significantly associated with an increased incidence of dementia in a cohort study. Requia et al. (35) investigated the relationship between daily PM2.5, NO2, and O3 levels and the number of hospitalizations for circulatory and respiratory diseases, showing a significant association between air pollution and hospital admissions for cardiopulmonary diseases. Demoury et al. (36) assessed the association between natural mortality and short-term exposure to air pollutants (PM2.5, PM10, NO2, and O3), finding that increased air pollution led to an increase in overall natural mortality. In China, Zhenyu et al. (37) discovered that fine particulate matter (PM2.5) significantly increased the risk of lung cancer based on incidence rates and annual concentrations of PM2.5. Liu et al. (38) estimated the association between air pollution and asthma mortality, highlighting that PM1 pollution had a more significant impact on asthma mortality compared to PM2.5 and PM10. Zhang et al. (39) evaluated the effect of air pollutant exposure on hospital admissions for congenital heart disease, concluding that exposure during pregnancy significantly increased the risk of congenital heart disease in perinatal infants. Li et al. (40) established a significant positive correlation between the increased risk of stroke hospitalization and short-term elevations of air pollutants such as SO2, NO2, and PM10. In summary, time-series or case-crossover studies detect associations between daily mortality (or morbidity) and changes in air pollution to capture its acute impacts, while cohort and cross-sectional studies reveal the increased risk of health hazards from long-term exposure.
2.2 The spatiotemporal impact of air pollution on public health
Notably, as the effects of air pollution frequently extend to adjacent regions, suggesting that air pollution leads to both direct and indirect geographical spillover effects (41). Mohammadi et al. (42) conducted a spatial analysis to explore the relationship between air pollution and mortality, revealing a positive spatial effect of pollutants like O3 and NO2 on mortality. Kim et al. (43) examined the bivariate correlation between air pollutants and the prevalence of allergic diseases in controlled environments, demonstrating the presence of significant spatial clustering and the need to consider the instability of local relationships when studying the effects of air pollution on disease. Aturinde et al. (44) performed a nationwide study investigating the spatial associations between various air pollutants and the prevalence of cardiovascular disease (CVD), highlighting significant spatial variations in the relationship between ambient air pollution and CVD hospital admissions across Sweden. Yim et al. (45) investigated the impact of PM10 particulate matter on the risk of pneumonia, revealing a significant spatial correlation between air pollution and the occurrence of pneumonia. Sarrias and Molina-Varas (46) quantified the spillover effect of PM2.5 pollution on emergency room visits for respiratory illnesses, demonstrating a significant spatial effect influence on the increase in overall visits. In China, Cao et al. (47) investigated the correlation between air quality and mortality due to respiratory diseases, showing a significant spatial correlation between PM2.5 pollution and respiratory disease mortality across all provinces in China. Zhang et al. (48) examined the interactive impacts of air pollution on public health. The study findings revealed that the escalation of air pollution significantly threatened the health of residents in both local and neighboring areas. Qin et al. (49) further investigated the spatial impacts of urban air pollution on public health, indicating a significant spillover effect of air pollution in urban areas. Additionally, other researchers have studied the diverse impacts of air pollution on public health, particularly in elucidating the spatial variability of influencing factors (50). Specifically, Cardoso et al. (51) assessed the spatial relationship between PM10 emissions and lung cancer mortality in the Portuguese region using a geographically weighted regression model. They confirmed that the effect of PM10 emissions on lung cancer mortality was higher in the northwestern part of the continent, while it was relatively small in the southern part. Chen et al. (52) explored the spatiotemporal relationship between air pollution and influenza using spatiotemporal weighted regression model. They found that the coefficients of air pollution on the intensity of influenza epidemics were opposite in the eastern and western parts of Fuzhou City in China. Yan et al. (53) assessed the potential spatial relationship between PM2.5 pollution and health inequality in China using the multi-scale geographically weighted regression model. They showed that the health inequality caused by PM2.5 pollution exhibited a spatial distribution trend of decreasing from east to west. Boakye et al. (54) conducted the multi-scale geographically weighted wegression model analysis of the social and spatial factors of cancer and non-cancer hazards due to air pollution. Their analysis demonstrated that there are spatial differences in exposure to air pollution-induced cancer and non-cancer risk outcomes for various racial and ethnic groups in the United States. Wang and Wang (55) analyzed the spatial variability of factors influencing PM2.5 pollution in the Yangtze River Delta region of China using a geographically weighted regression model. The study results indicated spatial heterogeneity in the influence of factors such as population density and the proportion of industries on PM2.5 pollution. Li and Managi (56) examined the relationship between subjective well-being and three air pollutants (SO2, NOx, and PM2.5), as well as their spatial variability in Japan using the random-effects-based geographically weighted regression model. They found that these air pollutants were negatively associated with human well-being, and that their negative impacts varied spatially.
Generally, the research methods discussed above can be utilized to assess the impacts of air pollution and related factors on public health. However, they often overlook the spatiotemporal heterogeneity of influencing factors, highlighting a necessity to enhance the precision of these methodologies. Specifically, the fundamental assumption of global regression models such as spatial lag model (SLM), spatial error model (SEM), spatial durbin model (SDM), and ordinary least squares (OLS) is that the relationship between the independent and dependent variables remains spatially consistent and does not vary across different spatial locations (57). This class of models offers a global perspective applicable to all spatial entities. However, significant spatial heterogeneity in air pollution, public health, and related influences may exist in the real world. Therefore, global regression models may yield inaccurate estimates (58). In contrast, geographically weighted regression (GWR) model serves as a localized regression method for exploring the spatial heterogeneity of air pollution, public health, and related influences (59). Specifically, the GWR model offers a novel approach to assessing spatial heterogeneity among spatial entities by computing multiple regression statistics for each entity (60). However, the GWR model inadequately addresses the influence of time series on public health, air pollution, and related factors. One approach to surmounting these challenges is the geographically and temporally weighted regression (GTWR) model proposed by Huang et al. (61). In contrast to the GWR model, this approach enhances estimation accuracy through the incorporation of temporal and non-stationary spatial weighting matrices (62). Based on this, Zhang et al. (63) examined the spatial and temporal correlation between chronic disease co-morbidities and the air pollutant PM2.5 among middle-aged and older adults in China from 2011 to 2018 using the GTWR model. Their empirical findings demonstrated the GTWR model superiority over traditional correlation algorithms. Furthermore, PM2.5 emerges as the primary risk factor for chronic disease co-morbidity prevalence among middle-aged and older adults. Its impact spans from the southeast coast to the inland regions, though diminishing from the coast towards inland areas. Wang et al. (64) employed the GTWR model to quantitatively assess the relationship between acute myocardial infarction (AMI) mortality and influential factors in China, from 2014 to 2016. Their study revealed that environmental factors, including air pollution, exerted a significant negative impact on AMI mortality, with variations observed across different locations and over time. Yu et al. (65) investigated the temporal and spatial heterogeneity of the relationship between provincial tuberculosis (TB) incidence rates and environmental and economic factors in China from 2004 to 2021 using the GTWR model. Their findings demonstrated that the GTWR model provided a better fit than both ordinary least squares (OLS) and geographically weighted regression (GWR) models. Moreover, TB incidence in China is predominantly influenced by macroeconomic and environmental factors, with varying degrees of impact observed across different times and regions. Overall, the feasibility of employing the GTWR model to evaluate the public health impacts of air pollution and related factors remains a challenge.
2.3 The impact of socio-economic and other factors on public health
In fact, the effects of air pollution on public health are influenced by a confluence of factors including economic development, healthcare, and living conditions (66). Consequently, scholars in socio-economic and related disciplines have extensively investigated the repercussions of air pollution on public health. Fischer and Heutel (67) substantiated the presence of a mechanism linking air pollution, economic fluctuations, and mortality by comparing air pollutant indices, unemployment rates, and economic shifts. Greenstone and Hanna (68) examined data regarding air pollution and health in developing countries, revealing a greater impact of air pollution on population health in certain developing nations in contrast to developed ones. Natalie et al. (69) assessed the influence of air pollution on public health using self-reported health data from German residents, showing a notable impact on residents’ self-reported health, particularly exacerbated amidst heightened socio-economic insecurity, unemployment, and residence in deprived areas. Deryugina et al. (70) further demonstrated that the impact of air pollution on mortality in the United States is influenced by healthcare utilization and healthcare costs. In China, Zhang et al. (71) assessed the correlation between outdoor air pollution and older adults’ cognitive function, discovering that the detrimental effects of air pollution to older adults’ cognitive function is influenced by seasonal variation, age, and education. Azimi et al. (72) shared a similar perspective, contending that regional disparities in economic, social, environmental, and healthcare factors result in notable geographical variations in the public health consequences of air pollution across different regions. Wu et al. (73) examined the relationship between household income growth and health risks related to air pollution, demonstrating that increased household income notably mitigates health risks from air pollution, particularly for gaseous pollutants (SO2 and NOx). Geng et al. (74) meanwhile, quantified the influence of various factors on PM 2.5-related fatalities in China, affirming that alterations in energy and climate policies, as well as economic structure, notably impact the number of deaths linked to PM 2.5. Pang et al. (75) investigated the influence of green space on the incidence of lung cancer associated with air pollution, revealing that areas with higher green space exhibit attenuated adverse effects of air pollution on lung cancer incidence.
2.4 Literature summary
The existing literature has thoroughly investigated the impacts of air pollution on public health, establishing a robust foundation for this study. Nonetheless, several pertinent studies in epidemiology and environmental toxicology have been conducted using non-randomized samples of individuals or specific regions. Simultaneously, these studies typically concentrate solely on the pathomechanisms of air pollution’s effects on public health, neglecting other influential factors like economic development and population density (76). Secondly, the existing literature often assumes independence among all public health domains, disregarding the spatial correlation of air pollution. This oversight results in estimation errors regarding the impact of air pollution on public health (77). Finally, in investigating the spatial impacts of air pollution on public health, most prior studies have relied on spatial panel modeling for empirical analysis, overlooking both spatial and temporal variations in influencing factors (78). Although some scholars in China have recently employed the GWR model to examine spatial variations in influencing factors, their failure to explore the temporal evolution of these factors has hindered a comprehensive explanation of their impacts.
Consequently, to address the limitations of prior studies and mitigate potential estimation bias and inconsistency, we enhance several aspects as follows. Firstly, based on the theoretical framework of multifactorial health decision-making, we constructed a spatial econometric model for influencing public health. Through this model, we can comprehensively assess the impacts of air pollution, economic development, and other factors on public health, and delve into the spatial correlation between air pollution and public health, thereby effectively mitigating estimation bias arising from endogeneity and overlooking spatial effects. Secondly, on a long-term interprovincial scale, this study provides a more rigorous interpretation of both direct and indirect spatial effects of air pollution, thereby enhancing the analysis of spatial impacts on public health and ensuring the scientific validity of the conclusions. Finally, this paper introduces the GTWR model to compare and analyze temporal changes in influencing factors across an eight-year time series, carefully considering local spatial heterogeneity. This approach aims to provide a more detailed and comprehensive understanding of the relationship between air pollution and public health across temporal and spatial scales.
3 Theoretical framework
In fact, scholars in socio-economics and related fields have demonstrated that many factors affect public health, especially the economy, environment, education, and healthcare (79). Therefore, we used Neidell’s theoretical framework of multifactorial health decision-making as a basis for describing the mechanisms by which air pollution, social, economic, and educational factors affect public health (80). Fundamentally, the framework asserts that health is not merely the result of biological factors or self-selection but is strongly influenced by a wide range of factors, including economic, social, environmental, and educational factors, as well as air pollution. These influences dynamically interact, resulting in a complex network that affects public health (81).
Specifically, economic factors are important determinants in the framework, including income levels, employment status, socio-economic status, and access to resources. Economic stability allows individuals to afford quality healthcare, nutritious food, and safe housing, all of which are necessary to maintain good health (82). In contrast, economic hardship can lead to poor living conditions and limited access to healthcare, each of which negatively impacts public health (83). For example, people of lower socio-economic status often face barriers to accessing healthcare services and promoting personal health, leading to delays in treatment, ineffective management of chronic diseases, and deterioration of health status (84).
Social factors play an essential role in shaping health outcomes, which including social support networks, community participation, cultural practices and social norms (85). On the one hand, strong social support networks can provide emotional support, reduce stress and encourage healthy behaviors in the general public (86). Additionally, the enhancement of public community participation fosters an individual’s sense of social belonging and purpose, which in turn promotes his or her mental and emotional health (87). On the other hand, cultural practices and social norms can promote or hinder the emergence of healthy behaviors in citizens (88). For instance, social norms that ignore mental health problems may exacerbate the emergence of mental health problems by preventing individuals from seeking help (89).
Environmental factors, like the quality of air and water and access to green spaces, which are crucial factors affecting public health. Poor environmental conditions such as severe air pollution may contribute to the development of respiratory diseases, cardiovascular problems and other health problems (90). On the contrary, having access to clean air, clean drinking water and green space for physical activity promotes public health and social well-being (91). In addition, scholars in the fields of epidemiology and environmental toxicology have noted that exposure to air pollutants can produce a range of health problems, from asthma and allergies to more serious diseases such as lung cancer and heart disease (92). Thus, the framework specifically emphasizes air pollution as an important environmental factor affecting public health.
Educational factors mainly include educational attainment, health literacy and the opportunity to receive health education. In general, higher levels of education are usually positively associated with better health outcomes. The reason for this is that higher levels of education usually equip individuals with relevant health knowledge and skills, which in turn promotes the development of healthy behaviors (93). Simultaneously, health literacy is also particularly important. This is because it enables individuals to attend to their own health information and engage in preventive health behaviors (94). Furthermore, increased access to health education can empower individuals to take control of their health, leading to better health outcomes (95).
The framework underscores the pivotal role of healthcare services in influencing public health. The healthcare system delivers essential services, including prevention, diagnosis, and treatment of diseases. Thus, access to quality and efficient healthcare is crucial for individuals to manage their health conditions and prevent complications (96). Simultaneously, an effective healthcare system not only treats diseases but also supports public health through integrated care that addresses physical, mental, and social needs (97). Additionally, the interaction between healthcare services and diseases is a central element of the framework. Specifically, disease conditions affect the healthcare needs of the public, while the availability and quality of healthcare services determine how efficiently these needs are met (98). Thus, the framework posits that mitigating the negative impact of diseases on an individual’s health functioning and health status can be achieved by improving the accessibility and quality of healthcare (99).
Furthermore, the framework further emphasizes the interconnectedness of various influences on health. This means that economic, social, environmental, and educational factors affecting public health do not exist in isolation but rather interact to influence health outcomes (100). For example, economic stability can increase citizen access to education, which in turn improves their health literacy and promotes the occurrence of healthy behaviors (101). Social support networks can promote physical and mental health by providing emotional support, alleviating the negative effects of economic hardship and environmental stress (102). Improving environmental quality and reducing air pollution can create a fairer and healthier environment, particularly for vulnerable groups affected by poor environmental conditions (103). From above, the multifactorial health decision-making theoretical framework is shown in Figure 1.
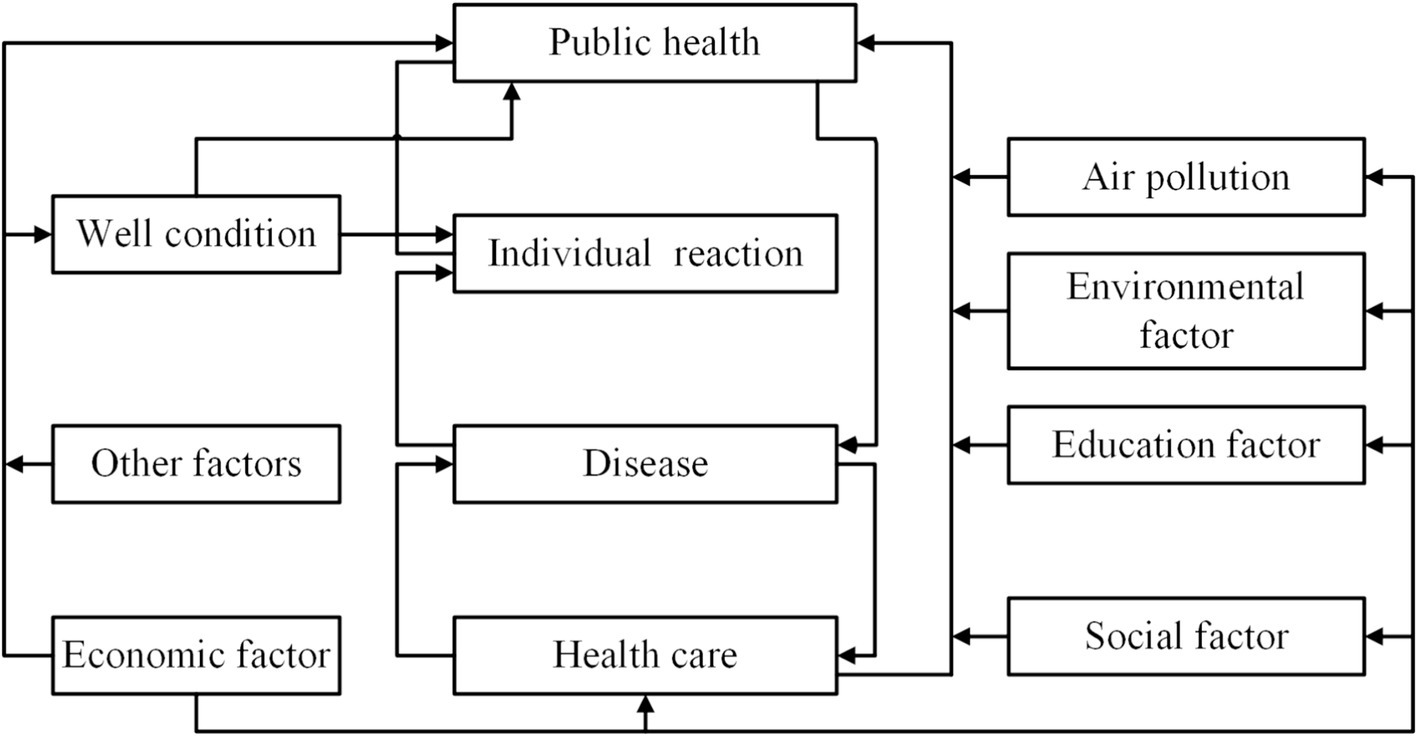
Figure 1. The theoretical framework of multifactorial health decision-making (80).
4 Materials and methods
4.1 Variable selection
According to the theoretical framework of multifactorial health decision-making, public health is influenced by healthcare, environmental factors, and economic development level. Based on this, the selected indicators are as follows.
4.1.1 Public health variables
Health is a concept with complex intrinsic mechanisms, which makes it challenging to quantify health. Previous research has mainly selected indicators such as population mortality rate, mean life expectancy, and disability-adjusted life expectancy (DALY) to evaluate public health (104–106). However, it is not appropriate to use population mortality rate to assess the impact of air pollution on public health. This is because the health effects of air pollution are relatively slow and the causes of population mortality are usually complex. In addition, the absence of provincial-level data on mean life expectancy and DALY in China makes it challenging to perform effective spatial econometric analyzes. Thus, we used a surrogate indicator, the incidence of respiratory diseases (IRD). Previous studies have shown that the indicators most associated with air pollution are respiratory ailments (107). Heightened air pollution exacerbates the likelihood of respiratory and circulatory ailments within the populace (108, 109). Consequently, we chose IRD to assess the level of public health so as to accurately identify the causal relationship between air pollution and public health.
4.1.2 Air pollution variables
Scholars have employed various evaluation indicators, including PM2.5 concentration, soot emissions, and sulfur dioxide emissions, to assess air pollution (110–112). However, a single pollutant index may inadequately capture the comprehensive nature of air pollution, thereby neglecting the cumulative impact of multiple pollutants on public health. Consequently, the air pollution index (API) was employed in this study to evaluate air pollution in China (113). The API is a non-linear dimensionless index derived from a comprehensive calculation of the concentrations of various air pollutants (including PM2.5, Soot, SO2, and NOx) by the entropy method. A higher API value indicates greater air pollution severity and poses increased risks to public health.
4.1.3 Control variables
Previous research has shown that various factors such as economic development, living environment, and healthcare also influence public health (114–118). Thus, we selected specific indicators as control variables: economic development, represented by resident disposable income (RDI); aspects of the living environment, including population density (PD), greening coverage (GRE), and urbanization rate (URB); and healthcare, denoted by the number of occupational physicians per 1,000 people (OCP) and household medical expenditure (HME).
4.1.4 Data sources
The study’s data encompasses 31 provinces and municipalities in China (including autonomous regions and municipalities directly under the central government), excluding Hong Kong, Macao, and Taiwan. These are omitted because the majority of the data is missing. Meanwhile, according to China’s administrative regions, the study areas encompass Northeast, East, Central, North, South, Southwest, and Northwest, as illustrated in Figure 2.
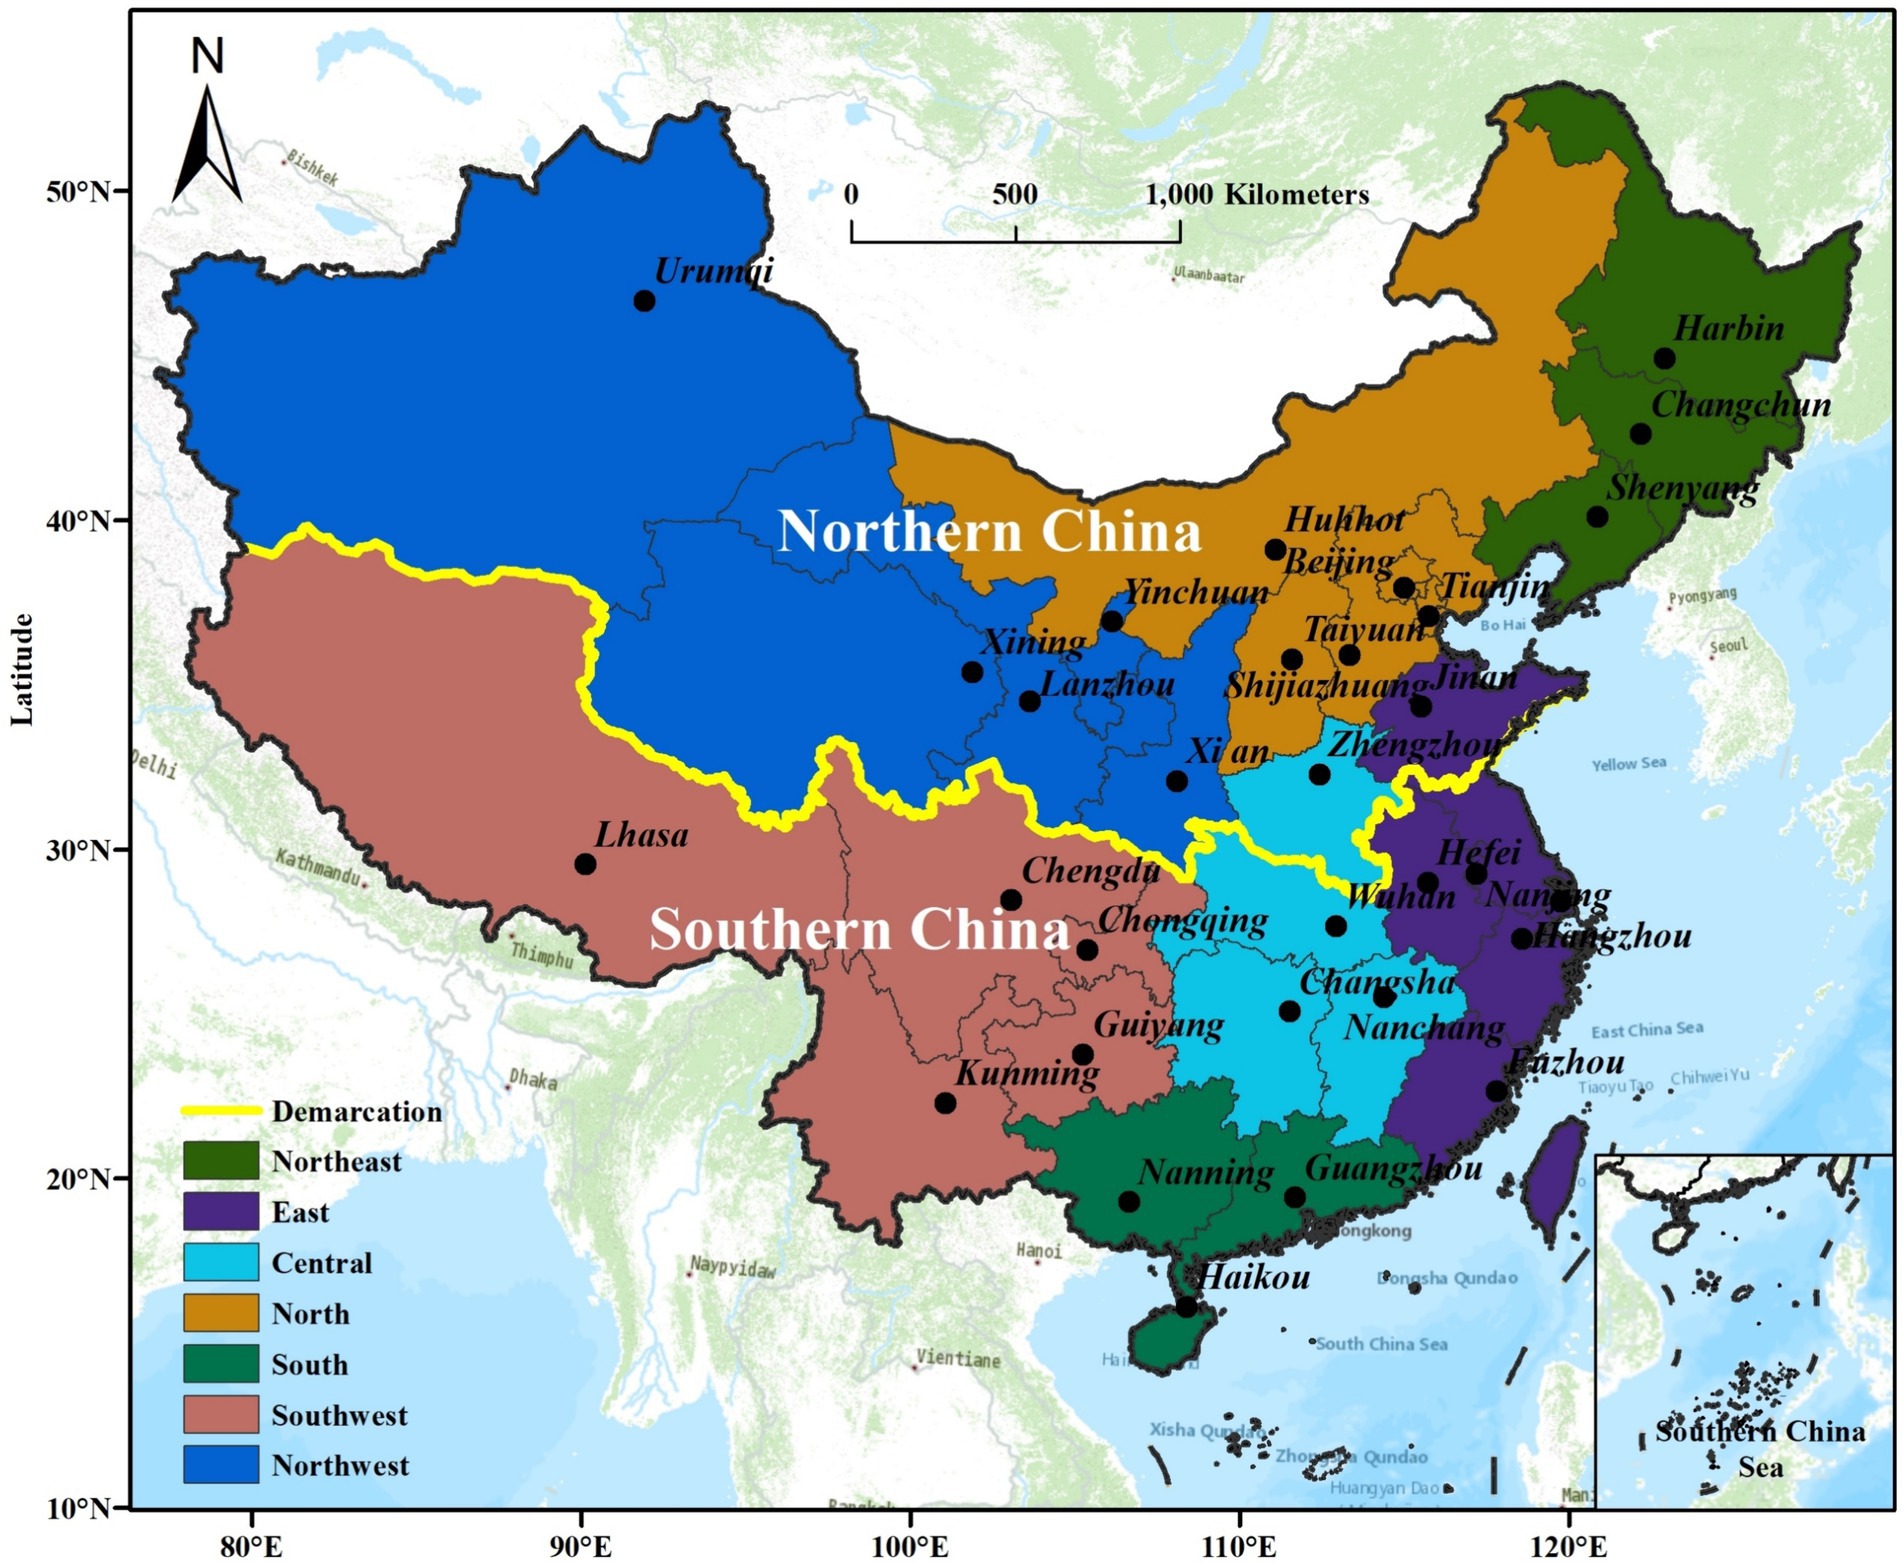
Figure 2. Research areas and the division of northeast, east, central, north, south, southwest and northwest regions of China.
Furthermore, the primary data sources for the study were the China Statistical Yearbook, hyperlink to datasets source,1 China Health and Sanitation Statistical Yearbook, hyperlink to datasets source,2 China Environmental Statistical Yearbook, and China Ecological and Environmental Condition Bulletin, hyperlink to datasets source.3 Meanwhile, natural logarithms were applied to all variables to mitigate the impact of heteroscedasticity on the regression outcomes. Table 1 presents the details of each variable along with their descriptive statistics.
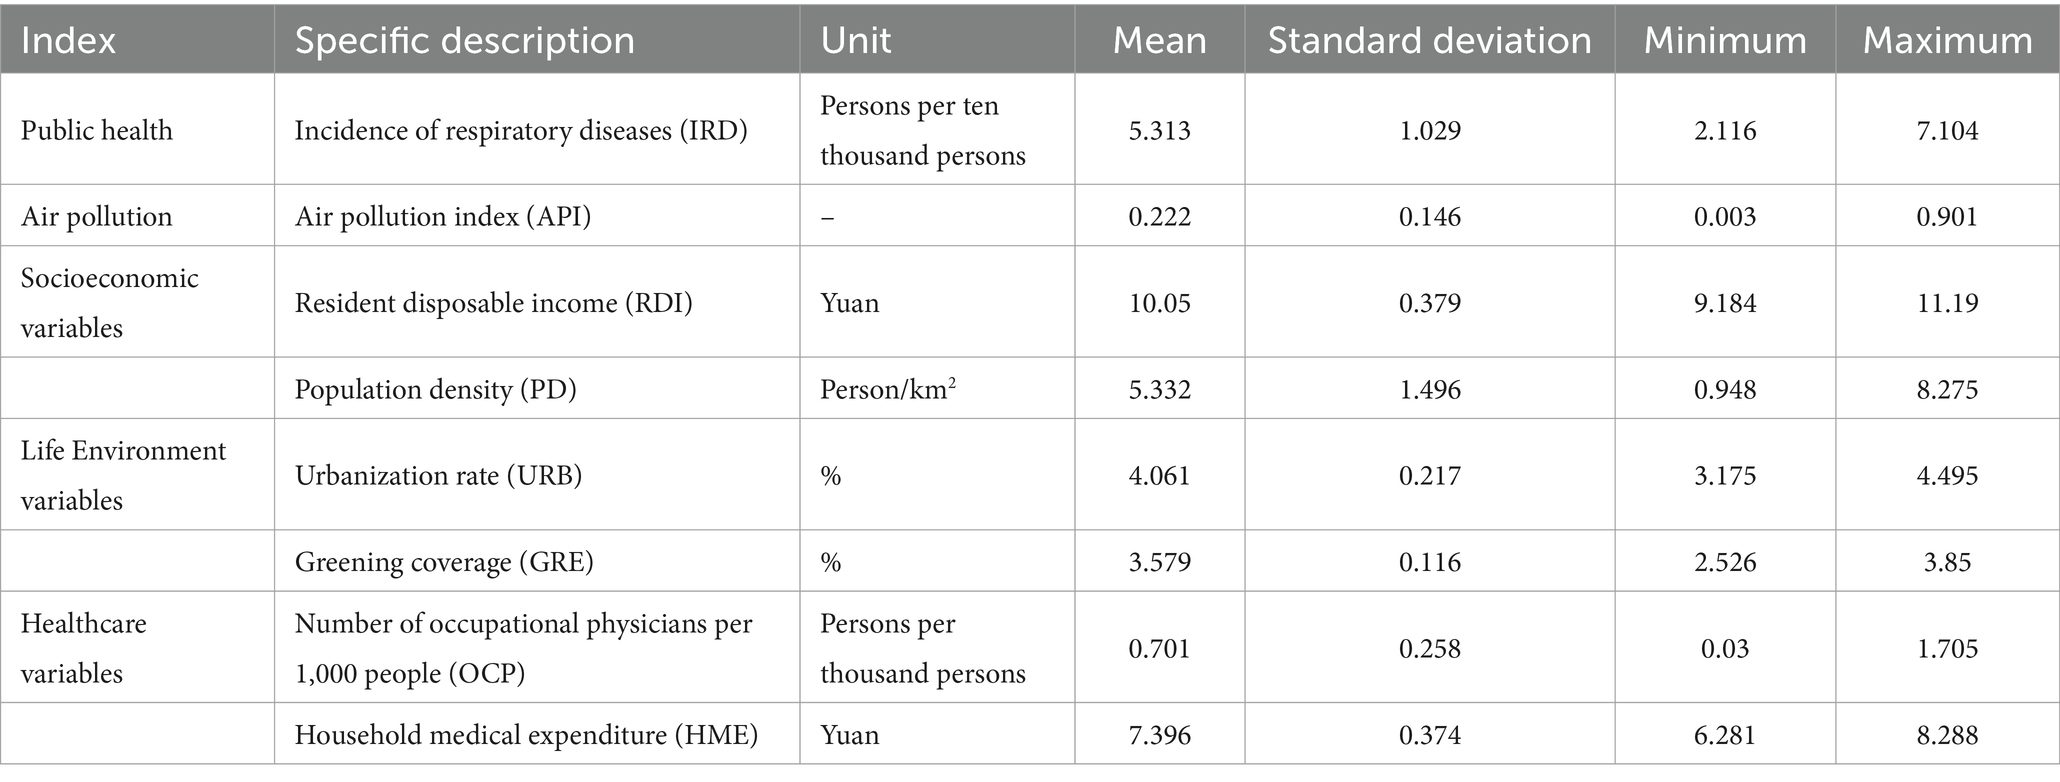
Table 1. Outline of the variables.
4.2 Methods
4.2.1 Spatial econometric analysis
Air pollution is often characterized by spatial spillover and dispersion, where air pollutants flow from one province to neighboring provinces, creating public health hazards of varying degrees in these areas (119). Therefore, this study investigates the macro-level spatial effects of air pollution on public health utilizing a spatial econometric model.
4.2.1.1 Spatial autocorrelation
Spatial autocorrelation refers to the phenomenon wherein a specific economic phenomenon or attribute within an economic region exhibits correlation with similar phenomena or attribute values in neighboring economic regions, including both global and local spatial autocorrelation (120). Among these, global spatial autocorrelation is evaluated using Moran’s I, which is calculated as:
In Eq. 1, I represents the overall extent of correlation between regions; represents the number of study regions; and represent the data points in regions and , respectively; represents the mean of the data points; represents the variance of the sample; and represents the spatial weighting matrix. Additionally, considering that the effects of air pollution on public health can be experienced across regions, this paper adopts the geographical neighborhood weight matrix to calculate Moran’s I. The assignment criterion of the geographical neighborhood weight matrix is as follows: 1 indicates that regions and are neighbors spatially, and 0 indicates that region and region are not neighbors spatially. The formula is as follows:
In addition, the range of Moran’s I is [−1, 1], if the index value approaches 1, it indicates stronger spatial positive correlation; if the index value approaches −1, it indicates stronger spatial negative correlation; if the index value equals 0, it indicates spatially random distribution.
4.2.1.2 Local spatial autocorrelation analysis
Local spatial autocorrelation analysis is pivotal in understanding spatial patterns within datasets. Global spatial autocorrelation analysis solely indicates the presence of spatial correlation within an economic phenomenon or attribute, but lacks the capacity to delineate the spatial agglomeration characteristics. Therefore, Anselin conducted additional analysis to evaluate the significance of spatial clustering using the local spatial autocorrelation measure, Local Moran’s I (121). The formula for Local Moran’s I is presented below.
In Eq. 3, the variables carry the same significance as those in Eq. 2. If , it indicates that the province shares similar attributes with its neighboring provinces; if , it indicates the absence of similar attributes with its neighboring provinces. Furthermore, we employ the LISA agglomeration map to depict spatial relationships between regional units and their neighbors. This allows us to categorize these relationships into four types of spatial correlations: high-high agglomeration (H-H), high-low agglomeration (H-L), low-high agglomeration (L-H), and low-low agglomeration (L-L).
4.2.1.3 Spatial measurement models
According to LESAGE et al. and other researchers, spatial autoregressive (SAR), spatial error model (SEM), and spatial durbin model (SDM) are frequently employed in spatial econometric analysis (122). The SAR model examines spatial spillover effects of explanatory variables, incorporating a spatial lag term; whereas the SEM model investigates spatial dependence due to omitted variables, incorporating a spatial lag term in the error term. The SDM model integrates the benefits of both SAR and SEM by addressing spatial dependence of explanatory variables and accounting for spatial effects caused by random errors (123). Based on this, the expression for the aforementioned model is as follows:
Spatial autoregressive econometric modeling (SAR):
Spatial error economics modeling (SEM):
Spatial durbin economics modeling (SDM):
In Eqs 4–7, represents the observed value of the explanatory variable for each spatial cell at time , while represents the observed value of the explanatory variable for the same spatial cell at time The symbol signifies the intercept term. represents province , represents province ; signifies the year; denotes the spatial autoregressive coefficient, indicating the spatial correlation among sample observations; represents the spatial error coefficient, indicating the influence of residuals from neighboring regions on local residuals; denotes an entry in the geographic neighborhood weight matrix (124); signifies the temporal fixed effect of a spatial unit; signifies the individual fixed effect of a spatial unit; denotes the random disturbance term. Finally, represents the spatially correlated error term.
Furthermore, LeSage et al. (125) has highlighted that the presence of spatial correlation hinders the coefficients of the explanatory variables in the SDM from accurately reflecting the marginal effects. A more accurate interpretation of the model can only be achieved by decomposing the marginal effects into direct, indirect, and total effects. Specifically, the direct effect reflects the impact of the explanatory variables in the region on the local explanatory variables, while the indirect effect signifies the influence of the explanatory variables in neighboring regions on the local explanatory variables. The combination of direct and indirect effects is termed as the total effect (126).
On the basis of the above analysis, we select the SDM to explore the impact of air pollution on public health. The specific formula is as follows:
In Eq. 8, represents the explained variable denoting public health status in the ith province during period ; serves as a control variable encompassing factors like economic development and healthcare coverage; represents the core explanatory variable signifying air pollution levels in the ith province during period ; and the remaining variables, denoted by , carry the same interpretation as in Eq. 7.
4.2.2 Geographically and temporally weighted regression
The Geographically Weighted Regression model is a local regression technique used to assess the spatial non-stationarity of continuous parameter surfaces at a regional scale. Specifically, the GWR model generates unique regression equations for individual sample points, allowing for localized parameter estimation instead of global parameters (127). Consequently, the use of the GWR model can significantly enhance the accuracy of model estimation, which is particularly beneficial for studying China, a country with a complex spatial background (128). However, the GWR model can only be used for cross-sectional data and cannot adequately consider the temporal dynamics of the influencing factors (129). Thus, Huang et al. (61) proposed the Geographically and Temporally Weighted Regression (GTWR) model, integrating temporal effects, to address both temporal and spatial nonstationarities in the data. Based on this, we employed the GTWR model to assess the influence of various factors on IRD across different regions and time periods. Notably, the shadow weights of other sample points on the regression sample points in the GTWR model are determined by constructing a spatiotemporal weight matrix. Thus, the spatio-temporal weight matrix formulated by the GTWR model using temporal and spatial distances is represented as follows.
In Eq. 9, represents the explanatory variable, while and correspond to the latitude and longitude of the ith observation, respectively. symbolizes the time series of the ith observation. denotes the regression intercept; represents the regression coefficient associated with the th explanatory variable at the ith observation; signifies the value of the th explanatory variable at the ith data point; and represents the residual error term.
In addition, the main challenge in using the GTWR model is to provide parameter values of for variables and . To address this challenge, we use the following matrix to compute the parameter values of:
Eq. 10 involves the diagonal element , which is a function of the spatiotemporal distance . Consequently, we calculate the spatiotemporal distances between the regression points and the measured data in this study employing the ellipsoidal coordinate system, which considers variations in locations and times, as illustrated in Figure 3.

Figure 3. Schematic of the GTWR model spatiotemporal distance.
Considering the aforementioned information, if we relate the temporal distance, denoted as , to the spatial distance, denoted as , then the spatiotemporal distance, denoted as , is defined as follows:
In Eq. 11, ⊗ denotes the disparity between operational symbols. Furthermore, the matrices and the diagonal elements , utilized for the estimation of , are expressed in the subsequent equations.
In Eq. 12, denotes the bandwidth, a parameter exceeding 0, whereas , and denote the temporal, spatial, and spatiotemporal bandwidths, respectively. Additionally, and represent spatial and temporal distances with scaling factors, respectively. During the computation process, we acquire the time, space, and spatiotemporal bandwidths automatically utilizing cross-validation optimization techniques, and we rely on either the least squares method (Eq. 13) of the R^2 statistic or the modified Akaike information criterion.
In Eq. 13, denotes the sum of squared errors, while signifies the estimated value of within the GTWR model.
5 Results and discussion
5.1 Results of global autocorrelation analysis
We calculated the global Moran’s I index using Stata17 software to evaluate the spatial correlation between API and IRD, and the results are shown in Figure 4.

Figure 4. Spatial correlation analysis of air pollution and incidence of respiratory diseases in China, 2013–2020. *, **, and *** distributions indicate 10, 5, and 1% significance levels.
As shown in the figure, it illustrate consistently positive Moran’s I values for IRD, all statistically significant at the 5% level. It suggests a significant positive spatial correlation among IRD values, indicating spatial clustering or dependency among provinces with similar public health levels. Specifically, the Moran’s I value for IRD rose from 0.204 in 2013 to 0.242 in 2020. On the other hand, the Moran’s I values for API are consistently positive and pass the significance test at the 1% level, indicating a positive spatial correlation for API. The Moran’s I value for API declined from 0.418 in 2013 to 0.38 in 2020. It is noteworthy that the spatial positive correlation for API is stronger than that for IRD. Thus, when examining the impact of API on IRD, emphasis should be placed on spatial correlations between regions.
5.2 Results of local autocorrelation analysis
Although the Moran’s I index serves as a correlation metric for assessing overall spatial correlation, it does not elucidate the local spatial clustering characteristics between API and IRD. Consequently, LISA clustering maps for 2013, 2016, and 2020 were generated using the global Moran’s I index to depict the local spatial clustering traits of IRD and API. These findings are illustrated in Figures 5, 6.
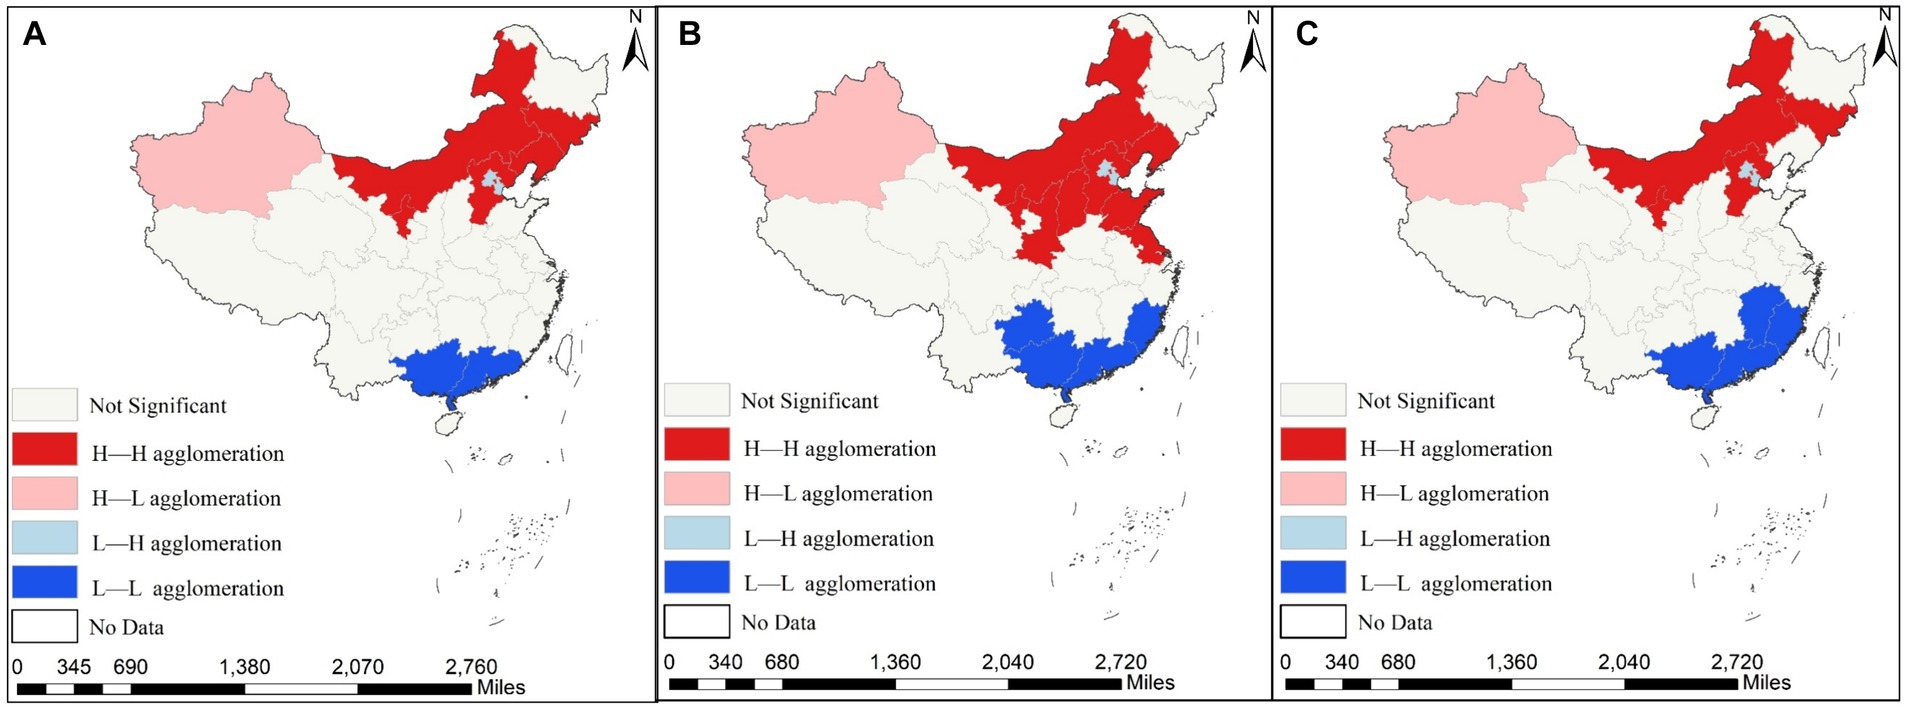
Figure 5. Spatial agglomeration distribution of air pollution index (API) across the 31 provinces of China in 2013, 2016 and 2020. (A) Depicts the spatial agglomeration of the API in 2013; (B) reflects the spatial agglomeration of the API in 2016; (C) indicates the spatial agglomeration of the API in 2020.
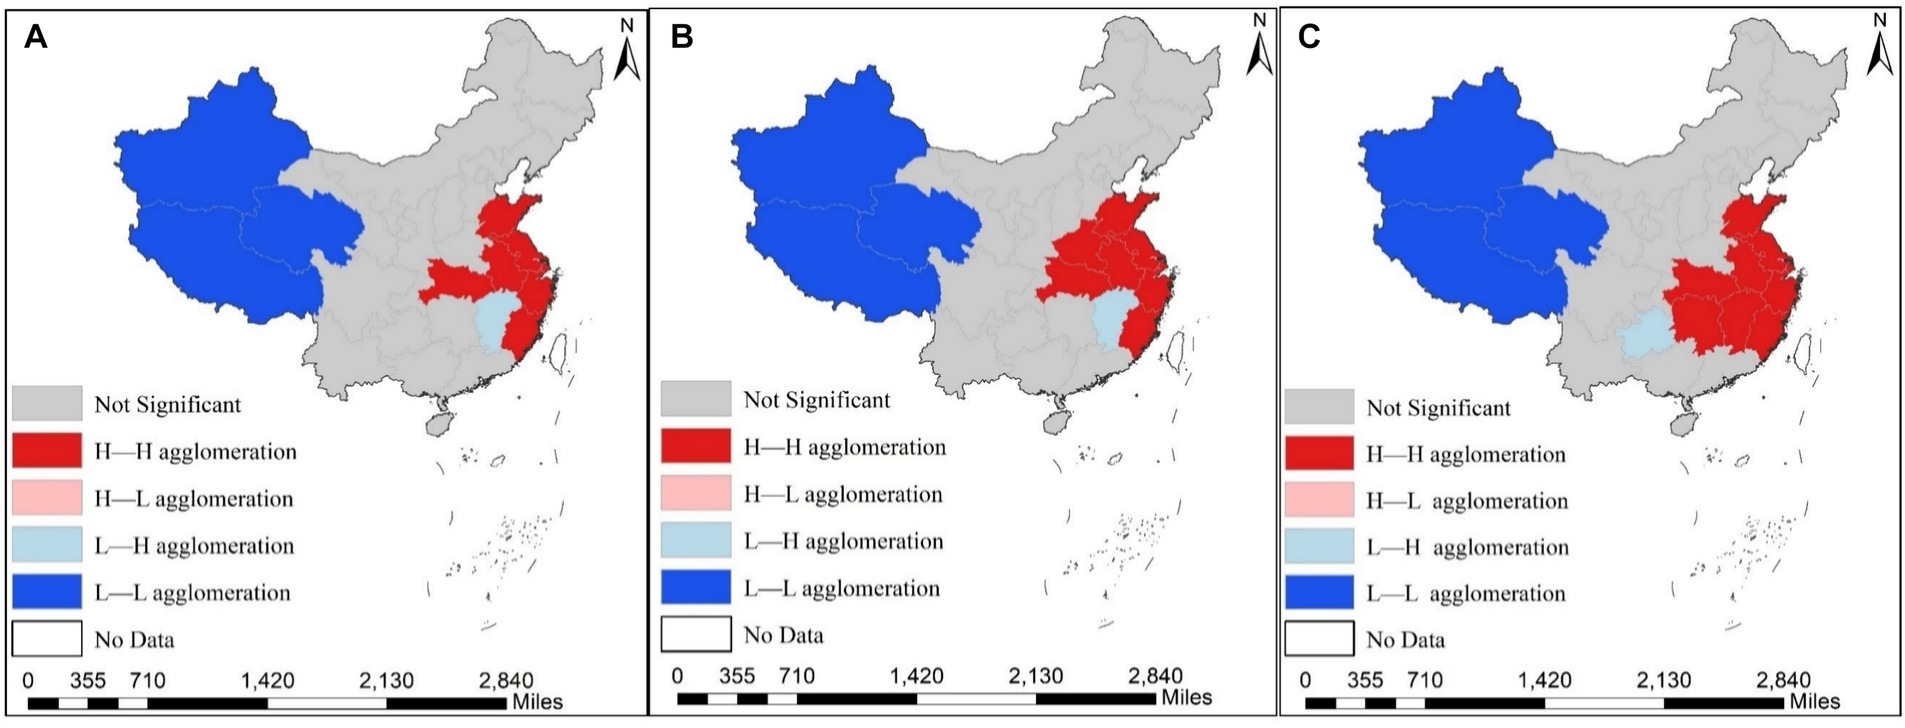
Figure 6. Spatial agglomeration distribution of the incidence of respiratory diseases (IRD) across the 31 provinces of China in 2013, 2016 and 2020. (A) Shows the spatial agglomeration of IRD in 2013; (B) presents the spatial agglomeration of IRD in 2016; (C) displays the spatial agglomeration of IRD diseases in 2020.
As can be seen from the figure, the local clustering characteristics of IRD and API during the study period, exhibiting predominantly High-High and Low-Low clustering, which are distributed in adjacent regions. Regarding the API, High-High clustering provinces are mainly found in the central regions of Shanxi and Shaanxi, as well as Xinjiang and Inner Mongolia in the western region, while Low-Low clustering is primarily concentrated in Guangxi, Guangdong, and Fujian provinces. Regarding the IRD, High-High clustering provinces are distributed in Anhui, Zhejiang, and Hunan, as well as Jiangsu and Shanghai in the central and eastern coastal regions. Low-low clustering provinces are mainly concentrated in Tibet, Qinghai, and other western regions. In summary, a clear positive spatial correlation exists between IRD and API. Thus, the utilization of a spatial econometric model for empirical research is warranted.
5.3 Estimation and analysis of the spatial durbin model
Before conducting spatial econometric analysis, it is imperative to ascertain the appropriate spatial econometric model through LM test (77, 130). The results of the calculations are presented in Table 2.
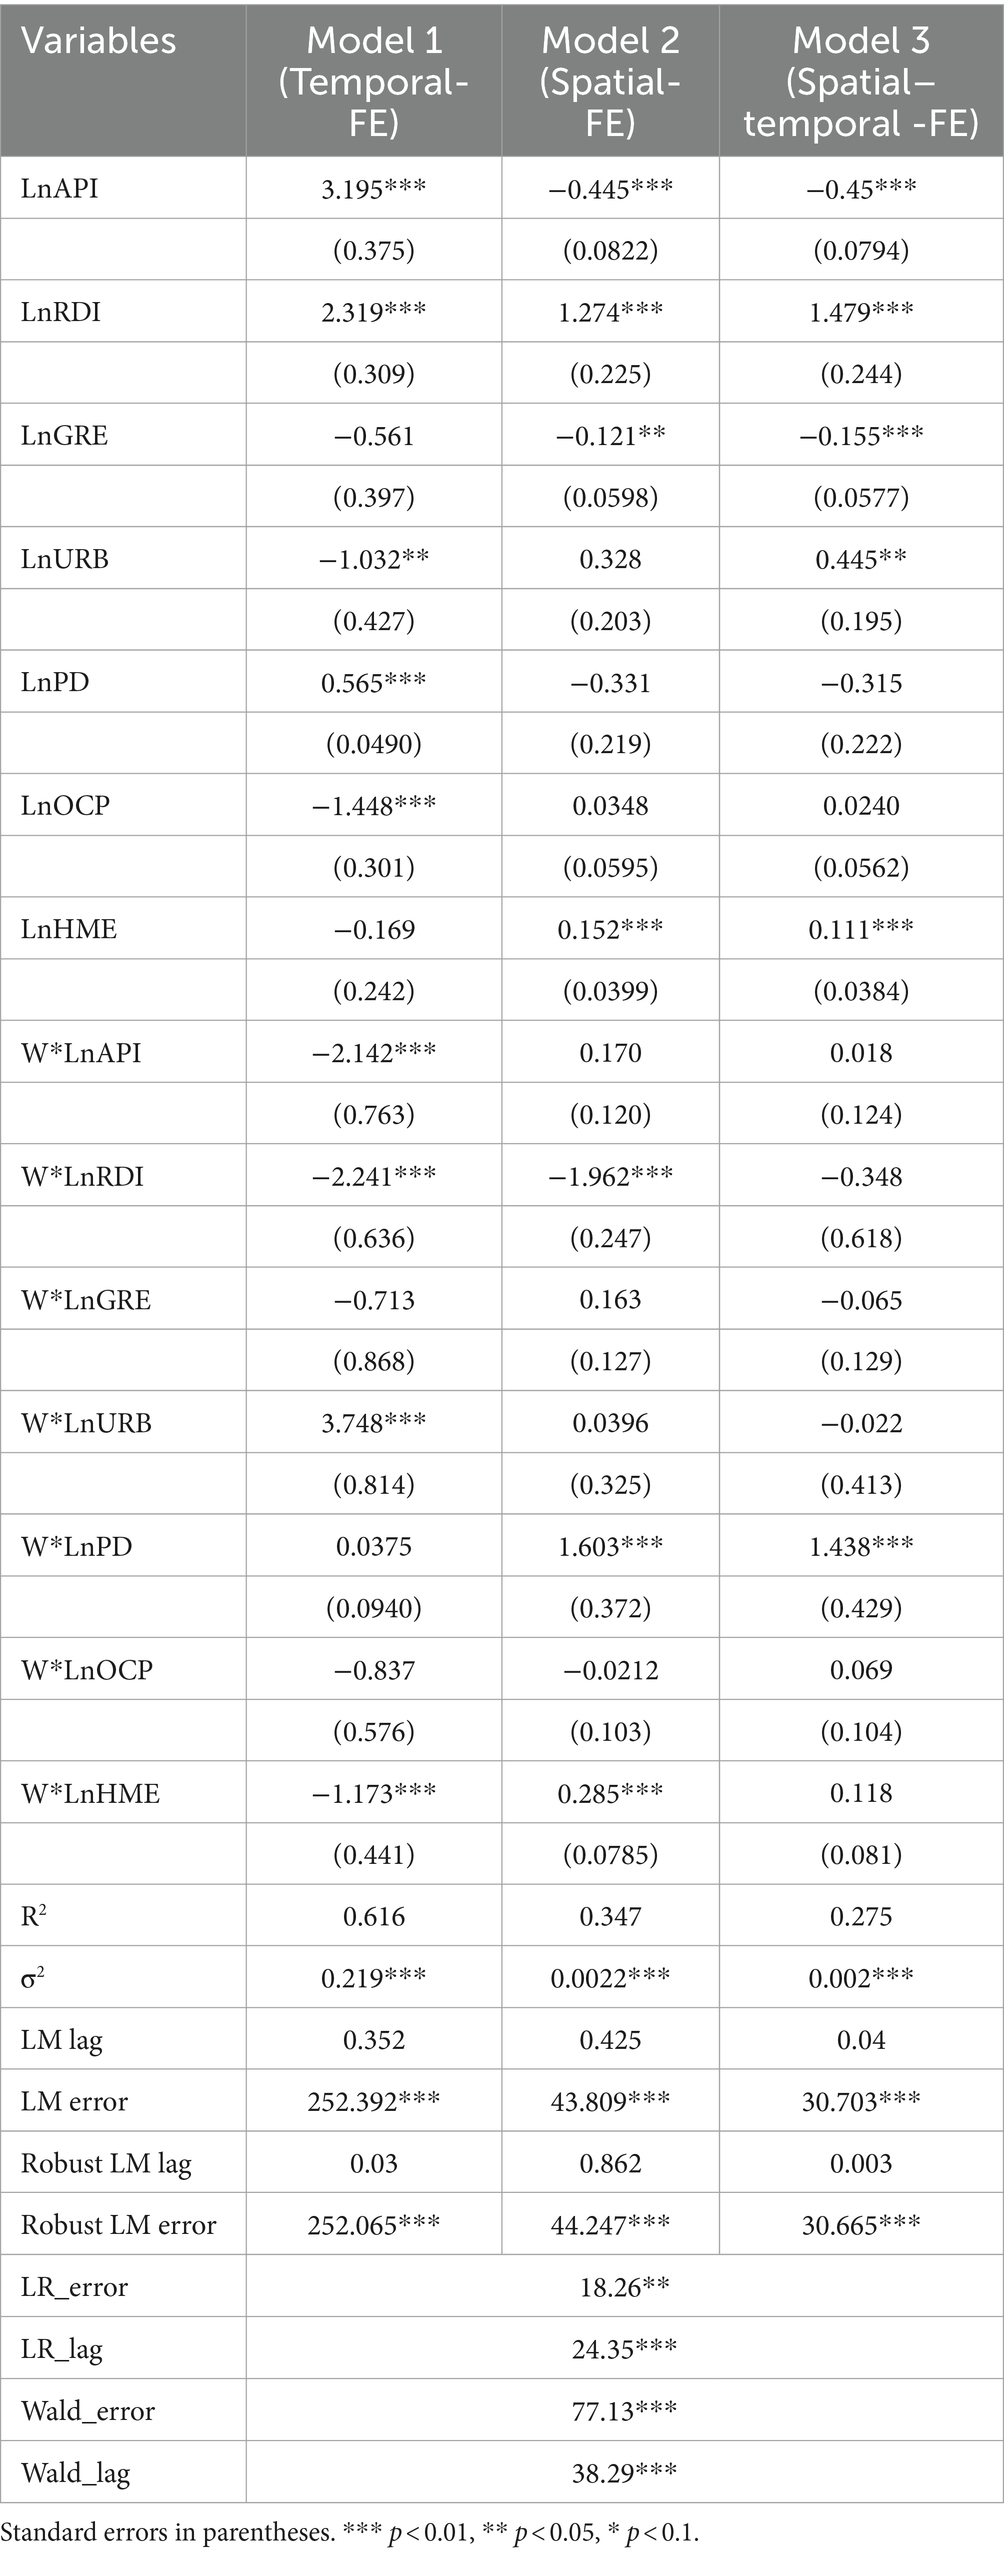
Table 2. Regression results of the spatial durbin model.
From the table, it is evident that both the LM error and robust LM error tests passed the significance test at the 1% significance level, in comparison with the LM lag and robust LM lag tests, indicating the suitability of the SEM for this study. However, the LM test does not account for the applicability of the SDM. Thus, LR and Wald tests were conducted to assess whether the SDM can be degraded to SAR or SEM. The corresponding statistical p-values of both LR and Wald tests, as shown in Table 2, are less than 0.01, significantly rejecting the original hypothesis that the SDM can be degraded to SAR and SEM. Additionally, the Hausman test for the SDM also significantly rejected the random effects hypothesis, leading to the selection of the SDM with fixed effects for analysis. Based on the regression results of different fixed-effects SDM presented in Table 2, Model 1 (Time-Fixed-Effects SDM) demonstrated optimal statistical properties ( ). Therefore, this paper employs the Time-Fixed-Effects SDM as the empirical benchmark.
On the basis of the above analysis, we utilized Stata 17 software to regress the spatial effects of air pollution on public health in 31 Provinces in China from 2013 to 2020. The estimation results are shown in Table 2. As can be seen from the table, the regression coefficients of API, RDI, and PD are significantly positive at 1 and 5% significance levels, with estimated coefficients of 3.195, 2.319, and 0.565, respectively, while the regression coefficients of URB and OCP are significantly negative at 1 and 5% significance levels, with estimated coefficients of −1.032 and − 1.448, respectively. However, the HME regression coefficients did not meet the 10% significance test.
5.4 Decomposition analysis of spatial effects
It is worth noting that the SDM incorporates the influence of pertinent variables in adjacent areas; However, the coefficients of the spatial lag terms inadequately capture the true impact of these variables (131). Consequently, we calculated coefficients reflecting the direct, indirect, and total effects of API and other control variables on IRD using the estimated coefficients derived from the Time-Fixed-Effects SDM (122). The calculation results are shown in Table 3.
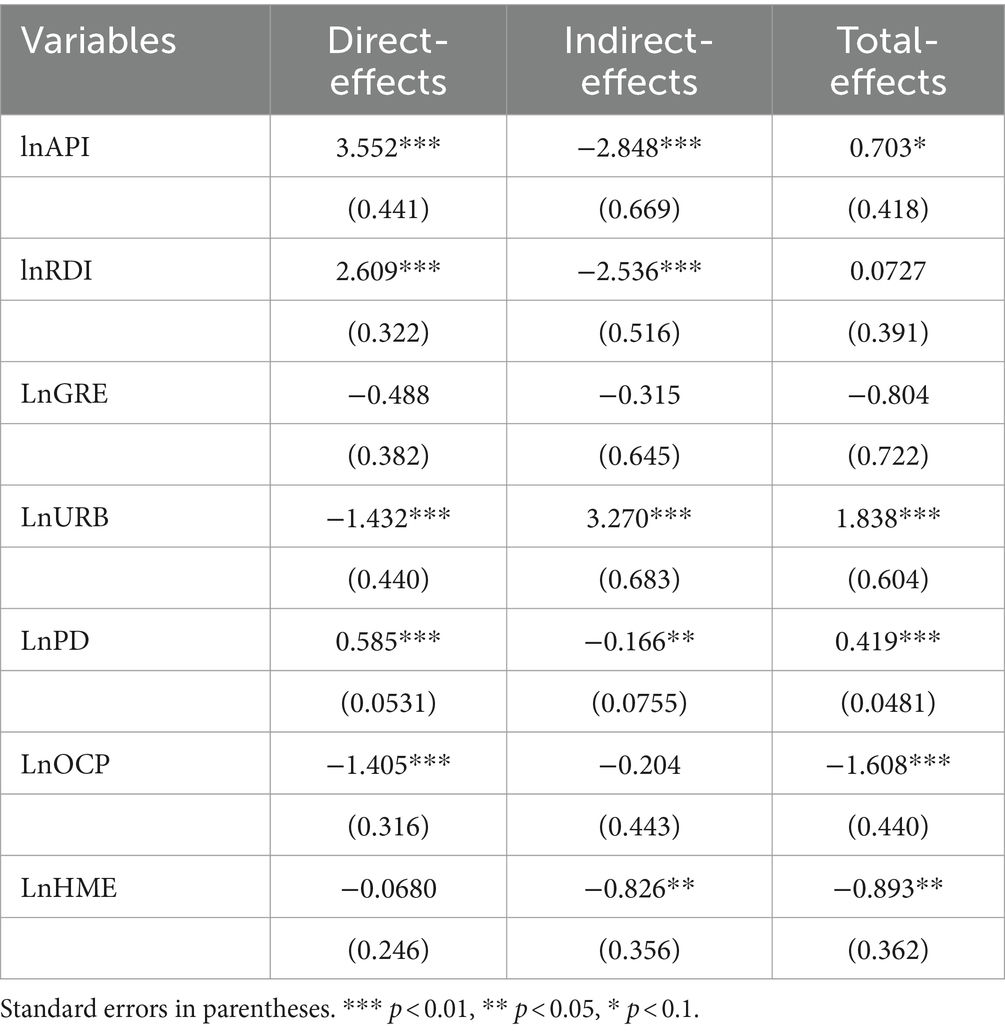
Table 3. Decomposition of direct, indirect, and total effects of the spatial durbin model with time fixed effects.
The direct effect analysis revealed a significant regression coefficient of 3.552 for API, indicating that air pollution contributes to increased the IRD, thereby adversely affecting public health. This is attributed to the lack of fundamental changes in China’s coal-based energy structure, leading to persistent soot-based pollution as the primary pollutant over an extended period. Meanwhile, the rising pollution from automobile exhaust has significantly heightened the risk of respiratory diseases among the population (132, 133). The results are consistent with previous studies Chen et al. (134).
Considering the control variables, the estimated coefficient of RDI for economic development is statistically significant at the 1% level, measuring 2.609. This could be related to the negative impact of air pollution on public health outweighing the positive influence of income growth among the population. Which is in line with the findings of Li et al. (135).
Regarding the living environment, the estimated coefficient of URB is statistically significant at the 1% level, with a value of −1.432. Recent studies have revealed positive trends in China’s urbanization process (136). Specifically, Chinese urbanization development policies now prioritize humanistic care and environmental protection. Moreover, Chinese urban industries are shifting from heavy pollution to green development, and urban energy consumption is becoming cleaner (137). Consequently, these developments have partially alleviated the detrimental impacts of air pollution on public health.
The estimated coefficient of PD was found to be statistically significant at the 1% level with a value of 0.585. It is because that higher PD indicates a greater likelihood of respiratory diseases among a larger population exposed to prolonged heavy air pollution (138). This observation is consistent with Ren et al. (139). The GRE demonstrated a statistically non-significant yet positive impact on public health, as evidenced by the regression coefficient of 0.488. It can be attributed to the capacity of increased the GRE to efficiently diminish, absorb, and intercept airborne toxins, including fine particulate matter and nitrogen oxides. Thus, this action significantly alleviates the detrimental impact of air pollution on public health (140). These results corroborate the conclusions drawn by Sun et al. (141).
In terms of healthcare, the estimated coefficient of the OCP was statistically significant at the 1% level, at −1.405. The possible explanation is that the increase in OCP provides favorable conditions for patients to be seen and treated, effectively mitigating air pollution-related health issues (142). The results are consistent with the findings of Yang et al. (143). In addition, HME has an insignificant positive effect on public health. The possible reason for this is that HME not only improves the physical fitness of individuals and enhances their resilience against health issues caused by air pollution but also ensures that residents have access to more adequate healthcare services, increasing the chances of addressing health issues caused by air pollution (144). The findings are similar to Zhang et al. (48).
According to the results of the indirect effect analysis, the API in the region exhibits a significant negative impact on the IRD in neighboring regions. This phenomenon likely occurs because an increase in air pollution levels in one region leads to relatively lower pollution levels in its neighboring region, thereby positively impacting public health in the latter. The RDI and HME in the region positively impact the reduction of IRD in neighboring areas. One plausible explanation for this is that the economic advancement and increased healthcare spending not only enhance the residents’ quality of life in neighboring regions but also draw nearby residents to seek medical care in the region, ensuring efficient treatment of illnesses. This finding aligns with the conclusions drawn by previous researchers Xin et al. (145). Furthermore, the rise in URB may have impeded the enhancement of public health in neighboring regions. This may stem from traditional urbanization challenges, such as intensified land development and industrial expansion, which positively correlate with IRD in adjacent areas, which consistent with Jiang et al. (146).
Furthermore, the total effect analysis revealed that increases in API, PD, and URB were significantly associated with adverse impacts on public health, whereas OCP and HME demonstrated positive effects. However, the effects of the remaining variables were deemed statistically insignificant.
5.5 Robustness analysis
In this study, we employ a geographic proximity matrix to assess the spatial influence of API on IRD. To mitigate potential errors in the selection process of the spatial weight matrix, we follow Feng et al. and employ a nested spatial weight matrix grounded in economic geography for robustness testing (147). The calculated results are depicted in Table 4.
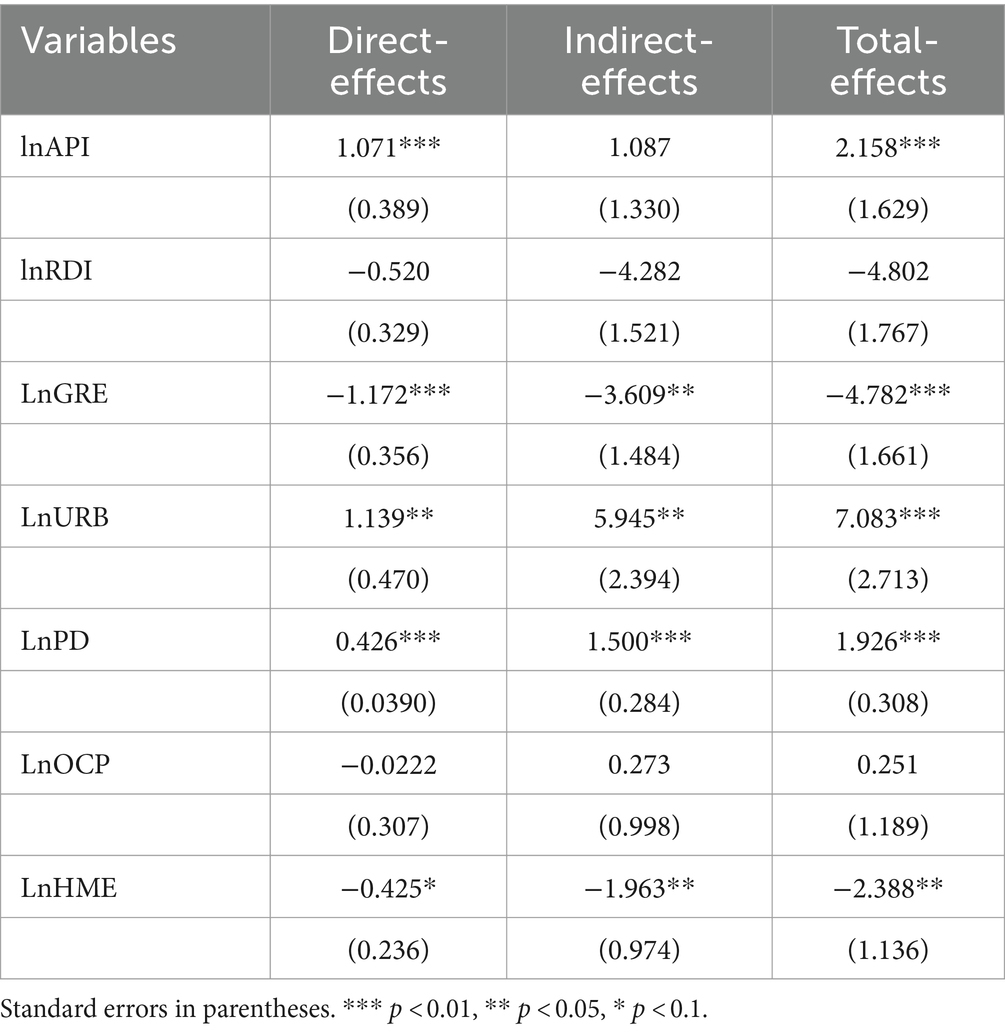
Table 4. Robustness analysis of nested spatial weight matrix based on economic geography.
From the table, it is evident that the API continues to exhibit a significant positive effect on IRD. However, the RDI and OCP show contrary results compared to the aforementioned ones. The other control variables differ only in magnitude, while the direction of spillover remains unchanged. Consequently, the robustness analysis aligns with the aforementioned analysis, indicating the stability and reliability of the paper’s findings.
5.6 Analysis of the spatiotemporal heterogeneity of air pollution impacts on public health
To investigate the impact of various factors on IRD across different regions and time periods, considering spatiotemporal heterogeneity, we re-evaluated the influence of API on IRD using the GTWR model implemented with Arcgis 10.8 software. Moreover, we conducted a comprehensive comparative analysis using the OLS model, the GWR model, and the GTWR model. The results are shown in Table 5.
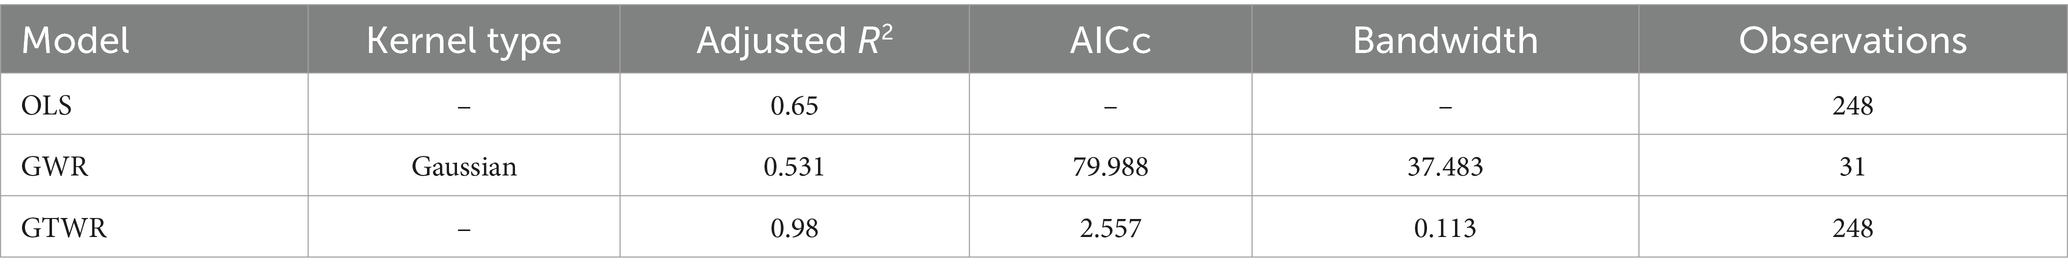
Table 5. Comparison of accuracy under different models.
From the table, we observe that the R2 value of the GTWR model (0.98) is higher than that of the OLS model (0.65) and the GWR model (0.531), indicating that the GTWR model has a better goodness of fit and stronger explanatory power. Additionally, the ARCc of the GTWR model is significantly lower than that of the GWR model, suggesting that the GTWR model is more suitable for the dataset used in this study. Therefore, we re-evaluated the influence of API on IRD using the GTWR model, implemented with ArcGIS 10.8 software.
Based on the results of the GTWR model, we created Figures 7, 8 to reveal the effects of multiple factors on the spatiotemporal heterogeneity of IRD in different regions and time periods. The details are as follows.
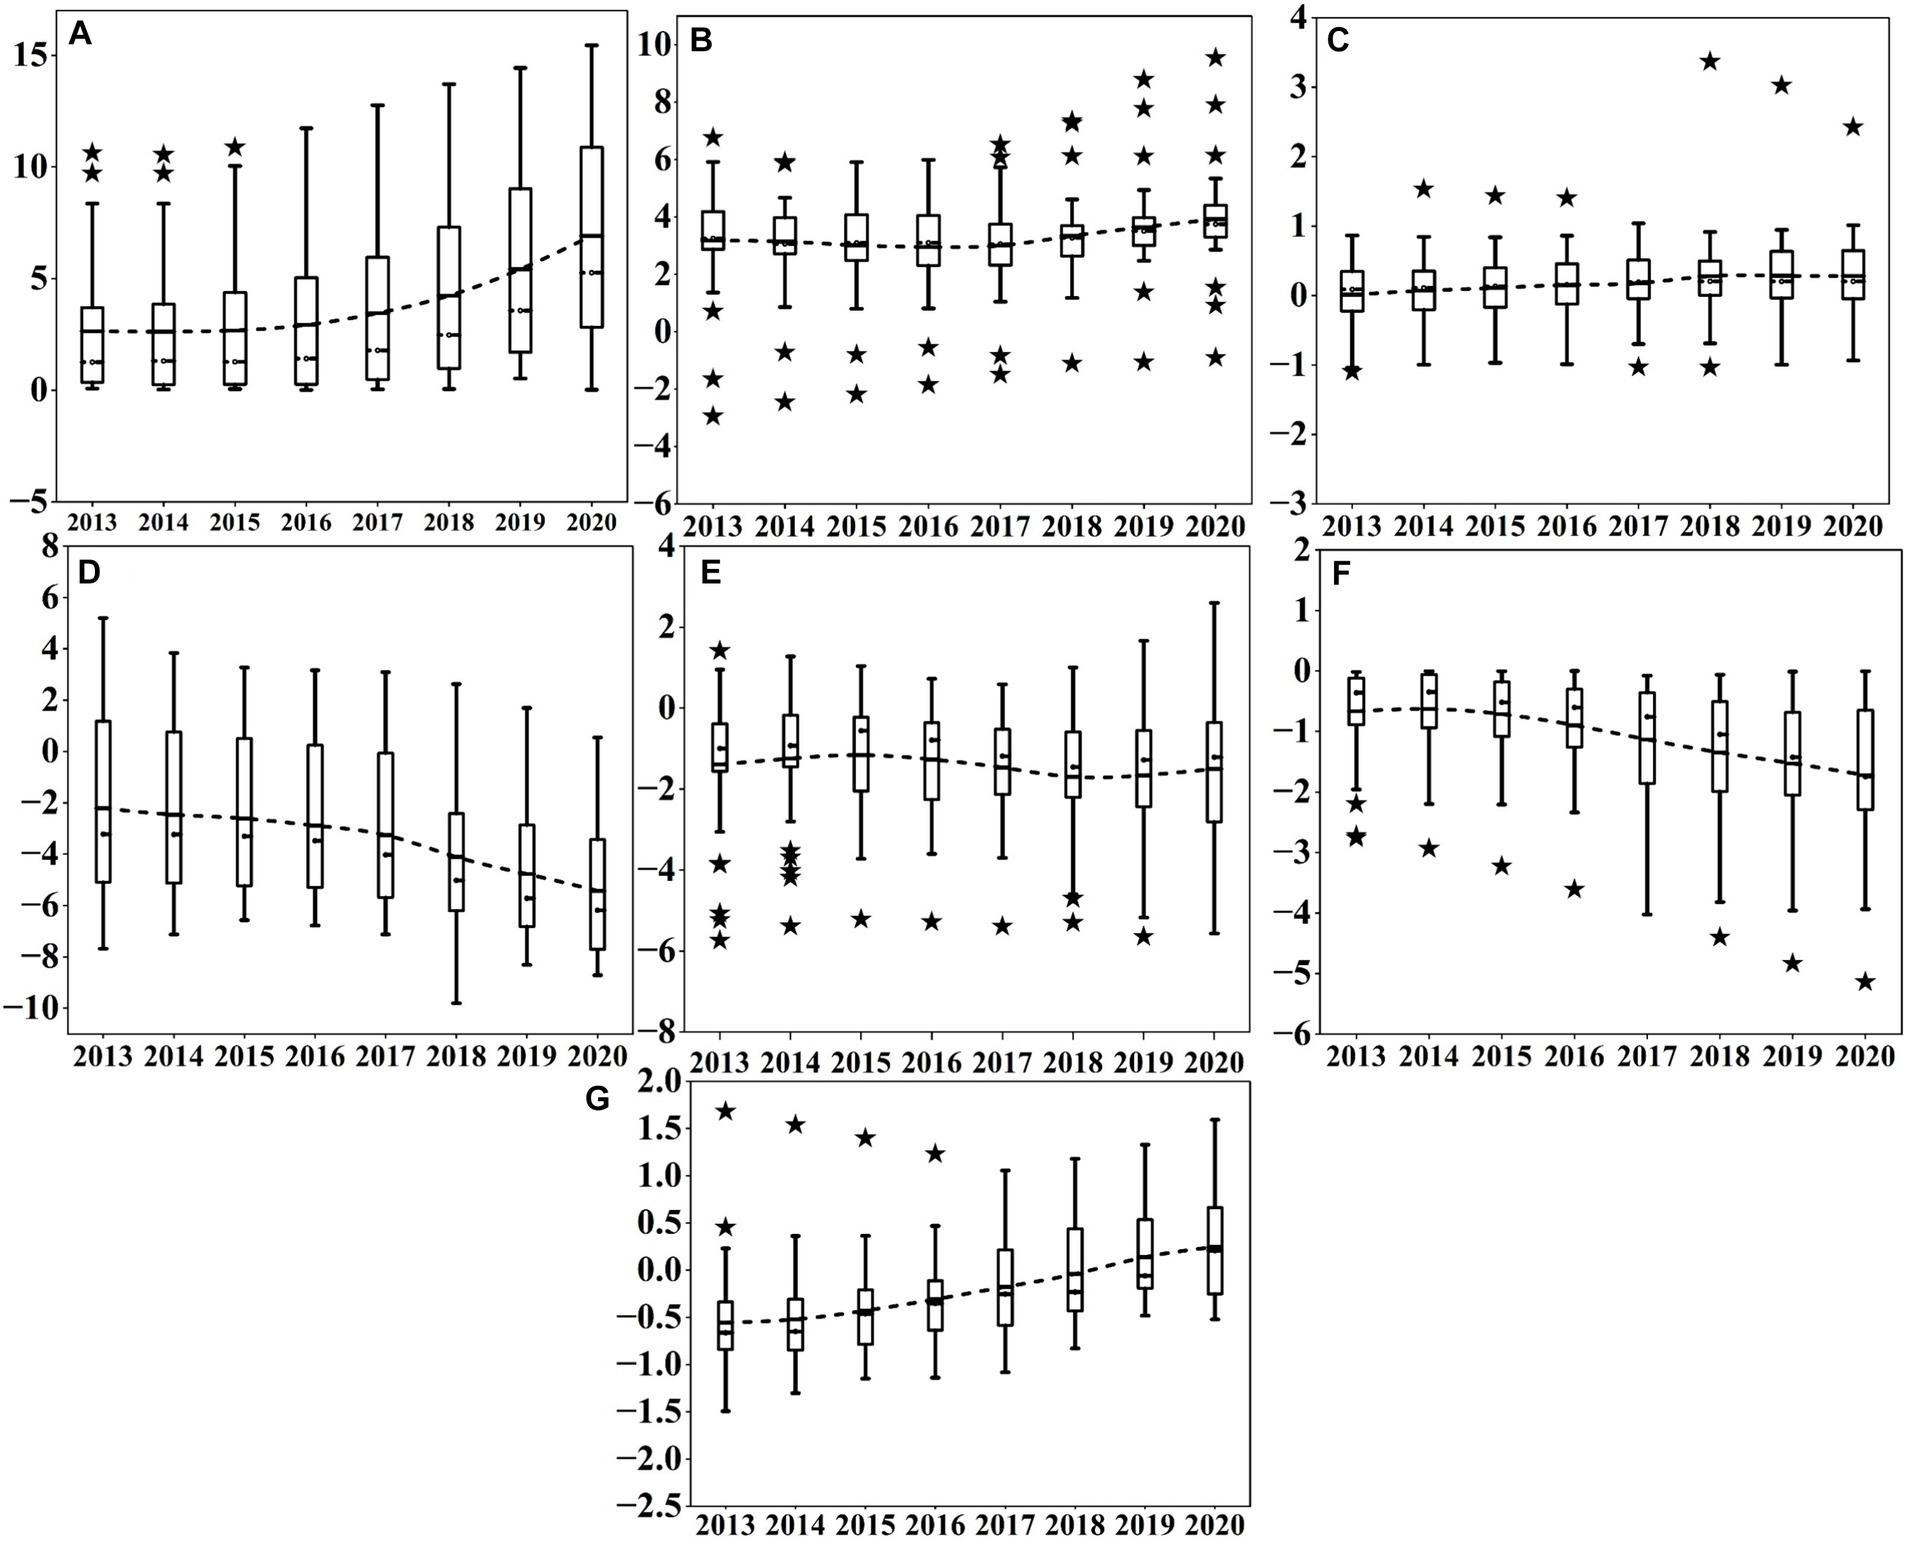
Figure 7. The estimated coefficients of various factors in different periods for the 31 provinces in China from 2013 to 2020. (A) Shows the coefficients of API; (B) displays the coefficients of RDI; (C) reflects the coefficients of PD; (D) represents the coefficients of URB; Figure e depicts the coefficients of GRE; (F) indicates the coefficients of the number of OCP; (G) presents the coefficients of HME.
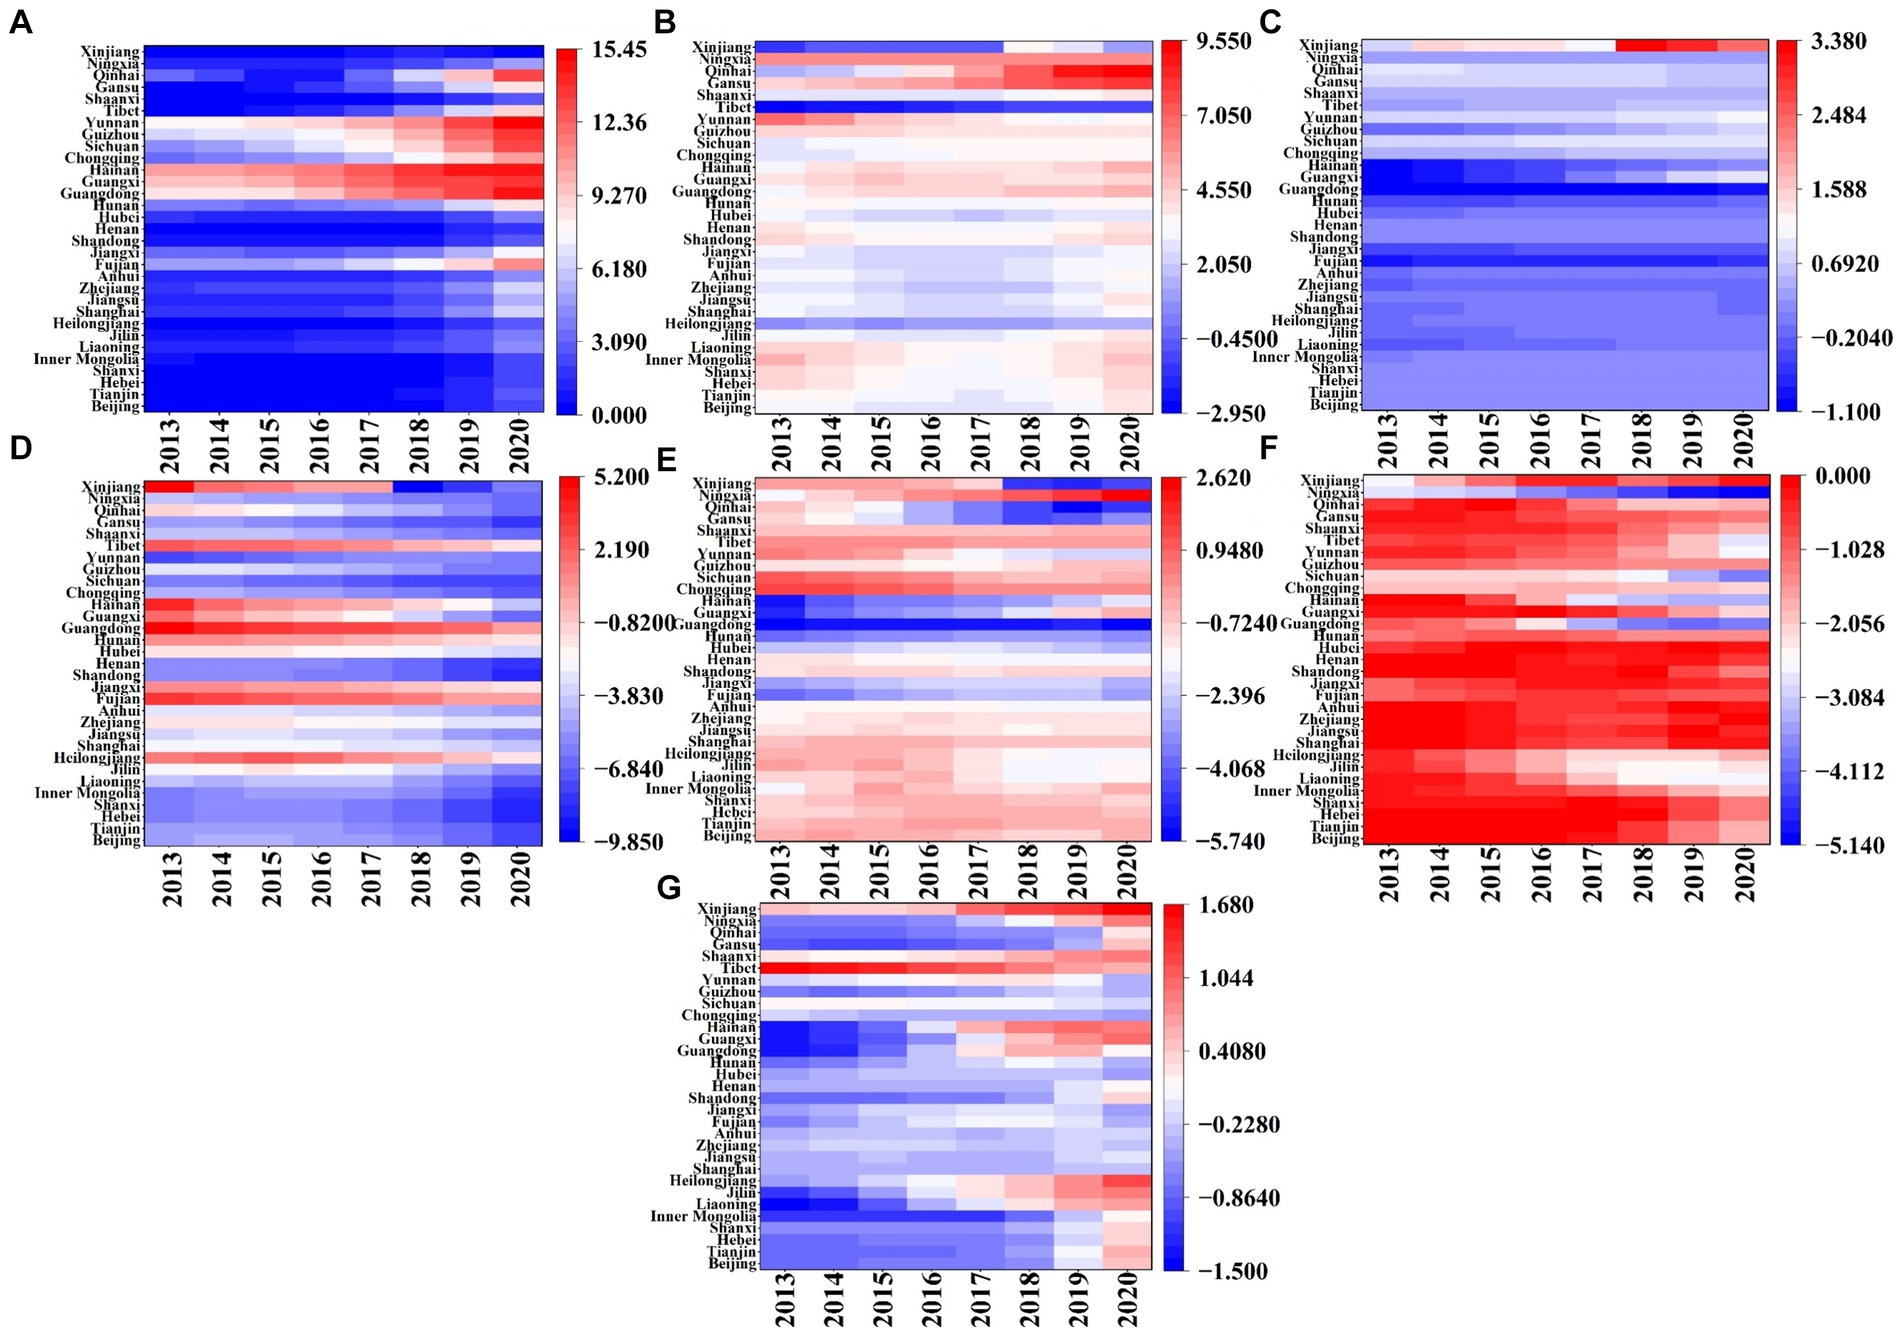
Figure 8. Spatial distribution of estimated coefficients of various factors in 31 provinces of China from 2013 to 2020. (A) Shows the coefficients of API; (B) displays the coefficients of RDI; (C) reflects the coefficients of PD; (D) represents the coefficients of URB; (E) depicts the coefficients of GRE; (F) indicates the coefficients of the number of OCP; (G) presents the coefficients of HME.
In terms of air pollution, from the time evolution (Figure 7A), the API regression coefficients continue increasing from 2013 to 2020, indicating that the index has a positive impact on the IRD in the study area. The box becomes longer, showing that the distribution of API regression coefficients is becoming more dispersed. With regard to the spatial distribution (Figure 8A), the positive impact of API on IRD gradually decreases from 2013 to 2020 from North and Southwest China to the Eastern seaboard, with a certain gradient distribution trend. One possible explanation is that some provinces in North China, such as Hebei and Shanxi, are major coal-producing provinces, and the combustion of coal can directly generate serious air pollution. On the other hand, some of the industrial enterprises relocated from the coastal region of East China are gradually moving to North and Southwest China, leading to an increase in both energy consumption and the emission of pollutants in the region (148).
In terms of economic development, the temporal evolution of the impact degree (Figure 7B) reveals a trend where the regression coefficient of RDI initially decreases before rising again. It illustrates a predominantly positive impact of the indicator on IRD across most regions. The box diminishes in size and discreteness, demonstrating a relatively stable evolution of the RDI regression coefficient. Furthermore, numerous outliers are present in the RDI coefficients, suggesting significant variation between regions. Regarding the spatial distribution of the influence degree (Figure 8B), the extent of the positive effect of RDI on IRD from 2013 to 2020 shows an increasing trend from the East China coastal region (e.g., Zhejiang, Jiangsu, and Shanghai) to the Northwest and Southwest regions (e.g., Gansu, Ningxia, Inner Mongolia, and Guizhou). It could be explained to the increased susceptibility of residents in low-income areas such as the Northwest and Southwest regions to the impacts of air pollution. For instance, low-income groups often lack sufficient awareness about air pollution and disease prevention, and they frequently face financial constraints preventing them from covering medical and other healthcare expenses (149). Conversely, high-income groups residing in East China’s coastal areas, having satisfied their basic material needs, prioritize demanding higher environmental quality and are willing to invest more in air quality enhancements to alleviate the adverse effects of air pollution on their health (150). which is the same as the findings of Wang et al. (151).
In terms of the living environment (see Figure 7C), the coefficient of PD in regression exhibits a slight upward trend, with minimal variation within the boxplot, indicating stable dispersion. Concerning spatial distribution (Figure 8C), the overall effect of PD on IRD from 2013 to 2020 is significantly positive, with the spatial trend decreasing from the southeast coastal region to the inland northwest. Specifically, PD negatively impacts IRD most significantly in Southern and Eastern China, exemplified by Guangdong, Shandong, and Anhui, possibly due to higher population densities enabling intensive energy use, thereby reducing air pollutant emissions and favorably impacting public health (152). Conversely, IRD is mildly positively influenced by PD in northwest and southwest regions, such as the provinces and cities of Shaanxi, Gansu, and Tibet, which aligns with the findings of Chen et al. (115).
Meanwhile, from the time dimension (Figure 7D), the URB exhibits a gradual decline over time. Notable characteristics include the compact size of the box plot and decreased variability, indicating high stability. From the spatial dimension (Figure 8D), South China, represented by Fujian and Guangdong, is consistently positively correlated with URB from 2013 to 2020. This could be owed to the significant negative impact of urbanization on air quality improvement in China, thereby exacerbating public health burden (153). However, the Southwest region, including Sichuan, Guizhou, Xinjiang, and Yunnan, experienced increasing negative impacts from the URB throughout the study period. In other words, urbanization-driven population migration effectively reduces IRD (154).
Furthermore, see Figure 7E, the regression coefficients for GRE show a pattern of increase followed by decrease, indicating that this indicator has a negative impact on IRD in most regions. The boxes become more concentrated, suggesting significant variations in the distribution. Numerous outliers are present in the regression coefficient of this factor, demonstrating significant variations between the GRE coefficients and regions. From the spatial dimension (Figure 8E), the negative relationship between GRE and IRD from 2013 to 2020 exhibits a gradient distribution, ranging from high in the Middle East to low in the Northeast. Specifically, northeastern regions including Heilongjiang, Jilin, and Liaoning are weakly affected by the negative impact of GRE, while southern and central regions like Guangxi, Hunan, Guangdong, and Hubei, and eastern regions such as Shanghai, Fujian, and Zhejiang are strongly affected by the negative impact of GRE. This is related to the higher level of landscaping in South and East China compared to Northeast China (155). Landscaped green spaces can provide a variety of ecosystem services to residents, thus improving air quality and promoting public health (156), which is consistent with the findings of Yang et al. (157).
In terms of healthcare, within the temporal dimension (Figure 7F), the estimated coefficient of OCP exhibits a gradual decline, with its box plot elongating and showing increased variability, indicating significant instability in the regression coefficients. This variation may stem from significant differences in the distribution of OCP among provinces. Regarding spatial changes (Figure 8F), the negative correlation between OCP and IRD persists in East China, encompassing Guangdong, Shanghai, and Zhejiang, from 2013 to 2020. Conversely, in the southwestern and northwestern regions, including Guizhou, Sichuan, Ningxia, and Qinghai, the negative correlation between OCP and IRD gradually diminishes. One possible explanation is that the relatively more developed economic base of East China provides more adequate healthcare facilities and resources, such as modern hospitals, advanced medical equipment, and sufficient medical professionals. Which enables residents in the region to receive prompt and effective medical care when facing health problems caused by air pollution Pan et al. (158). In contrast, the Southwest and Northwest regions have a lack of local medical professionals and poor access to healthcare resources and services. Consequently, when residents in these regions are affected by air pollution, they may not receive timely medical attention, increasing the risk of illness and death (159). This finding aligns with Zhao et al. (160).
Additionally, in Figure 7G, the regression coefficients of HME exhibit a gradual upward trend, suggesting that all its effects on IRD are negative. The widening trend of its box indicates high instability in the regression coefficients. In the spatial dimension (Figure 8G), the impact of HME on IRD from 2013 to 2020 exhibits significant geographic variation. Particularly, its influence is relatively weak in economically advanced eastern regions like Jiangsu and Zhejiang. Conversely, areas with a more pronounced impact are predominantly situated in economically underdeveloped western regions, such as Heilongjiang and Gansu. This phenomenon could be attributed to the economic constraints in the western regions and the residents’ lower inclination to utilize healthcare services, consequently enabling the adverse effects of air pollution to surpass the beneficial effects of HME on public health (161). It is generally consistent with the findings of Yang et al. (149).
6 Conclusion
Air pollution and its effects on public health have garnered significant attention from researchers, yet there is often insufficient consideration of the spatiotemporal variations in these effects. Furthermore, the effective control of air pollution and the promotion of public health have emerged as key priorities for the Chinese government. Accordingly, based on Neidell’s theoretical framework for multifactorial health decision-making, we utilized panel data from 31 provinces and municipalities collected between 2013 and 2020. We then integrated this data with the Time-Fixed-Effects SDM and GTWR models to explore the spatiotemporal variations in the effects of air pollution on public health. This endeavor aims to furnish policymakers, urban planners, and public health authorities with actionable insights for crafting targeted interventions. The main conclusions drawn from this study are summarized below:
(1) API and IRD exhibit non-random distribution among Chinese provinces; On the contrary, they demonstrate positive spatial correlation and localized clustering. High-High clustering of API are predominantly located in Inner Mongolia, Hebei, and Liaoning, while Low-Low clustering are found in Guangdong, Guangxi, and Fujian. Similarly, High-High clustering of IRD encompass regions such as Anhui, Hunan, Hubei, and Henan, while Low-Low clustering are prevalent in Tibet, Qinghai, and other areas.
(2) The API exhibits a notable positive impact on IRD, markedly elevating IRD and thereby diminishing public health. Furthermore, the API demonstrates a more substantial adverse influence on public health compared to the traditional econometric model neglecting spatial correlation. It indicated that disregarding spatial effects may result in biased assessments of public health. Nonetheless, irrespective of spatial effects, air pollution persists as a significant determinant of public health, even after considering variables such as economic development, living environment, and healthcare. Moreover, a noteworthy spillover effect of air pollution is observed, with an indirect effect coefficient of −2.848, demonstrating that an increase in air pollution in one region can positively influence public health in neighboring provinces. Additionally, URB and OCP exhibit substantial negative impacts on IRD, while RDI and PD demonstrate significant positive effects. Conversely, GRE and HME produce insignificant negative effects on IRD.
(3) Significant spatiotemporal heterogeneity exists in the impacts of air pollution, economic development, living environment, and healthcare on IRD. Regarding temporal heterogeneity, the temporal non-stationarity of regression coefficients for API, GRE, OCP, and HME increases over time, whereas that of RDI, PD, and URB stabilizes. Regarding spatio heterogeneity, IRD in North China experiences greater influence from air pollution. Regarding economic development factor, alterations in RDI exert a more pronounced effect on IRD in northwest China. Regarding living environment factors, alterations in PD predominantly affect IRD in South and East China; Changes in URB significantly influence IRD in South and Southwest China; moreover, IRD in Northeast and East China exhibits higher susceptibility to GRE. Regarding healthcare factors, Guizhou, Sichuan, Guangdong, Shanghai, and other regions of South and Southwest China primarily experience a more significant impact from OCP on IRD. Conversely, HME primarily influences IRD in East and Northwest China.
Based on the findings of this paper, the following policy recommendations are proposed:
(i) Emphasize inter-provincial cooperation and enhance the cross-regional linkage and coordination mechanisms for air pollution prevention and control. Establish and enhance a grid-based hotspot supervision system for air pollution to bolster collaborative oversight of the air pollution control process, thereby enhancing the tangible efficacy of air pollution prevention and control efforts.
(ii) Increase investment in medical and healthcare resources and actively foster the recruitment and integration of high-quality health professionals to elevate the service standard and operational efficiency of medical and healthcare institutions. Establish a comprehensive and diverse regulatory and service framework for the medical and healthcare sector to foster a high-quality healthcare environment for patients.
(iii) Enhancing ecological and environmental protection efforts in urban and rural regions, and furthering the expansion of green spaces in both settings. Accelerating the modernization of gardening practices and green infrastructure, while implementing an effective supervision system for urban gardening and greening, to foster an enhanced ecological environment for the public.
(iv) Giving full play to the positive external effects brought about by the urbanization process, realizing the overall environmental improvement of the new urbanization, and promoting the green, healthy and sustainable development of urbanization.
(v) Owing to the spatiaotemporal heterogeneity of indicator coefficients, relevant government departments ought to consider variances in impact levels of distinct indicators while formulating strategies for air pollution prevention and control. (First) Governments in provinces and major cities like Beijing and Shanghai should not only actively foster the process of new urbanization and harness the population and industrial clustering effects it brings, but also actively promote the development of essential public services including healthcare and education, aiming to bolster public health; (Second) In provinces like Shanxi, Guangxi, Gansu, and Shaanxi, due to insufficient urban medical facilities and the uneven allocation of health resources, the government should further increase healthcare spending, actively establish a long-term inter-regional cooperation mechanism, and gradually achieve cross-regional sharing of high-quality healthcare talents, technology, knowledge, and other resources to maximize the quality of peripheral medical and healthcare services; (Third) In provinces such as Sichuan, Yunnan, Guizhou, Anhui, Zhejiang, Hunan, and Hubei, governmental institutions should establish and enhance policies for controlling air pollution, strengthen measures for environmental protection and penalties, and enhance oversight of controlling pollution from mobile sources. Additionally, governmental bodies should enhance green initiatives in urban and rural regions and rationalize the layout of green parks.
Furthermore, the limitations of this study primarily manifest in two aspects. Firstly, as data at the prefecture-level is unavailable, pertinent provincial-level data was utilized. Thus, future research could delve deeper into the effects of air pollution on public health at the prefecture level. Secondly, this paper solely concentrates on air pollution as an environmental variable. However, exploring the impacts of additional environmental pollution variables on public health will be the focus of our future investigations.
Data availability statement
The raw data supporting the conclusions of this article will be made available by the authors, without undue reservation.
Author contributions
YY: Writing – original draft, Writing – review & editing. QT: Supervision, Writing – review & editing. HW: Supervision, Writing – review & editing.
Funding
The author(s) declare financial support was received for the research, authorship, and/or publication of this article. This work was supported by the Project on Humanities of the Ministry of Education of the People’s Republic of China (No: 18YJA630103) and Scientific Research Team for Innovative Development of Chinese Medicine (No: 2022AH010039).
Conflict of interest
The authors declare that the research was conducted in the absence of any commercial or financial relationships that could be construed as a potential conflict of interest.
Publisher’s note
All claims expressed in this article are solely those of the authors and do not necessarily represent those of their affiliated organizations, or those of the publisher, the editors and the reviewers. Any product that may be evaluated in this article, or claim that may be made by its manufacturer, is not guaranteed or endorsed by the publisher.
Footnotes
References
1. The, L. Health as a Foundation for Society. Lancet. (2021) 397:1. doi: 10.1016/s0140-6736(20)32751-3
2. Juginović, A, Vuković, M, Aranza, I, and Biloš, V. Health impacts of air pollution exposure from 1990 to 2019 in 43 European countries. Sci Rep. (2021) 11:22516. doi: 10.1038/s41598-021-01802-5
3. Chen, G, Li, S, Zhang, Y, Zhang, W, Li, D, Wei, X, et al. Effects of ambient Pm1 air pollution on daily emergency hospital visits in China: an epidemiological study. Lancet Planet Health. (2017) 1:e221–9. doi: 10.1016/S2542-5196(17)30100-6
4. Murray, CJL, Aravkin, AY, Zheng, P, Abbafati, C, Abbas, KM, Abbasi-Kangevari, M, et al. Global burden of 87 risk factors in 204 countries and territories, 1990&X2013;2019: a systematic analysis for the global burden of disease study 2019. Lancet. (2020) 396:1223–49. doi: 10.1016/S0140-6736(20)30752-2
5. Peeples, L. How air pollution threatens brain health. Proc Natl Acad Sci. (2020) 117:13856–60. doi: 10.1073/pnas.2008940117
6. Cao, Z, Zhou, J, Li, M, Huang, J, and Dou, D. Urbanites’ mental health undermined by air pollution. Nat Sustain. (2023) 6:470–8. doi: 10.1038/s41893-022-01032-1
7. Konduracka, E, and Rostoff, P. Links between chronic exposure to outdoor air pollution and cardiovascular diseases: a review. Environ Chem Lett. (2022) 20:2971–88. doi: 10.1007/s10311-022-01450-9
8. Turner, MC, Andersen, ZJ, Baccarelli, A, Diver, WR, Gapstur, SM, Pope Iii, CA, et al. Outdoor air pollution and Cancer: an overview of the current evidence and public health recommendations. CA Cancer J Clin. (2020) 70:460–79. doi: 10.3322/caac.21632
9. Berg, CD, Schiller, JH, Boffetta, P, Cai, J, Connolly, C, Kerpel-Fronius, A, et al. Air pollution and lung Cancer: a review by International Association for the Study of Lung Cancer early detection and screening committee. J Thorac Oncol. (2023) 18:1277–89. doi: 10.1016/j.jtho.2023.05.024
10. Yitshak Sade, M, Shi, L, Colicino, E, Amini, H, Schwartz, JD, Di, Q, et al. Long-term air pollution exposure and diabetes risk in American older adults: a National Secondary Data-Based Cohort Study. Environ Pollut. (2023) 320:121056. doi: 10.1016/j.envpol.2023.121056
11. Choo, ELW, Janhavi, A, Koo, JR, Yim, SHL, Dickens, BL, and Lim, JT. Association between ambient air pollutants and upper respiratory tract infection and pneumonia disease burden in Thailand from 2000 to 2022: a high frequency ecological analysis. BMC Infect Dis. (2023) 23:379. doi: 10.1186/s12879-023-08185-0
12. Ju, K, Lu, L, Wang, W, Chen, T, Yang, C, Zhang, E, et al. Causal effects of air pollution on mental health among adults——an exploration of susceptible populations and the role of physical activity based on a longitudinal Nationwide cohort in China. Environ Res. (2023) 217:114761. doi: 10.1016/j.envres.2022.114761
13. Zhang, Z, Zhang, G, and Li, L. The spatial impact of atmospheric environmental policy on public health based on the mediation effect of air pollution in China. Environ Sci Pollut Res. (2023) 30:116584–600. doi: 10.1007/s11356-022-21501-6
14. Du, M, Liu, W, and Hao, Y. Spatial correlation of air pollution and its causes in Northeast China. Int J Environ Res Public Health. (2021) 18:10619. doi: 10.3390/ijerph182010619
15. Samoli, E, Stergiopoulou, A, Santana, P, Rodopoulou, S, Mitsakou, C, Dimitroulopoulou, C, et al. Spatial variability in air pollution exposure in relation to socioeconomic indicators in nine European metropolitan areas: a study on environmental inequality. Environ Pollut. (2019) 249:345–53. doi: 10.1016/j.envpol.2019.03.050
16. Yu, C, Long, H, Zhang, X, Tan, Y, Zhou, Y, Zang, C, et al. The interaction effect between public environmental concern and air pollution: evidence from China. J Clean Prod. (2023) 391:136231. doi: 10.1016/j.jclepro.2023.136231
17. Wu, Y, Ye, Z, and Fang, Y. Spatial analysis of the effects of Pm2.5 on hypertension among the middle-aged and elderly people in China. Int J Environ Health Res. (2021) 31:729–40. doi: 10.1080/09603123.2019.1682528
18. Lei, R, Nie, D, Zhang, S, Yu, W, Ge, X, and Song, N. Spatial and temporal characteristics of air pollutants and their health effects in China during 2019–2020. J Environ Manag. (2022) 317:115460. doi: 10.1016/j.jenvman.2022.115460
19. Chen, F, and Chen, Z. Cost of economic growth: air pollution and health expenditure. Sci Total Environ. (2021) 755:142543. doi: 10.1016/j.scitotenv.2020.142543
20. Fisher, S, Bellinger, DC, Cropper, ML, Kumar, P, Binagwaho, A, Koudenoukpo, JB, et al. Air pollution and development in Africa: impacts on health, the economy, and human capital. Lancet Planet Health. (2021) 5:e681–8. doi: 10.1016/S2542-5196(21)00201-1
21. Bilgili, F, Kuşkaya, S, Khan, M, Awan, A, and Türker, O. The roles of economic growth and health expenditure on Co2 emissions in selected Asian countries: a quantile regression model approach. Environ Sci Pollut Res. (2021) 28:44949–72. doi: 10.1007/s11356-021-13639-6
22. Coccia, M. High health expenditures and low exposure of population to air pollution as critical factors that can reduce fatality rate in Covid-19 pandemic crisis: a global analysis. Environ Res. (2021) 199:111339. doi: 10.1016/j.envres.2021.111339
23. Barwick, PJ, Li, S, Rao, D, and Zahur, NB. The healthcare cost of air pollution: evidence from the World's largest payment network. Rev Econ Stat. (2024):1–52. doi: 10.1162/rest_a_01430
24. Yin, P, Brauer, M, Cohen, AJ, Wang, H, Li, J, Burnett, RT, et al. The effect of air pollution on deaths, disease burden, and life expectancy across China and its provinces, 1990-2017: an analysis for the global burden of disease study 2017. Lancet Planet Health. (2020) 4:e386–98. doi: 10.1016/S2542-5196(20)30161-3
25. Rana, J, Islam, RM, Khan, MN, Aliani, R, and Oulhote, Y. Association between household air pollution and child mortality in Myanmar using a multilevel mixed-effects Poisson regression with robust variance. Sci Rep. (2021) 11:12983. doi: 10.1038/s41598-021-92193-0
26. Gu, H, Yan, W, Elahi, E, and Cao, Y. Air pollution risks human mental health: an implication of two-stages least squares estimation of interaction effects. Environ Sci Pollut Res. (2020) 27:2036–43. doi: 10.1007/s11356-019-06612-x
27. Grande, G, Ljungman, PLS, Eneroth, K, Bellander, T, and Rizzuto, D. Association between cardiovascular disease and Long-term exposure to air pollution with the risk of dementia. JAMA Neurol. (2020) 77:801–9. doi: 10.1001/jamaneurol.2019.4914
28. Zheng, S, Zhu, W, Wang, M, Shi, Q, Luo, Y, Miao, Q, et al. The effect of diurnal temperature range on blood pressure among 46,609 people in northwestern China. Sci Total Environ. (2020) 730:138987. doi: 10.1016/j.scitotenv.2020.138987
29. Dunn, G, Johnson, GD, Balk, DL, and Sembajwe, G. Spatially varying relationships between risk factors and child diarrhea in West Africa, 2008–2013. Math Popul Stud. (2020) 27:8–33. doi: 10.1080/08898480.2019.1592638
30. de Prado, BP, Mercader, EMH, Pujol, J, Sunyer, J, and Mortamais, M. The effects of air pollution on the brain: a review of studies interfacing environmental epidemiology and neuroimaging. Curr Environ Health Rep. (2018) 5:351–64. doi: 10.1007/s40572-018-0209-9
31. Lee, Y-G, Lee, P-H, Choi, S-M, An, M-H, and Jang, A-S. Effects of air pollutants on airway diseases. Int J Environ Res Public Health. (2021) 18:9905. doi: 10.3390/ijerph18189905
32. Fu, C, Kuang, D, Zhang, H, Ren, J, and Chen, J. Different components of air pollutants and neurological disorders. Front Public Health. (2022) 10:959921. doi: 10.3389/fpubh.2022.959921
33. Liang, W, Zhu, H, Xu, J, Zhao, Z, Zhou, L, Zhu, Q, et al. Ambient air pollution and gestational diabetes mellitus: an updated systematic review and Meta-analysis. Ecotoxicol Environ Saf. (2023) 255:114802. doi: 10.1016/j.ecoenv.2023.114802
34. Shi, L, Zhu, Q, Wang, Y, Hao, H, Zhang, H, Schwartz, J, et al. Incident dementia and Long-term exposure to constituents of fine particle air pollution: a National Cohort Study in the United States. Proc Natl Acad Sci. (2023) 120:e2211282119. doi: 10.1073/pnas.2211282119
35. Requia, WJ, Vicedo-Cabrera, AM, Amini, H, da Silva, GL, Schwartz, JD, and Koutrakis, P. Short-term air pollution exposure and hospital admissions for cardiorespiratory diseases in Brazil: a Nationwide time-series study between 2008 and 2018. Environ Res. (2023) 217:114794. doi: 10.1016/j.envres.2022.114794
36. Demoury, C, Aerts, R, Berete, F, Lefebvre, W, Pauwels, A, Vanpoucke, C, et al. Impact of short-term exposure to air pollution on natural mortality and vulnerable populations: a Multi-City case-crossover analysis in Belgium. Environ Health. (2024) 23:11. doi: 10.1186/s12940-024-01050-w
37. Zhenyu, Z, Dawei, Z, Bin, C, Ruoxi, D, Xuefeng, S, and Ping, H. Association between particulate matter air pollution and lung Cancer. Thorax. (2020) 75:85–7. doi: 10.1136/thoraxjnl-2019-213722
38. Liu, W, Wei, J, Cai, M, Qian, Z, Long, Z, Wang, L, et al. Particulate matter pollution and asthma mortality in China: a Nationwide time-stratified case-crossover study from 2015 to 2020. Chemosphere. (2022) 308:136316. doi: 10.1016/j.chemosphere.2022.136316
39. Zhang, Q, Sun, S, Sui, X, Ding, L, Yang, M, Li, C, et al. Associations between weekly air pollution exposure and congenital heart disease. Sci Total Environ. (2021) 757:143821. doi: 10.1016/j.scitotenv.2020.143821
40. Li, M, Edgell, RC, Wei, J, Li, H, Qian, Z, Feng, J, et al. Air pollution and stroke hospitalization in the Beibu gulf region of China: a case-crossover analysis. Ecotoxicol Environ Saf. (2023) 255:114814. doi: 10.1016/j.ecoenv.2023.114814
41. Peng, Z, Ma, X, Chen, X, and Coyte, PC. The impacts of pollution and its associated spatial spillover effects on ill-health in China. Environ Sci Pollut Res. (2021) 28:59630–9. doi: 10.1007/s11356-021-14813-6
42. Mohammadi, A, Pishgar, E, Fatima, M, Lotfata, A, Fanni, Z, Bergquist, R, et al. The Covid-19 mortality rate is associated with illiteracy, age, and air pollution in urban neighborhoods: a spatiotemporal Cross-sectional analysis. Trop Med Infect Dis. (2023) 8:85. doi: 10.3390/tropicalmed8020085
43. Kim, D, Seo, S, Min, S, Simoni, Z, Kim, S, and Kim, M. A closer look at the bivariate association between ambient air pollution and allergic diseases: The role of spatial analysis. Int J Environ Res Public Health. (2018) 15:1625. doi: 10.3390/ijerph15081625
44. Aturinde, A, Farnaghi, M, Pilesjö, P, Sundquist, K, and Mansourian, A. Spatial analysis of ambient air pollution and cardiovascular disease (Cvd) hospitalization across Sweden. Geohealth. (2021) 5:e2020GH000323. doi: 10.1029/2020GH000323
45. Yim, HS, Cho, S-H, and Seo, B. Impacts of ambient air pollution on health risk in Korea: a spatial panel model assessment. J Econ Theory Econom. (2021) 32:1–24.
46. Sarrias, M, and Molina-Varas, A. Your air pollution makes me sick! Estimating the spatial spillover effects of Pm2.5 emissions on emergency Room visits in Chile. Region. (2022) 9:1–23. doi: 10.18335/region.v9i2.399
47. Cao, Q, Liang, Y, and Niu, X. China’s air quality and respiratory disease mortality based on the spatial panel model. Int J Environ Res Public Health. (2017) 14:1081. doi: 10.3390/ijerph14091081
48. Zhang, Z, Zhang, G, and Su, B. The spatial impacts of air pollution and socio-economic status on public health: empirical evidence from China. Socio Econ Plan Sci. (2022) 83:101167. doi: 10.1016/j.seps.2021.101167
49. Qin, Y, Sun, C, Li, D, Zhang, H, Wang, H, and Duan, Y. Does urban air pollution have an impact on public health? Empirical evidence from 288 prefecture-level cities in China. Urban Clim. (2023) 51:101660. doi: 10.1016/j.uclim.2023.101660
50. Bennett, JE, Tamura-Wicks, H, Parks, RM, Burnett, RT, Pope, CA III, Bechle, MJ, et al. Particulate matter air pollution and national and county life expectancy loss in the USA: a spatiotemporal analysis. PLoS Med. (2019) 16:e1002856. doi: 10.1371/journal.pmed.1002856
51. Cardoso, D, Painho, M, and Roquette, R. A geographically weighted regression approach to investigate air pollution effect on lung Cancer: a case study in Portugal. Geospat Health. (2019) 14. doi: 10.4081/gh.2019.701
52. Chen, Q, Zheng, X, Xu, B, Sun, M, Zhou, Q, Lin, J, et al. Exploring the spatiotemporal relationship between influenza and air pollution in Fuzhou using spatiotemporal weighted regression model. Sci Rep. (2024) 14:4116. doi: 10.1038/s41598-024-54630-8
53. Yan, D, Ji, H, Fu, H, Jiang, J, Su, B, and Ye, B. The effect of fine particulate matter (Pm2.5) pollution on health inequality: an intergenerational perspective. Environ Geochem Health. (2024) 46:195. doi: 10.1007/s10653-024-01982-9
54. Boakye, KA, Iyanda, AE, Oppong, JR, and Lu, Y. A multiscale analysis of social and spatial determinants of Cancer and noncancer hazards from on-road air pollution in Texas. Spat Spatiotemporal Epidemiol. (2022) 41:100484. doi: 10.1016/j.sste.2022.100484
55. Wang, M, and Wang, H. Spatial distribution patterns and influencing factors of Pm2.5 pollution in the Yangtze River Delta: empirical analysis based on a Gwr model. Asia-Pac J Atmos Sci. (2021) 57:63–75. doi: 10.1007/s13143-019-00153-6
56. Li, C, and Managi, S. Spatial variability of the relationship between air pollution and well-being. Sustain Cities Soc. (2022) 76:103447. doi: 10.1016/j.scs.2021.103447
57. Martínez Bascuñán, M, and Rojas, QC. Geographically weighted regression for modelling the accessibility to the public hospital network in ConcepciÃ3n metropolitan area, Chile. Geospat Health. (2016) 11:451. doi: 10.4081/gh.2016.451
58. Nkeki, FN, and Osirike, AB. Gis-based local spatial statistical model of cholera occurrence: using geographically weighted regression. J Geogr Inf Syst. (2013) 5. doi: 10.4236/jgis.2013.56050
59. Bentué-Martínez, C, Rodrigues, M, Llorente González, JM, Sebastián Ariño, A, Zuil Martínez, M, and Zúñiga-Antón, M. Spatial patterns in the association between the prevalence of asthma and determinants of health. Geogr Anal. (2024) 56:265–83. doi: 10.1111/gean.12380
60. Sruthi, S, Aleyamma, M, Krishna, KMJ, Nath, PR, Arun, S, Vinod, TR, et al. Assessment of spatial variation in lung Cancer incidence and air pollutants: spatial regression modeling approach. Int J Environ Health Res. (2024):1–15. doi: 10.1080/09603123.2024.2362844
61. Huang, B, Wu, B, and Barry, M. Geographically and temporally weighted regression for modeling Spatio-temporal variation in house prices. Int J Geogr Inf Sci. (2010) 24:383–401. doi: 10.1080/13658810802672469
62. Zhang, Y, Li, X, Liu, Q, Qiu, Z, and Fa, Z. How to identify public risk perception in public health emergencies and explore its driving mechanism? An empirical analysis in the Xi'an epidemic. Sustain Cities Soc. (2024) 108:105502. doi: 10.1016/j.scs.2024.105502
63. Zhang, L, Wei, L, and Fang, Y. Spatial–temporal distribution patterns and influencing factors analysis of comorbidity prevalence of chronic diseases among middle-aged and elderly people in China: focusing on exposure to ambient fine particulate matter (Pm2.5). BMC Public Health. (2024) 24:550. doi: 10.1186/s12889-024-17986-0
64. Wang, Y, Guo, B, Pei, L, Guo, H, Zhang, D, Ma, X, et al. The influence of socioeconomic and environmental determinants on acute myocardial infarction (Ami) mortality from the spatial epidemiological perspective. Environ Sci Pollut Res. (2022) 29:63494–511. doi: 10.1007/s11356-022-19825-4
65. Yu, H, Yang, J, Yan, Y, Zhang, H, Chen, Q, and Sun, L. Factors affecting the incidence of pulmonary tuberculosis based on the Gtwr model in China, 2004–2021. Epidemiol Infect. (2024) 152:e65. doi: 10.1017/S0950268824000335
66. Guo, B, Wang, Y, Pei, L, Yu, Y, Liu, F, Zhang, D, et al. Determining the effects of socioeconomic and environmental determinants on chronic obstructive pulmonary disease (Copd) mortality using geographically and temporally weighted regression model across Xi'an during 2014–2016. Sci Total Environ. (2021) 756:143869. doi: 10.1016/j.scitotenv.2020.143869
67. Fischer, C, and Heutel, G. Environmental macroeconomics: environmental policy, business cycles, and directed technical change. Annu Rev Resour Econ. (2013) 5:197–210. doi: 10.1146/annurev-resource-091912-151819
68. Greenstone, M, and Hanna, R. Environmental regulations, air and water pollution, and infant mortality in India. Am Econ Rev. (2014) 104:3038–72. doi: 10.1257/aer.104.10.3038
69. Riedel, N, Loerbroks, A, Bolte, G, and Li, J. Do perceived job insecurity and annoyance due to air and noise pollution predict incident self-rated poor health? A prospective analysis of independent and joint associations using a German National Representative Cohort Study. BMJ Open. (2017) 7:e012815. doi: 10.1136/bmjopen-2016-012815
70. Deryugina, T, Heutel, G, Miller, NH, Molitor, D, and Reif, J. The mortality and medical costs of air pollution: evidence from changes in wind direction. Am Econ Rev. (2019) 109:4178–219. doi: 10.1257/aer.20180279
71. Zhang, L, Luo, Y, Zhang, Y, Pan, X, Zhao, D, and Wang, Q. Green space, air pollution, weather, and cognitive function in middle and old age in China. Front Public Health. (2022) 10:871104. doi: 10.3389/fpubh.2022.871104
72. Azimi, M, Feng, F, and Zhou, C. Air pollution inequality and health inequality in China: an empirical study. Environ Sci Pollut Res. (2019) 26:11962–74. doi: 10.1007/s11356-019-04599-z
73. Wu, B, Li, T, Baležentis, T, and Štreimikienė, D. Impacts of income growth on air pollution-related health risk: exploiting objective and subjective measures. Resour Conserv Recycl. (2019) 146:98–105. doi: 10.1016/j.resconrec.2019.03.037
74. Geng, G, Zheng, Y, Zhang, Q, Xue, T, Zhao, H, Tong, D, et al. Drivers of Pm2.5 air pollution deaths in China 2002–2017. Nat Geosci. (2021) 14:645–50. doi: 10.1038/s41561-021-00792-3
75. Pang, Z, Xie, B, An, Z, and Wang, L. Spatial and moderating effects of greenspace on the association between air pollution and lung Cancer incidence. Appl Geogr. (2024) 164:103207. doi: 10.1016/j.apgeog.2024.103207
76. Knittel, CR, Miller, DL, and Sanders, NJ. Caution, drivers! Children present: traffic, pollution, and infant health. Rev Econ Stat. (2016) 98:350–66. doi: 10.1162/REST_a_00548
77. Anselin, L, and Griffith, DA. Do spatial Effecfs really matter in regression analysis? Pap Reg Sci. (1988) 65:11–34. doi: 10.1111/j.1435-5597.1988.tb01155.x
78. Ferm, M, and Sjöberg, K. Concentrations and emission factors for Pm2.5 and Pm10 from road traffic in Sweden. Atmos Environ. (2015) 119:211–9. doi: 10.1016/j.atmosenv.2015.08.037
79. Xu, H, Pan, W, Xin, M, Pan, W, Hu, C, Wanqiang, D, et al. Study of the economic, environmental, and social factors affecting Chinese Residents' health based on machine learning. Front Public Health. (2022) 10:896635. doi: 10.3389/fpubh.2022.896635
80. Neidell, MJ. Air pollution, health, and socio-economic status: The effect of outdoor air quality on childhood asthma. J Health Econ. (2004) 23:1209–36. doi: 10.1016/j.jhealeco.2004.05.002
81. Frank, J, Abel, T, Campostrini, S, Cook, S, Lin, VK, and McQueen, DV. The social determinants of health: time to re-think? Int J Environ Res Public Health. (2020) 17:5856. doi: 10.3390/ijerph17165856
82. Meng, J. [retracted] economic growth effect of public health investment and its impact on living environment. J Environ Public Health. (2022) 2022:2192255. doi: 10.1155/2022/2192255
83. Odani, S, Shinozaki, T, Shibuya, K, and Tabuchi, T. Economic hardships and self-reported deterioration of physical and mental health under the Covid-19 pandemic: a Cross-sectional study, 2020, Japan. J Epidemiol. (2022) 32:195–203. doi: 10.2188/jea.JE20210268
84. Matranga, D, and Maniscalco, L. Inequality in healthcare utilization in Italy: how important are barriers to access? Int J Environ Res Public Health. (2022) 19:1697. doi: 10.3390/ijerph19031697
85. Paulsen, L, Benz, L, Müller, C, Wallmann-Sperlich, B, and Bucksch, J. Determinants influencing municipal decision-makers in Germany regarding community health promotion. Eur J Pub Health. (2022) 32:130–221. doi: 10.1093/eurpub/ckac130.221
86. Lopez, RB, Courtney, AL, Liang, D, Swinchoski, A, Goodson, P, and Denny, BT. Social support and adaptive emotion regulation: links between social network measures, emotion regulation strategy use, and health. Am Psychol Assoc. (2024) 24:130–8. doi: 10.1037/emo0001242
87. Hrivnák, M, Moritz, P, Melichová, K, and Bellérová, S. Does civic engagement support relational and mental health of urban population? Societies. (2023) 13:46. doi: 10.3390/soc13020046
88. Ratnasari, D. The influence of sociocultural practices of society on health: The influence of sociocultural practices of society on health. Int J Health Med Sports. (2023) 1:12–5. doi: 10.46336/ijhms.v1i4.17
89. Vaswani, M, Esses, VM, Newby-Clark, IR, and Giguère, B. Cultural differences in fear of negative evaluation after social norm transgressions and the impact on mental health. Front Psychol. (2022) 13:804841. doi: 10.3389/fpsyg.2022.804841
90. Nwana, N, Makram, OM, Javed, Z, Parekh, T, Al-Kindi, S, Nicolas, C, et al. Abstract 07: cardiovascular health and environmental justice concerns of exposure to fine particulate matter: insights from the Houston Methodist outpatient learning health system registry. Circulation. (2023) 147:A07–A. doi: 10.1161/circ.147.suppl_1.07
91. Li, S-J, Luo, Y-F, Liu, Z-C, Xiong, L, and Zhu, B-W. Exploring strategies for improving Green open spaces in old downtown residential communities from the perspective of public health to enhance the health and well-being of the aged. J Healthc Eng. (2021) 2021:5547749–20. doi: 10.1155/2021/5547749
92. Vandyck, T, Ebi, KL, Green, D, Cai, W, and Vardoulakis, S. Climate change, air pollution and human health. Environ Res Lett. (2022) 17:100402. doi: 10.1088/1748-9326/ac948e
93. Raghupathi, V, and Raghupathi, W. The influence of education on health: an empirical assessment of Oecd countries for the period 1995–2015. Arch Public Health. (2020) 78:20. doi: 10.1186/s13690-020-00402-5
94. Aljassim, N, and Ostini, R. Health literacy in rural and urban populations: a systematic review. Patient Educ Couns. (2020) 103:2142–54. doi: 10.1016/j.pec.2020.06.007
95. Walters, R, Leslie, SJ, Polson, R, Cusack, T, and Gorely, T. Establishing the efficacy of interventions to improve health literacy and health Behaviours: a systematic review. BMC Public Health. (2020) 20:1040. doi: 10.1186/s12889-020-08991-0
96. Davidson, KW, Mangione, CM, Barry, MJ, Nicholson, WK, Cabana, MD, Caughey, AB, et al. Collaboration and shared decision-making between patients and clinicians in preventive health care decisions and us preventive services task force recommendations. JAMA. (2022) 327:1171–6. doi: 10.1001/jama.2022.3267
97. Sutherland, JM. The tangled web of integrating health and social Services in Canada. Healthc Policy. (2023) 19:8–9. doi: 10.12927/hcpol.2023.27183
98. Kim, J, You, M, and Shon, C. Impact of the Covid-19 pandemic on unmet healthcare needs in Seoul, South Korea: a Cross-sectional study. BMJ Open. (2021) 11:e045845. doi: 10.1136/bmjopen-2020-045845
99. Stacherl, B, and Sauzet, O. Chronic disease onset and wellbeing development: longitudinal analysis and the role of healthcare access. Eur J Pub Health. (2024) 34:29–34. doi: 10.1093/eurpub/ckad167
100. Dahlgren, G, and Whitehead, M. The Dahlgren-Whitehead model of health determinants: 30 years on and still chasing rainbows. Public Health. (2021) 199:20–4. doi: 10.1016/j.puhe.2021.08.009
101. Zanobini, P, Lorini, C, Lastrucci, V, Minardi, V, Possenti, V, Masocco, M, et al. Health literacy, socio-economic determinants, and healthy behaviours: results from a large representative sample of Tuscany region, Italy. Int J Environ Res Public Health. (2021) 18:12432. doi: 10.3390/ijerph182312432
102. Vila, J. Social support and longevity: Meta-analysis-based evidence and psychobiological mechanisms. Front Psychol. (2021) 12:717164. doi: 10.3389/fpsyg.2021.717164
103. Robinson, EJZ. Climate friendly public health policies make economic sense. BMJ. (2023) 383:2236. doi: 10.1136/bmj.p2236
104. Lu, Z-N, Zhao, M, Guo, Y, and Hao, Y. Evaluating Pm2.5-related health costs in China—evidence from 140 Chinese cities. Int J Health Plann Manag. (2022) 37:2376–94. doi: 10.1002/hpm.3478
105. Tainio, M, Jovanovic Andersen, Z, Nieuwenhuijsen, MJ, Hu, L, de Nazelle, A, An, R, et al. Air pollution, physical activity and health: a mapping review of the evidence. Environ Int. (2021) 147:105954. doi: 10.1016/j.envint.2020.105954
106. Du, Y, and You, S. Interaction among air pollution, National Health, and economic development. Sustainability. (2022) 15:587. doi: 10.3390/su15010587
107. Manisalidis, I, Stavropoulou, E, Stavropoulos, A, and Bezirtzoglou, E. Environmental and health impacts of air pollution: a review. Front Public Health. (2020) 8:14. doi: 10.3389/fpubh.2020.00014
108. Li, S-J, Sun, B, Hou, D-X, Jin, W-J, and Ji, Y. Does industrial agglomeration or foreign direct investment matter for environment pollution of public health? Evidence from China. Front Public Health. (2021) 9:711033. doi: 10.3389/fpubh.2021.711033
109. Chatkin, J, Correa, L, and Santos, U. External environmental pollution as a risk factor for asthma. Clin Rev Allergy Immunol. (2022) 62:72–89. doi: 10.1007/s12016-020-08830-5
110. Mujtaba, G, and Shahzad, SJH. Air pollutants, economic growth and public health: implications for sustainable development in Oecd countries. Environ Sci Pollut Res. (2021) 28:12686–98. doi: 10.1007/s11356-020-11212-1
111. Almetwally, AA, Bin-Jumah, M, and Allam, AA. Ambient air pollution and its influence on human health and welfare: an overview. Environ Sci Pollut Res. (2020) 27:24815–30. doi: 10.1007/s11356-020-09042-2
112. Iqbal, W, Tang, YM, Chau, KY, Irfan, M, and Mohsin, M. Nexus between air pollution and Ncov-2019 in China: application of negative binomial regression analysis. Process Saf Environ Prot. (2021) 150:557–65. doi: 10.1016/j.psep.2021.04.039
113. Cao, Q, Rui, G, and Liang, Y. Study on Pm2.5 pollution and the mortality due to lung Cancer in China based on geographic weighted regression model. BMC Public Health. (2018) 18:925. doi: 10.1186/s12889-018-5844-4
114. Liao, L, Du, M, and Chen, Z. Air pollution, health care use and medical costs: evidence from China. Energy Econ. (2021) 95:105132. doi: 10.1016/j.eneco.2021.105132
115. Chen, J, Wang, B, Huang, S, and Song, M. The influence of increased population density in China on air pollution. Sci Total Environ. (2020) 735:139456. doi: 10.1016/j.scitotenv.2020.139456
116. Wang, S, Gao, S, Li, S, and Feng, K. Strategizing the relation between urbanization and air pollution: empirical evidence from global countries. J Clean Prod. (2020) 243:118615. doi: 10.1016/j.jclepro.2019.118615
117. Taghizadeh-Hesary, F, and Taghizadeh-Hesary, F. The impacts of air pollution on health and economy in Southeast Asia. Energies. (2020) 13:1812. doi: 10.3390/en13071812
118. Wang, Z, Qi, Z, and Zhu, L. Latitudinal and longitudinal variations in the impact of air pollution on well-being in China. Environ Impact Assess Rev. (2021) 90:106625. doi: 10.1016/j.eiar.2021.106625
119. Bao, J, Yang, X, Zhao, Z, Wang, Z, Yu, C, and Li, X. The spatial-temporal characteristics of air pollution in China from 2001–2014. Int J Environ Res Public Health. (2015) 12:15875–87. doi: 10.3390/ijerph121215029
120. Cliff, AD, and Ord, K. Spatial autocorrelation: a review of existing and new measures with applications. Econ Geogr. (1970) 46:269–92. doi: 10.2307/143144
121. Anselin, L. Local indicators of spatial association—Lisa. Geogr Anal. (1995) 27:93–115. doi: 10.1111/j.1538-4632.1995.tb00338.x
122. LeSage, JP, and Pace, RK. Interpreting Spatial Econometric Models. In: MM Fischer and P Nijkamp, editors. Handbook of regional science. Berlin, Heidelberg: Springer Berlin Heidelberg (2021). 2201–18.
123. Wang, F, Wang, R, and He, Z. The impact of environmental pollution and Green finance on the high-quality development of energy based on spatial Dubin model. Resour Policy. (2021) 74:102451. doi: 10.1016/j.resourpol.2021.102451
124. Miao, Z, Baležentis, T, Tian, Z, Shao, S, Geng, Y, and Wu, R. Environmental performance and regulation effect of China’s atmospheric pollutant emissions: evidence from “three regions and ten urban agglomerations”. Environ Resour Econ. (2019) 74:211–42. doi: 10.1007/s10640-018-00315-6
125. LeSage, JP, and Pace, RK. The biggest myth in spatial econometrics. Econometrics. (2014) 2:217–49. doi: 10.3390/econometrics2040217
126. Zhang, Z, Zhang, G, Song, S, and Su, B. Spatial heterogeneity influences of environmental control and informal regulation on air pollutant emissions in China. Int J Environ Res Public Health. (2020) 17:4857. doi: 10.3390/ijerph17134857
127. Brunsdon, C, Fotheringham, S, and Charlton, M. Geographically weighted regression. J R Stat Soc Ser D. (1998) 47:431–43. doi: 10.1111/1467-9884.00145
128. Tian, A, Xu, T, Gao, J, Liu, C, and Han, L. Multi-scale spatiotemporal wetland loss and its critical influencing factors in China determined using innovative grid-based Gwr. Ecol Indic. (2023) 149:110144. doi: 10.1016/j.ecolind.2023.110144
129. Xu, Y, Zhang, W, Huo, T, Streets, DG, and Wang, C. Investigating the Spatio-temporal influences of urbanization and other socioeconomic factors on City-level industrial Nox emissions: a case study in China. Environ Impact Assess Rev. (2023) 99:106998. doi: 10.1016/j.eiar.2022.106998
130. Anselin, L, and Smirnov, O. Efficient algorithms for constructing proper higher order spatial lag operators*. J Reg Sci. (1996) 36:67–89. doi: 10.1111/j.1467-9787.1996.tb01101.x
131. LeSage, J, and Pace, RK. Introduction to spatial econometrics. New York: Chapman and Hall/CRC (2009).
132. He, L, Zhang, L, and Liu, R. Energy consumption, air quality, and air pollution spatial spillover effects: evidence from the Yangtze River Delta of China. Chin J Popul Resour Environ. (2019) 17:329–40. doi: 10.1080/10042857.2019.1650245
133. Chen, H, Zhang, L, Zou, W, Gao, Q, and Zhao, H. Regional differences of air pollution in China: comparison of clustering analysis and systematic clustering methods of panel data based on gray relational analysis. Air Qual Atmos Health. (2020) 13:1257–69. doi: 10.1007/s11869-020-00880-0
134. Chen, X, Shao, S, Tian, Z, Xie, Z, and Yin, P. Impacts of air pollution and its spatial spillover effect on public health based on China's big data sample. J Clean Prod. (2017) 142:915–25. doi: 10.1016/j.jclepro.2016.02.119
135. Li, L, Lei, Y, Pan, D, Yu, C, and Si, C. Economic evaluation of the air pollution effect on public health in China’s 74 cities. Springerplus. (2016) 5:402. doi: 10.1186/s40064-016-2024-9
136. Liu, H, Cui, W, and Zhang, M. Exploring the causal relationship between urbanization and air pollution: evidence from China. Sustain Cities Soc. (2022) 80:103783. doi: 10.1016/j.scs.2022.103783
137. Wei, F, Cui, S, Liu, N, Chang, J, Ping, X, Ma, T, et al. Ecological civilization: China's effort to build a shared future for all life on earth. Natl Sci Rev. (2021) 8:nwaa279. doi: 10.1093/nsr/nwaa279
138. Huang, J-T. Sulfur dioxide (So2) emissions and government spending on environmental protection in China – evidence from spatial econometric analysis. J Clean Prod. (2018) 175:431–41. doi: 10.1016/j.jclepro.2017.12.001
139. Ren, L, and Matsumoto, K'. Effects of socioeconomic and natural factors on air pollution in China: a spatial panel data analysis. Sci Total Environ. (2020) 740:140155. doi: 10.1016/j.scitotenv.2020.140155
140. Diener, A, and Mudu, P. How can vegetation protect us from air pollution? A critical review on green spaces' mitigation abilities for air-borne particles from a public health perspective – with implications for urban planning. Sci Total Environ. (2021) 796:148605. doi: 10.1016/j.scitotenv.2021.148605
141. Sun, M, and Li, X. Air pollution and public health: an empirical study based on provincial panel data. Popul J. (2017) 39:5–13.
142. Sun, H, Yang, X, and Leng, Z. Research on the spatial effects of haze pollution on public health: spatial–temporal evidence from the Yangtze River Delta urban agglomerations, China. Environ Sci Pollut Res. (2022) 29:44422–41. doi: 10.1007/s11356-022-19017-0
143. Yang, T, Zhou, K, and Ding, T. Air pollution impacts on public health: evidence from 110 cities in Yangtze River Economic Belt of China. Sci Total Environ. (2022) 851:158125. doi: 10.1016/j.scitotenv.2022.158125
144. Wang, S, Wang, C, and Wang, H. Air pollution impacts on health care expenditure in China: evidence and mechanisms. Appl Econ. (2023) 55:7111–26. doi: 10.1080/00036846.2023.2206105
145. Xin, Y, and Ren, X. Determinants of province-based health service utilization according to Andersen’ S behavioral model: a population-based spatial panel modeling study. BMC Public Health. (2023) 23:985. doi: 10.1186/s12889-023-15885-4
146. Jiang, L, He, S, Cui, Y, Zhou, H, and Kong, H. Effects of the socio-economic influencing factors on So2 pollution in Chinese cities: a spatial econometric analysis based on satellite observed data. J Environ Manag. (2020) 268:110667. doi: 10.1016/j.jenvman.2020.110667
147. Feng, Y, Cheng, J, Shen, J, and Sun, H. Spatial effects of air pollution on public health in China. Environ Resour Econ. (2019) 73:229–50. doi: 10.1007/s10640-018-0258-4
148. Xu, C, and Wang, S. Industrial three-division network system in China: efficiencies and their impact factors. Environ Sci Pollut Res. (2021) 28:47375–94. doi: 10.1007/s11356-021-13651-w
149. Yang, T, and Liu, W. Does air pollution affect public health and health inequality? Empirical evidence from China. J Clean Prod. (2018) 203:43–52. doi: 10.1016/j.jclepro.2018.08.242
150. Levinson, A. Valuing public goods using happiness data: The case of air quality. J Public Econ. (2012) 96:869–80. doi: 10.1016/j.jpubeco.2012.06.007
151. Wang, Y, Sun, K, Li, L, Lei, Y, Wu, S, Jiang, Y, et al. The impacts of economic level and air pollution on public health at the Micro and macro level. J Clean Prod. (2022) 366:132932. doi: 10.1016/j.jclepro.2022.132932
152. Hao, Y, and Liu, Y-M. The influential factors of urban Pm2.5 concentrations in China: a spatial econometric analysis. J Clean Prod. (2016) 112:1443–53. doi: 10.1016/j.jclepro.2015.05.005
153. Lu, X, Lin, C, Li, W, Chen, Y, Huang, Y, Fung, JCH, et al. Analysis of the adverse health effects of Pm2.5 from 2001 to 2017 in China and the role of urbanization in aggravating the health burden. Sci Total Environ. (2019) 652:683–95. doi: 10.1016/j.scitotenv.2018.10.140
154. Shen, H, Tao, S, Chen, Y, Ciais, P, Güneralp, B, Ru, M, et al. Urbanization-induced population migration has reduced ambient PM2.5concentrations in China. Sci Adv. (2017) 3:e1700300. doi: 10.1126/sciadv.1700300
155. Wang, S, Zhang, Y, and Yao, X. Research on spatial unbalance and influencing factors of ecological well-being performance in China. Int J Environ Res Public Health. (2021) 18:9299. doi: 10.3390/ijerph18179299
156. Enssle, F, and Kabisch, N. Urban Green spaces for the social interaction, health and well-being of older people— an integrated view of urban ecosystem services and socio-environmental justice. Environ Sci Pol. (2020) 109:36–44. doi: 10.1016/j.envsci.2020.04.008
157. Yang, Y, and Jiang, B. Green spaces in highly urbanized tracts tied to lower prevalence of chronic respiratory diseases: a Nationwide study across levels of Urbanicity. Urban For Urban Green. (2023) 90:128149. doi: 10.1016/j.ufug.2023.128149
158. Pan, Z, Dong, W, and Huang, Z. Does the population size of a City matter to its older adults’ self-rated health? Results of China data analysis. Front Public Health. (2024) 12:1333961. doi: 10.3389/fpubh.2024.1333961
159. Luo, H, Guan, Q, Lin, J, Wang, Q, Yang, L, Tan, Z, et al. Air pollution characteristics and human health risks in key cities of Northwest China. J Environ Manag. (2020) 269:110791. doi: 10.1016/j.jenvman.2020.110791
160. Zhao, X, Jiang, M, and Zhang, W. The impact of environmental pollution and economic growth on public health: evidence from China. Front Public Health. (2022) 10:861157. doi: 10.3389/fpubh.2022.861157
Keywords: public health, air pollution, geographically and temporally weighted regression model, influencing factors, spatiotemporal heterogeneity
Citation: Ye Y, Tao Q and Wei H (2024) Public health impacts of air pollution from the spatiotemporal heterogeneity perspective: 31 provinces and municipalities in China from 2013 to 2020. Front. Public Health. 12:1422505. doi: 10.3389/fpubh.2024.1422505
Edited by:
Donatella Feretti, University of Brescia, ItalyReviewed by:
Zhenhua Zhang, Lanzhou University, ChinaChongxian Chen, South China Agricultural University, China
Copyright © 2024 Ye, Tao and Wei. This is an open-access article distributed under the terms of the Creative Commons Attribution License (CC BY). The use, distribution or reproduction in other forums is permitted, provided the original author(s) and the copyright owner(s) are credited and that the original publication in this journal is cited, in accordance with accepted academic practice. No use, distribution or reproduction is permitted which does not comply with these terms.
*Correspondence: Qunshan Tao, dGFvX3F1bnNoYW5AMTYzLmNvbQ==