 Mariola Głowacka
 Zofia Sienkiewicz2
- 1Collegium Medicum, The Mazovian University in Płock, Płock, Poland
- 2Faculty of Health Sciences, Medical University of Warsaw, Warsaw, Poland
- 3Department of Health Economics and Medical Law, Faculty of Health Sciences, Medical University of Warsaw, Warsaw, Poland
- 4Neurological and Neurosurgical Nursing Department, Faculty of Health Science, Collegium Medicum in Bydgoszcz, Nicolaus Copernicus University in Torun, Bydgoszcz, Poland
Background: Based on its definition of an individual’s quality of life, the World Health Organization identified the following six basic domains of this concept: physical domain, psychological domain, level of independence, social relationships, environment and spirituality. The aim of the study was to examine these quality of life dimensions in pre-older and older adults in relation to selected sociodemographic variables.
Methods: The study included 2,040 adults aged 55 or older. It was conducted using a diagnostic survey by means of a questionnaire with sociodemographic questions and the EQ-5D-3L descriptive system.
Results: The vast majority of male and female respondents reported no problems in most EQ-5D-3L dimensions. However, the mean EQ-5D-3L index score indicated a slight difference in scores between men and women. A statistically significant difference between male and female respondents in individual dimension scores was found only for the usual activities dimension. The proportion of respondents reporting no problems decreased with age in most dimensions, except for anxiety/depression. Age was statistically significantly correlated with all individual dimension scores and the index score. The vast majority of respondents across all education levels reported no problems in most dimensions. Education was statistically significantly correlated with all individual dimension scores and the index score.
Conclusion: The vast majority of respondents across both sexes and all education levels reported no problems in most EQ-5D-3L dimensions. The proportion of respondents reporting no problems decreased with age in most EQ-5D-3L dimensions. Systematic research on dimensions of health-related quality of life will help design measures for healthy and successful ageing.
1 Introduction
Interest in quality of life (QoL) dates back to ancient times. The term ‘quality’, understood as a certain degree of perfection, was first used by Plato. The philosopher emphasised a subjective approach to quality, indicating that it can only be understood through experience (1, 2).
Today, QoL is of interest to researchers in many areas of science and social policy. The value of life is determined, among other things, by its quality, which implies a certain standard—a reference point for human life (3, 4). In medicine, the standardisation of the term ‘quality of life’ was prompted by the definition proposed by the World Health Organization (WHO) in 1948, which states that health is “a state of complete physical, mental and social wellbeing not merely the absence of disease…” (5–8). The definition went beyond the previous traditional biomedical approach to health and leaned towards a biopsychosocial approach to measures of health (7).
One of the first definitions of QoL was developed in 1972 by Rourke and Dalkey, who identified its two key elements, namely satisfaction with life and happiness (9, 10). Subsequent definitions evolved and defined QoL in broader terms. One of the classifications organising the existing definitions of QoL in the medical context is that by Morag Farquhar. The author classified QoL definitions into ‘expert’ or ‘professionals’ definitions and ‘lay’ definitions (11). ‘Expert’ definitions were further classified into global definitions (type 1), component definitions (type 2), focused definitions (type 3) and combination definitions (type 4). Global definitions encompass all aspects of QoL and may incorporate ideas relating to overall satisfaction with life, wellbeing in different areas of life and happiness. Component definitions break down global QoL into a number of component parts (subjective and objective). Focused definitions relate only to specific components of QoL, e.g., health. Here, the most commonly addressed concept is that of the relationship between QoL and health status. Combination definitions combine elements of both global and component definitions. The second group of definitions, i.e., lay definitions, suggest that QoL is such a subjective concept that it cannot be captured in the form of standards or norms (9–12). The WHO definition of QoL, which states that quality of life is “an individual’s perception of their position in life in the context of the culture and value systems in which they live and in relation to their goals, expectations, standards and concerns” is a combination definition (5). It combines elements of both global and component definitions and incorporates additional domains and dimensions such as the individual’s external environment, expectations and economic conditions (13).
The definition of QoL has evolved following a number of studies carried out since the beginning of the 1960s and 1970s, which were pioneered by Campbell. In 1971, together with Converse and Rodgers, he carried out research among US populations aimed at assessing their perceived satisfaction with life. The researchers designed a composite measure of global sense of wellbeing that considered a number of specific domains of life. These included: marriage, family life, health, neighbours, housework, professional career, life in the US, residential environment, education and standard of living (2, 13). Based on his study, Campbell found that there is no clear relationship between the objective parameters of QoL and the level of satisfaction with life (14).
The WHO definition of health, underlining biopsychosocial wellbeing, rather than mere absence of disease, and research demonstrating that objective health status is not a straightforward indicator of needs satisfaction and happiness prompted researchers to further develop the concept of QoL in medical sciences. It was then that health-related quality of life (HRQoL) was defined. One of the first definitions of HRQoL was proposed by Shipper, who stated that it is the impact of disease and its treatment on daily functioning and overall satisfaction with life as perceived by the patient (15). According to this author, HRQoL covers four basic dimensions: physical condition and mobility, mental condition, social and financial situation and somatic sensations (12, 15).
Nowadays, we are witnessing a rapid development of tools used to assess overall QoL and its dimensions. Those most commonly used are generic, specific and mixed questionnaires. Generic questionnaires can be used to assess HRQoL in both healthy individuals and those with health conditions. Unfortunately, they are usually not very sensitive to changes resulting from the treatment used for a given condition. Specific questionnaires are designed for use in a specific group of patients and are more sensitive to changes in health status. Mixed questionnaires include elements of generic questionnaires, but are specific to a given condition (16).
In 1991, the first international quality of life group was established within the WHO. Its work focused mainly on different dimensions of HRQoL (16). In 1994, experts from 15 centres in different countries developed and published a quality of life assessment instrument - the WHOQOL-100 - based on the WHO definition of quality of life. The WHOQOL-100 shows good psychometric properties, as indicated by the results of international multi-centre studies. WHO experts also developed the WHOQOL-BREF, which is an abbreviated version of the WHOQOL-100 (5, 6, 9, 17, 18). Unfortunately, the two scales proved to be less useful in research among older individuals. As compared to younger people, seniors attach importance to other aspects of life and view social relationships and mental wellbeing in a different way (19). Therefore, it is necessary to adapt the existing HRQoL assessment instruments for use in older adults to identify their priority problems and determinants of their satisfaction with medical care (20). One such scale intended for use in older individuals is the WHOQOL-OLD Module. However, it is recommended to be used together with either the WHOQOL-100 or the WHOQOL-BREF. Another tool was also developed, namely the WHOQOL-AGE, which is an optimal instrument for assessing QoL in ageing populations (19–21). An instrument recommended by the National Institute for Health and Care Excellence (NICE) is the EQ-5D-3L questionnaire developed by the EuroQoL Group, which consists of a system of 5 dimensions and 3 levels (18, 22, 23).
The aim of this study was to analyze different dimensions of quality of life in pre-older and older adults in relation to selected sociodemographic variables. We hypothesized that: (1) age would be significantly associated with quality of life as measured by the EQ-5D-3L, with older adults reporting lower scores across multiple dimensions; (2) educational level would significantly influence quality of life, with higher education levels correlating with better outcomes; and (3) gender differences would emerge, particularly in the anxiety/depression dimension, with women reporting more problems than men.
2 Materials and methods
2.1 Participants
The study was carried out among pre-old, young-old and oldest-old adults living in Płock, Poland. The inclusion criteria were as follows: age 55 or older, permanent residence in Płock, absence of cognitive impairment as assessed by the Mini Mental State Examination (MMSE). Respondents were recruited using purposive sampling. Information about the study was promoted by the Mazovian Academy and communicated in every primary healthcare center (POZ) in Płock. During the study period, every individual visiting these centers was informed about the research and the possibility to participate, ensuring broad awareness and access to potential participants. Additionally, members of the University of the Third Age in Płock were also invited to participate. The recruitment process had three stages. In the first stage, respondents were informed about the purpose of the study and its anonymous and voluntary nature. A total of 2,253 people gave their consent to participate in the study. In the next stage, respondents completed relevant questionnaires in paper form or electronically on the LimeSurvey platform (LimeSurvey GmbH, Hamburg, Germany). In the third stage, the completed questionnaires were verified. Ultimately, a total of 2,040 fully completed surveys were analysed. Participants were then categorized into the following age groups: pre-old adults (55–60 years), young-old adults (61–75 years), middle-old adults (76–90 years), and oldest-old adults (over 90 years). The term ‘pre-old’ was used to describe the pre-retirement age group, defined in accordance with Polish law (24). Language correction of the text was performed using the generative AI tool ChatGPT, based on the GPT-4 model, provided by OpenAI.
2.2 Measures
The study was conducted using a diagnostic survey by means of the EQ-5D-3L questionnaire, which was used with the permission of the EuroQoL Research Foundation. Respondents were also asked to complete a sociodemographic questionnaire developed by the authors of the present study.
The EQ-5D questionnaire was designed by the EuroQoL Group to assess HRQoL. It consists of two parts: the EQ-5D descriptive system and the EQ visual analogue scale (EQ VAS). The questionnaire can be completed as follows: in paper form by respondents themselves; in paper form by the interviewer during a face-to-face interview with the respondent; digitally by respondents (an Internet application), or; through a phone call with the interviewer (25–28).
There are three versions of the EQ-5D: EQ-5D-5L, EQ-5D-3L and EQ-5D-Y. The EQ-5D-5L comprises 5 dimensions, each of which has 5 levels, whereas the EQ-5D-3L and the EQ-5D-Y comprise 5 dimensions, each of which has 3 levels (18, 22, 23).
The EQ-5D-3L is recommended for use in adults. It can be used in studies in individual patients or populations in order to compare the health states of patients in a given clinical situation with QoL of the general population (26, 29–33).
The EQ-5D-3L descriptive system comprises the following 5 dimensions: mobility, self-care, usual activities, pain/discomfort and anxiety/depression. Each dimension has three levels coded as one-digit numbers: no problems—coded as 1, some problems—coded as 2, and extreme problems—coded as 3. Respondents are asked to select one level for each dimension. The digits for five dimensions can be combined into a 5-digit number describing the respondent’s health state. The 5-digit number can be converted into a single summary index by applying a formula that attaches weights to each level in each dimension. The weights represent the preferences of the general population of a country/region (26, 29). The EQ VAS is a visual analogue scale that records the patient’s self-rated health on the day it is administered (26, 28).
The study presents data derived from the analysis of the sociodemographic questionnaire and the EQ-5D-3L descriptive system results.
2.3 Procedure and ethical considerations
The study was conducted following the recommendations and was reviewed and approved by the Bioethics Committee of the Mazovian Academy in Plock (statute no. KB/N/BN/P/1.2021). All participants gave their written informed consent in accordance with the Declaration of Helsinki.
2.4 Statistical analysis
The results were analysed descriptively, graphically and statistically. Statistica 10.0 (StatSoft Polska Sp. z o.o., Kraków, Poland) and PQStat (PQStat Software, Poznań, Poland) were used to analyse the data. Statistical significance was set at p < 0.05. Relationships between quantitative variables were assessed using Pearson’s correlation coefficients. The ANOVA test and the Student’s t-test were used to examine the statistical relationships between the features analysed. Descriptive statistics for continuous variables were reported as means (M), standard deviations (SD), results of the analysis of variance (F), results of the Student’s t-test (t), medians (Me), minimum values (Min.), maximum values (Max.), Q25 (lower quartile) and Q75 (upper quartile), confidence intervals, correlation coefficients (r) and degrees of freedom (df). Categorical variables were reported as frequencies (N).
3 Results
The study included 2,040 respondents, whose mean age was 65.4 years. The majority of respondents were women (68.9%; n = 1,406). Men accounted for 31.1% (n = 634) of respondents.
Table 1 shows EQ-5D-3L dimension results by sex.

Table 1. EQ-5D-3L dimensions by sex.
The vast majority of respondents reported no problems (level 1) with self-care (n = 1,819; 89.2%), mobility (n = 1,593; 78.1%) and the ability to perform usual activities (n = 1,492; 73.1%) and reported no anxiety or depression (n = 1,327; 65%). However, most respondents (n = 1,163; 57%) reported having moderate pain or discomfort (level 2). The proportion of respondents selecting level 3 was highest for self-care (n = 16; 0.8%), usual activities (n = 17; 0.8%) and anxiety/depression (n = 17; 0.8%) and lowest for mobility (n = 15; 0.7%) and pain/discomfort (n = 14; 0.7%).
The proportion of female respondents selecting no problems (level 1) was highest for self-care (n = 1,267; 90.1%) and usual activities (n = 1,060; 75.4%). The proportion of female respondents selecting level 3 was lowest for the mobility dimension - only 9 female respondents (0.6%) were confined to bed - and highest for the anxiety/depression dimension (n = 14; 1.0%). Men were more likely than women to report no problems with mobility (n = 496; 78.2%), anxiety/depression (n = 422; 66.6%) and pain/discomfort (n = 279; 44.0%). The proportion of male respondents selecting level 3 was lowest for anxiety/depression (n = 3; 0.5%) and highest for usual activities (n = 7; 1.1%).
Table 2 shows mean index scores for male and female respondents.
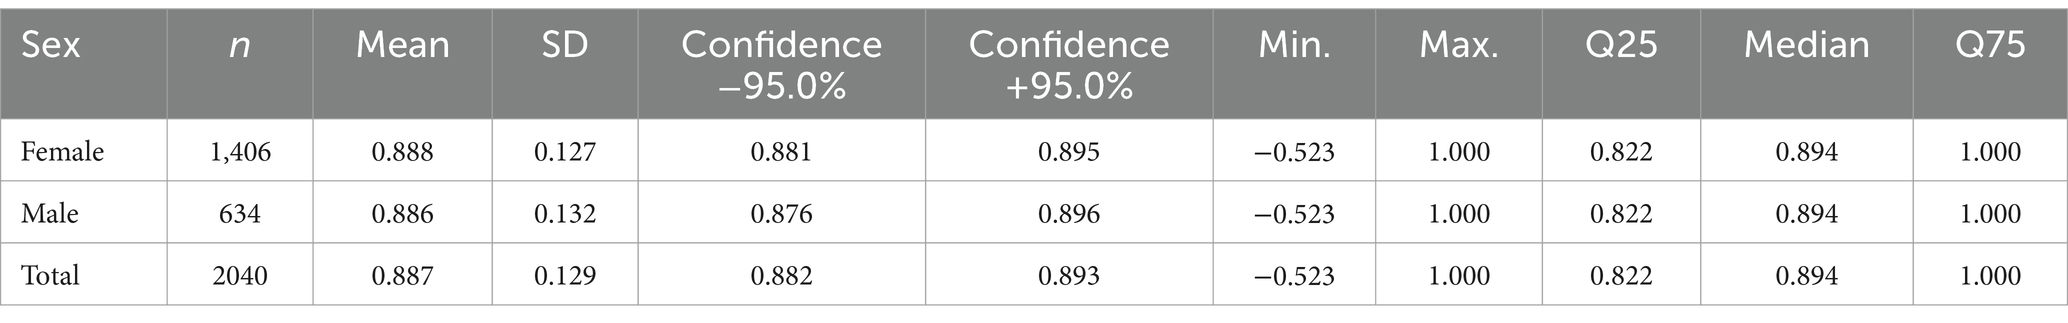
Table 2. Index scores by sex.
The mean index score obtained by respondents was 0.887. The standard deviation was more than 14% of the mean, indicating a slight difference in scores between male and female respondents. Women had a slightly higher mean index score (0.888) compared to men (0.886). Differences in EQ-5D-3L scores between male and female respondents are shown in Table 3.
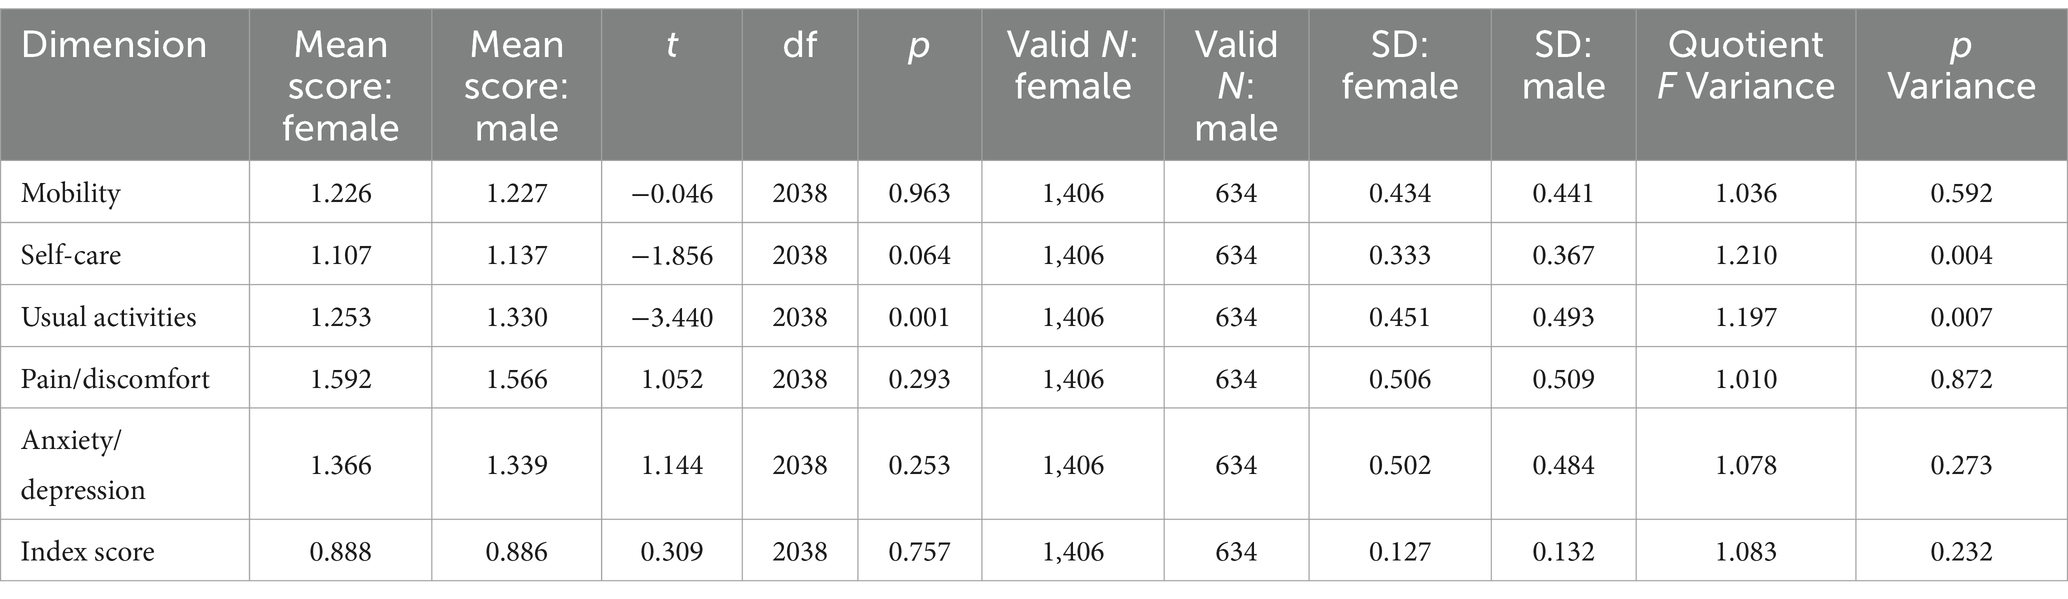
Table 3. Differences in EQ-5D-3L scores between male and female respondents.
A statistically significant difference (p < 0.05) in scores between male and female respondents was found only for the usual activities dimension. The mean age of female respondents was 64.8 years, whereas the mean age of male respondents was 66.87 years. Over half of respondents were aged between 61 and 75 years (n = 1,073; 52.6%). The smallest proportion of respondents were aged over 90 (n = 24; 1.2%). The study also included respondents aged 60 or under (n = 664; 32.5%) and those aged between 76 and 90 (n = 279; 13.7%). Table 4 shows EQ-5D-3L dimension results by age group.
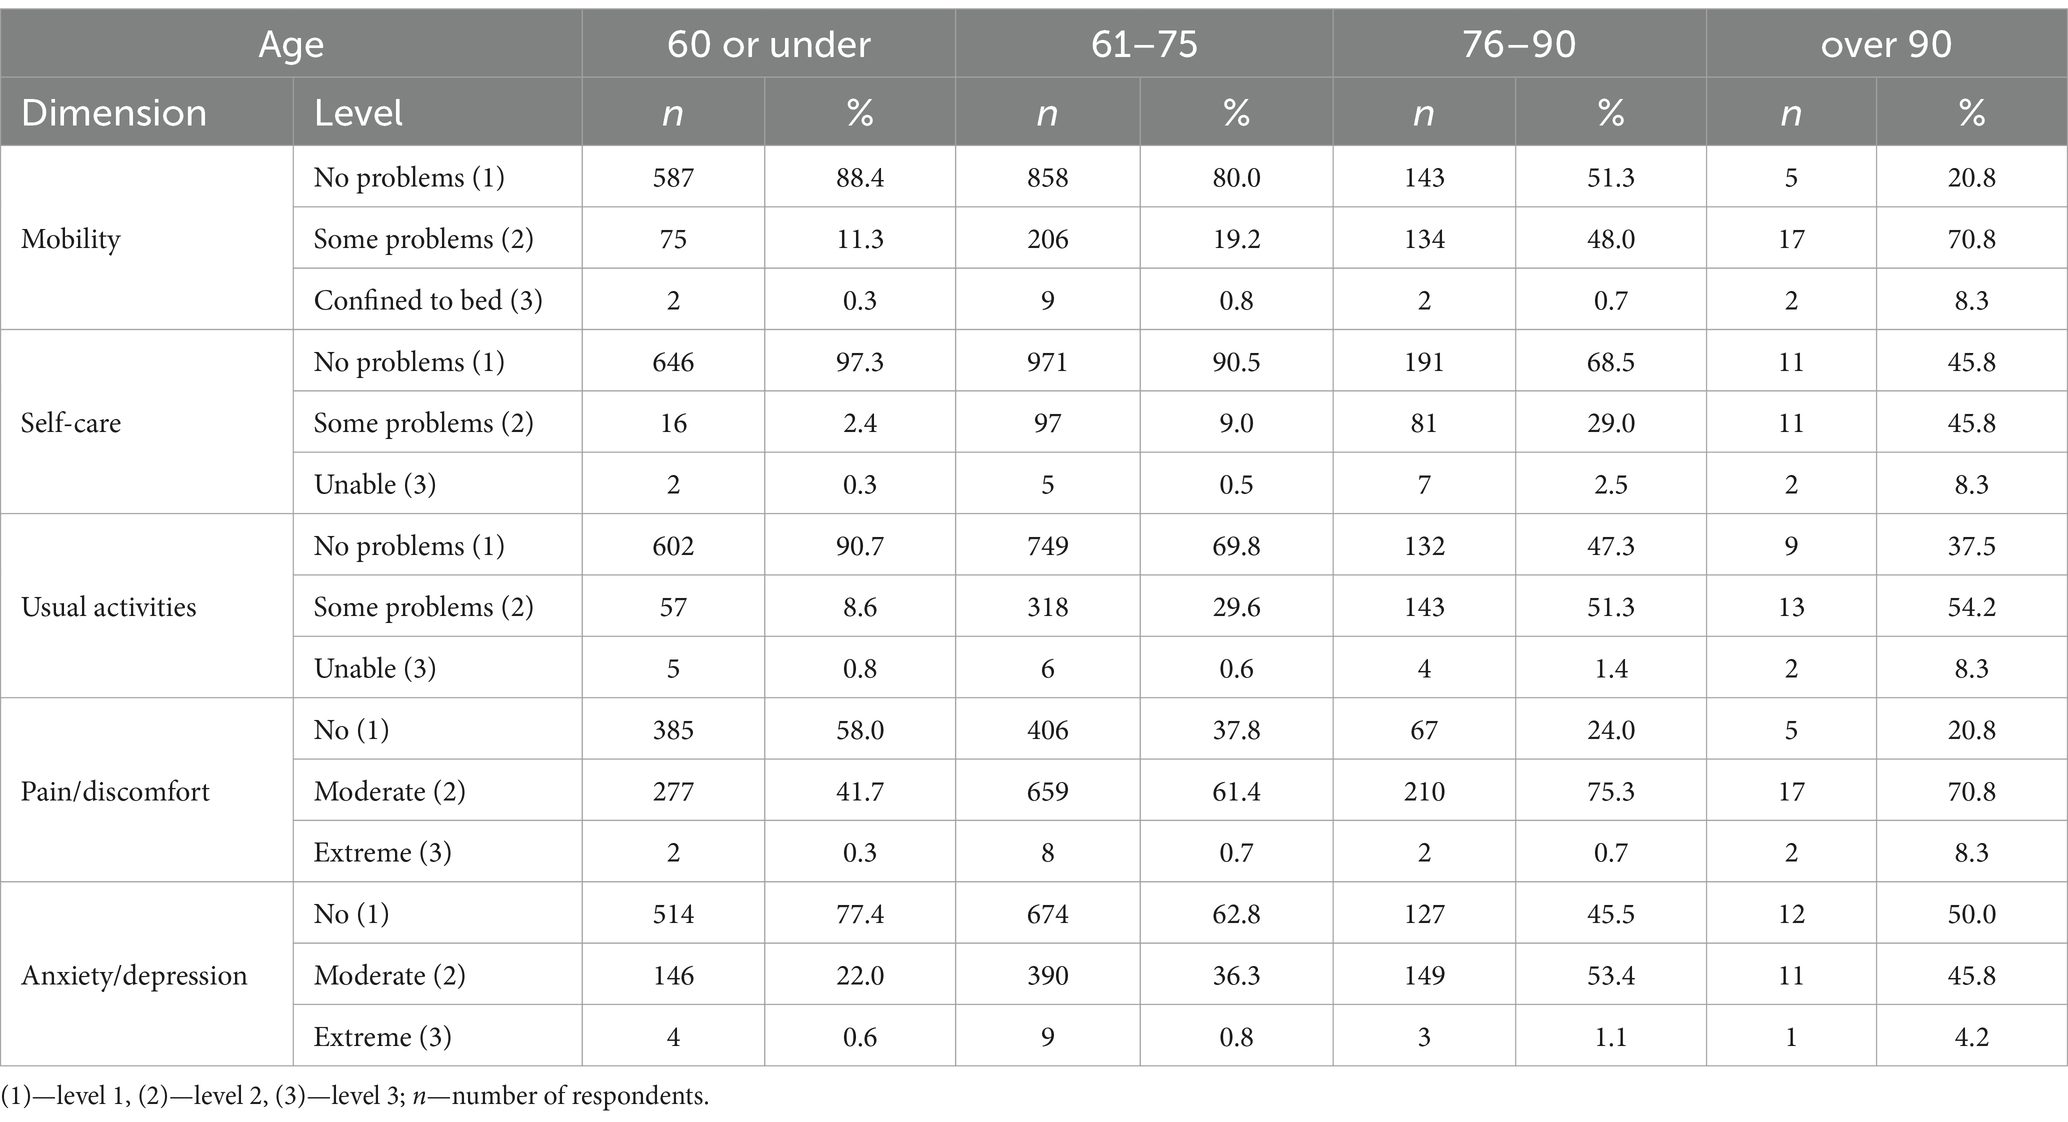
Table 4. EQ-5D-3L dimension results by age group.
In the mobility, self-care, usual activities and pain/discomfort dimensions, the proportion of respondents selecting ‘no problems’ (level 1) decreased with age. A different trend was seen for the anxiety/depression dimension among the oldest age groups. Respondents aged over 90 were more likely (n = 12; 50%) than respondents aged between 76 and 90 (n = 127; 45.5%) to report no problems in this dimension. In the mobility, self-care and usual activities dimensions, the proportion of respondents reporting some problems (level 2) increased with age. A different trend was seen for the pain/discomfort and anxiety/depression dimensions among the oldest age groups—respondents aged over 90 were less likely to report having moderate pain/discomfort (70.8%) and being moderately anxious/depressed (45.8%) than respondents aged between 76 and 90 (75.3 and 53.4% respectively). In all dimensions, respondents aged over 90 were the most likely to select level 3, indicating extreme problems/an inability to perform. Table 5 shows mean index scores by age group.
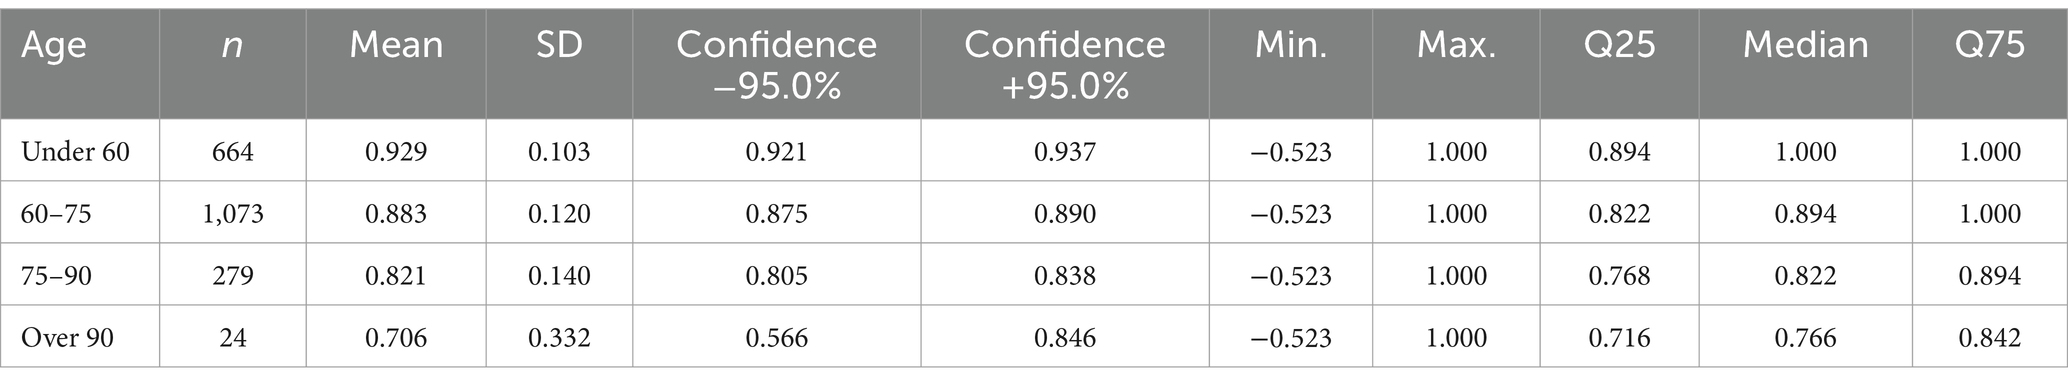
Table 5. Index scores by age group.
The highest mean index scores were reported by respondents aged under 60 (0.929) and those aged between 60 and 75 (0.883), whereas the lowest mean index score was reported by respondents aged over 90 (0.706). Table 6 shows the correlation between age and EQ-5D-3L dimension results and the index score.
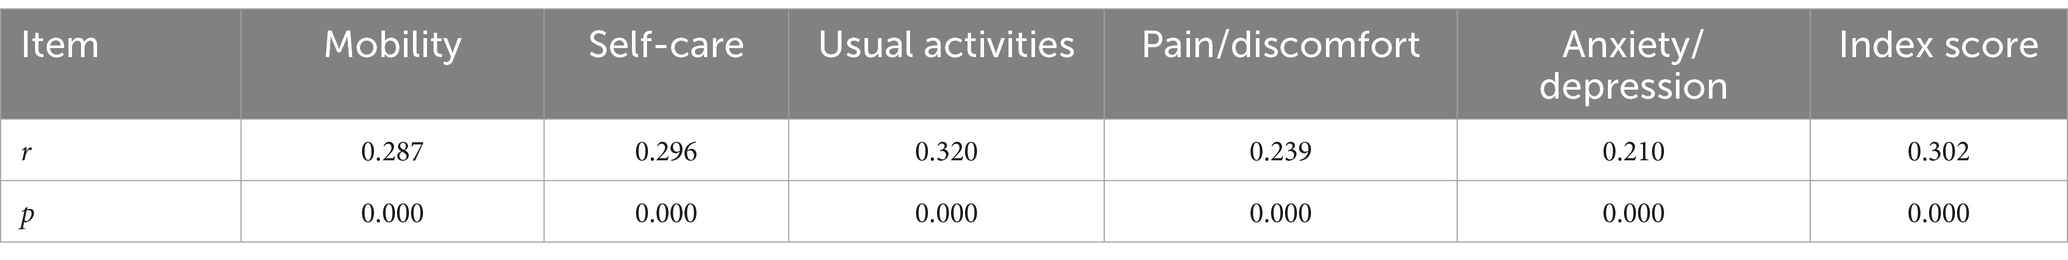
Table 6. Correlation between age and EQ-5D-3L results.
A statistically significant, moderate correlation was found between age and the usual activities dimension score and The index score. There was also a statistically significant, small correlation between age and the mobility, self-care, pain/discomfort and anxiety/depression dimensions. Of the respondents, 8.6% (n = 175) had primary education, 27.8% (n = 567) had basic vocational education and 23.8% (n = 486) had tertiary education. The largest proportion of respondents (n = 812; 39.8%) had secondary/post-secondary education. Table 7 shows EQ-5D-3L dimension results by education level.
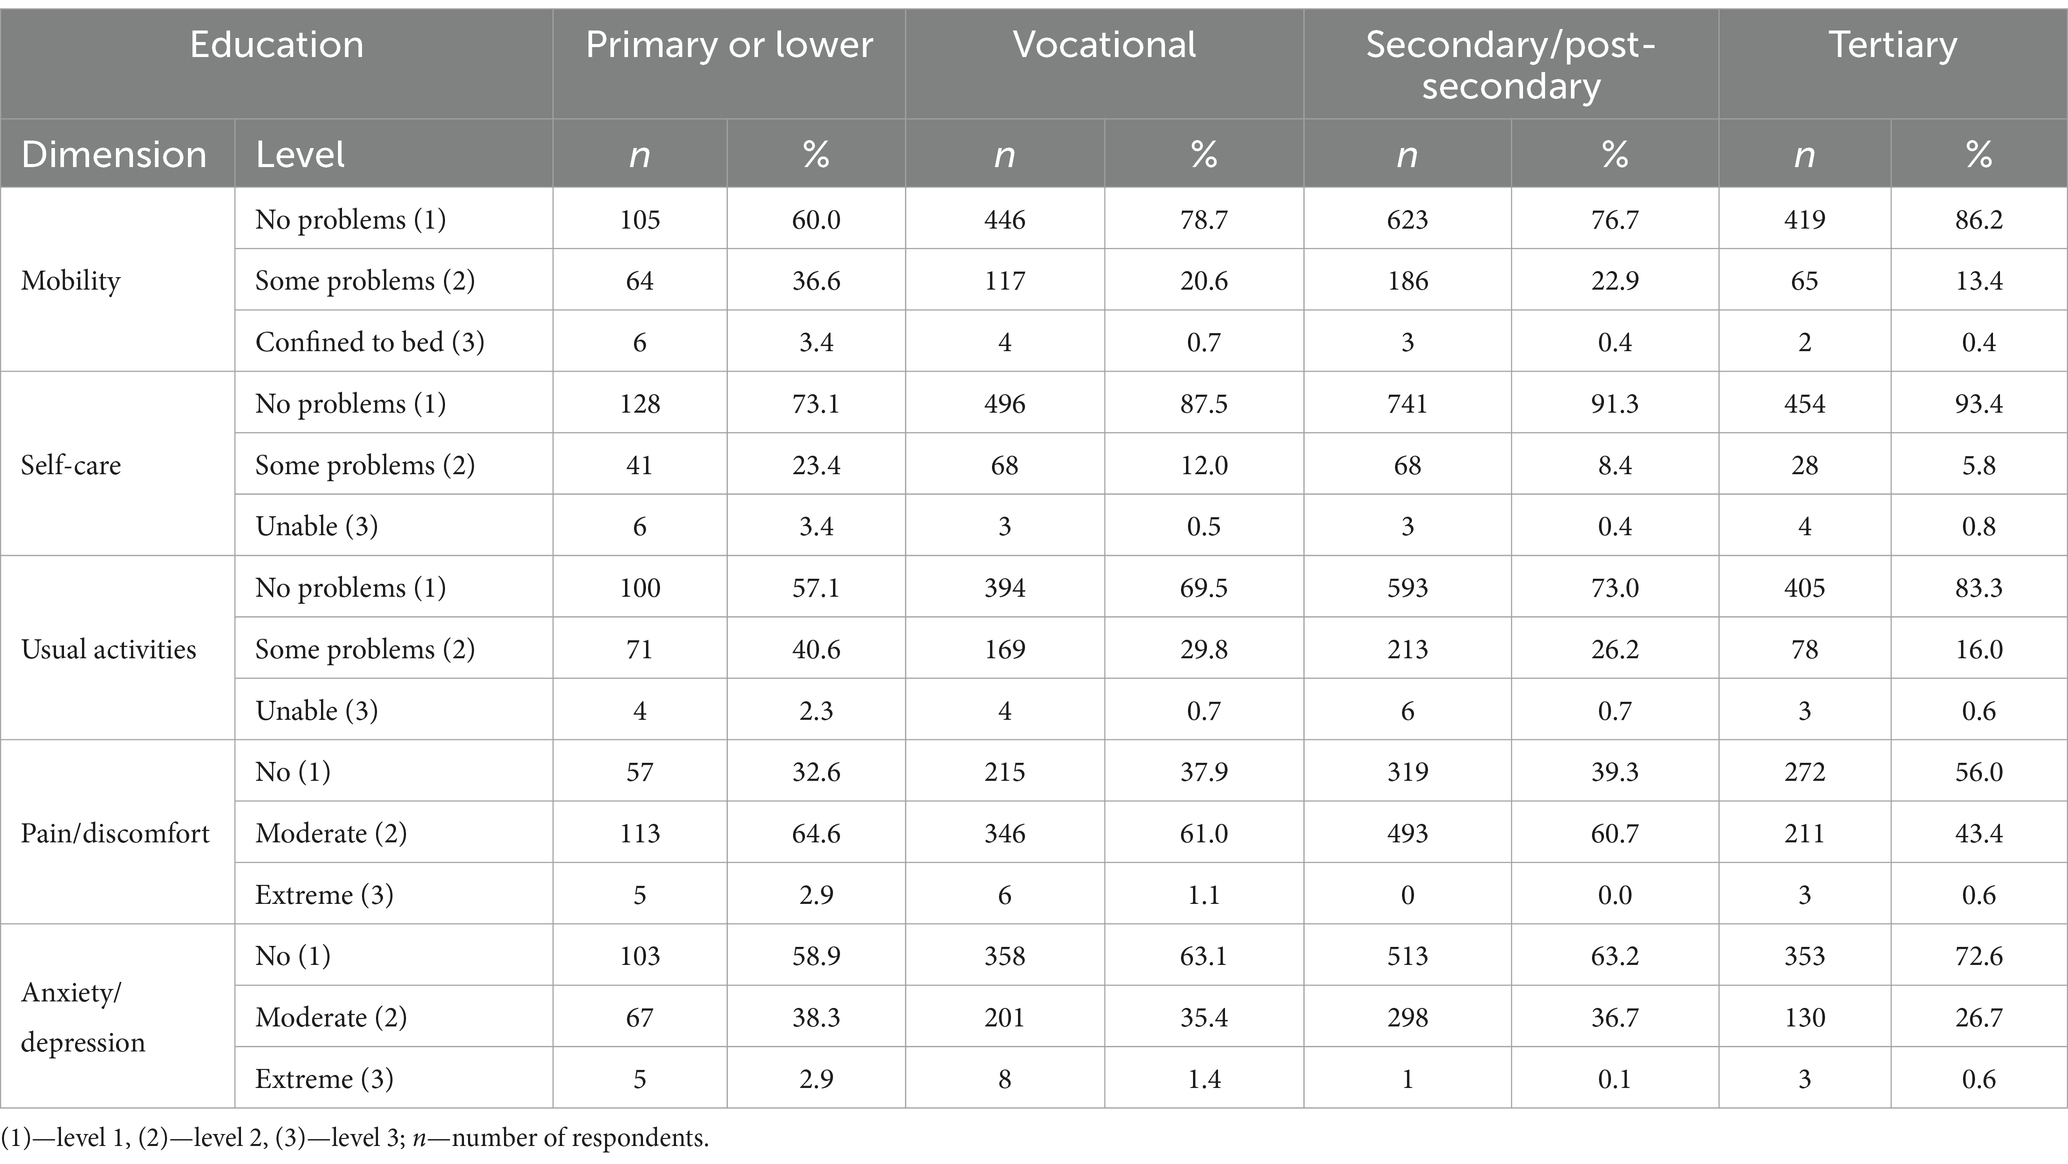
Table 7. EQ-5D-3L dimensions by education level.
The vast majority of respondents across all education levels reported no problems (level 1) in the mobility, self-care, usual activities and anxiety/depression dimensions. However, most respondents across most education levels reported having moderate pain/discomfort (level 2). The exception were respondents with tertiary education. More than half of them (n = 272; 56%) reported no pain or discomfort (level 1).
In all dimensions, respondents with primary or lower education were the most likely to select level 2, indicating some problems, or level 3, indicating extreme problems/inability to perform. Table 8 shows mean index scores by education level.
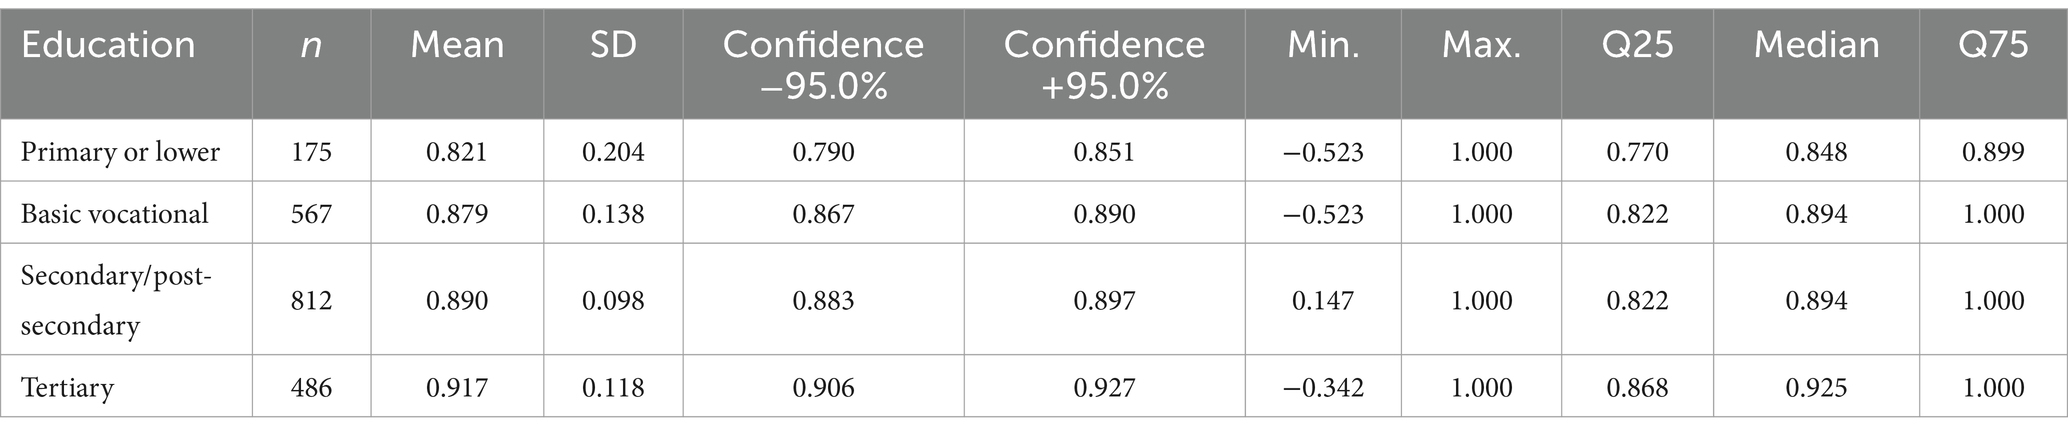
Table 8. Index scores by education level.
The highest mean index scores were reported by respondents with tertiary education (0.917) and those with secondary/post-secondary education (0.8903) and the lowest mean index score was reported by respondents with primary or lower education (0.821). Table 9 shows the correlation between education and EQ-5D-3L dimension scores and the index score.
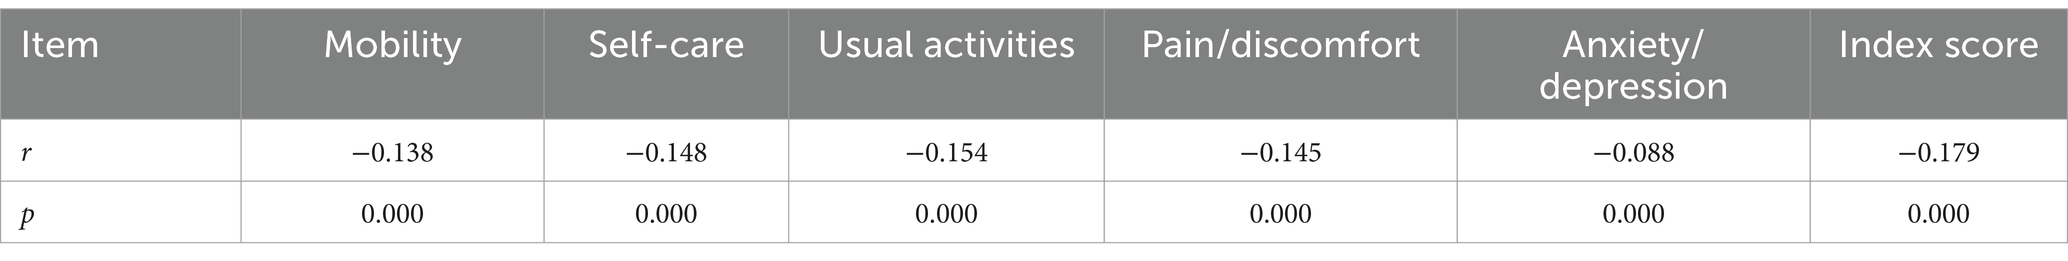
Table 9. Correlation between education and EQ-5D-3L results.
A statistically significant, small correlation was found between education and scores for the mobility, self-care, usual activities and pain/discomfort dimensions and the index score. A statistically significant, very small correlation was found for scores for the anxiety/depression dimension.
4 Discussion
4.1 Dimensions of quality of life in pre-older and older adults
Demographic ageing, which is also common to populations across Poland, carries a number of implications which have an impact on QoL. The systematic rise in the proportion of older people in the population, falls in fertility rates, growth in life expectancy and the “double ageing” of the population pose major challenges for social policies and health systems in terms of satisfying the needs of senior citizens (20, 34). However, today’s older adult individuals in Poland live the life of old age in a new way. Their lifestyle is changing with regard to three aspects, namely education, consumption and activity. They are increasingly educated, have digital skills and communicate electronically. They often use cultural, recreational, tourist and educational services. Moreover, they have social networks other than their family and neighbours and take part in social, active citizenship and voluntary activities (20). Thus, they engage in healthy, successful and active ageing. Healthy ageing, successful ageing and active ageing are new concepts which have changed perceptions of QoL in older people (20, 35).
Based on its definition of QoL, the WHO identified the following six basic domains of this concept: physical domain, psychological domain, level of independence, social relationships, environment and spirituality (beliefs, religion) (5, 36). According to the Polish Agency for Health Technology Assessment and Tariff System, the EQ-5D (EQ-5D-3L or EQ-5D-5L) questionnaire is the preferred instrument for measuring QoL in adults due to its common use, which favours the comparability of results (27). The vast majority of male and female respondents in the present study reported no problems in most EQ-5D-3L dimensions. However, most respondents reported having moderate pain or discomfort. The proportion of respondents reporting extreme problems was highest for the self-care, usual activities and anxiety/depression dimensions and lowest for mobility and pain/discomfort. The proportion of female respondents reporting no problems was highest for the self-care and usual activities dimensions, whereas the proportion of female respondents reporting extreme problems was highest for the anxiety/depression dimension and lowest for mobility. Most male respondents reported no problems with mobility, anxiety/depression and pain/discomfort. The proportion of male respondents reporting extreme problems was highest for usual activities and lowest for anxiety/depression. However, the mean index score indicated a slight difference in scores between male and female respondents. A statistically significant difference between male and female respondents in individual dimension scores was found only for the usual activities dimension. The proportion of respondents reporting no problems decreased with age in most dimensions, except for anxiety/depression. In the mobility, self-care and usual activities dimensions, the proportion of respondents reporting some problems increased with age. Respondents aged over 90 were the most likely to report extreme problems/inability to perform. This was also confirmed by the fact that they had the lowest mean index score. Age was statistically significantly correlated with all individual dimension scores and the index score. The vast majority of respondents across all education levels reported no problems in most EQ-5D-3L dimensions. This did not apply to pain/discomfort, with most participants reporting moderate problems in this dimension, except for respondents with tertiary education, most of whom reported no pain or discomfort. In all dimensions, respondents with primary or lower education were the most likely to report some or extreme problems. They also had the lowest mean index score. Education was statistically significantly correlated with all individual dimension scores and the index score. A pilot study by Golicki et al. carried out in 2008 among adult Poles to elicit the EQ-5D value set for Poland showed that the predominating problems were pain/discomfort (40.1%) and anxiety/depression (37.8%). The study group was least likely to report problems with self-care (3.3%). A total of 16.8% of respondents had problems with mobility and 13.8% with performing usual activities. The respondents in the study tended to be female, employed and in relationships. They also tended to be living in urban areas and have secondary or tertiary education. Their mean age was 42.8 years (37). In a study by Golicki and Niewada carried out in 2014 among adult Poles to derive population norms for the EQ-5D-3L in Poland, the vast majority of respondents reported no problems in any of the dimensions. The respondents tended to be female, employed and have secondary education. They more often lived in urban rather than rural areas and their mean age was 48.3 years. The proportion of participants reporting some problems was highest for pain/discomfort (43.2%) and anxiety/depression (31.9%). Extreme problems were most frequently reported for pain/discomfort (2.6%), anxiety/depression (1.5%) and usual activities (1.7%). EQ-5D-3L index scores were found to significantly decrease with age and were lower in women (38). In a study by Golicki et al. aimed at deriving a Polish utility tariff for EQ-5D-5L health states, the vast majority of respondents reported problems relating to pain/discomfort (53.4%) and anxiety/depression (42.9%). A total of 28.5% of respondents reported problems with mobility and 20.6% had problems with performing usual activities. The smallest proportion of respondents reported problems with self-care (9.9%). The study was carried out among adults, who tended to be female, employed, living in urban areas and have secondary education (39). Another study by Golicki et al. was aimed at estimating a regional EQ-5D-3L population norm for Central and Eastern Europe (citizens of Poland, Hungary and Slovenia). The largest proportions of respondents from these countries reported problems relating to pain/discomfort (42.7%) and anxiety/depression (33.0%). The smallest proportion of respondents reported problems with self-care (7.4%). Problems with mobility and usual activities were reported by 17.3 and 22.2% of respondents, respectively. In all five EQ-5D-3L dimensions, problems were most frequently reported by Slovenian respondents, followed by Poles and Hungarians. Education was found to significantly influence the occurrence of health problems in all EQ-5D-3L dimensions, which were most frequently reported by respondents with the lowest level of education. Index scores differed by sex and age (moderately higher in men) (40). In the PolSenior2 study carried out among older people in Poland using the WHOQOL-AGE scale, among other instruments, 59.9% of respondents rated their QoL as good and only 3.3% rated it as poor or very poor. Most respondents were satisfied with their health (62.4%) and their ability to perform the activities of daily living (77.0%). Male respondents had a slightly higher mean QoL score compared with female respondents. The mean QoL score was highest for the youngest group of respondents (aged 60–65) and lowest for respondents in the oldest age group (85 or over). Respondents living in rural areas reported lower QoL compared to those living in urban areas. QoL was highest in participants with higher education and lowest in those with primary education (20). The results of the VES-13 scale used in the PolSenior2 study showed that almost 40% of respondents aged 60 or over scored 3 points or higher on the scale and were thus deemed to need comprehensive geriatric assessment. Those respondents were significantly more likely to be affected by major geriatric syndromes. Women, respondents with primary or lower education and those living in rural areas had significantly higher VES-13 scores (41). The PolSenior2 study also included an assessment of the functional status of respondents. It was found that the proportion of participants reporting IADL (Instrumental Activities of Daily Living) deficits increased with age, especially among women. Respondents with primary education and those living in rural areas were more likely than other groups to report IADL deficits. It was also found that most respondents had no impairments in activities of daily living (ADL) and that the proportion of respondents with ADL impairments increased with age, especially among women (42). The PolSenior2 study also found that 47.6% of respondents aged 60 or over experienced chronic pain. It was more common in women, respondents with primary education, manual workers and respondents living in rural areas (20). Moreover, the PolSenior2 study found that almost one in four older people in Poland show depressive symptoms and that their prevalence increased with age. According to the study, depressive symptoms are more common in women, people with a low level of education, people in a poor financial situation, residents of rural areas, people who need help from others and people who feel lonely (20). The quality of life of older people is determined by a number of complex factors. A study carried out among older people in older adult homes in Malaysia reported the following QoL determinants: sex, age, education level, financial situation, physical activity and participation in outdoor leisure activities, type of accommodation, comorbidities and social support (35, 42).
4.2 Limitations
The present study has certain limitations. It recruited men and women living in only one town. Therefore, it is difficult to apply its results to the general population of older people, including those living in rural areas. In addition, the majority of the respondents surveyed were women. However, it is important to take into account the feminisation of old age and demographic ageing, which are not only specific to Poland. Nevertheless, these limitations offer a good starting point for further research investigating QoL dimensions in pre-older and older people in relation to sociodemographic variables.
5 Conclusion
The vast majority of respondents across both sexes and all education levels reported no problems in most EQ-5D-3L dimensions, with the exception of the pain/discomfort dimension, where moderate problems were commonly reported. The proportion of respondents reporting no problems decreased with age, particularly in dimensions related to mobility, self-care, and usual activities, highlighting the increased challenges faced by older adults. Additionally, significant gender differences were observed, particularly in the anxiety/depression and usual activities dimensions, suggesting a need for targeted health interventions, especially focused on mental health support for women. Education was another important factor, with higher education levels being associated with better quality of life outcomes across all dimensions. These findings underline the importance of considering sociodemographic variables, such as age, gender, and education, when designing interventions to improve quality of life in older adults. Future research should focus on expanding the scope of the study to include populations from rural areas and other regions of Poland, as well as further investigating the impact of educational interventions on improving quality of life among older adults.
Data availability statement
The raw data supporting the conclusions of this article will be made available by the authors, without undue reservation.
Ethics statement
The studies involving humans were approved by Bioethics Committee of the Mazovian Academy in Płock (statute no. KB/N/BN/P/1.2021). The studies were conducted in accordance with the local legislation and institutional requirements. The participants provided their written informed consent to participate in this study.
Author contributions
MG: Conceptualization, Data curation, Formal analysis, Funding acquisition, Investigation, Methodology, Project administration, Software, Supervision, Validation, Writing – original draft, Writing – review & editing. ZS: Writing – original draft, Writing – review & editing. GD: Writing – original draft, Writing – review & editing. BH: Writing – original draft, Writing – review & editing.
Funding
The author(s) declare that financial support was received for the research, authorship, and/or publication of this article. The research was funded by the Commune of the Town of Płock under the grant titled “Adherence as the responsibility of pre-seniors and seniors in the therapeutic process.”
Acknowledgments
The authors thank all respondents who participated in the study. Language correction of the text was performed using the generative AI tool ChatGPT, based on the GPT-4 model, provided by OpenAI.
Conflict of interest
The authors declare that the research was conducted in the absence of any commercial or financial relationships that could be construed as a potential conflict of interest.
Publisher’s note
All claims expressed in this article are solely those of the authors and do not necessarily represent those of their affiliated organizations, or those of the publisher, the editors and the reviewers. Any product that may be evaluated in this article, or claim that may be made by its manufacturer, is not guaranteed or endorsed by the publisher.
References
1. Rolka, H, Kowalewska, B, and Jankowiak, B. (2017). Jakość a jakość życia w ujęciu historycznym. In: Jakość Życia w Naukach Medycznych i Społecznych. Vol I. Uniwersytet Medyczny w Białystoku. pp. 31–42.
2. Sompolska-Rzechuła, A. Jakość życia jako kategoria ekonomiczna. Folia Pomeranae Univ Technol Stetin Oeconomica. (2013) nr 71:127–40.
3. Uchmanowicz, B, Panaszek, B, Uchmanowicz, I, and Rosińczuk, J. Sociodemographic factors affecting the quality of life of patients with asthma. Patient Prefer Adher. (2016) 10:345–54. doi: 10.2147/PPA.S101898
4. van Leeuwen, KM, van Loon, MS, van Nes, FA, Bosmans, JE, de Vet, HC, Ket, JC, et al. What does quality of life mean to older adults? A thematic synthesis. PloS one. (2019) 14:e0213263. doi: 10.1371/journal.pone.0213263
5. Abuse WHOD of MH and P of S (1997). WHOQOL: measuring quality of life. Published online. Available at: https://iris.who.int/handle/10665/63482 (Accessed April 17, 2024).
6. Bieniek, J, Brończyk-Puzoń, A, and Jagielski, P. Measuring the quality of life of individuals over 60 years of age with unstable coronary artery disease after percutaneous transluminal coronary angioplasty by means of the WHOQOL-BREF questionnaire: preliminary report. Pielęgniarstwo Zdr Publiczne Nurs Public Health. (2017) 7:293–7. doi: 10.17219/pzp/75490
7. Domaradzki, J. (2019). O skrytości zdrowia. O problemach z konceptualizacją pojęcia zdrowie The enigma of health. On the problems with the conceptualization of health. Available at: https://www.academia.edu/28599668/O_skryto%C5%9Bci_zdrowia_O_problemach_z_konceptualizacj%C4%85_poj%C4%99cia_zdrowie_The_enigma_of_health_On_the_problems_with_the_conceptualization_of_health (Accessed March 30, 2024).
8. Orszulak, N, Kubiak, K, Kowal, A, Czapla, M, and Uchmanowicz, I. Nurses’ quality of life and healthy behaviors. Int J Environ Res Public Health. (2022) 19:12927. doi: 10.3390/ijerph191912927
9. Zięba, M, and Cisoń-Apanasewicz, U. (2019). The quality of life in medical sciences. Pielęgniarstwo W Opiece Długoterminowej Long-Term Care Nurs. 2(3). Available at: https://ltcn.eu/Jakosc-zycia-w-naukach-medycznych,150,39215,0,0.html (Accessed March 30, 2024).
10. Dalkey, NC, and Rourke, DL. The Delphi procedure and rating quality of life factors. Qual Life Concept. (1973) 10:209–21.
11. Farquhar, M. Definitions of quality of life: a taxonomy. J Adv Nurs. (1995) 22:502–8. doi: 10.1046/j.1365-2648.1995.22030502.x
12. Trzebiatowski, J. Jakość życia w perspektywie nauk społecznych i medycznych–systematyzacja ujęć definicyjnych. Hygeia Public Health. (2011) 46:25–31.
13. Wnuk, M, Zielonka, D, Purandare, B, Kaniewski, A, Klimberg, A, Ulatowska-Szostak, E, et al. Przegląd koncepcji jakości życia w naukach społecznych. Published online. (2013).
14. Campbell, A. Subjective measures of well-being. Am Psychol. (1976) 31:117–24. doi: 10.1037/0003-066X.31.2.117
15. Post, MWM. Definitions of quality of life: what has happened and how to move on. Top Spinal Cord Inj Rehabil. (2014) 20:167–80. doi: 10.1310/sci2003-167
16. Cieślik, B, and Podbielska, H. (2015). Przegląd wybranych kwestionariuszy oceny jakości życia. Acta Bio-Opt Inform Medica Inż Biomed. Vol. 21 (nr 2). Avaiilable at: http://yadda.icm.edu.pl/baztech/element/bwmeta1.element.baztech-38b67b03-94f7-417b-af2c-2a4fb15fc9ab (Accessed March 30, 2024).
17. WHOQOL-BREF (2013). The World Health Organization. Available at: https://www.who.int/tools/whoqol/whoqol-100 (Accessed March 30, 2024).
18. Pietrzak, AK, Kucnerowicz, K, Cholewiński, W, Martenka, P, and Strzesak, E. Qaly - ocena efektywności klinicznej z użyciem kwestionariusza EQ-5D-3L. Lett Oncol Sci. (2020) 17:16–21. doi: 10.21641/los.2020.17.1.166
19. Power, M, Quinn, K, and Schmidt, SWHOQOL-OLD Group. Development of the WHOQOL-old module. Qual Life Res Int J Qual Life Asp Treat Care Rehab. (2005) 14:2197–214. doi: 10.1007/s11136-005-7380-9
20. Błędowski, P, Grodzicki, T, Mossakowska, M, and Zdrojewski, T. (2021). PolSenior2. Badanie poszczególnych obszarów stanu zdrowia osób starszych, w tym jakości życia związanej ze zdrowiem. Gdański Uniwersytet Medyczny. Available at: https://depot.ceon.pl/handle/123456789/21118 (Accessed March 30, 2024).
21. Caballero, FF, Miret, M, Power, M, Chatterji, S, Tobiasz-Adamczyk, B, Koskinen, S, et al. Validation of an instrument to evaluate quality of life in the aging population: WHOQOL-AGE. Health Qual Life Outcomes. (2013) 11:177. doi: 10.1186/1477-7525-11-177
22. Summerfield, AQ, and Barton, GR. Sensitivity of EQ-5D-3L, HUI2, HUI3, and SF-6D to changes in speech reception and tinnitus associated with cochlear implantation. Qual Life Res. (2019) 28:1145–54. doi: 10.1007/s11136-018-2070-6
23. van Hout, B, Janssen, MF, Feng, YS, Kohlmann, T, Busschbach, J, Golicki, D, et al. Interim scoring for the EQ-5D-5L: mapping the EQ-5D-5L to EQ-5D-3L value sets. Value Health J Int Soc Pharmacoeconomics Outcomes Res. (2012) 15:708–15. doi: 10.1016/j.jval.2012.02.008
24. Kodeks pracy (2023). Obwieszczenie Marszałka Sejmu Rzeczypospolitej Polskiej z dnia 16 czerwca 2023 r. w sprawie ogłoszenia jednolitego tekstu ustawy - Kodeks pracy. Available at: https://isap.sejm.gov.pl/isap.nsf/DocDetails.xsp?id=WDU20230001465 (Accessed August 19, 2024).
25. EuroQol (2019). EuroQol, helping the world make better health decisions. Available at: https://euroqol.org/ (Accessed March 30, 2024).
26. EuroQol (2015). User guides. Available at: https://euroqol.org/information-and-support/documentation/user-guides/ (Accessed March 30, 2024).
28. Petryszyn, P, Kempa, K, Ekk-Cierniakowski, P, Battsengel, R, Trznadel, A, and Więckowska, N. Użyteczności stanów zdrowia EQ-5D oceniane z zastosowaniem metod bezpośrednich przez studentów V roku Farmacji UM we Wrocławiu. Farm Pol. (2015) 3:170–176.
29. Kocot, E. Jak mierzymy zdrowie? Zarys historii i metody pomiaru. Zdr Publiczne Zarządzanie. (2016) 2015:304–15. doi: 10.4467/20842627OZ.15.032.5459
30. Ciećko, W, Bandurska, E, Zarzeczna-Baran, M, and Siemińska, A. Analysis of the quality of life of patients in the advanced phase of chronic diseases. Palliat Med Pract. (2017) 11:84–90.
31. Dudzińska, M, Tarach, JS, Zwolak, A, Malicka, J, Kowalczyk, M, and Daniluk, J. Quality of Life of patients with type z diabetes in relation to method of treatment. Health Probl Civiliz. (2016) 4:26–31. doi: 10.5114/hpc.2015.57698
32. Grabowska-Fudala, B, Jaracz, K, Górna, K, Jaracz, J, and Kaźmierski, R. Clinical recovery and health-related quality of life in ischaemic stroke survivors receiving thrombolytic treatment: a 1-year follow-up study. J Thromb Thrombolysis. (2017) 43:91–7. doi: 10.1007/s11239-016-1419-3
33. Janssen, MF, Pickard, AS, Golicki, D, Gudex, C, Niewada, M, Scalone, L, et al. Measurement properties of the EQ-5D-5L compared to the EQ-5D-3L across eight patient groups: a multi-country study. Qual Life Res Int J Qual Life Asp Treat Care Rehab. (2013) 22:1717–27. doi: 10.1007/s11136-012-0322-4
34. Łobodzińska, A. Starzejące się społeczeństwo wyzwaniem dla zrównoważonego rozwoju. Pr Geogr. (2016) 2016:127–42. doi: 10.4467/20833113PG.16.007.5132
35. Grodzicki, T, Tobiasz-Adamczyk, B, Wizner, B, and Pac, A. (2021). Healthy Ageing-Częstość i Determinanty. Available at: https://ruj.uj.edu.pl/xmlui/handle/item/291429 (Accessed April 17, 2024).
36. Babicz-Zielińska, E, Bartkowicz, J, and Tańska, M. Jakość życia osób starszych i jej determinanty. Żywność Nauka Technol Jakość. (2021) 126:51–67. doi: 10.15193/zntj/2021/126/368
37. Golicki, D, Jakubczyk, M, Niewada, M, Wrona, W, and Busschbach, JJV. Valuation of EQ-5D health states in Poland: first TTO-based social value set in central and Eastern Europe. Value Health J Int Soc Pharmacoeconomics Outcomes Res. (2010) 13:289–97. doi: 10.1111/j.1524-4733.2009.00596.x
38. Golicki, D, and Niewada, M. General population reference values for 3-level EQ-5D (EQ-5D-3L) questionnaire in Poland. Pol Arch Med Wewn. (2015) 125:18–26. doi: 10.20452/pamw.2638
39. Golicki, D, Jakubczyk, M, Graczyk, K, and Niewada, M. Valuation of EQ-5D-5L health states in Poland: the first EQ-VT-based study in central and Eastern Europe. PharmacoEconomics. (2019) 37:1165–76. doi: 10.1007/s40273-019-00811-7
40. Zrubka, Z, Golicki, D, Prevolnik-Rupel, V, Baji, P, Rencz, F, Brodszky, V, et al. Towards a central-eastern European EQ-5D-3L population norm: comparing data from Hungarian, polish and Slovenian population studies. Eur J Health Econ. (2019) 20:141–54. doi: 10.1007/s10198-019-01071-0
41. Kujawska-Danecka, H, Mossakowska, M, Gryglewska, B, et al. (2021). Identyfikacja Osób Do Całościowej Oceny Geriatrycznej (Wyniki Skali VES-13). Gdańsk: Gdański Uniwersytet Medyczny. Available at: https://ruj.uj.edu.pl/xmlui/handle/item/291427 (Accessed March 30, 2024).
42. Wizner, B, Kujawska-Danecka, H, Hajduk, A, Wierzba, K, Jagiełło, K, and Wieczorowska-Tobis, K. (2021). Ocena Stanu Funkcjonalnego. Gdańsk: Gdański Uniwersytet Medyczny. Available at: https://ruj.uj.edu.pl/xmlui/handle/item/298216 (Accessed March 30, 2024).
Keywords: quality of life, HRQoL, older adults, pre-older adults, aging population, EQ-5D-3L
Citation: Głowacka M, Sienkiewicz Z, Dykowska G and Haor B (2024) Dimensions of quality of life of older adults in relation to selected sociodemographic variables—a prospective cohort study. Front. Public Health. 12:1419008. doi: 10.3389/fpubh.2024.1419008
Edited by:
Francesco Panza, University of Bari Aldo Moro, ItalyReviewed by:
Angela M. Goins, University of Houston–Downtown, United StatesSlavica Arsova Hadji Angjelkovska, PHI University Psychiatric Clinic - Skopje, North Macedonia
Copyright © 2024 Głowacka, Sienkiewicz, Dykowska and Haor. This is an open-access article distributed under the terms of the Creative Commons Attribution License (CC BY). The use, distribution or reproduction in other forums is permitted, provided the original author(s) and the copyright owner(s) are credited and that the original publication in this journal is cited, in accordance with accepted academic practice. No use, distribution or reproduction is permitted which does not comply with these terms.
*Correspondence: Mariola Głowacka, bS5nbG93YWNrYUBtYXpvd2llY2thLmVkdS5wbA==