 Qing Han1,2
 Ghislain Rutayisire2
 Maxime Descartes Mbogning Fonkou1,2Wisdom Stallone Avusuglo1Ali Ahmadi3
 Ali Asgary1,4James Orbinski1,5
 Jianhong Wu1,2
 Jude Dzevela Kong1,2,6,7,8*
- 1Africa-Canada Artificial Intelligence and Data Innovation Consortium (ACADIC), Toronto, ON, Canada
- 2Department of Mathematics and Statistics, York University, Toronto, ON, Canada
- 3Faculty of Computer Engineering, K. N. Toosi University of Technology, Tehran, Iran
- 4Disaster and Emergency Management, School of Administrative Studies, York University, Toronto, ON, Canada
- 5Dahdaleh Institute for Global Health Research, York University, Toronto, ON, Canada
- 6Artificial Intelligence & Mathematical Modeling Lab (AIMM Lab), Dalla Lana School of Public Health, University of Toronto, Toronto, ON, Canada
- 7Department of Mathematics, Bahen Centre for Information Technology, University of Toronto, Toronto, ON, Canada
- 8Global South Artificial Intelligence for Pandemic and Epidemic Preparedness and Response Network (AI4PEP), Toronto, ON, Canada
Background: According to study on the under-estimation of COVID-19 cases in African countries, the average daily case reporting rate was only 5.37% in the initial phase of the outbreak when there was little or no control measures. In this work, we aimed to identify the determinants of the case reporting and classify the African countries using the case reporting rates and the significant determinants.
Methods: We used the COVID-19 daily case reporting rate estimated in the previous paper for 54 African countries as the response variable and 34 variables from demographics, socioeconomic, religion, education, and public health categories as the predictors. We adopted a generalized additive model with cubic spline for continuous predictors and linear relationship for categorical predictors to identify the significant covariates. In addition, we performed Hierarchical Clustering on Principal Components (HCPC) analysis on the reporting rates and significant continuous covariates of all countries.
Results: 21 covariates were identified as significantly associated with COVID-19 case detection: total population, urban population, median age, life expectancy, GDP, democracy index, corruption, voice accountability, social media, internet filtering, air transport, human development index, literacy, Islam population, number of physicians, number of nurses, global health security, malaria incidence, diabetes incidence, lower respiratory and cardiovascular diseases prevalence. HCPC resulted in three major clusters for the 54 African countries: northern, southern and central essentially, with the northern having the best early case detection, followed by the southern and the central.
Conclusion: Overall, northern and southern Africa had better early COVID-19 case identification compared to the central. There are a number of demographics, socioeconomic, public health factors that exhibited significant association with the early case detection.
1 Introduction
The ongoing COVID-19 pandemic, triggered by the SARS-CoV-2 virus (1), has spread globally with noticeable variations in reported cases and deaths across different regions. As of May 5, 2022, the pandemic is affecting more than 220 countries and territories, with over 513 million cases and 6 million deaths worldwide (2). In particular, the spread of the virus and subsequent reporting of cases have shown a slower pace in African nations. Since the identification of the first case in Egypt on February 14, 2020 (3), the growth of new infections within African countries remained relatively modest, with the WHO African region reporting over 8 million cases and 170,000 deaths (4), a stark contrast to the more severe morbidity and mortality rates observed in other world regions (2).
Several factors contribute to the under-estimation and under-reporting of COVID-19 cases in Africa. The presence of asymptomatic infections, capable of transmitting the virus (5, 6), and a tendency of fewer clinical symptoms among the younger demographic (7), potentially lead to a significant under-estimation of the true case count, especially in regions with younger populations like Africa. Moreover, limited testing and public health resources, inadequate public awareness, cultural stigmatization, self-medication practices, and initially unestablished monitoring practices on the continent might have further contributed to the under-reporting of cases (8). Similarly, in some nations, political motives might influence data adjustment, impacting transparency, with certain governments altering their figures to project a particular narrative (8).
The WHO estimates that only one in seven cases was being detected in Africa (8), highlighting a substantial gap in data accuracy and completeness. Our previous investigation into the early phase of the COVID-19 outbreak across 54 African nations also revealed a significant under-reporting trend (9). Specifically, an average of only about 5.37% of all COVID-19 cases was duly reported. Strikingly, these numbers showed vast differences across nations, with Libya reporting a notably high rate of 30.41%, in contrast to São Tomé and Príncipe’s alarmingly low 0.02% (9).
These preceding observations highlight a pressing need to understand the underlying factors contributing to the reporting of COVID-19 cases in Africa. Our study aimed to explore the determinants influencing COVID-19 case detection and to classify African countries using these determinants. By identifying them, we aimed to provide insights that could be crucial for policymakers, health authorities, and lawmakers in crafting more adept public health strategies, refining resource allocation, and developing a more responsive and transparent system to confront the challenges presented by pandemics.
2 Methods
2.1 COVID-19 case reporting fractions
The fraction of overall COVID-19 cases reported was estimated for 54 African countries using a mathematical deterministic model with a Bayesian inference framework (9). In this study, we used these reporting rates as the response variable in the statistical analysis (Figure 1).
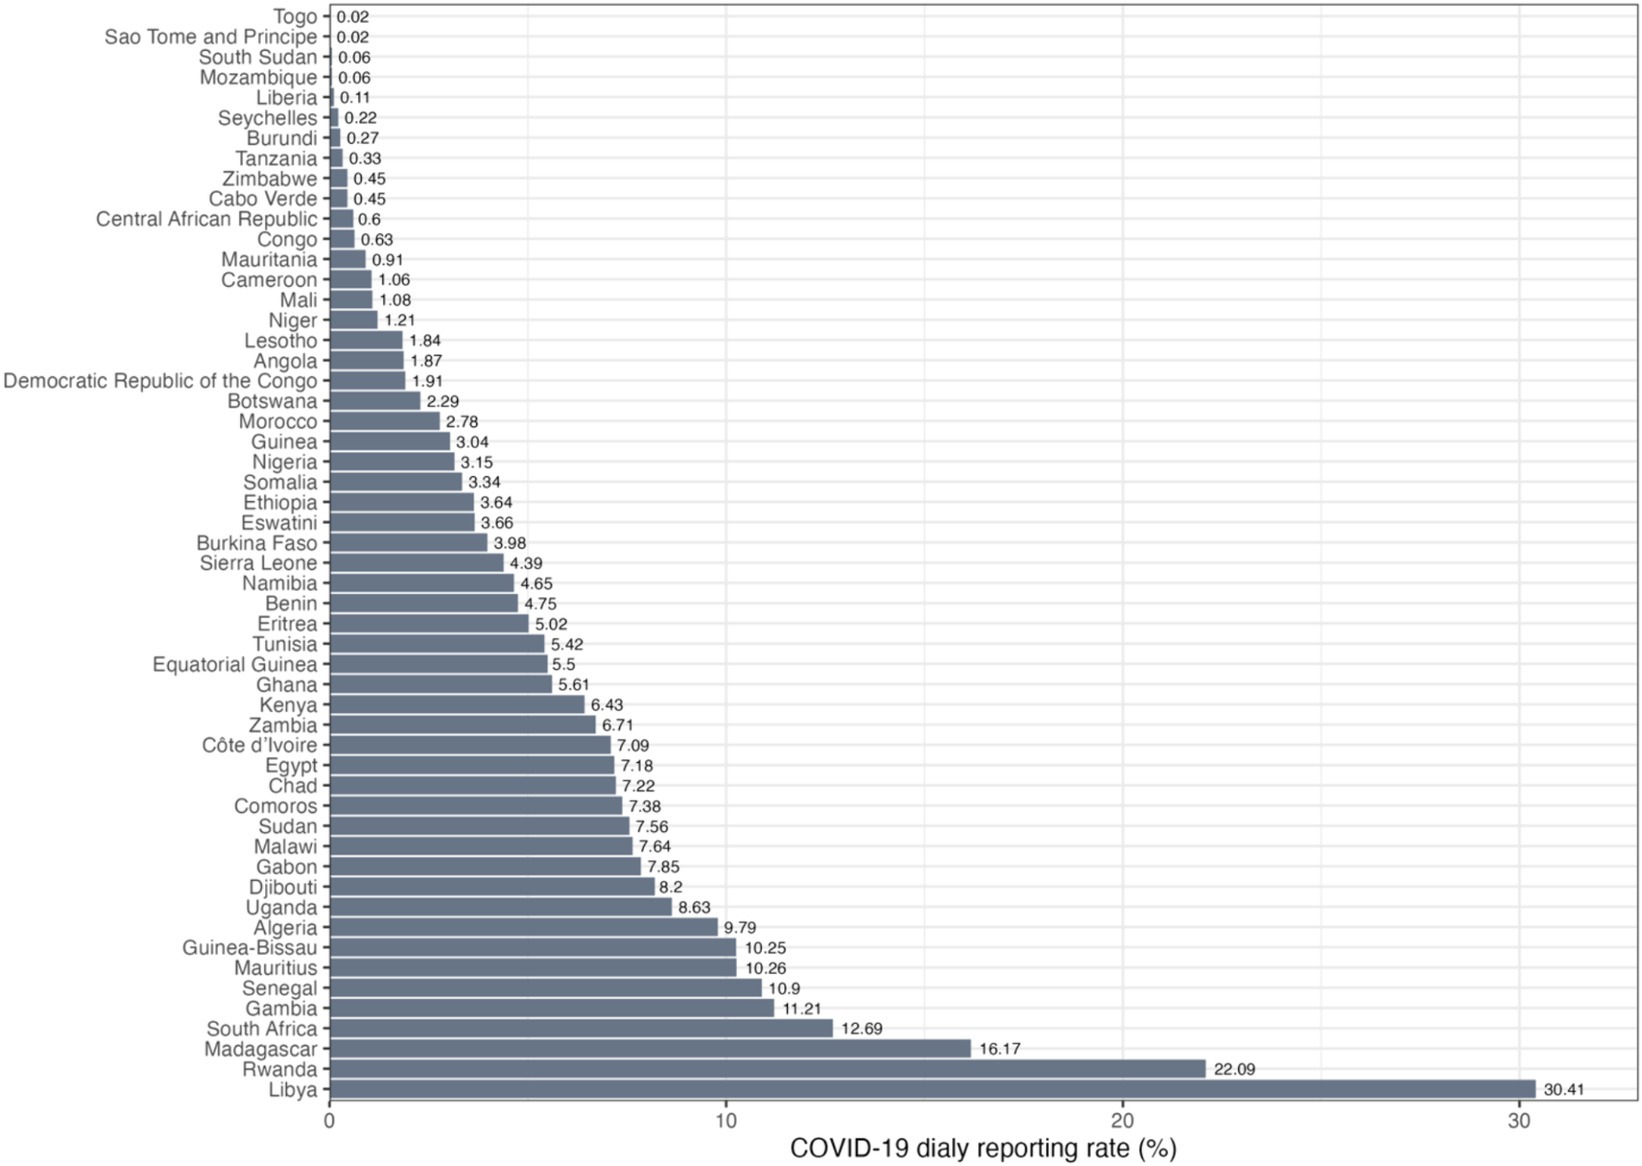
Figure 1. Daily COVID-19 reporting rates in percentage for 54 African countries in ascending order.
2.2 Factors
Our choice of variables was largely informed by past research and insights surrounding the under-reporting of COVID-19 cases in Africa. Factors like the occurrence of asymptomatic infections which are capable of virus transmission (5, 6), and a lower incidence of clinical symptoms among the younger demographic (7), have been pointed out, especially in regions with younger populations like Africa. Additionally, the constraints on testing and public health resources, lack of widespread public awareness, cultural stigma, self-medication practices, and initially unestablished monitoring practices on the continent are believed to have contributed to the under-reporting of cases (8). These considerations mirror challenges faced in other regions; for instance, in Brazil, demographic-related challenges led to misclassification of COVID-19 cases, particularly among younger individuals, those with lower education levels, and rβural residents (10). Such challenges highlighted the significant issue of misidentifying COVID-19 cases as severe acute respiratory infections (SARI). Education has also been pointed out as being critical for Africa’s health outcomes (11). Hence, we included the urban population, population literacy, female percentage, median age, percentage of Christians, and percentage of Muslims for each country to capture key demographic nuances.
Studies suggested variations in reported data due to a nation’s wealth, political climate, and inequalities (12). Notably, authoritarian governments were shown to skew data to appear competent and boost global reputation. Bureaucracies also modify data around elections to align with leadership’s wishes (13). Furthermore, democracy-related indicators, like the democracy index and world press freedom index, suggest countries with lower ranks, such as Turkey, China, Indonesia, and Iran, face greater COVID-19 under-reporting issues (14). To this end, for factors we also examined GINI index, GDP per capita, human development index, democracy index, press freedom index, political stability, government social media censorship, voice given to and accountability for citizens, corruption, ease of doing business, internet filtering, and air passenger volume.
Health-related factors, highlighted for their potential impact on reporting, were inspired from the results of study (15), which states that the number of tests conducted, global health security index, and average body mass index significantly correlated with reported COVID-19 cases per million population. These encompassed the number of nurses, number of physicians, public health expenditure in GDP, public health expenditure in total expenditure, body mass index, prevalence of cardiovascular diseases, prevalence of diabetes, global health security, cancer, prevalence of cholesterol, prevalence of lower respiratory infections, and malaria incidence.
All factors considered in this study are summarized in Table 1.
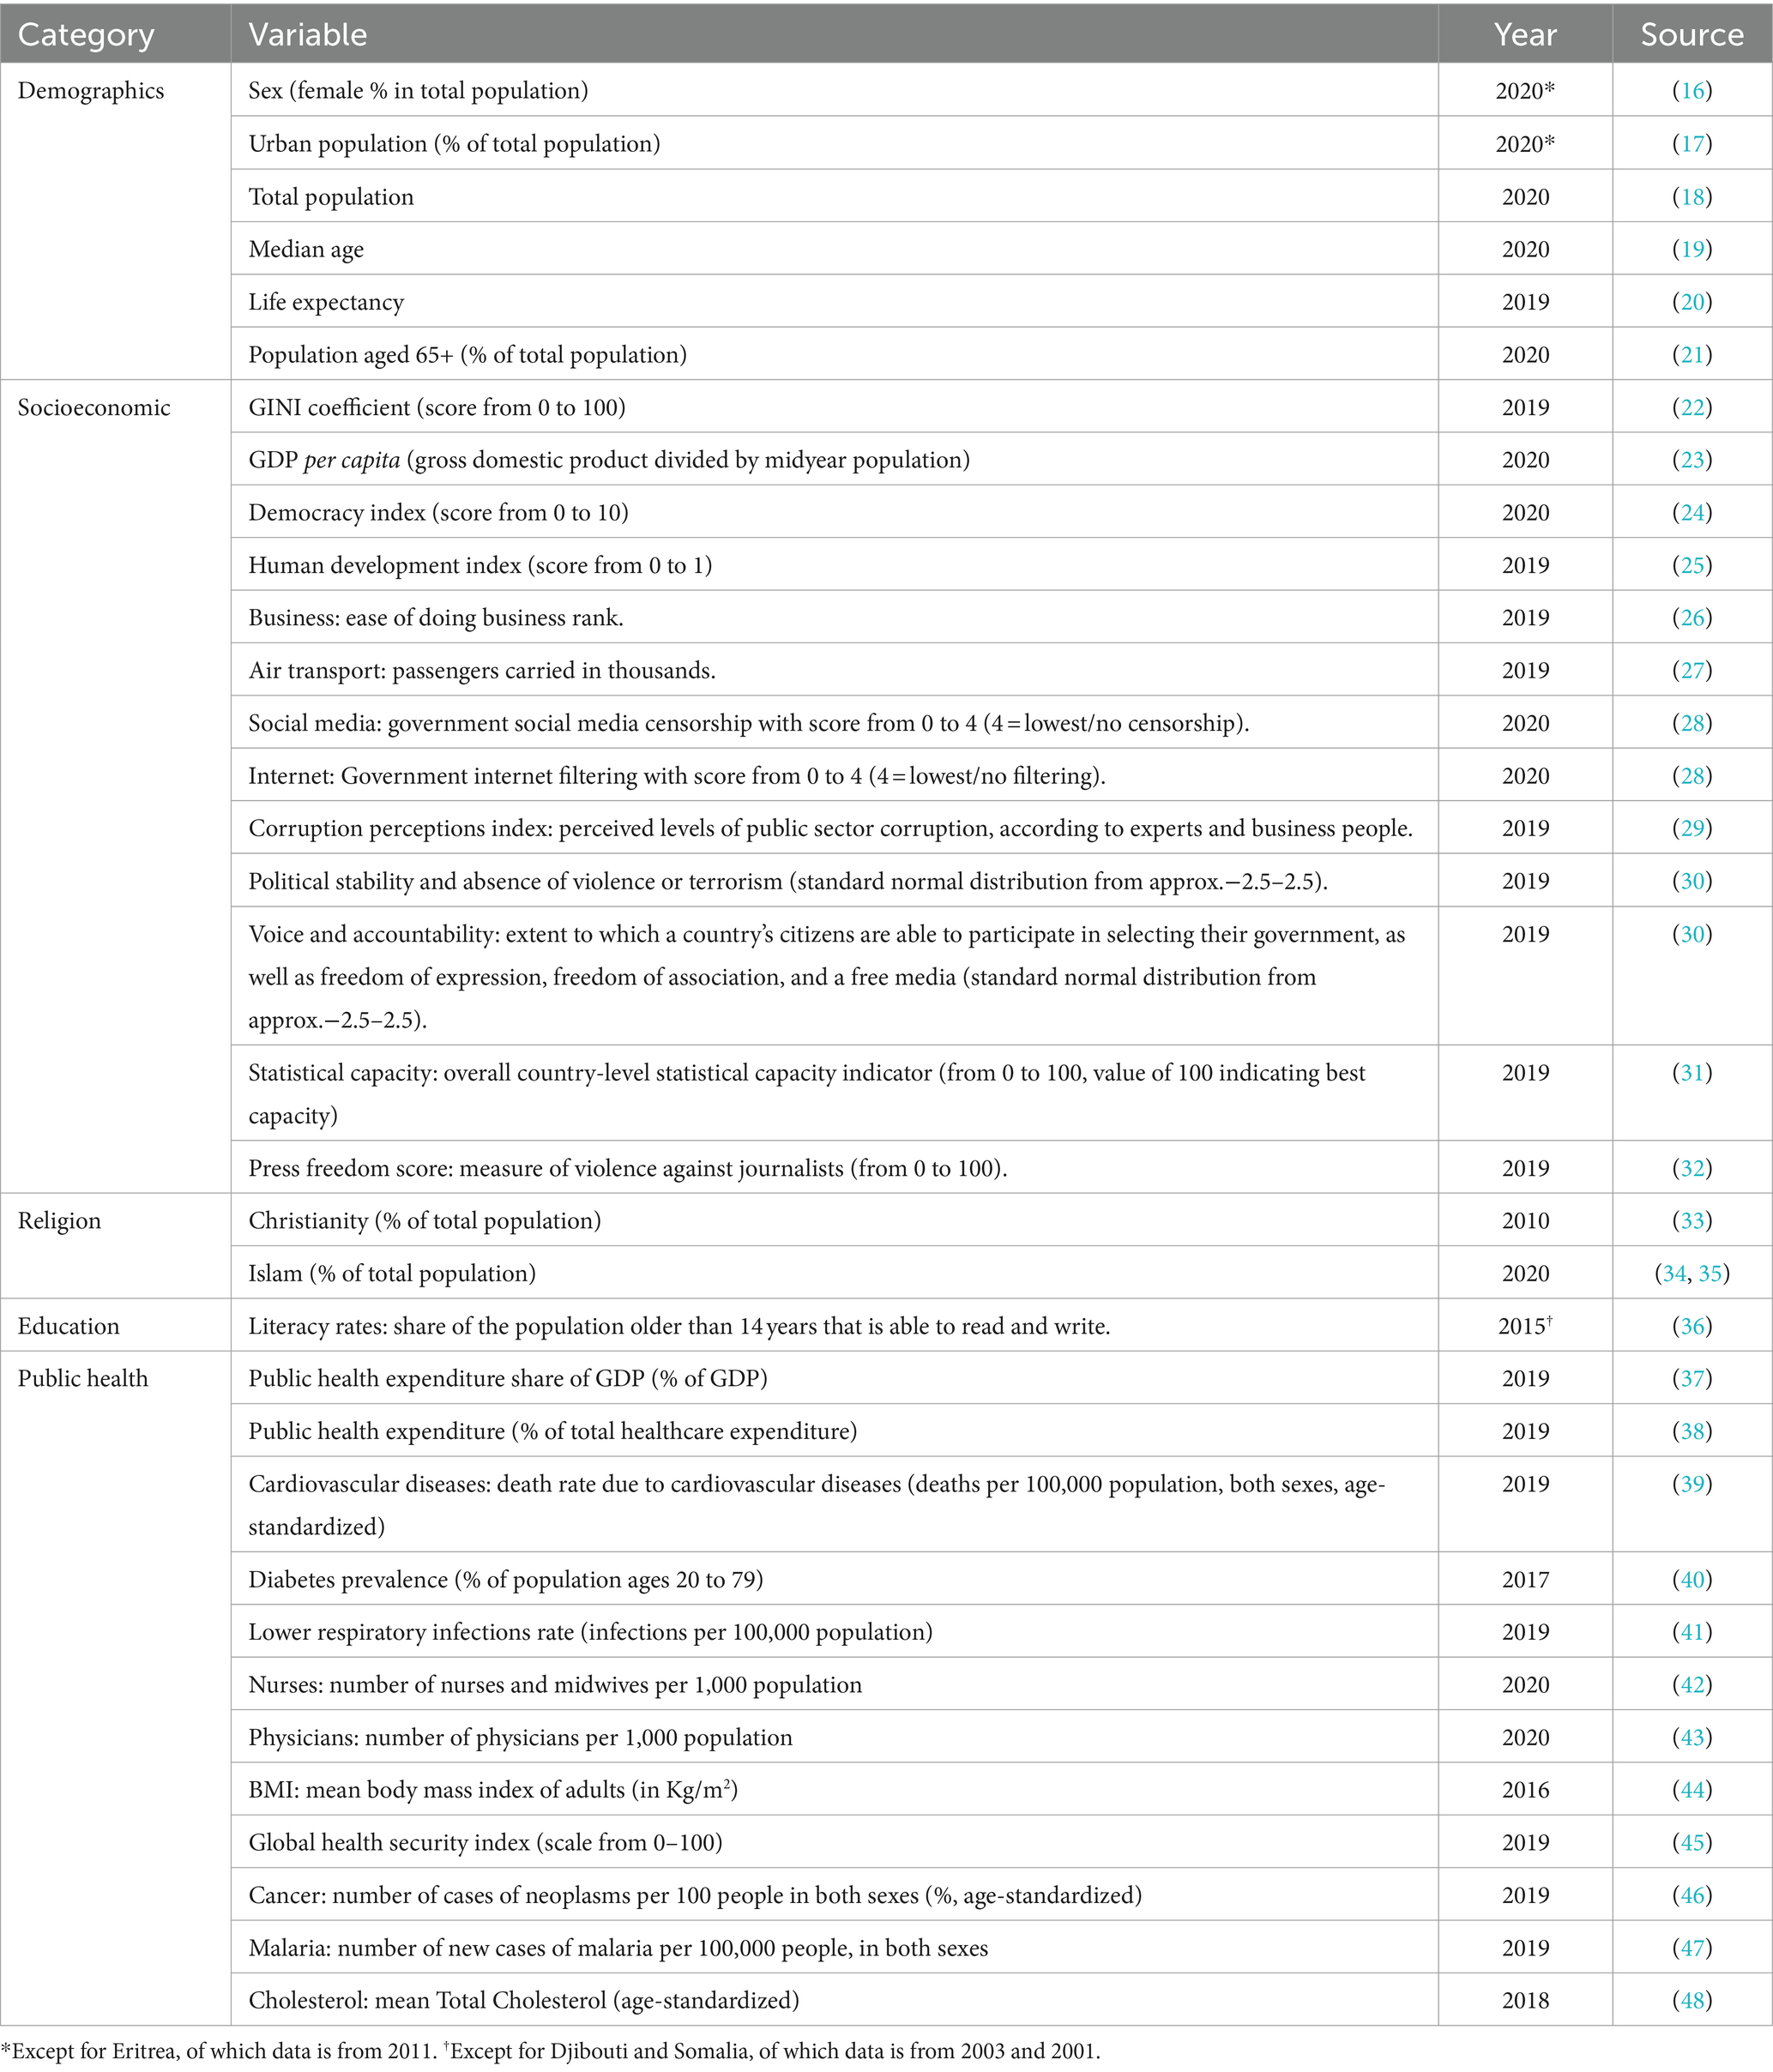
Table 1. List of factors considered with descriptions and sources.
2.3 Statistical analysis
There are five missing values for malaria incidence (Lesotho, Libya, Mauritius, Seychelles, and Tunisia), three for GINI index (Equatorial Guinea, Eritrea, and Libya), two for GDP (Eritrea and South Sudan), and one for air transport (Mali), public health expenditure in GDP (Somalia), public health expenditure in total (Somalia), human development index and press freedom score (São Tomé and Príncipe). These missing values were imputed with mean values of corresponding variables in order to keep the original variable distributions. The numerical variables were then standardized to enable direct effect comparison.
To select the covariates to be used for the generalized additive model (GAM), we identified pairs of covariates that have a Spearman correlation greater than 0.6 or less than−0.6. For one covariate that has Spearman correlation above/below the threshold with more than one other covariates, we checked correlation between them and the response variable: if most other independent variables correlate higher with the dependent variable, this covariate will be dropped. Through this process, 12 factors were identified to be included in the drop list: population aged 65+, literacy, GINI index, press freedom, public health expenditure in GDP, public health expenditure in total, business, number of nurses, BMI, cancer prevalence, internet filtering and Christian population.
We used a GAM for the effects of the covariates on the COVID-19 daily case reporting rates. The general form of the model is
where is the response variable, are the predictors, is identically and independently distributed as a normal random variable, is a monotonous link function and are nonparametric smoothing functions. Here we adopted cubic spline functions for continuous covariates and linear functions for categorical covariates. Compared to the data size, the GAM model has room for three more additional predictors after applying the drop list of aforementioned 12 factors. To get the best GAM, we added one predictor from the drop list at a time back to the GAM and kept the one that yields the largest deviance explained. Three rounds were run and internet filtering, number of nurses and literacy were added back to GAM after each round of selection.
2.4 Hierarchical clustering of principal components analysis
Using the COVID-19 daily reporting rates and the significant continuous factors from the statistical analysis, we clustered the 54 African countries through Hierarchical Clustering of Principal Components Analysis (HCPC) performed by packages “FactoMineR” and “factoextra” in RStudio2023.06.1 + 524. The algorithm is done in two major steps: first it reduces the dimension of the data through principal component analysis (PCA), and second cluster analysis is conducted on the PCA results using the Ward’s criterion which minimizes the total within-cluster variance.
3 Results
The deviance explained for the best GAM model with identity link function is 97.4% (adjusted R-squared: 0.897), indicating a high explanatory power from the model. Among the 34 covariates, the significant factors with -values less than 0.05 are: population, urban population, median age, life expectancy, Islam population, literacy rates, global health security, number of nurses, number of physicians, malaria incidence, diabetes prevalence, lower respiratory infections prevalence, cardiovascular diseases prevalence, GDP, human development index, democracy index, corruption index, voice accountability, air transport, all levels of social media and level two of internet filtering. Their partial effects on the COVID-19 daily case reporting rates are shown in Figure 2. As in Figure 2, life expectancy, Islam population, global health security, number of physicians, malaria, cardiovascular diseases prevalence, GDP and voice accountability are positively correlated with higher COVID-19 reporting, while total population, median age, number of nurses, diabetes prevalence and corruption index are negatively correlated with higher COVID-19 reporting. Intermediate levels of urban population and democracy index correlate with lower reporting rates, while intermediate levels of literary rates, lower respiratory infections prevalence, human development index and air transport correlate with higher reporting rates.
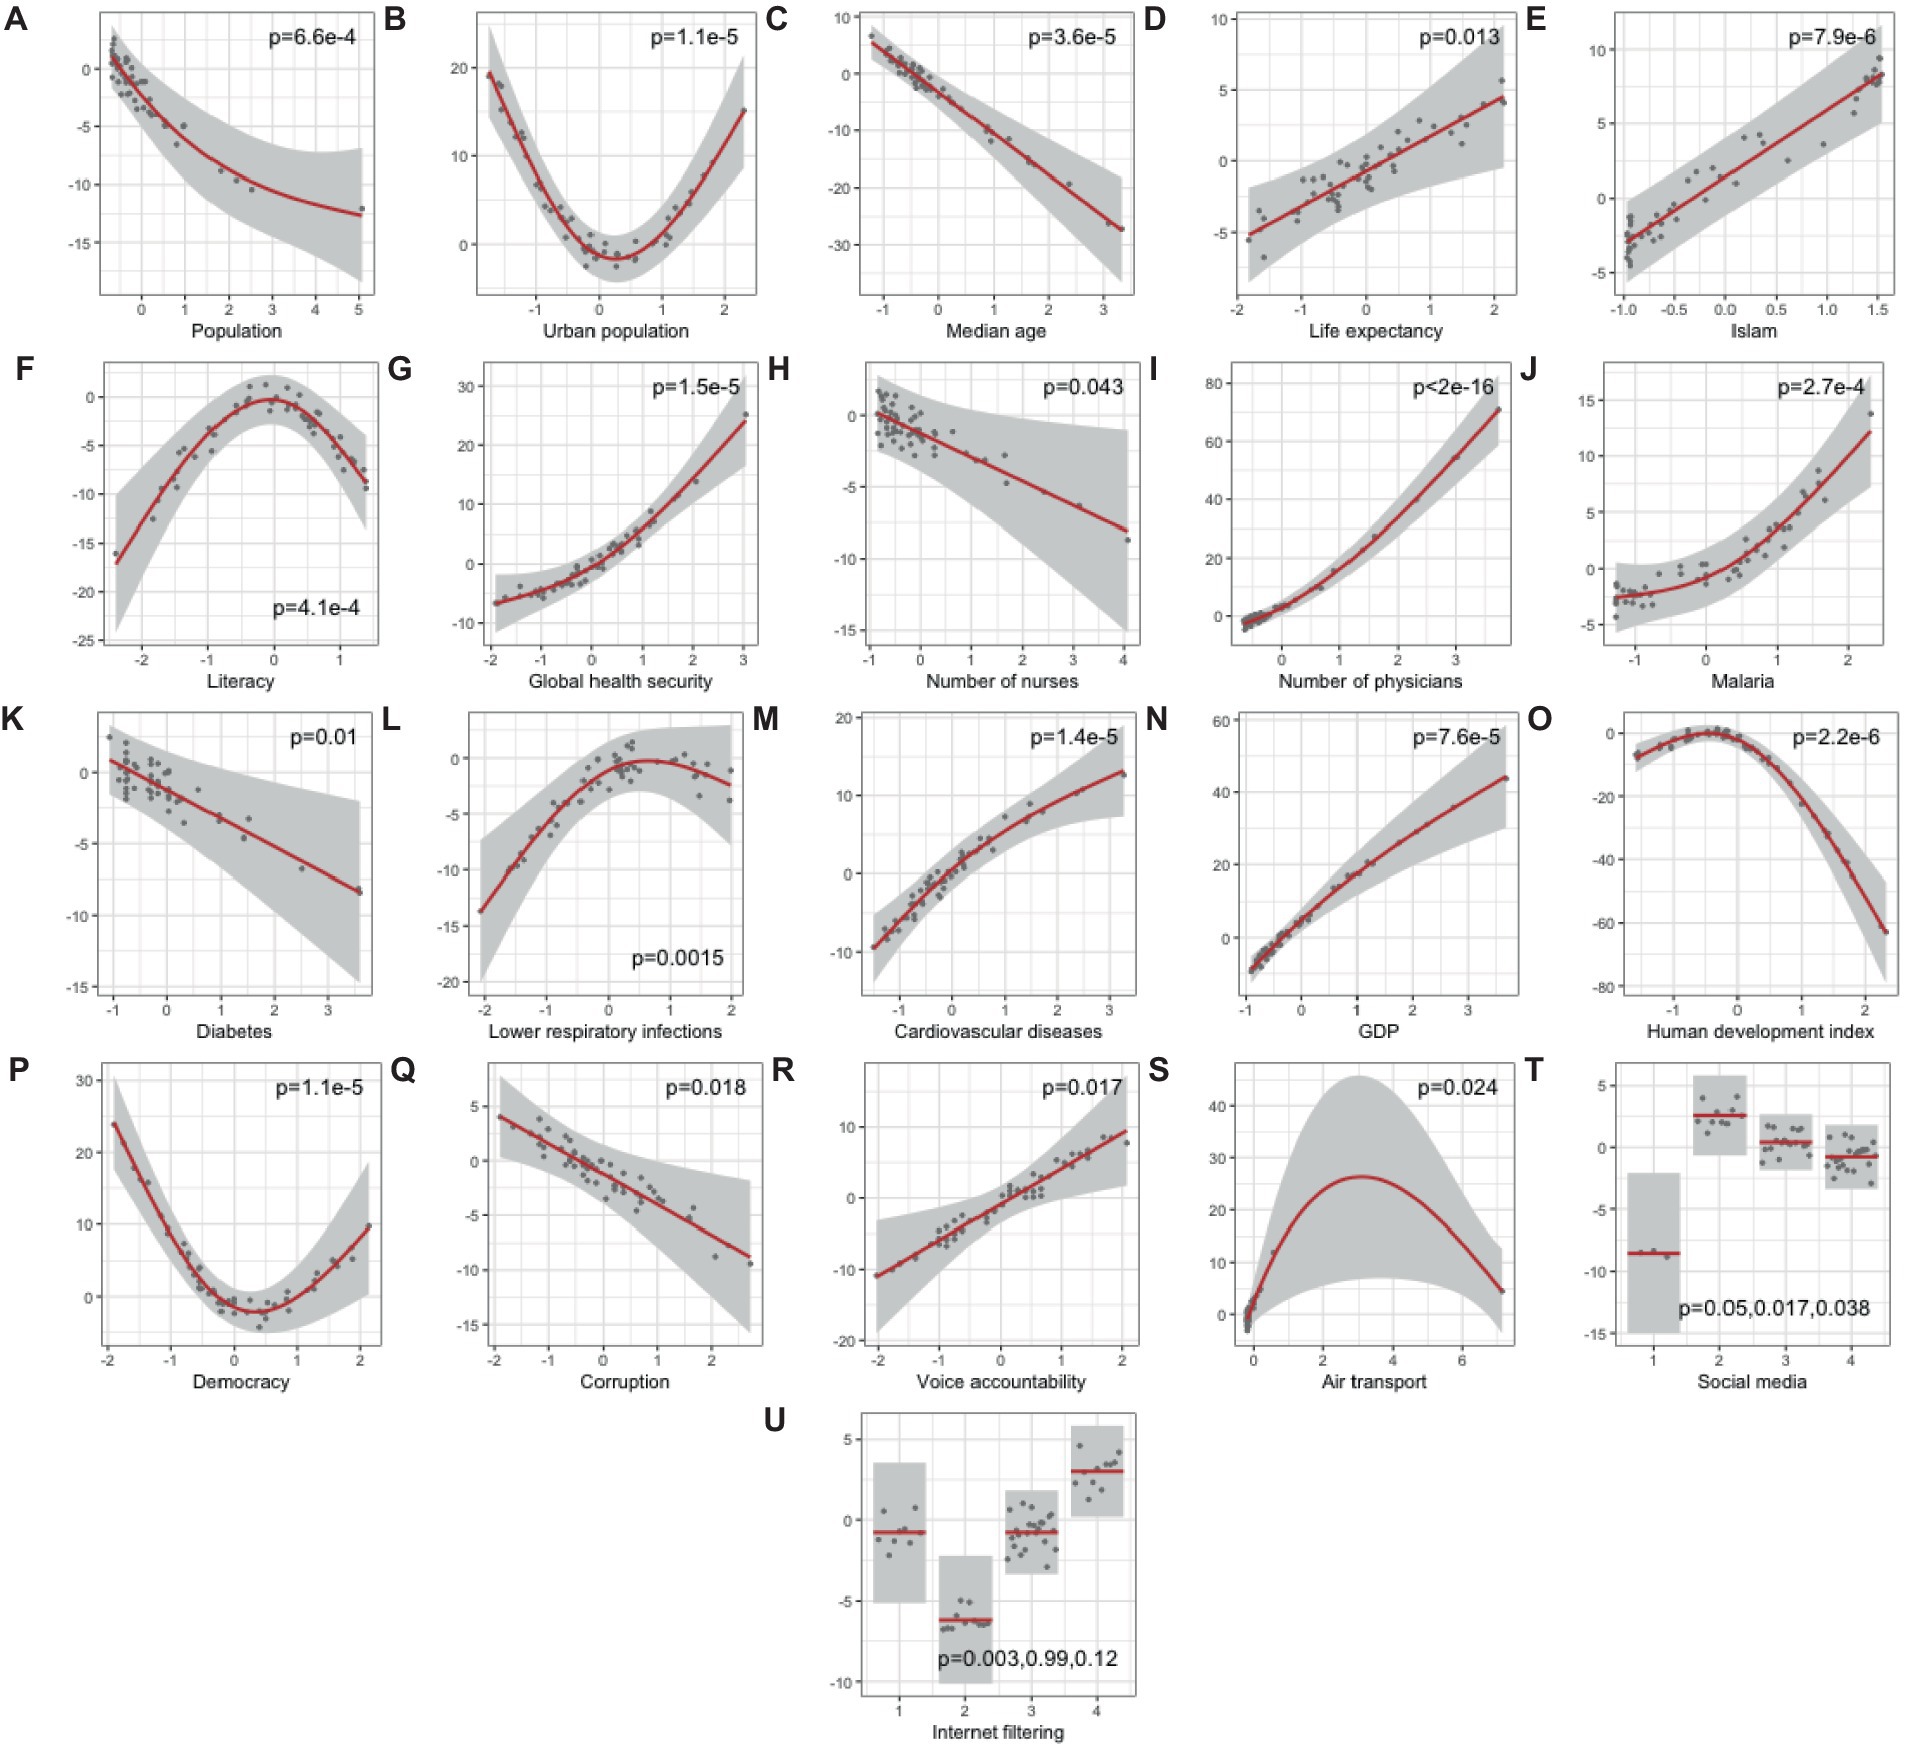
Figure 2. Partial effects of statistically significant predictors (A–U) on COVID-19 daily case reporting rate (%) with p-values from generalized additive model (Deviance explained = 97.4%). p-values<0.05 were considered statistically significant.
HCPC analysis resulted in three major clusters as shown in the dendrogram in Figure 3A, indicated by different colors. The mean Silhouette score for the clustering using the coordinates in the factor map is 0.485. Their geographical locations are shown in Figure 3B with corresponding colors for each resultant cluster. Basically, Cluster 1 (gray) includes the central African region with the largest number of countries. Cluster 2 (red) includes the northern African region with Morocco, Tunisia, Alegria, Libya and Egypt (Gabon as an exception). Cluster 3 (blue) includes essentially the southern African region with Namibia, Botswana, South Africa (Ghana as an exception), plus Mauritius, Seychelles, Cabo Verde and São Tomé and Príncipe.
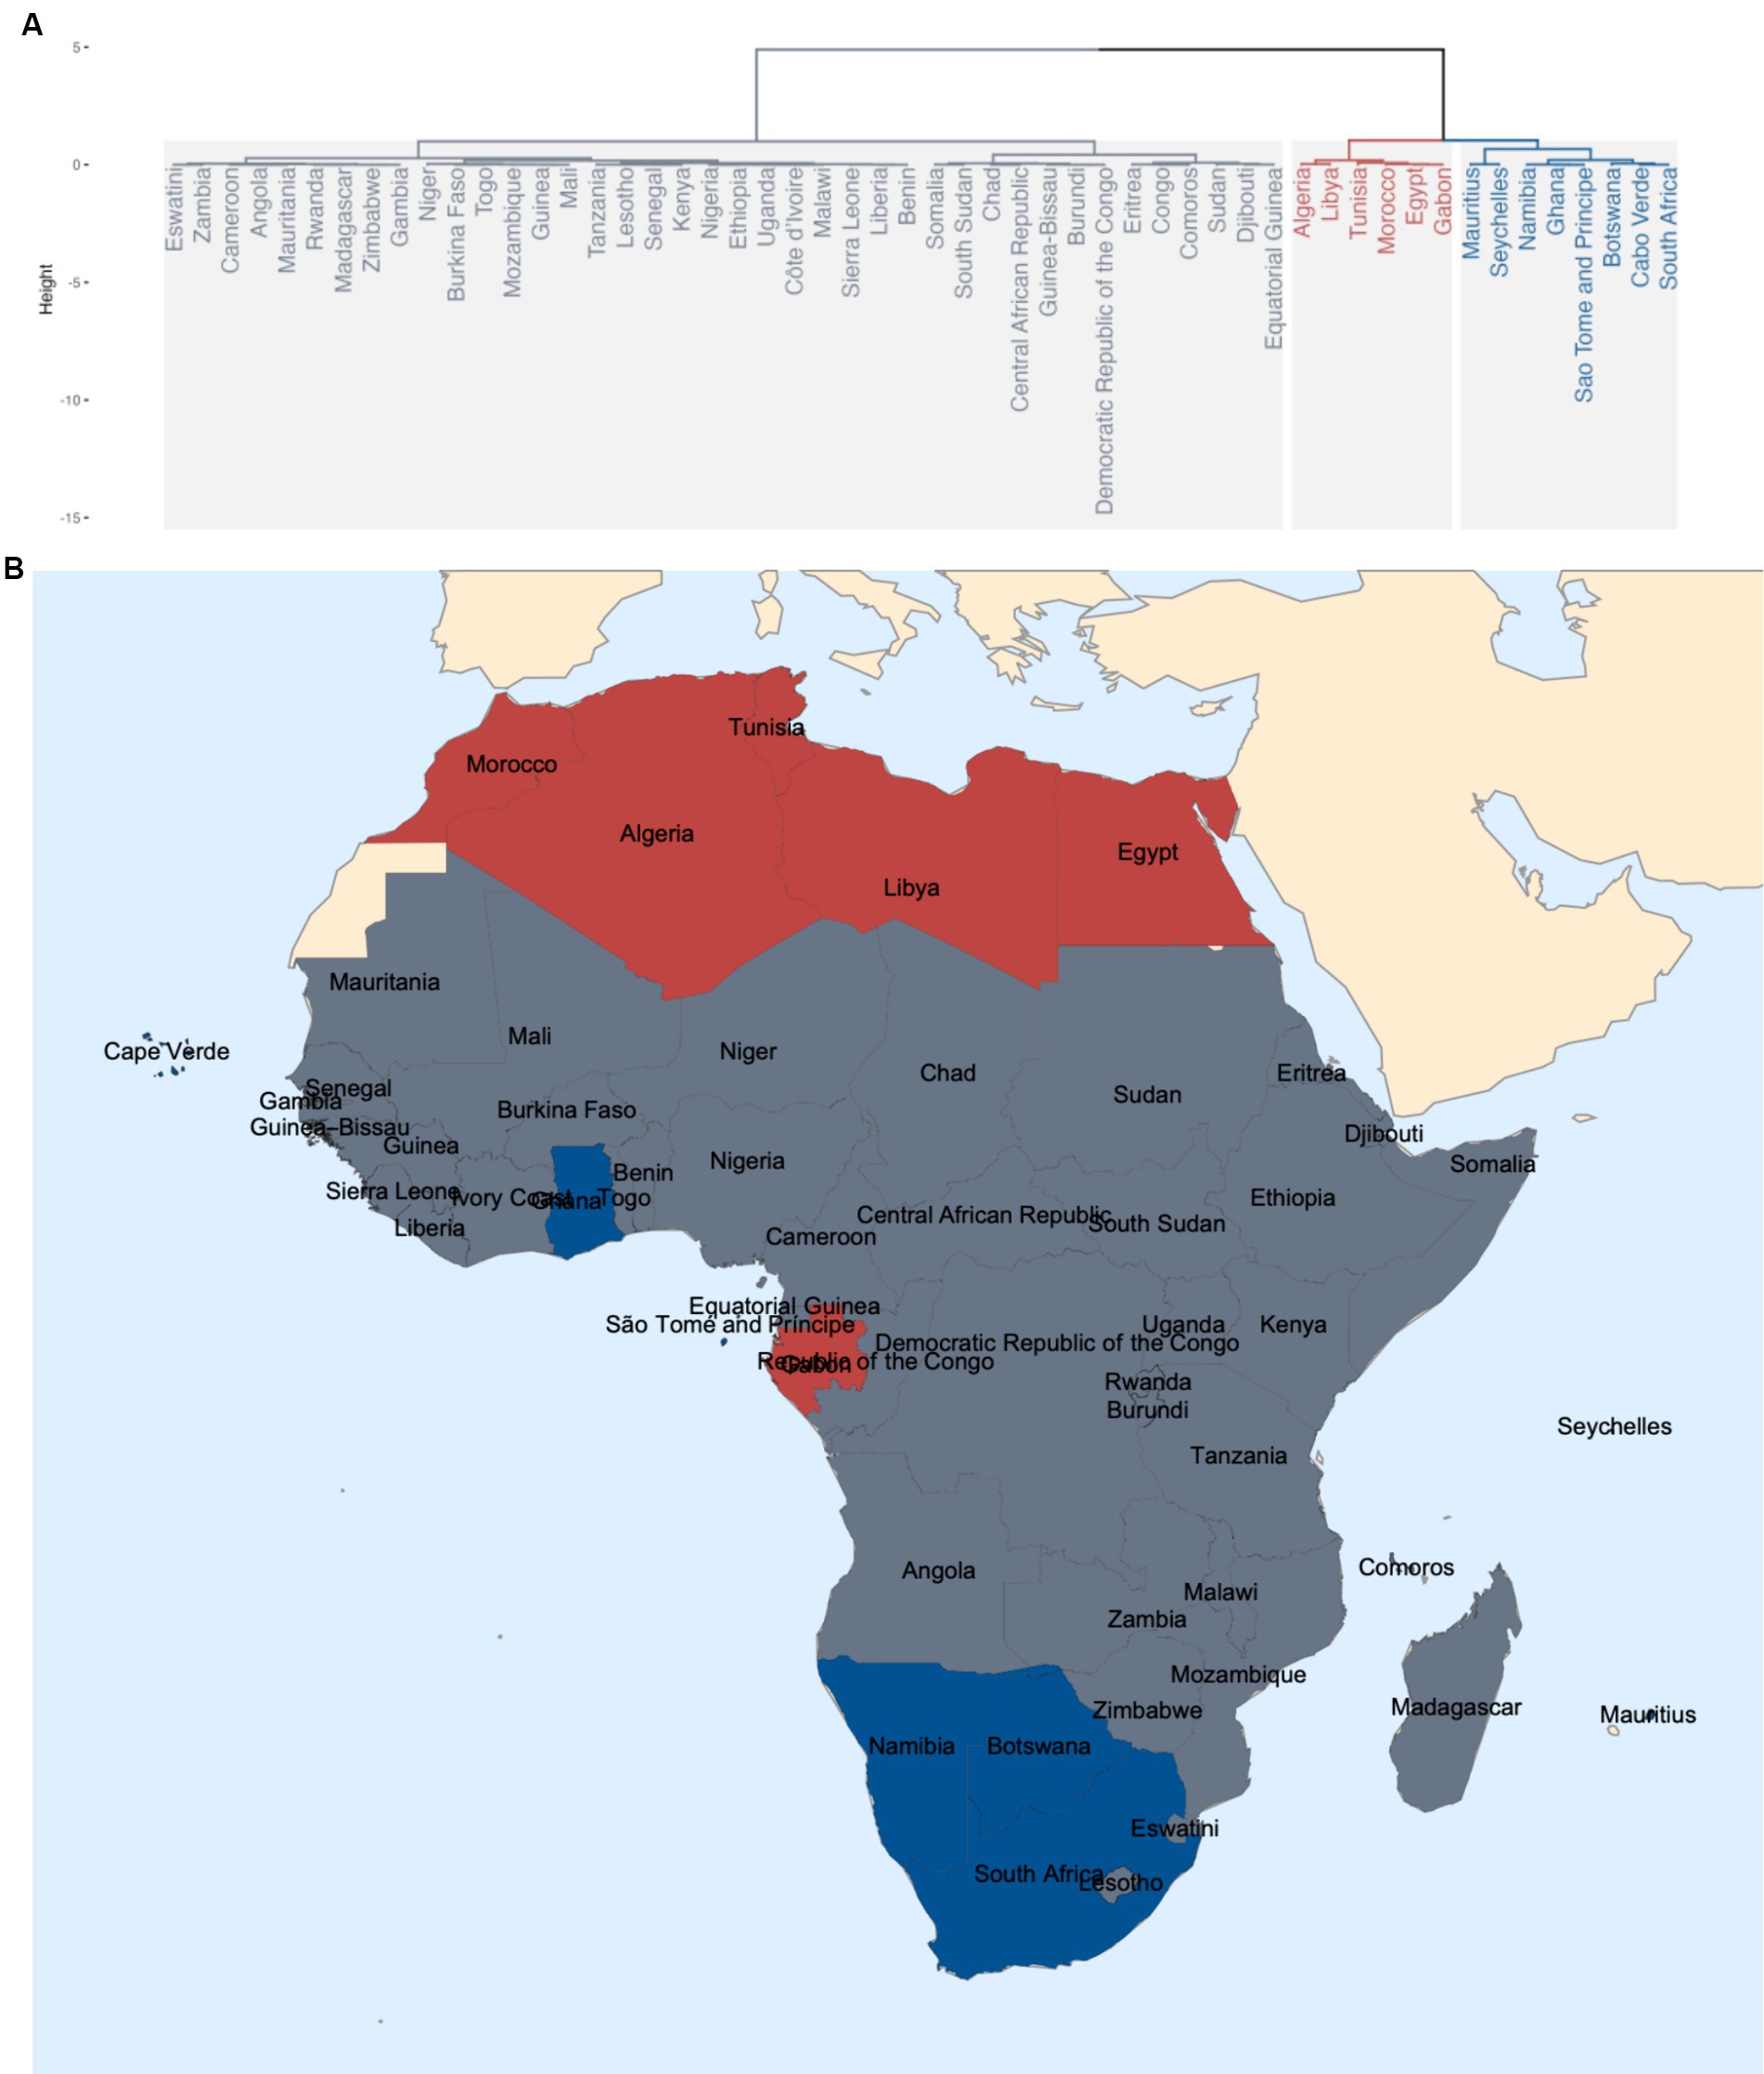
Figure 3. (A) Dendrogram showing three major clusters from HCPC; (B) Geographical locations of the three clusters.
Among all continuous covariates and the COVID-19 daily case reporting rate used for the clustering, the reporting rate ( ), median age ( ), urban population ( ), life expectancy ( ), Islam population ( ), literacy rate ( ), number of physicians ( ), number of nurses ( ), malaria incidence ( ), diabetes prevalence ( ), lower respiratory infections prevalence ( ), cardiovascular diseases prevalence ( ), GDP ( ), corruption index ( ), democracy index ( ), human development index ( ) and voice accountability ( ) are significantly different across clusters from the ANOVA test, as is shown in Figure 4. According to Figure 4, Cluster 2 (red) has the best COVID-19 reporting performance, followed by Cluster 3 (blue) and then Cluster 1 (gray). Among the three major clusters, Cluster 2 and 3 on average exhibit higher median age, life expectancy, urban population size, human development index, GDP, number of physicians, number of nurses and literacy rates and lower malaria incidence. However, Cluster 2 and 3 on average also have higher corruption index, diabetes and cardiovascular diseases prevalence. Cluster 1 shows intermediate average values with Cluster 2 and 3 polarized in democracy index, voice accountability, lower respiratory infections prevalence and Islamic population size.
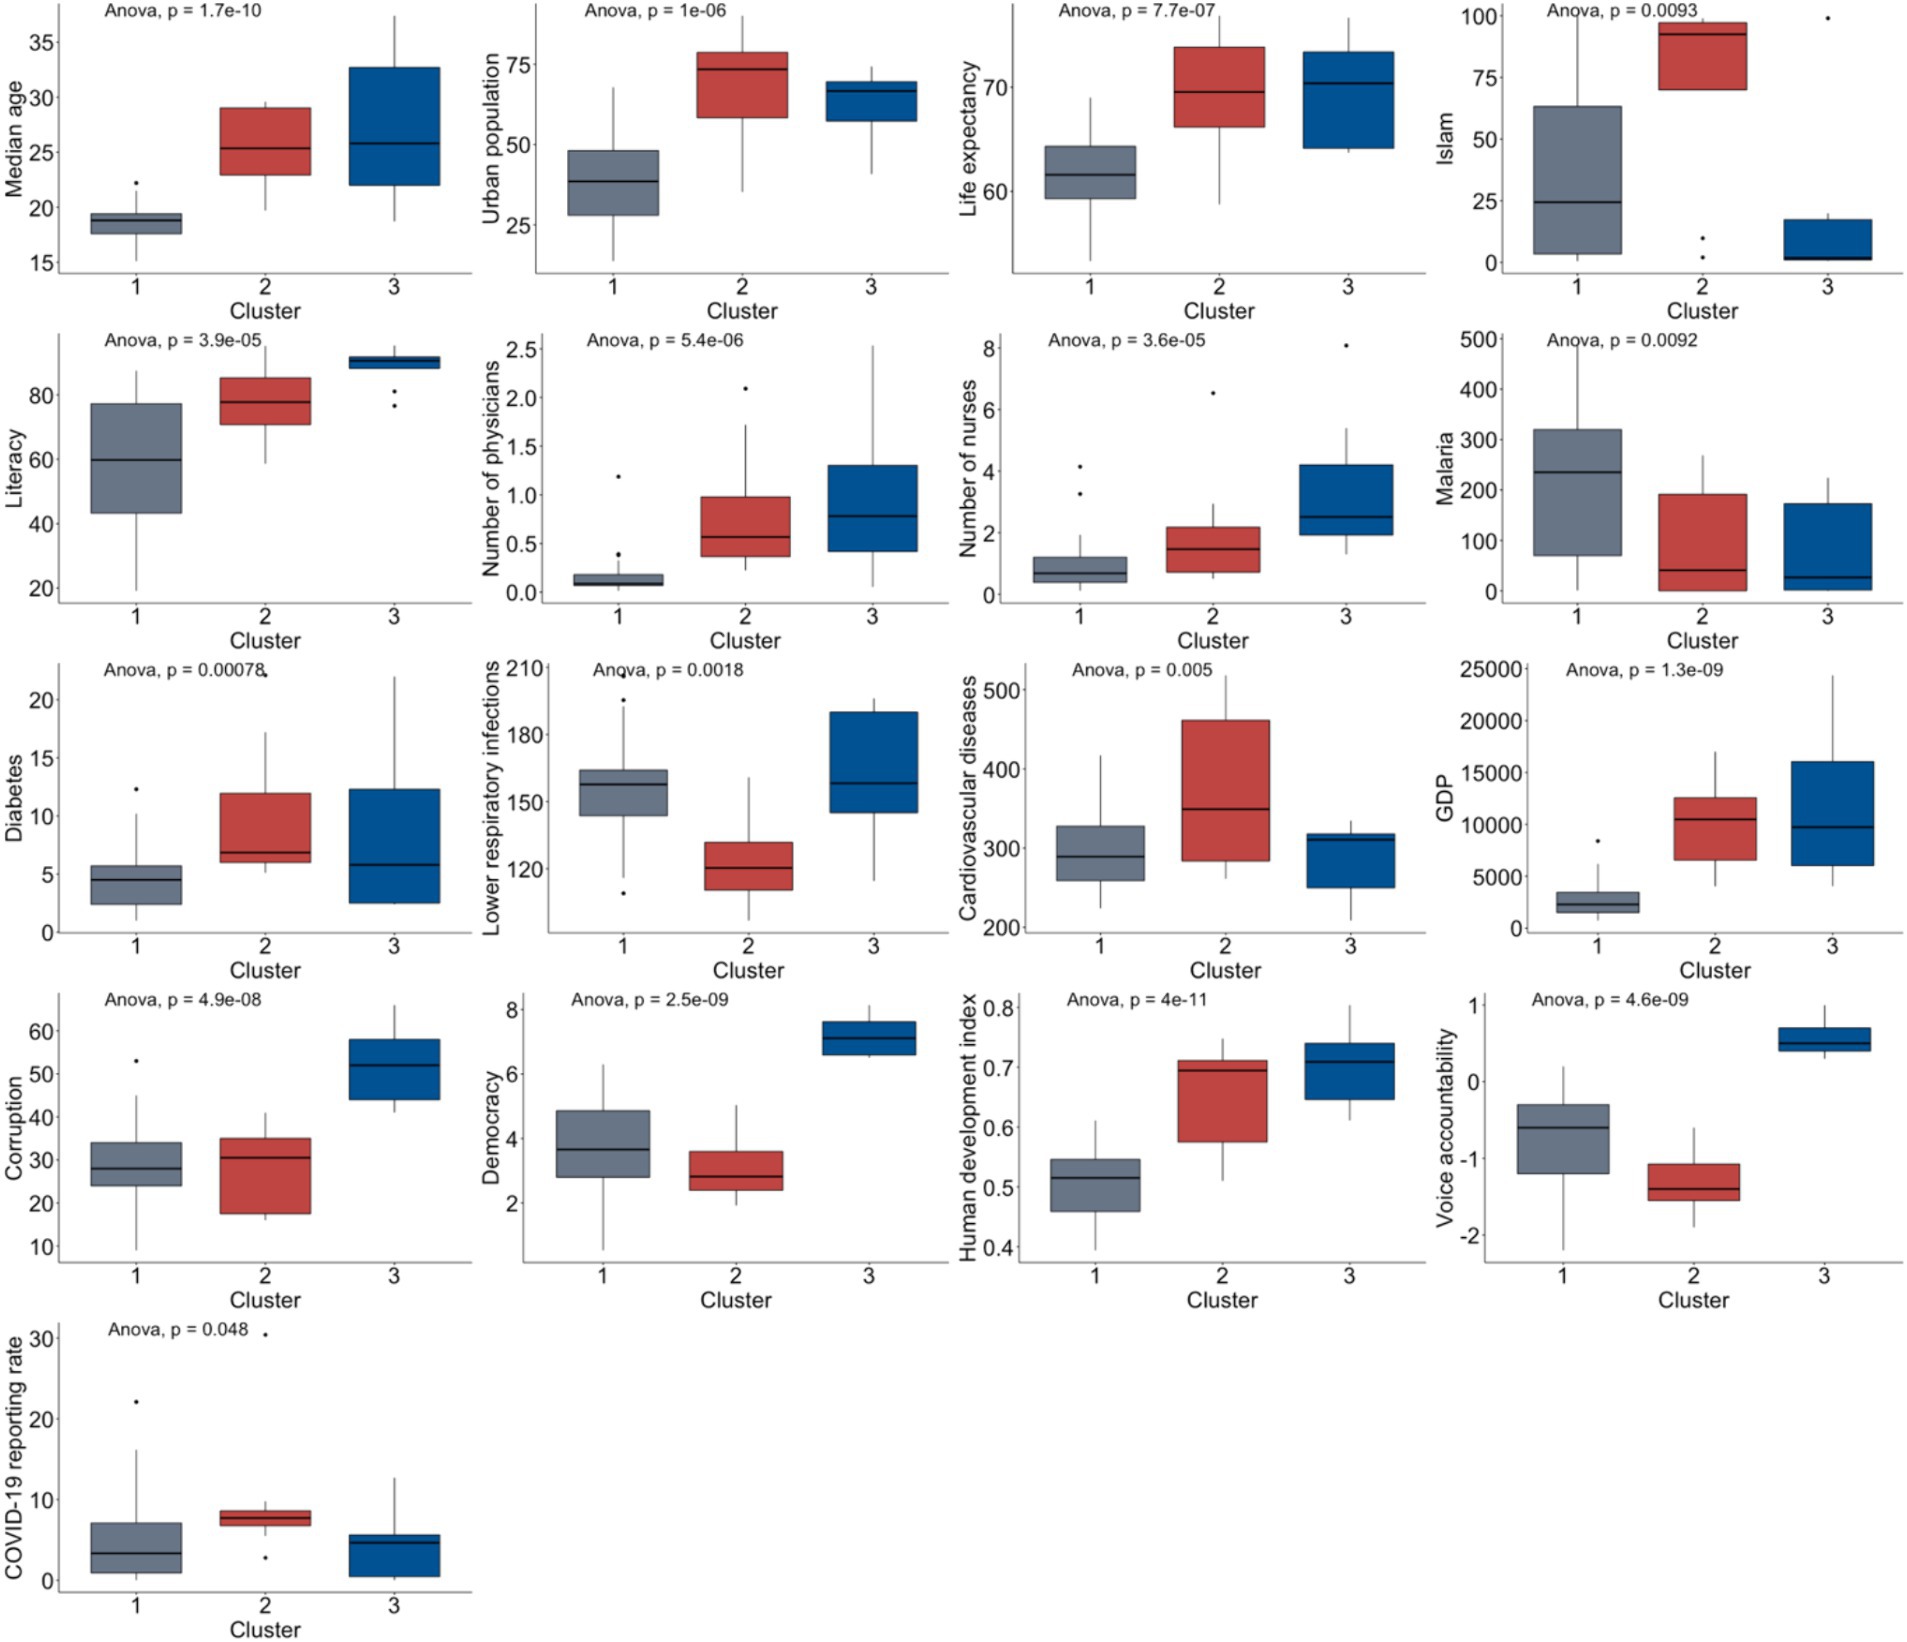
Figure 4. Significant covariates characterizing the three major clusters from HCPC.
4 Discussion
We identified four demographic factors: total population, urban population, median age and life expectancy; seven public health related factors: global health security, number of physicians, number of nurses, malaria, diabetes, lower respiratory diseases and cardiovascular diseases prevalence; eight socioeconomic factors: GDP, human development index, democracy index, corruption index, voice accountability, air transport, social media and internet filtering; one religious factor Islamic population and one education factor literacy rates as significantly associated with COVID-19 case identification during the early stage of the pandemic in Africa. Based on these determinants and the estimated daily case reporting rate, the African countries can be essentially categorized into three major clusters: northern, southern and central, where the northern region has the highest COVID-19 case detection, followed by the southern region, while the central region has the poorest performance in case detection.
Beginning with demographics, we note that areas with a low urban population might see more contained and easier-to-track spread, while highly urbanized areas could boast better health infrastructure and reporting systems (Figure 2B). Middle urban areas may face reporting challenges as rapidly growing populations outpace healthcare facilities’ development (49). Countries with a higher median age (Figure 2C) might experience a higher COVID-19 case fatality rate due to increased risk in older individuals (7, 50), significantly straining healthcare systems. Higher life expectancy (Figure 2D) could indicate superior overall healthcare systems (51, 52), potentially leading to more efficient COVID-19 detection and reporting. The negative association with population size (Figure 2A) (53) suggests that larger populations face lower reporting rates due to the challenges of scaling up testing and reporting infrastructure (54, 55) or the greater likelihood of under-detection in densely populated areas.
Socioeconomically, a higher GDP (Figure 2N) might correlate with better healthcare infrastructure (56, 57), thus enhancing testing and reporting capacity. The democracy index (Figure 2P) suggests that countries with very high (58) or very low (59) scores exhibit higher reporting rates, possibly reflecting transparency in democratic countries and international scrutiny or aid in less democratic countries (60). In general, during the COVID-19 pandemic, many countries experienced declines in their democracy scores, particularly those with authoritarian regimes (61, 62). Increased corruption (Figure 2Q) is linked to decreased reporting rates, suggesting that corruption may hinder accurate reporting (63) due to factors like mismanagement of information and resources. Countries where citizens have more voice and accountability (Figure 2R) may report better, likely due to greater transparency and public demand for accurate information. This could also be seen in social media censorship (Figure 2T), but beyond a certain level, the improvement on case reporting becomes less pronounced. The sharp decline at the lower end of the health development index (HDI) (Figure 2O) scale might suggest that countries with lower development levels have much lower COVID-19 reporting rates, possibly due to limited healthcare infrastructure and fewer resources for testing and reporting. As countries attain a moderate level of human development, the reporting rate’s decrease slows, potentially indicating that beyond a certain threshold of development, improvements in reporting rates become less pronounced, possibly due to the establishment of basic reporting systems. Countries with moderate levels of air transport have the highest reporting rates (Figure 2S), which could be tied to better connectivity and infrastructure that also supports health reporting systems.
Interestingly, a higher proportion of the Muslim population (Figure 2E) correlates with increased reporting rates, prompting consideration of the complex interplay between religious practices, community engagement, and public health policies. This finding warrants further investigation to understand the underlying social mechanisms at play. The inverse U-shaped curve observed for literacy rates (Figure 2F) suggests that moderate literacy aligns with the highest reporting rates, likely due to the intersection of disease prevalence and public health awareness. Countries with high literacy rates might have lower incidence due to preventative measures and thus fewer under-reporting, while low literacy might impede disease recognition and reporting.
Public health insights indicate varying impacts of healthcare resources on COVID-19 reporting rates. Higher malaria incidence (Figure 2J) (64) may indicate robust disease tracking systems (65). Interestingly, the number of nurses per capita (Figure 2H) has a negative association with reporting rates, suggesting more nurses might not directly translate to higher reporting, potentially due to efficient disease management or other unaccounted factors. Conversely, a higher number of physicians (Figure 2I) correlates with increased reporting rates, possibly indicating better diagnostic and surveillance capacity. It could also reflect broader healthcare system quality, where more physicians per capita mean more comprehensive care, including chronic disease management, and a heightened awareness and ability to report infectious diseases like COVID-19. The global health security index’s positive association (Figure 2G) implies that countries prepared for health crises report more efficiently (66). This result would imply that countries with higher scores in global health security, which encompasses factors like disease detection, response, health system quality, and the risk environment, are likely to report COVID-19 cases more efficiently and accurately. This is consistent with what would be expected, as a higher global health security index indicates a stronger healthcare infrastructure capable of dealing with pandemics. For diabetes prevalence (Figure 2K), a negative association would suggest that as the prevalence of diabetes in the population increases, the COVID-19 reporting rates actually decrease. This could be due to several potential factors. For example, countries with higher prevalence of diabetes may have healthcare systems that are more burdened by chronic disease management (67), possibly leading to less capacity for effective infectious disease surveillance and reporting. Alternatively, it could reflect socio-economic factors (68), where high diabetes prevalence is associated with other factors that might impede effective reporting, such as limited access to healthcare services or lower health literacy regarding infectious diseases. The inverse U-shaped relationship between lower respiratory infection (LRI) rates and COVID-19 reporting (Figure 2L) suggests that countries with extremely high or low LRI rates tend to have lower COVID-19 reporting rates, while those with moderate LRI rates report more cases. High LRI rates may strain health resources, leading to under-reporting of COVID-19, whereas countries with low LRI rates might lack the necessary infrastructure or experience to detect and report COVID-19 effectively. Optimal reporting is observed in countries with moderate LRI prevalence, possibly due to balanced health system vigilance and capacity. Notable exceptions, such as Libya with low LRI but high COVID-19 reporting rates, indicate that other factors also significantly influence reporting. The positive association seen with cardiovascular disease death rates (Figure 2M) suggests that countries with a greater number of reported deaths from cardiovascular diseases have a greater COVID-19 reporting rate. As cardiovascular related diseases are the leading cause of death in Africa (69), countries with a higher number of reported deaths from such diseases would also possess enhanced disease surveillance and reporting practices and thus have a higher COVID-19 reporting rate.
Studies have been conducted to find possible reasons for the low numbers of cases and deaths in Africa. The proportion of older adult people ( 60 years old) was identified to be the major factor to explain low case number, and the health systems capacities was identified to be responsible for the case under-estimation in one study (70). In another study, international flights, testing capacity, population density, young population, Vitamin D levels, cross-immunity from other infections, temperature and UV light and humidity were listed as potential reasons for Africa’s low case number (71). However, it is worth note that our study is different as the subject of this study is the reporting/under-reporting rate, rather than the overall case number. To our knowledge, there have not been investigations on the determinants of COVID-19 case reporting in Africa. The dependent variable of COVID-19 daily case reporting fraction was estimated using the same mechanistic mathematical model for all African countries and therefore provide a reliable and fair comparison among them (9). Our study also considered a wider range of potential factors than those in existing literature (10, 12–15). Interestingly, some factors do not show the same relationship with total case number and case reporting ratio. For example, higher air transport rate and human development index are contemplated to associate with higher COVID-19 case number (71), but they demonstrate an inverse U-shaped rather than monotonic association with the reporting ratio (Figure 2). And while larger median age implies more cases, its relationship with reporting ratio is negative (Figure 2D). That could provoke further thinking on how the factors affect the case reporting system. The clustering results from our HCPC analysis are in general agreement with other studies. For example, previous emerging infectious diseases epidemics revealed the vulnerability of Western and Central Africa in facing both known and unknown pathogens due to a growing urban population with insufficient public health infrastructure (72), and moreover, Northern and Southern Africa show higher capacities in health systems (70). However, it should be noted that reporting practice varies as the outbreak progresses, and the case reporting rate used here is only the estimate for the initial phase of the pandemic. Therefore, these determinants could be interpretated as the preparedness in face of a novel emerging communicable disease outbreak but cannot be extended to subsequent efforts made by the nations or the overall case identification performance over the entire course.
Data availability statement
Publicly available datasets were analyzed in this study. This data can be found here: all datasets for this study can be found through the links in the corresponding references.
Author contributions
QH: Conceptualization, Methodology, Software, Visualization, Writing – original draft, Data curation, Formal analysis. GR: Data curation, Formal analysis, Software, Writing – original draft. MM: Methodology, Writing – original draft. WA: Conceptualization, Data curation, Writing – original draft. AAh: Supervision, Writing – review & editing. AAs: Supervision, Writing – review & editing. JO: Supervision, Writing – review & editing. JW: Supervision, Writing – review & editing. JK: Conceptualization, Funding acquisition, Supervision, Writing – review & editing.
Funding
The author(s) declare that financial support was received for the research, authorship, and/or publication of this article. This research was funded by Canada’s International Development Research Centre (IDRC) (Grant No. 109981). JK acknowledges support from NSERC Discovery Grant (Grant No. RGPIN-2022-04559), NSERC Discovery Launch Supplement (Grant No: DGECR-2022-00454) and New Frontier in Research Fund-Exploratory (Grant No. NFRFE-2021-00879).
Conflict of interest
The authors declare that the research was conducted in the absence of any commercial or financial relationships that could be construed as a potential conflict of interest.
Publisher’s note
All claims expressed in this article are solely those of the authors and do not necessarily represent those of their affiliated organizations, or those of the publisher, the editors and the reviewers. Any product that may be evaluated in this article, or claim that may be made by its manufacturer, is not guaranteed or endorsed by the publisher.
References
1. Andersen, KG, Rambaut, A, Lipkin, WI, Holmes, EC, and Garry, RF. The proximal origin of sars-cov-2. Nat. medicine. (2020) 26:450–2. doi: 10.1038/s41591-020-0820-9
2. WHO. Who coronavirus (covid-19) dashboard. (2022). Available at: https://covid19.who.int
3. Africa news. Covid-19: Egypt confirms first coronavirus case in africa. Coronavirus outbreak news. (2020). Available at: https://www.aljazeera.com/news/2020/02/egypt-confirms-coronavirus-case-africa-200214190840134.html
4. WHO. Coronavirus (covid-19): WHO African region numbers at a glance. (2022). Avaiable at:https://www.afro.who.int/health-topics/coronavirus-covid-19
5. Bai, Y, Yao, L, Wei, T, Tian, F, Jin, DY, Chen, L, et al. Presumed asymptomatic carrier transmission of covid-19. J Am Med Assoc. (2020) 323:1406–7. doi: 10.1001/jama.2020.2565
6. Rivett, L, Sridhar, S, Sparkes, D, Routledge, M, and Jones, NK. Screening of healthcare workers for sars-cov-2 highlights the role of asymptomatic carriage in covid-19 transmission. Elife. (2020) 9:e58728. doi: 10.7554/eLife.58728
7. Davies, NG, Klepac, P, Liu, Y, Prem, K, and Eggo, RM. Age-dependent effects in the transmission and control ofcovid-19 epidemics. Nat medicine. (2020) 26:1–7. doi: 10.1038/s41591-020-0962-9
8. WHO. Six in seven covid-19 infections go undetected in Africa. (2021). Available at: https://www.afro.who.int/news/six-seven-covid-19-infections-go-undetected-africa
9. Han, Q, Bragazzi, N, Asgary, A, Orbinski, J, Wu, J, and Kong, JD. Estimation of epidemiological parameters and ascertainment rate from early transmission of COVID-19 across Africa. R Soc Open Sci. (2023) 10:230316. doi: 10.1098/rsos.230316
10. Sansone, NMS, Boschiero, MN, and Marson, FAL. Epidemiologic profile of severe acute respiratory infection in Brazil during the COVID-19 pandemic: an epidemiological study. Front Microbiol. (2022) 13:911036. doi: 10.3389/fmicb.2022.911036
11. Azevedo, M. J., and Azevedo, M. J. (2017). The state of health system (s) in Africa: challenges and opportunities. In: MJ Azevedo, editor. Historical Perspectives on the State of Health and Health Systems in Africa, Volume II: The Modern Era. Cham: Springer International Publishing, 1–73
12. Landman, T, and Smallman-Raynor, M. The politics of COVID-19: Government response in comparative perspective. Politic Geograp. (2023) 106:102957. doi: 10.1016/j.polgeo.2023.102957
13. Kofanov, D, Kozlov, V, Libman, A, and Zakharov, N. Encouraged to cheat? Federal Incentives and career concerns at the sub-national level as determinants of under-reporting of COVID-19 mortality in Russia. Br J Polit Sci. (2023) 53:835–60. doi: 10.1017/S0007123422000527
14. Kisa, S, and Kisa, A. Under-reporting of Covid-19 cases in Turkey. Int J Health Plann Manag. (2020) 35:1009–13. doi: 10.1002/hpm.3031
15. Bouba, Y, Tsinda, EK, Fonkou, MDM, Mmbando, GS, Bragazzi, NL, and Kong, JD. The determinants of the low COVID-19 transmission and mortality rates in Africa: a cross-country analysis. Front Public Health. (2021) 9:751197. doi: 10.3389/fpubh.2021.751197
16. The World Bank. Population, female (% of total) | data. (2021). Available at: https://data.worldbank.org/indicator/SP.POP.TOTL.FE.ZS
17. The World Bank. Urban population (% of total) | data. (2021). Available at: https://data.worldbank.org/indicator/SP.URB.TOTL.IN.ZS
18. United Nations. World population prospects-population division-United Nations. (2022). Available at: https://population.un.org/wpp/Download/Standard/Population/
19. WHO. Indicator Metadata Registry Details. Available at: https://www.who.int/data/gho/indicator-metadata-registry/imr-details/116#:~:text=Definiti
20. The World Bank. Life expectancy at birth, total (years). (2020). Available at: https://data.worldbank.org/indicator/SP.DYN.LE00.IN
21. UN, World Population Prospects (2022) – 2022–Processed by our world in data. “Ages 65+” [dataset]. UN, world population prospects. Available at: https://ourworldindata.org/age-structure
22. The World Bank. GINI index (World Bank estimate). (2021). Available at: https://data.worldbank.org/indicator/SI.POV.GINI
23. World Bank. GDP per capita (current US$). (2021). Available at: https://data.worldbank.org/indicator/NY.GDP.PCAP.CD
24. Economist intelligence unit. Democracy Index 2021. (2021). Available at: https://www.eiu.com/n/campaigns/democracy-index-2020/
25. Roser, M. Human Development Index (HDI). (2019). Available at: https://ourworldindata.org/human-development-index
26. World Bank. Ease of doing business index (1=most business-friendly regulations). (2021). Available at: https://data.worldbank.org/indicator/IC.BUS.EASE.XQ?end=2019&start=2019&view=bar
27. The World Bank. Air transport, passengers carried. (2019). Available at: https://data.worldbank.org/indicator/is.air.psgr
28. Digital Society Project. (2024). Available at: http://digitalsocietyproject.org/
29. Transparency International. 2019- CPI. (2019). Available at: https://www.transparency.org/en/cpi/2019
30. The World Bank. Worldwide governance indicators. (2021). Available at: https://databank.worldbank.org/source/worldwide-governance-indicators
31. The World Bank, Statistical Capacity Indicators. (2024). Available at: https://databank.worldbank.org/source/statistical-capacity-indicators
32. Press freedom index. Our world in data. (2022). Available at: https://ourworldindata.org/grapher/press-freedom-index-rsf
33. Author, N. Global Christianity - a report on the size and distribution of the World’s Christian population. (2011). Available at: https://www.pewresearch.org/religion/2011/12/19/global-christianity-exec/#global-distribution-of-christians
34. United States Department of State. 2022 Report on International Religious Freedom-United States Department of State. (2023). Available at: https://www.state.gov/reports/2022-report-on-international-religious-freedom/
35. Central Intelligence Agency. Religions-the world Factbook. Available at: https://www.cia.gov/the-world-factbook/field/religions/
36. Literacy rate. Our world in data. (2023). Available at: https://ourworldindata.org/grapher/cross-country-literacy-rates?tab=map&country=East+Asia+%26+Pacific~Sub-Saharan+Africa~Europe+%26+Central+Asia~Latin+America+%26+Caribbean~Middle+East+%26+North+Africa~South+Asia
37. Public healthcare expenditure as a share of GDP. Our world in data. (2023). Available at: https://ourworldindata.org/grapher/public-healthcare-spending-share-gdp
38. Our world in data. Public expenditure on healthcare as percent of total healthcare expenditure. (2023). Available at: https://ourworldindata.org/grapher/share-of-public-expenditure-on-healthcare-by-country?tab=table
39. Our world in data. Death rate from cardiovascular disease. (2019). Available at: https://ourworldindata.org/grapher/cardiovascular-disease-death-rates
40. World Bank. Diabetes prevalence (% of population ages 20 to 79). (2017). Available at: https://data.worldbank.org/indicator/SH.STA.DIAB.ZS
41. Institute for Health Metrics and Evaluation. GBD Results. (2019). Available at: https://vizhub.healthdata.org/gbd-results/
42. World Bank Open Data. Nurses and midwives (per 1,000 people). (2020). Available at: https://data.worldbank.org/indicator/SH.MED.NUMW.P3?end=2018&name_desc=false&start=2018&view=chart
43. World Bank Open Data. Physicians (per 1,000 people). (2020). Available at: https://data.worldbank.org/indicator/SH.MED.PHYS.ZS?end=2018&name_desc=false&start=2018&view=chart
44. WHO. Mean BMI (kg/m2) (age-standardized estimate). (2017). Available at: https://www.who.int/data/gho/data/indicators/indicator-details/GHO/mean-bmi-(kg-m-)-(age-standardized-estimate)
45. GHS Index. The Global Health security Index; (2019). Available at: https://www.ghsindex.org/
46. Our World in data. Share of population with cancer. (2024). Available at: https://ourworldindata.org/grapher/share-of-population-with-cancer?tab=table
47. Our World in data. Incidence of malaria. (2023). Available at: https://ourworldindata.org/grapher/the-incidence-of-malaria-per-1000-population?tab=table
48. Mean Total Cholesterol (age-standardized estimate). (2021). Available from:https://www.who.int/data/gho/data/indicators/indicator-details/GHO/mean-total-cholesterol-(age-standardized-estimate)
49. Ruszczyk, H, Castán Broto, V, and McFarlane, C. Urban health challenges: lessons from COVID-19 responses. Geoforum. (2022) 131:105–15. doi: 10.1016/j.geoforum.2022.03.003
50. Wang, H, Paulson, KR, Pease, SA, Watson, S, Comfort, H, Zheng, P, et al. Estimating excess mortality due to the COVID-19 pandemic: a systematic analysis of COVID-19-related mortality, 2020–21. Lancet. (2022) 399:1513–36. doi: 10.1016/S0140-6736(21)02796-3
51. Galvani-Townsend, S, Martinez, I, and Pandey, A. Is life expectancy higher in countries and territories with publicly funded health care? Global analysis of health care access and the social determinants of health. Journal of. Glob Health. (2022) 12:12. doi: 10.7189/jogh.12.04091
52. OECD. What has driven life expectancy gains in recent decades? A cross-country analysis of OECD member states. Paris: OECD iLibrary (2017).
53. Msemburi, W, Karlinsky, A, Knutson, V, Aleshin-Guendel, S, Chatterji, S, and Wakefield, J. The WHO estimates of excess mortality associated with the COVID-19 pandemic. Nature. (2022) 613:130–7. doi: 10.1038/s41586-022-05522-2
54. Barker, PM, Reid, A, and Schall, MW. A framework for scaling up health interventions: lessons from large-scale improvement initiatives in Africa. Implement Sci. (2015) 11:12. doi: 10.1186/s13012-016-0374-x
55. Mangham, LJ, and Hanson, K. Scaling up in international health: what are the key issues? Health Policy Plan. (2010) 25:85–96. doi: 10.1093/heapol/czp066
56. Bedir, S. Healthcare expenditure and economic growth in developing countries. Adv Econ Bus. (2016) 4:76–86. doi: 10.13189/aeb.2016.040202
57. Fedeli, S. The impact of GDP on health care expenditure: the case of Italy (1982–2009). Soc Indic Res. (2014) 122:347–70. doi: 10.1007/s11205-014-0703-x
58. Yao, L, Li, M, Wan, JY, Howard, SC, Bailey, JE, and Graff, JC. Democracy and case fatality rate of COVID-19 at early stage of pandemic: a multicountry study. Environ Sci Pollut Res. (2021) 29:8694–704. doi: 10.1007/s11356-021-16250-x
59. Karabulut, G, Zimmermann, KF, Bilgin, MH, and Doker, AC. Democracy and COVID-19 outcomes. Econ Lett. (2021) 203:109840. doi: 10.1016/j.econlet.2021.109840
60. Alesina, A, and Dollar, D. Who gives foreign aid to whom and why? J Econ Growth. (2000) 5:33–63. doi: 10.1023/A:1009874203400
61. Economist Intelligence. Covid-19 pandemic causes a global democracy slump. (2021). Available at: https://www.eiu.com/n/covid-19-pandemic-causes-a-global-democracy-slump/
62. Sorsa, V-P, and Kivikoski, K. COVID-19 and democracy: a scoping review. BMC Public Health. (2023) 23:1668. doi: 10.1186/s12889-023-16172-y
63. Usman, M, Husnain, M, Akhtar, MW, Ali, Y, Riaz, A, and Riaz, A. From the COVID-19 pandemic to corrupt practices: a tale of two evils. Environ Sci Pollut Res. (2022) 29:30297–310. doi: 10.1007/s11356-022-18536-0
64. Habibzadeh, F. Malaria and the incidence of COVID-19 in Africa: an ecological study. BMC Infect Dis. (2023) 23:66. doi: 10.1186/s12879-023-08032-2
65. Kerr, G, Robinson, LJ, Russell, TL, and Macdonald, J. Lessons for improved COVID-19 surveillance from the scale-up of malaria testing strategies. Malar J. (2022) 21:223. doi: 10.1186/s12936-022-04240-4
66. Ledesma, JR, Isaac, CR, Dowell, SF, Blazes, DL, Essix, GV, Budeski, K, et al. Evaluation of the Global Health Security Index as a predictor of COVID-19 excess mortality standardised for under-reporting and age structure. BMJ Glob. Health. (2023) 8:e012203. doi: 10.1136/bmjgh-2023-012203
67. Liu, J, Bai, R, Chai, Z, Cooper, ME, Zimmet, PZ, and Zhang, L. Low-and middle-income countries demonstrate rapid growth of type 2 diabetes: an analysis based on global burden of disease 1990–2019 data. Diabetologia. (2022) 65:1339–52. doi: 10.1007/s00125-022-05713-6
68. Richards, SE, Wijeweera, C, and Wijeweera, A. Lifestyle and socioeconomic determinants of diabetes: evidence from country-level data. PLOS ONE. (2022) 17:e0270476. doi: 10.1371/journal.pone.0270476
69. Doku, A, Tuglo, LS, Chilunga, F, Edzeame, J, Peters, RJG, and Agyemang, C. A multilevel and multicenter assessment of health care system capacity to manage cardiovascular diseases in Africa: a baseline study of the Ghana heart initiative. BMC. (2023) 23:421. doi: 10.1186/s12872-023-03430-5
70. Thenon, N, Peyre, M, Huc, M, Touré, A, Roger, F, and Mangiarotti, S. COVID-19 in Africa: underreporting, demographic effect, chaotic dynamics, and mitigation strategy impact. PLoS Negl Trop Dis. (2022) 16:e0010735. doi: 10.1371/journal.pntd.0010735
71. Bamgboye, EL, Omiye, JA, Afolaranmi, OJ, Davids, MR, Tannor, EK, Wadee, S, et al. COVID-19 pandemic: is Africa different? J Natl Med Assoc. (2021) 113:324–35. doi: 10.1016/j.jnma.2020.10.001
Keywords: case reporting, COVID-19, Africa, determinants of case reporting, generalized additive model, hierarchical clustering on principal component analysis
Citation: Han Q, Rutayisire G, Mbogning Fonkou MD, Avusuglo WS, Ahmadi A, Asgary A, Orbinski J, Wu J and Kong JD (2024) The determinants of COVID-19 case reporting across Africa. Front. Public Health. 12:1406363. doi: 10.3389/fpubh.2024.1406363
Edited by:
Martial Ndeffo, Texas A&M University, United StatesReviewed by:
Sylvain Mangiarotti, Institut de Recherche Pour le Développement (IRD), FranceBurak Tekerek, Yuksek Ihtisas University, Türkiye
Copyright © 2024 Han, Rutayisire, Mbogning Fonkou, Avusuglo, Ahmadi, Asgary, Orbinski, Wu and Kong. This is an open-access article distributed under the terms of the Creative Commons Attribution License (CC BY). The use, distribution or reproduction in other forums is permitted, provided the original author(s) and the copyright owner(s) are credited and that the original publication in this journal is cited, in accordance with accepted academic practice. No use, distribution or reproduction is permitted which does not comply with these terms.
*Correspondence: Jude Dzevela Kong, amRrb25nQHlvcmt1LmNh