 Juan Zhong
 Weiye Li2†
 Shasha Yang
 Yifeng Shen
- 1Chengdu University of Traditional Chinese Medicine, Chengdu, China
- 2Chengdu Integrated TCM and Western Medicine Hospital/Chengdu First People’s Hospital, Chengdu, China
- 3Otolaryngology Department, Guizhou University of Traditional Chinese Medicine, Guiyang, China
- 4TCM Regulating Metabolic Diseases Key Laboratory of Sichuan Province, Hospital of Chengdu University of Traditional Chinese Medicine, Chengdu, China
- 5Hospital of Chengdu University of Traditional Chinese Medicine, Chengdu, China
Backgrounds: Observational studies suggest that air pollutants, including particulate matter and nitrogen compounds, could elevate asthma and allergic rhinitis health risks. Nevertheless, the exact nature of the causal relationship between air pollution and asthma and allergic rhinitis remains unknown. This study utilizes the Mendelian randomization (MR) technique to explore the potential causal links between air pollution components (PM2.5, PM2.5–10, PM10, NO₂, and nitrogen dioxide) and the incidence of allergic rhinitis and asthma.
Methods: A MR study utilized summary statistics from GWAS that are publicly accessible. The inverse variance weighting (IVW) approach served as the foundational analysis technique. To ensure robustness, supplementary methodologies such as the weighted median, MR-Egger regression, simple mode, and weighted model were also applied. Heterogeneity was evaluated using Cochran’s Q test, and the presence of pleiotropy was determined through MR-Egger regression. The MR-PRESSO test was employed for outlier detection, and the analysis’s sensitivity was scrutinized via a leave-one-out strategy.
Results: The IVW technique showed a strong correlation between PM10 and asthma (OR = 0.625, 95% CI = 0.396–0.988, p = 0.044). No significant associations were found between asthma and other air pollutants such as PM2.5, PM2.5–10, NO₂, or nitrogen dioxide. Similarly, allergic rhinitis showed no causal relationships with any studied air pollution metrics. Pleiotropy was absent in the findings. Sensitivity analyses, employing the leave-one-out method, confirmed the stability of these results, unaffected by individual single nucleotide polymorphisms (SNPs).
Conclusion: This Mendelian randomization study establishes a causal link between PM10 exposure and asthma, suggesting that interventions to reduce air pollution may decelerate the adverse progression of asthma.
1 Introduction
Recognized as a significant reversible environmental determinant of premature mortality and morbidity, air pollution stands at the forefront of global health risks (1). This environmental hazard comprises a spectrum of particulates and gaseous pollutants, including but not limited to ozone, carbon monitrogen, sulfur dioxide, alongside nitrogenous compounds such as NO₂ and nitrogen dioxide (2). Among the array of pollutants, PM2.5 is distinguished as the most significant health threat. This is attributed to its finer composition, enabling deeper penetration into the lung tissue, and its association with a more harmful mix of chemicals (3). A growing body of epidemiological research underscores the association between exposure to air pollutants and a broad array of adverse health outcomes. These include, but are not limited to, respiratory and cardiovascular diseases (4, 5), cerebrovascular impairments (6), mental health issues (7), an increased risk of various cancers (8, 9) and respiratory diseases like allergic rhinitis (AR) and asthma (10). Allergic rhinitis and asthma are the most common allergic respiratory diseases. Since the respiratory tract can directly contact various air pollutants, both indoor and outdoor air pollutants are considered environmental risk factors for these diseases (11). Air pollutants, particularly ozone, particulate matter (PM), and diesel exhaust, have been demonstrated to increase the permeability of allergens in the respiratory mucosa and enhance the effects of allergen-induced airway inflammation (12). Furthermore, air pollutants make atopic patients more sensitive to antigens to which they are already sensitized (13). For example, Carlsten et al. observed that inhalation of diesel exhaust increases allergen-induced inflammation in the lower airways of atopic individuals (14).
Asthma and allergic rhinitis represent a considerable public health challenge and a worldwide health burden. AR is a widespread chronic disorder affecting the nasal lining, marked by symptoms and inflammatory and immunological dysfunctions. Manifestations include sneezing, itching in the nasal area, obstruction of airflow, and transparent nasal secretions, triggered by IgE-mediated responses (15). This condition has become a significant health issue globally (16), with an estimated 20% of the UK’s population affected (17). In China, a meta-analysis revealed that around 19% of adults and 22% of children are afflicted by AR (18), adversely influencing sleep quality, academic achievements, and life quality (19). Asthma, another chronic non-communicable respiratory illness affecting both minors and adults, arises from complex genetic and environmental interplays (20). It is identified by fluctuating respiratory symptoms and restricted airflow. Asthma’s prevalence has surged worldwide, now impacting about a third of the global populace and causing nearly 2.5 million deaths annually due to severe episodes (21). Collectively, asthma and AR affect a significant portion of the global population, over 20% (19), with projections indicating an upward trend. Hence, studying the relationship between air pollutants and allergic respiratory diseases holds significant clinical value, especially for devising crucial prevention and control strategies.
Research in the domain of environmental health has progressively uncovered the relationship between air pollution and respiratory conditions like asthma and allergic rhinitis. In a notable multicenter study designed as randomized, double-blind, and placebo-controlled, investigators assessed the effectiveness of air purifiers equipped with high-efficiency particulate air (HEPA) filters on adults diagnosed with AR. Findings from this investigation confirmed that utilizing air purifiers with HEPA filters led to a substantial decrease in the medication usage for individuals affected by AR triggered by HDM, alongside a marked reduction in the levels of indoor PM2.5 and allergic airway conditions relieving (22). In a parallel effort, a randomized, double-blind clinical trial conducted in China with 90 participants who had allergic rhinitis and were sensitive to Artemisia pollen demonstrated significant improvements upon using high-efficiency air purifiers (23). A separate cohort study brought to light the association between slight increases in exposure to traffic-related air pollutants, such as NO2 and PM2.5, during the year of birth and the subsequent development of asthma by the age of 7 (24). Further, an investigation by Schildcrout JS and his team (25), which analyzed asthma exacerbations among children in eight cities, found that increases in carbon monitrogen dioxideide and nitrogen dioxide levels were directly linked to exacerbations of asthma symptoms, with sulfur dioxide levels also showing a marginal association.
Despite these insights, observational studies are often challenged by methodological limitations, such as the risk of homologous or reverse causation, which may skew results due to unseen confounders or reverse causality. To surmount these challenges and solidify the causal inference, RCTs are advocated as the most reliable method to eliminate confounding variables typical of observational studies. Yet, the specific exploration of the nexus between air pollution, allergic rhinitis, and asthma through RCTs remains a significant gap in current research. Mendelian randomization (MR) (26) is increasingly recognized as an invaluable method for determining the veracity of observed correlations against causal hypotheses, adeptly navigating through the pitfalls of confounding variables and reverse causation that frequently complicate observational research. MR employs genetic variations, specifically SNPs, as instrumental variables, facilitating analyses that closely resemble the structure of RCTs without their logistical constraints. This resemblance is due to the random allocation of alleles during meiosis, analogous to the randomization process in RCTs, thereby simulating a natural experiment. MR capitalizes on the principle (27) that genetic variants are distributed randomly across populations, which theoretically eliminates any selection bias related to environmental exposures, such as air pollution. This framework ensures that the association between genetic markers and exposure to environmental factors is not confounded, providing a clearer path to establishing causal relationships. Furthermore, MR can significantly diminish the influence of potential confounding variables, including age, gender, and lifestyle choices, by isolating the direct relationship between genetic predispositions and health outcomes like allergic rhinitis and asthma. By doing so, MR offers a more solid foundation for causal inference than traditional observational studies. Thus, leveraging MR to investigate the link between air pollution and allergic diseases allows for overcoming the inherent limitations of observational studies, offering more reliable evidence of causality. This study utilizes a comprehensive collection of publicly available GWAS data, with allergic rhinitis and asthma as endpoints, focusing on exposure to PM2.5, PM2.5–10, PM10, NO₂, and nitrogen dioxide, to delve deeper into the potential causal connections between air pollution and these allergic conditions while minimizing the effects of confounding factors.
2 Materials and methods
2.1 Study design
Our investigation utilizes a MR framework, anchored on three fundamental principles: (1) Instrumental variables must be associated with the exposure; (2) They should not be linked to the outcomes through any confounding pathways; and (3) Their influence on the outcomes should be mediated exclusively through the exposure, not directly (as illustrated in Figure 1A). In our study, the focal exposure is air pollution, encompassing PM2.5, PM2.5–10, PM10, NO₂, and nitrogen dioxide, with the instrumental variables being SNPs that have a strong association with air pollution levels. The outcomes under investigation are allergic rhinitis and asthma. Employing a two-sample MR approach, we aim to elucidate the causal dynamics between air pollution and the incidence of allergic rhinitis and asthma. Figure 1 delineates the procedural blueprint of this Mendelian randomization study.
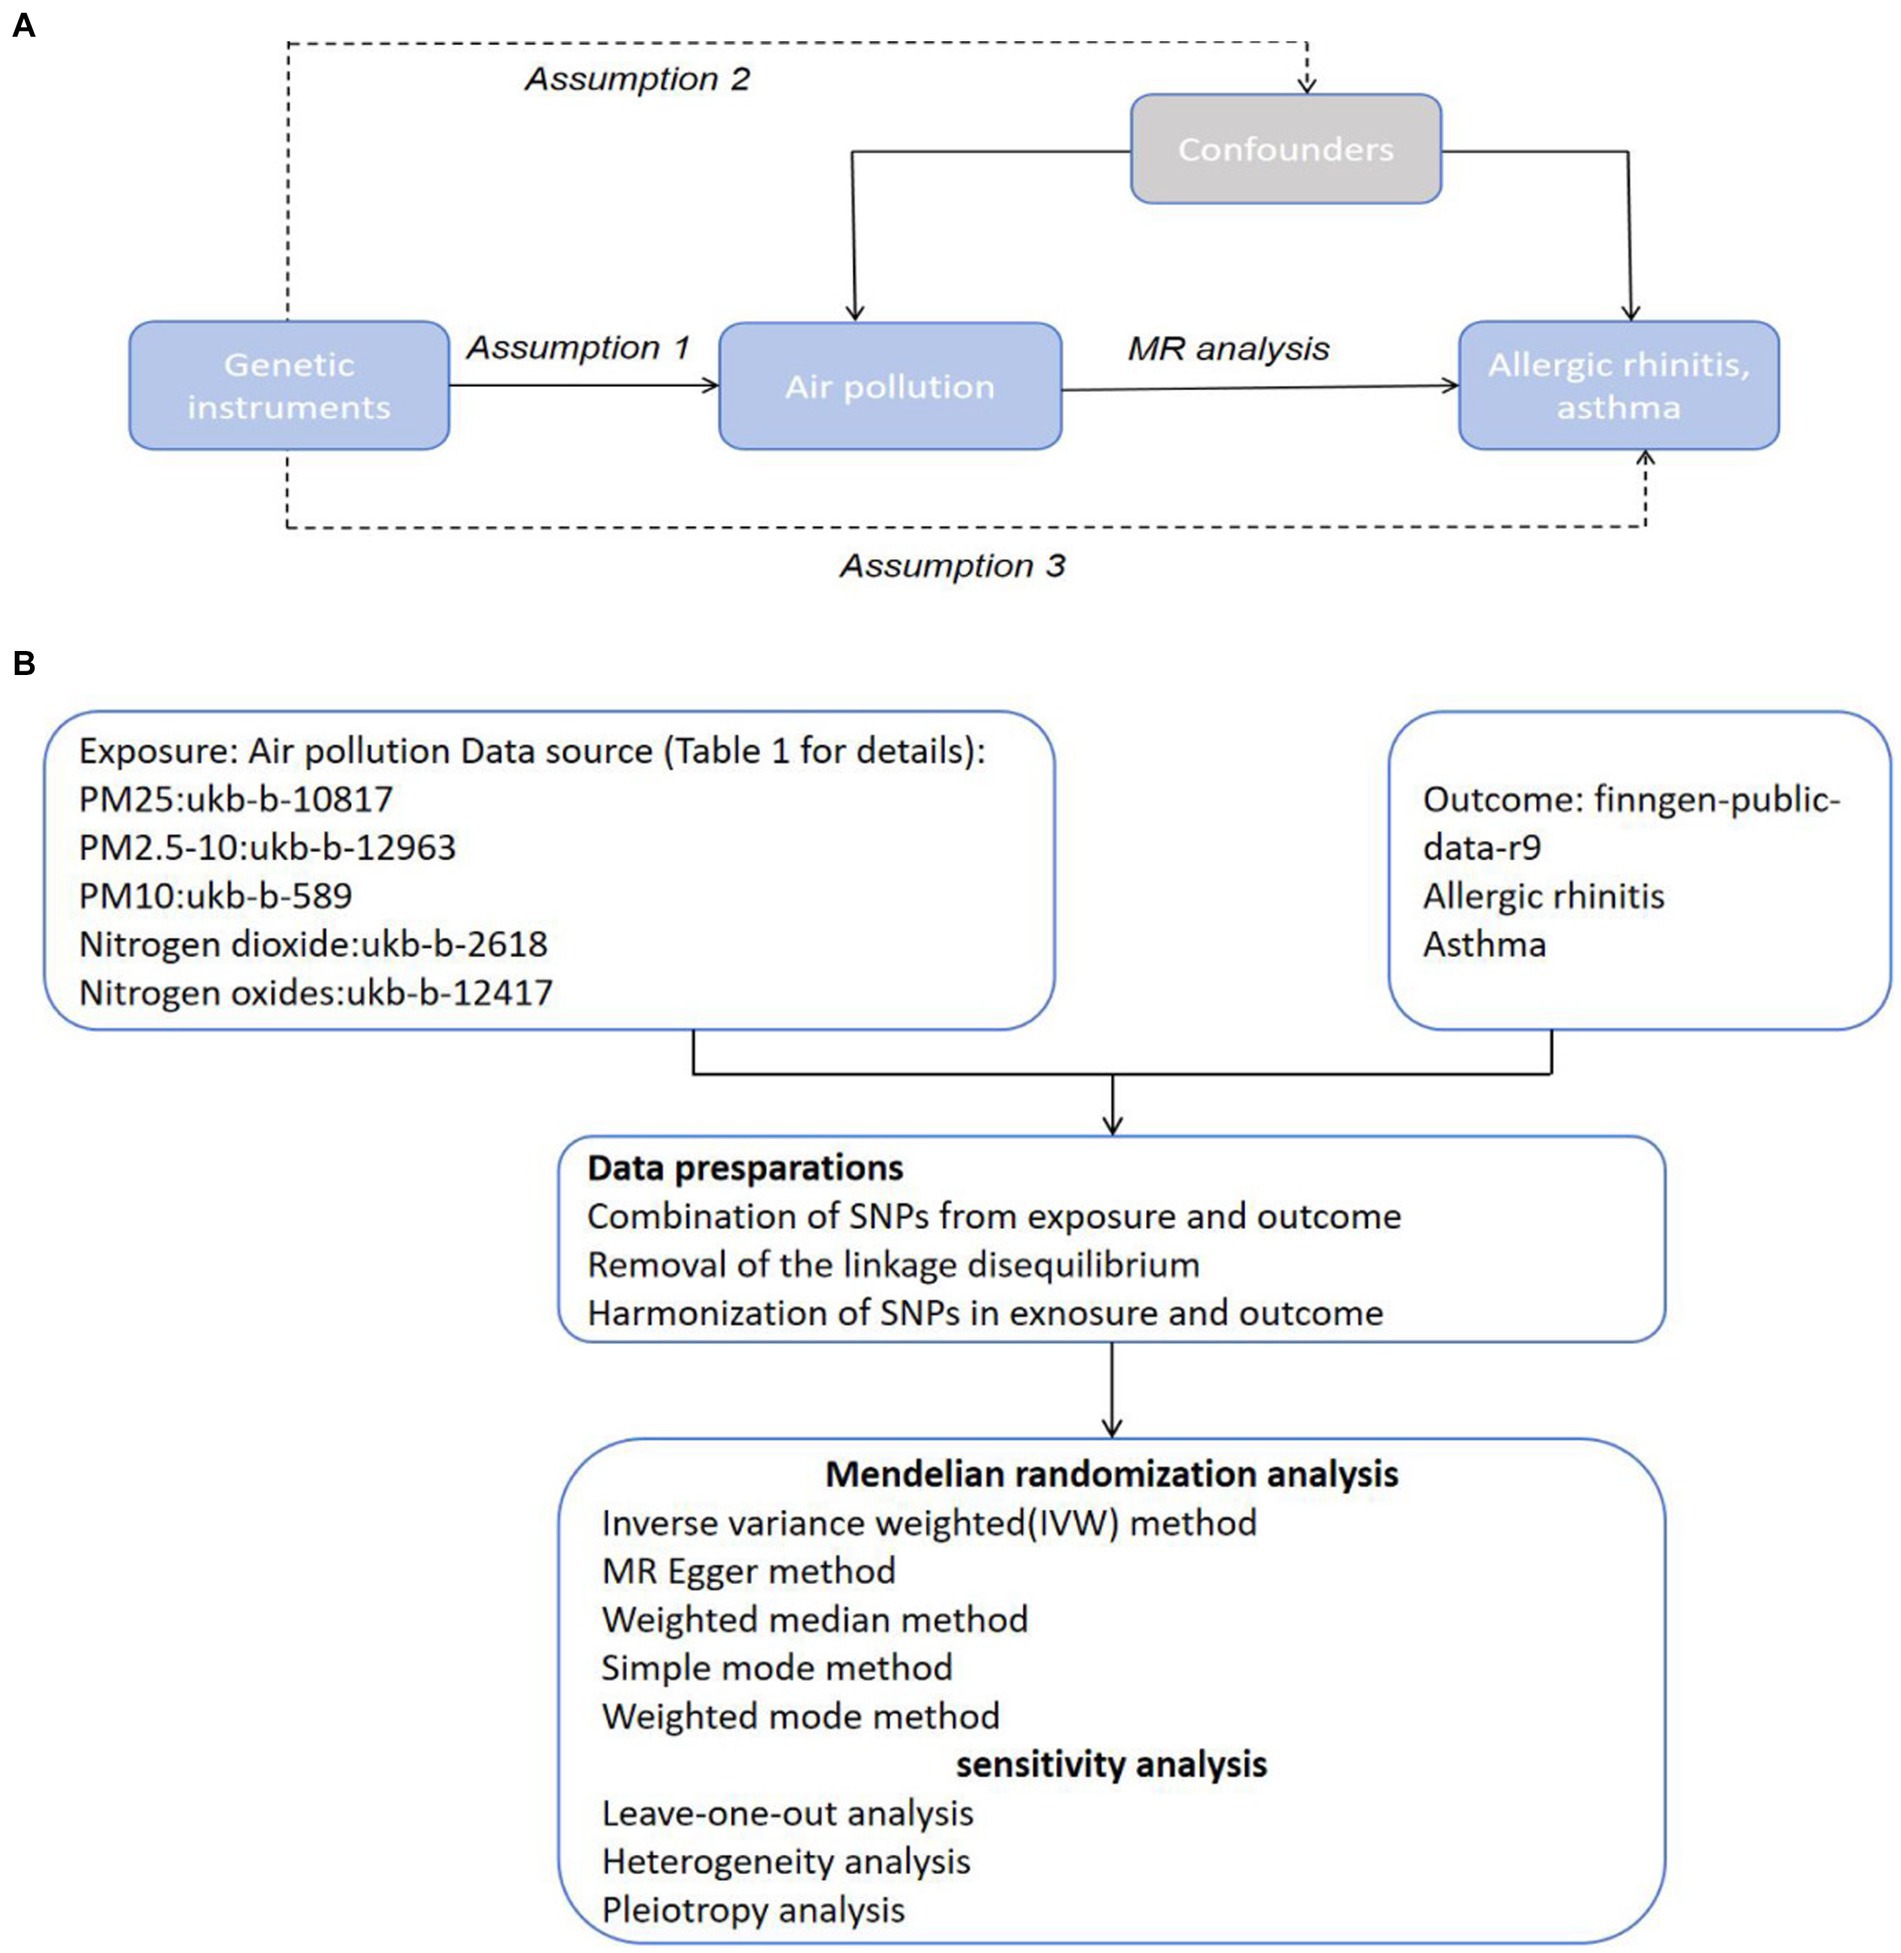
Figure 1. Hypothesis and Conceptual Framework Overview. (A) Mendelian Randomization Hypothesis Diagram: SNPs related to air pollution as genetic instruments for analyzing the causal influence of air pollution on frailty. Lines with arrows depict the association of SNPs with exposure, indicating mediation of the effect on outcome solely through exposure. Dashed lines show independence of SNPs from confounders affecting the results. (B) Methodological Blueprint for Mendelian Randomization Analysis.
2.2 Data sources
Table 1 elaborately enumerates the sources of data utilized in this analysis. For the exposure variables, we selected various air pollutants, including PM2.5, PM2.5–10, PM10, nitrogen dioxide, and nitrogen oxides. The comprehensive data regarding these pollutants were sourced from the UK Biobank, an extensive cohort study comprising over half a million participants from the United Kingdom. This study has made available detailed information on phenotypes, genetic data, and genome-wide genotyping (28). The GWAS summary datasets specifically for PM2.5 (GWAS ID: ukb-b-10817), PM2.5–10 (GWAS ID: ukb-b-12963), PM10 (GWAS ID: ukb-b-589), nitrogen dioxide (GWAS ID: ukb-b-2618), and nitrogen oxides (GWAS ID: ukb-b-12417) included participant counts of 423,796, 423,796, 455,314, 456,380, and 456,380, respectively. It is noted that all participants had provided informed consent for their inclusion in the original studies from which this data was compiled.
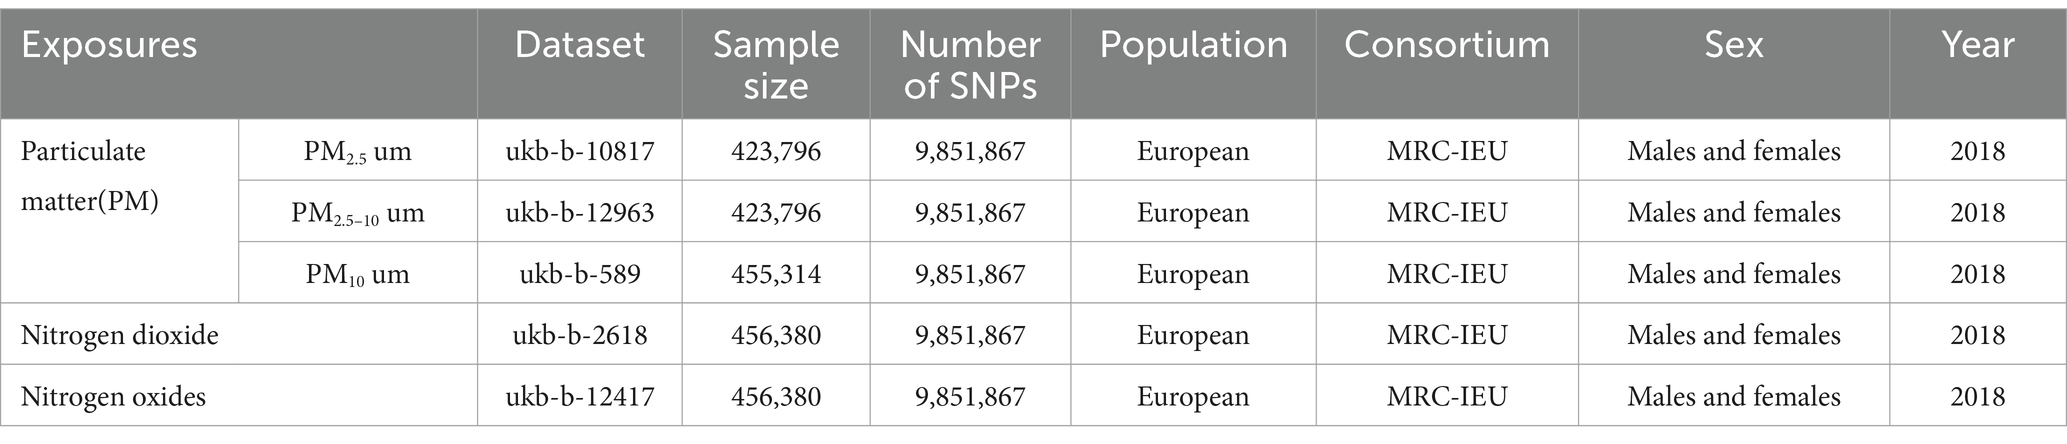
Table 1. Overview of exposures data sources in this two-sample MR study.
The latest data utilized for outcome analysis in this MR study was obtained from FinnGen, an extensive research collaboration between public and private sectors. This initiative merges imputed genetic data from both newly collected and existing samples within Finnish biobanks with electronic health records from Finland’s Health Registry, aiming to uncover new genetic insights into various diseases (29, 30). The dataset for allergic rhinitis, accessible via FinnGen’s public dataset, included 11,009 cases and 359,149 controls, all of European descent. Similarly, the asthma dataset, available at FinnGen’s repository, comprised 42,163 cases and 202,399 controls, also of European ancestry.
2.3 Selection of instrumental variables
Figure 1B outlines the initial step in our methodology, where we identified SNPs significantly linked to the gut microbiota to serve as instrumental variables (IVs) in our study. We applied a dual-tiered approach for the selection of these IVs. At the outset, our criteria demanded that SNPs must reach a level of genome-wide significance (p < 5 × 10⁻⁸) to qualify as IVs. This strict standard, however, resulted in the inclusion of only PM10 as IVs, narrowing the breadth of our investigation. In pursuit of a broader analysis that could delve into the intricate connections between pancreatitis, air pollution, and achieve more encompassing outcomes, we opted for a slightly relaxed selection threshold of p < 5 × 10⁻⁶ for the SNP IVs.
During the IV extraction phase, we meticulously screened out SNPs affected by linkage disequilibrium (LD), adhering to parameters of r2 < 0.001 and kb > 10,000 (31), to maintain the integrity of our instrumental variables. In instances where the initially selected SNP was not present in the GWAS findings, we employed a proxy SNP with a high linkage disequilibrium (r2 > 0.8) as a substitute (32). This step ensured the consistency of the allele’s impact on both the exposure and the outcome by excluding palindromic SNPs.
Conclusively, we assessed each chosen SNP for its R2 (33) and F-statistic (34), following established protocols. The F-statistic helped us gage the potential for weak instrumental variable bias, whereas R2 quantified the variability in iron status attributed to the SNP. Our selection criteria ensured that each SNP presented an F-statistic above 10, signifying their robust predictive power regarding the exposure (35). Detailed SNP metrics, including the corresponding R2 and F-statistic, are cataloged in the Supplementary Table.
2.4 Mendelian randomization analysis
In our study, we utilized the IVW methodology to investigate the causal relationship between exposure to air pollution and the development of allergic rhinitis and asthma. This approach employs the Wald ratio to derive an estimate of the causal effect from each genetic instrumental variable (IV) individually, followed by aggregating these individual estimates into a comprehensive causal effect analysis using a fixed-effect model meta-analysis. This process is designed to yield a robust and reliable estimate of the causal effect, establishing it as a cornerstone technique in the field of MR studies (36). To ensure the validity and stability of our findings, our analysis was further augmented with several Supplementary methods, including weighted mode, weighted median simple mode, weighted median, and MR-Egger regression (37). The MR-Egger regression method was particularly instrumental in assessing the presence and influence of pleiotropy among the IVs. A non-significant MR-Egger intercept (p > 0.05) or one that is close to zero suggests that the impact of pleiotropy on the IVs is minimal, thereby reinforcing the integrity of our causal inferences (38). Additionally, we employed Cochran’s Q test to assess heterogeneity across the IVs within the IVW framework, with a p-value greater than 0.05 indicating a lack of significant heterogeneity (39). The MR-PRESSO technique was also utilized to identify and correct for outliers among the SNPs, ensuring that our causal estimates remained accurate by excluding these outliers from the analysis (40). Moreover, a leave-one-out sensitivity analysis was conducted, sequentially excluding each SNP to determine if any specific SNP had a disproportionate influence on the overall results. This step was crucial for reducing potential errors in screening IVs and enhancing the reliability of our causal estimates (41). Through these meticulous and comprehensive analytical procedures, our study aimed to provide a more accurate and reliable understanding of the causal links between air pollution and respiratory allergic conditions.
2.5 Statistical analysis
The analyses in this investigation were executed utilizing the “TwoSampleMR” (32) and “MR-PRESSO” (40) tools available within the R Foundation software, version 4.2.2. We established a p-value of less than 0.05 as the benchmark for determining statistical significance in our evidence.
3 Results
3.1 Genetic IVs extraction of air pollution from the allergic rhinitis and asthma GWAS dataset
In conducting our research, we carefully removed instrumental variables with linkage disequilibrium from the genome-wide association study (GWAS) dataset related to allergic rhinitis. This process led us to identify a set of unique SNPs significantly associated with specific air pollutants, with the level of significance set at p < 5 × 10⁻⁶. Our findings included 8 SNPs closely linked to PM2.5 concentration, 23 to PM2.5–10, 231 to PM10, 98 to nitrogen dioxide, and 72 to nitrogen oxides, showcasing a clear genetic predisposition to these environmental exposures.
A similar approach applied to the asthma GWAS dataset revealed a distinct pattern of associations: 8 SNPs were identified for PM2.5, 23 for PM2.5–10, 22 for PM10, 5 for nitrogen dioxide, and 8 for nitrogen oxides, indicating a robust genetic basis for susceptibility to these pollutants.
To further ensure the robustness of our instrumental variables against the potential dilution of weak instruments, we employed the F statistic to assess the strength of the correlation between each IV and its corresponding exposure. The analysis confirmed the absence of significant weak instrumental variables among the SNPs selected (all F > 10), thereby reinforcing the reliability of our causal estimations. The detailed attributes of these instrumental variables, including their respective exposures and the F statistic values, are meticulously cataloged in the Supplementary Table, providing a comprehensive overview of the genetic determinants influencing susceptibility to air pollution and its impact on allergic rhinitis and asthma.
3.2 Mendelian randomization analysis
3.2.1 Allergic rhinitis
In the primary analysis conducted using the IVW method, our Mendelian Randomization study revealed the following ORs and 95% CIs for the respective exposures: For PM2.5, (OR = 1.673, 95% CI:0.819–3.419, p = 0.158); for PM2.5–10, (OR = 0.902, 95% CI:0.576–1.413, p = 0.653); PM10(OR = 0.839, 95% CI:0.699–1.007, p = 0.059); for nitrogen dioxide, (OR = 1.093, 95% CI: 0.831–1.439, p = 0.524); and for nitrogen oxides, (OR = 1.300, 95% CI:0.959–1.760, p = 0.090; as depicted in Figure 2). These results indicated that there was no statistically significant evidence to support a causal link between the exposures to PM2.5, PM2.5–10, PM10, nitrogen dioxide, and nitrogen oxides and the risk of developing allergic rhinitis, as illustrated in Figures 2–4.
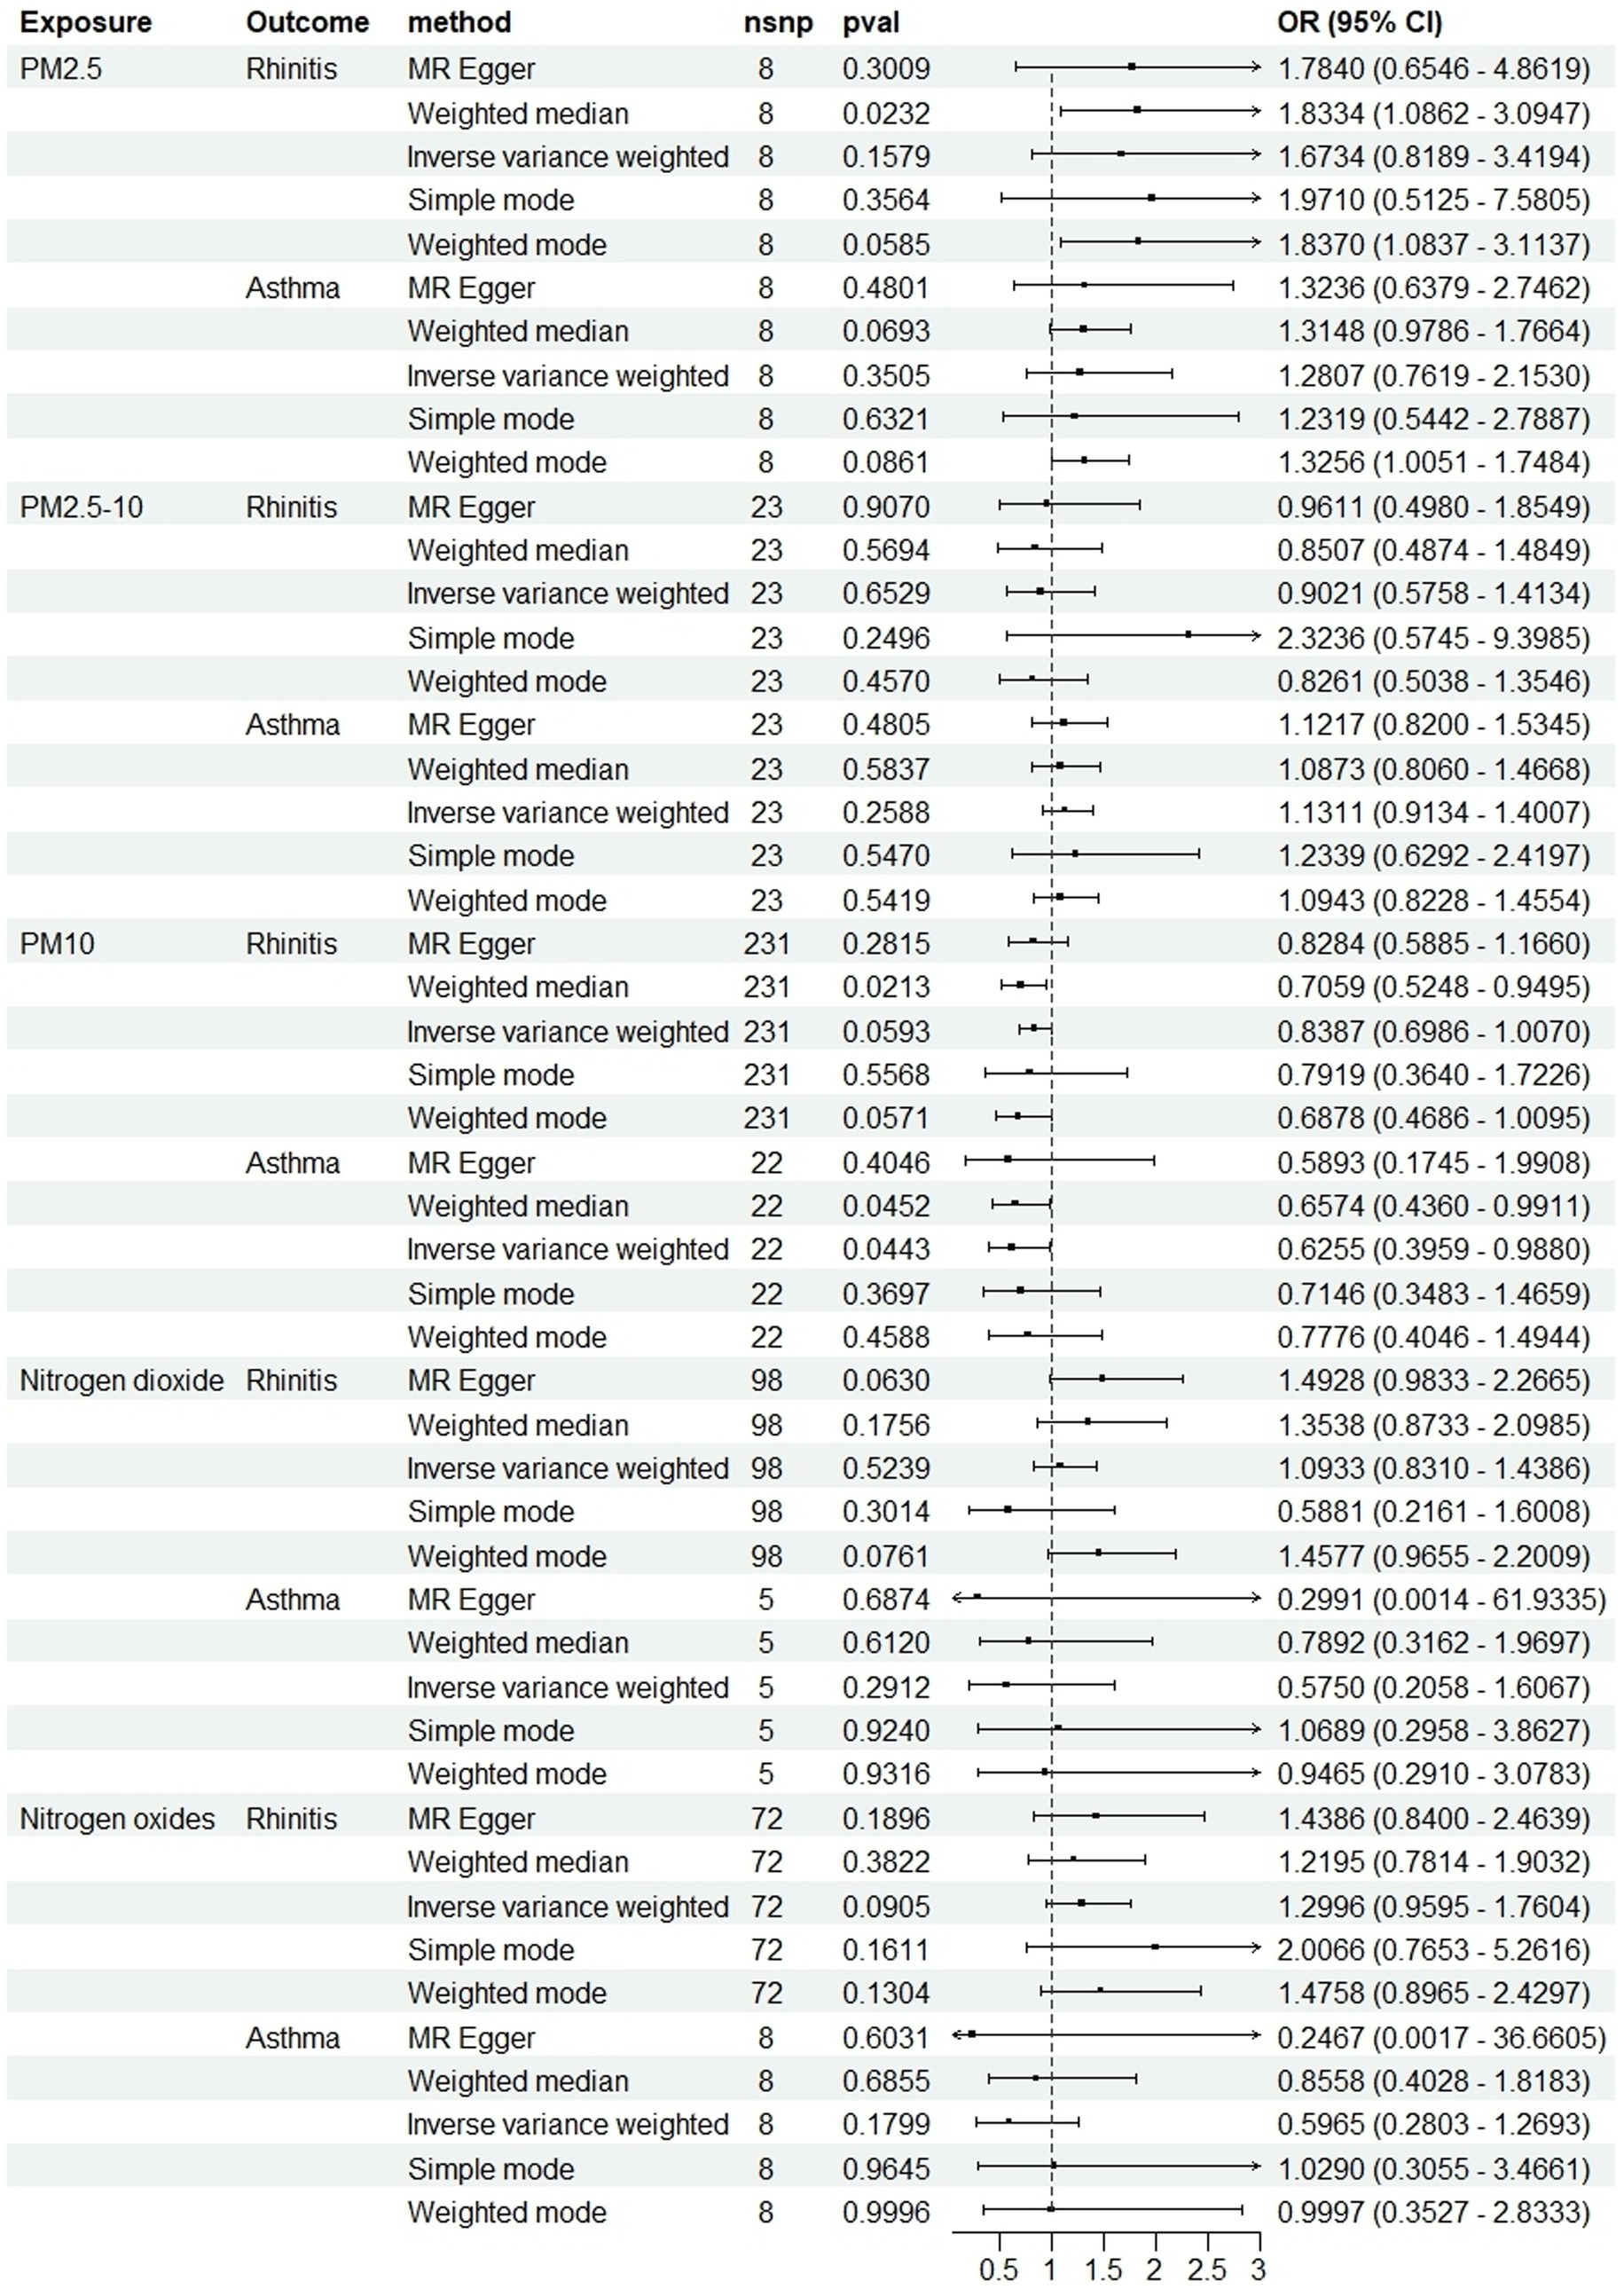
Figure 2. Causal linkage of air pollution exposure with allergic rhinitis and asthma outcomes. nSNP, SNP count; OR, odds ratio; CI, confidence interval.
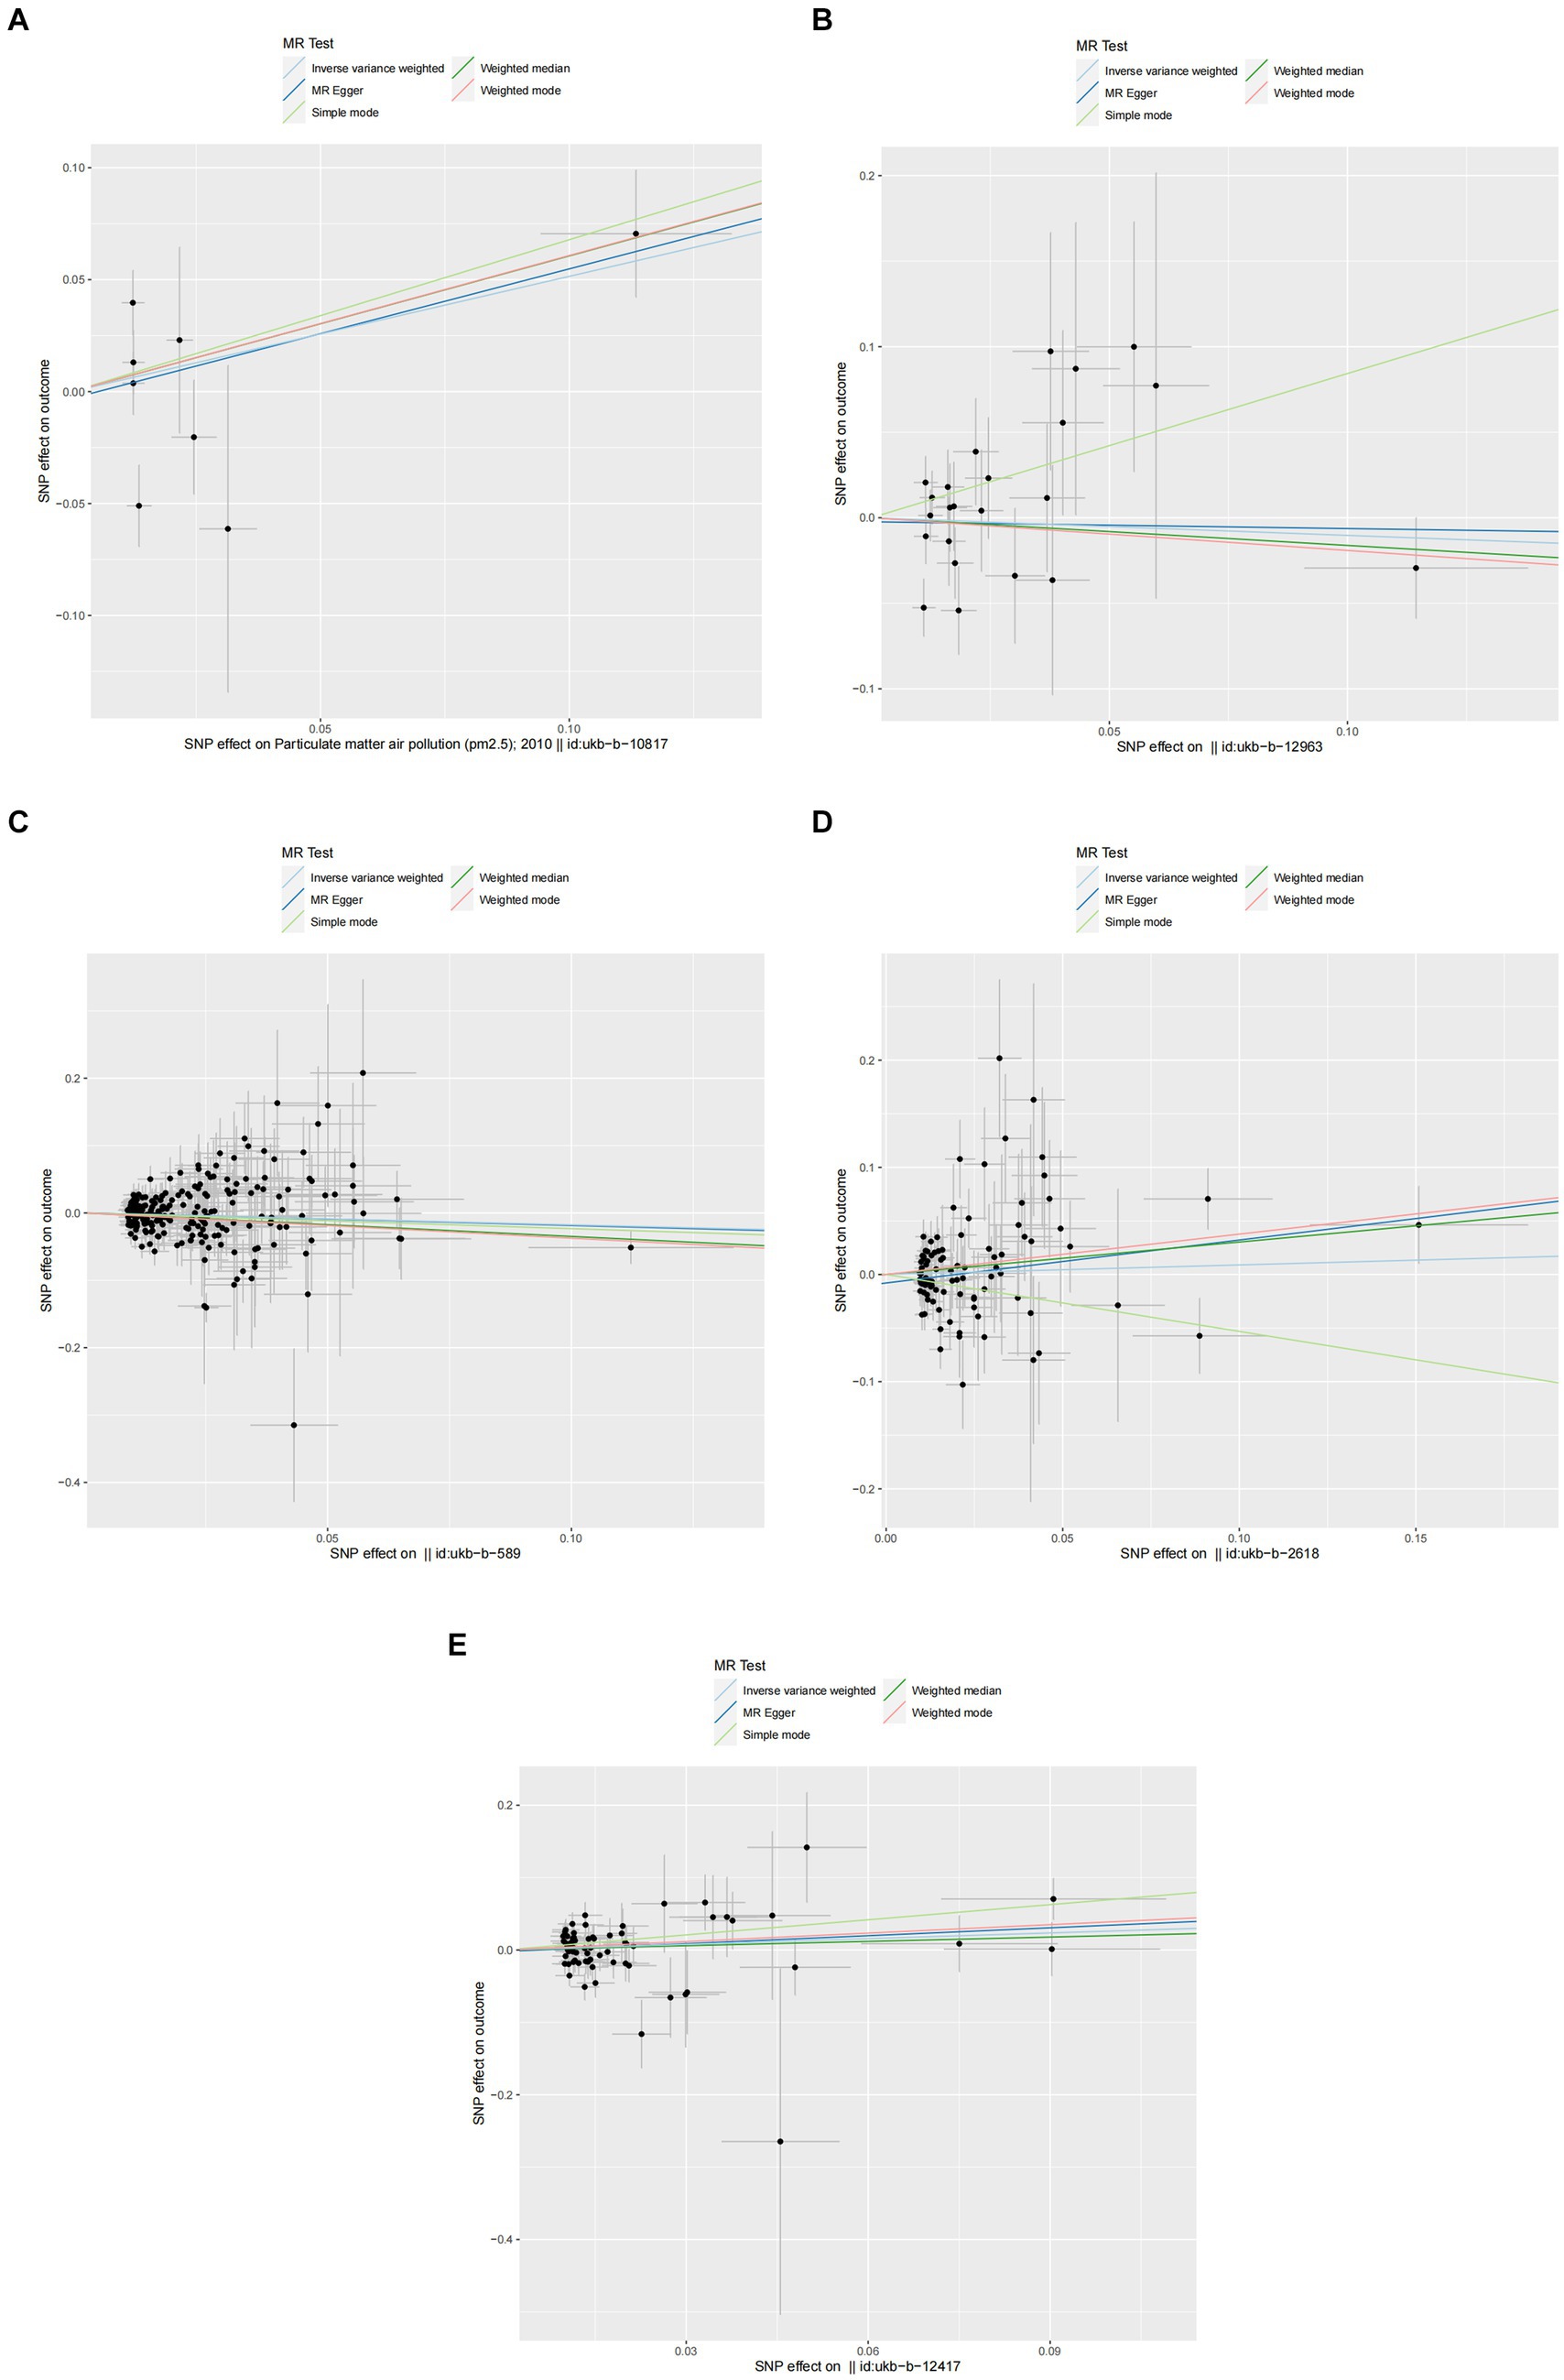
Figure 3. Scatter plots of SNPs associated with air pollution and allergic rhinitis. Each black point representing each SNP on the exposure (horizontal-axis) and on the outcome (vertical-axis) is plotted with error bars corresponding to each standard error (SE). The Mendelian randomization (MR) regression slopes of the lines represent the causal estimates using five approaches (inverse-variance weighted (IVW), MR-Egger, weighted median, simple mode, and weighted mode). (A) PM2.5. (B) PM2.5–10. (C) PM10. (D) Nitrogen dioxide. (E) Nitrogen oxides.
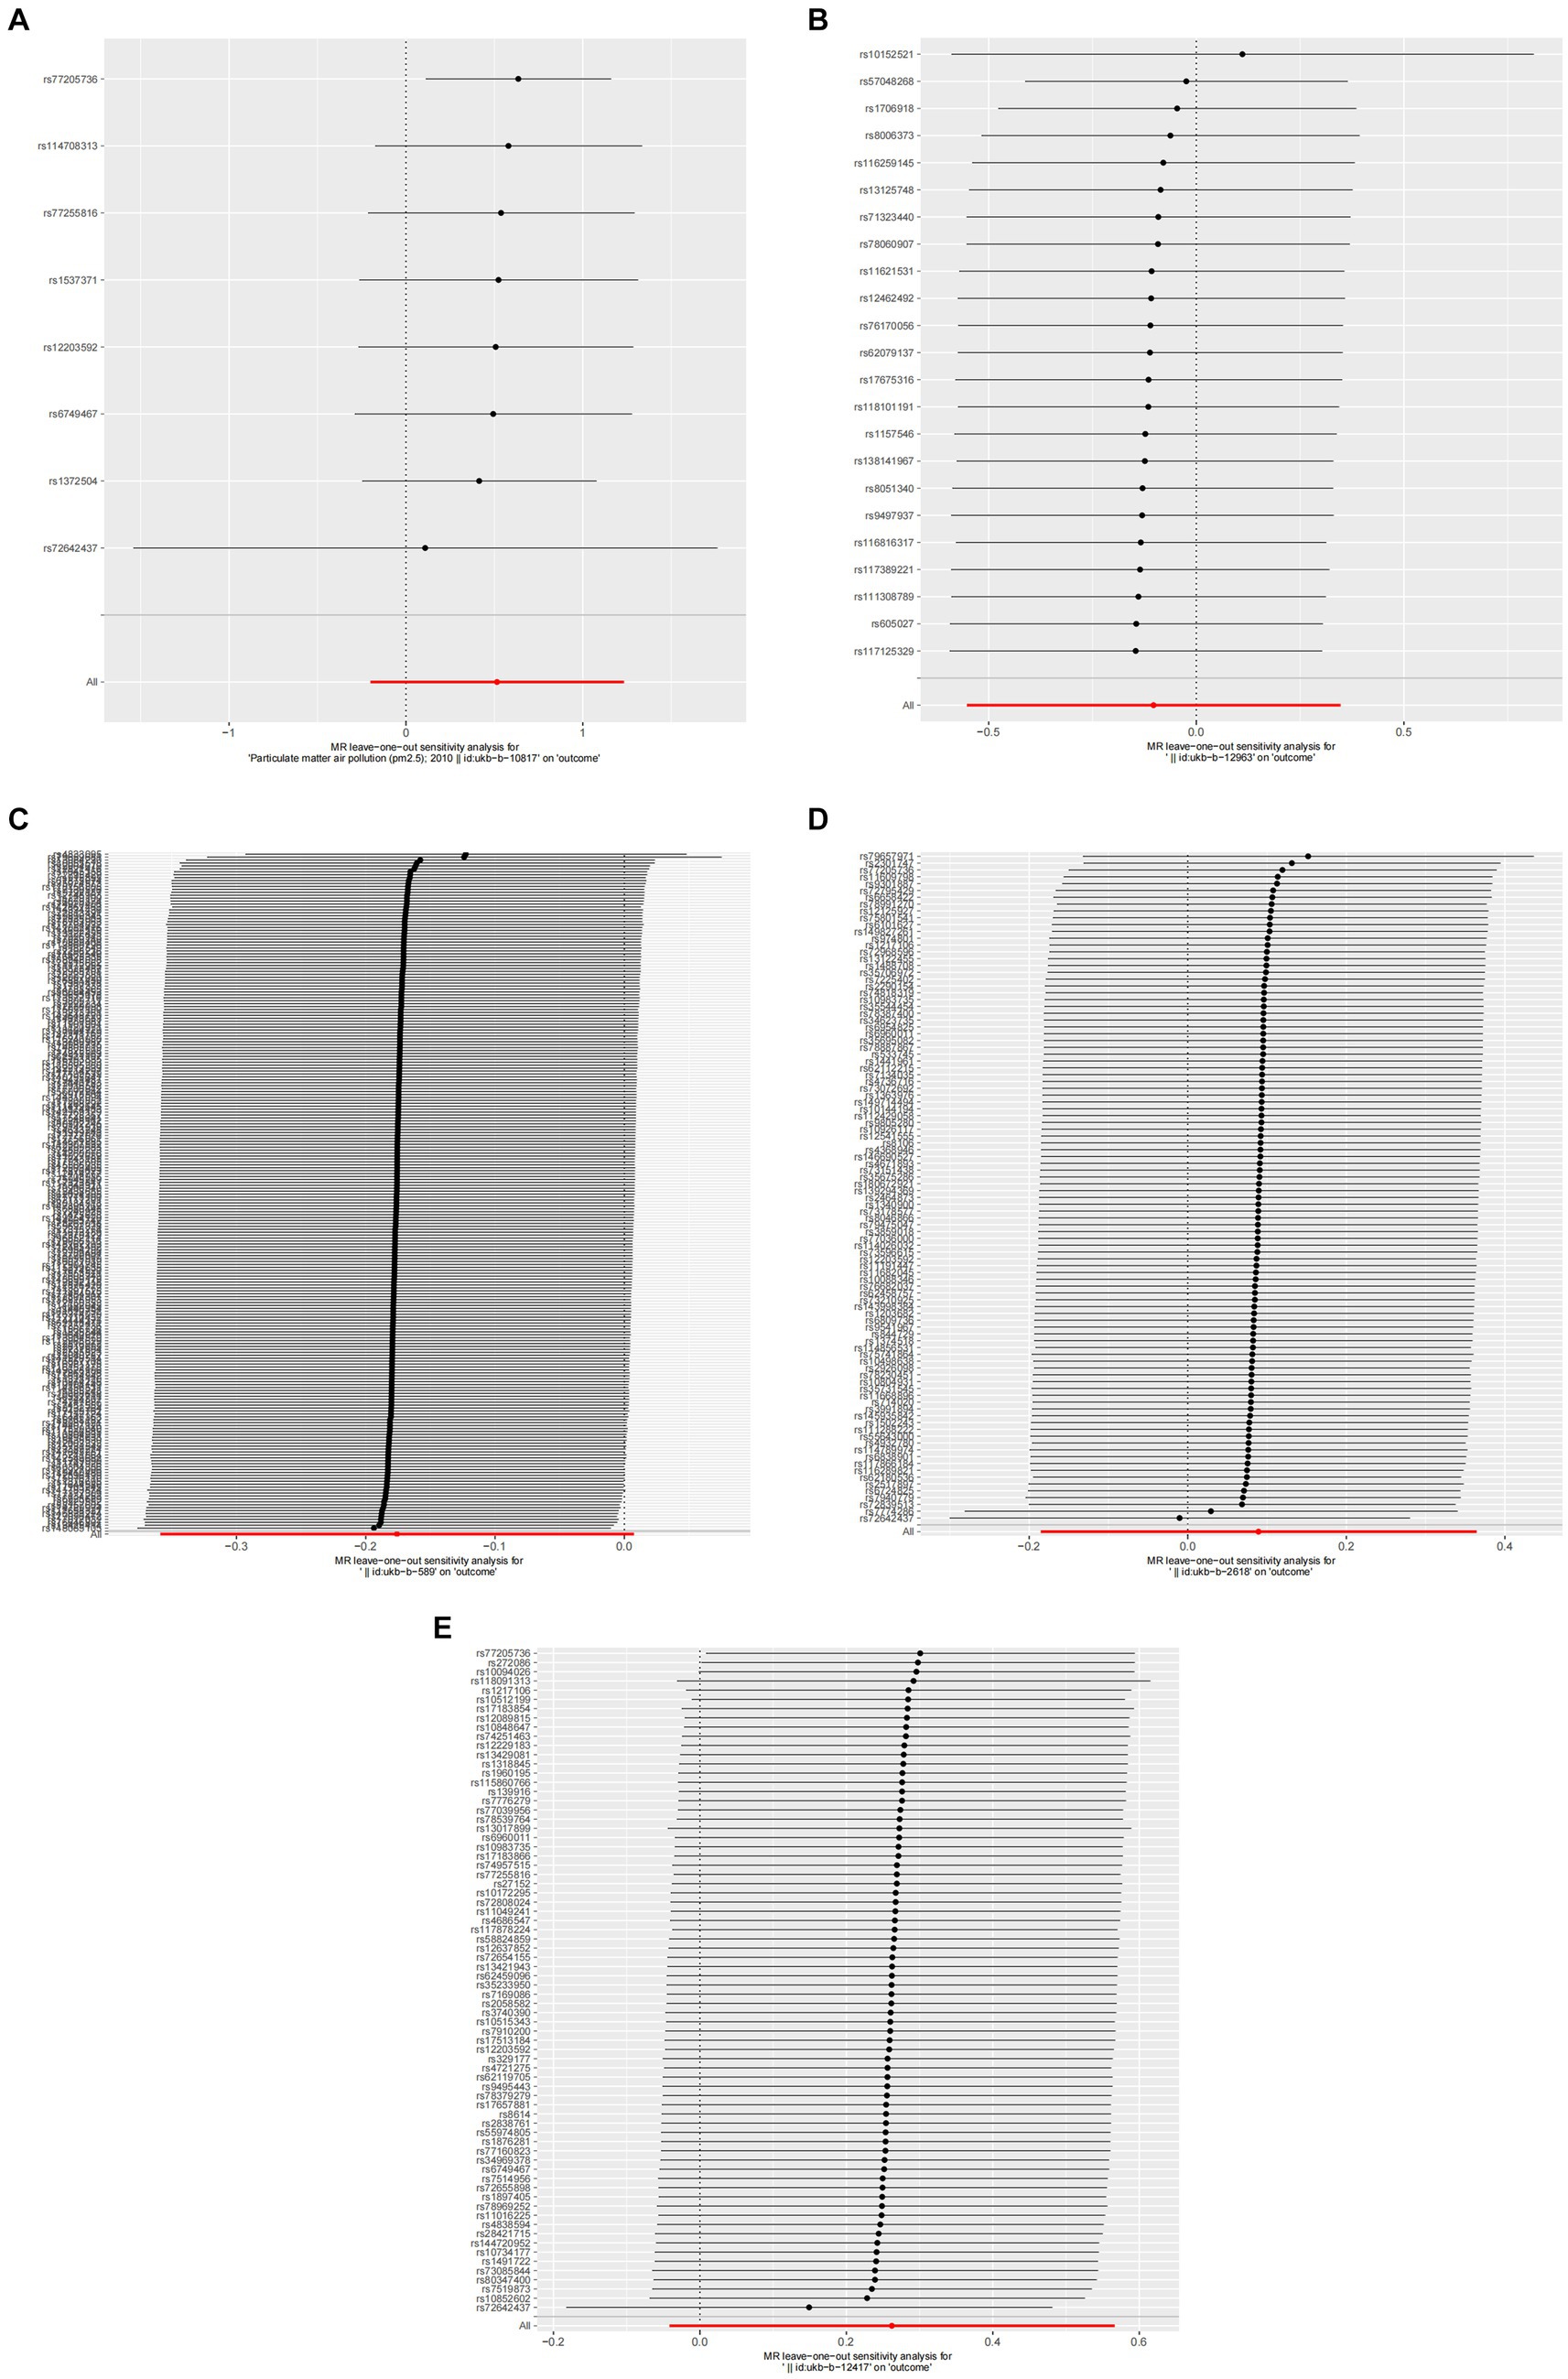
Figure 4. Forest plots of Leave-one-out analyses for causal SNP effect of air pollution on allergic rhinitis. The error bars indicate the 95% confidence interval (CI). (A) PM2.5; (B) PM2.5–10; (C) PM10; (D) Nitrogen dioxide; (E) Nitrogen oxides.
3.2.2 Asthma
In the core analysis utilizing the IVW method, our MR investigation revealed the following data on the impact of different air pollutants: For PM2.5 exposure, (OR = 1.281, 95% CI:0.762–2.153, p = 0.350); for PM2.5–10 exposure, (OR = 1.131, 95% CI:0.913–1.401, p = 0.259); for PM10 exposure, (OR = 0.625, 95% CI: 0.396–0.988, p = 0.044); for nitrogen dioxide exposure, (OR = 0.575, 95% CI:0.206–1.607, p = 0.291); and for nitrogen oxides exposure, (OR = 0.596, 95% CI:0.280–1.269, p = 0.180; referenced in Figure 2). These findings pinpointed a significant causal link specifically between PM10 exposure and an increased risk of asthma, highlighting that asthma risk escalates with each standard error increment in PM10 levels, as illustrated in Figures 2, 5, 6. Conversely, the study found no statistically significant causal connections between exposures to PM2.5, PM2.5–10, nitrogen dioxide, nitrogen oxides, and the incidence of asthma, as detailed in Figures 2, 5, 6.
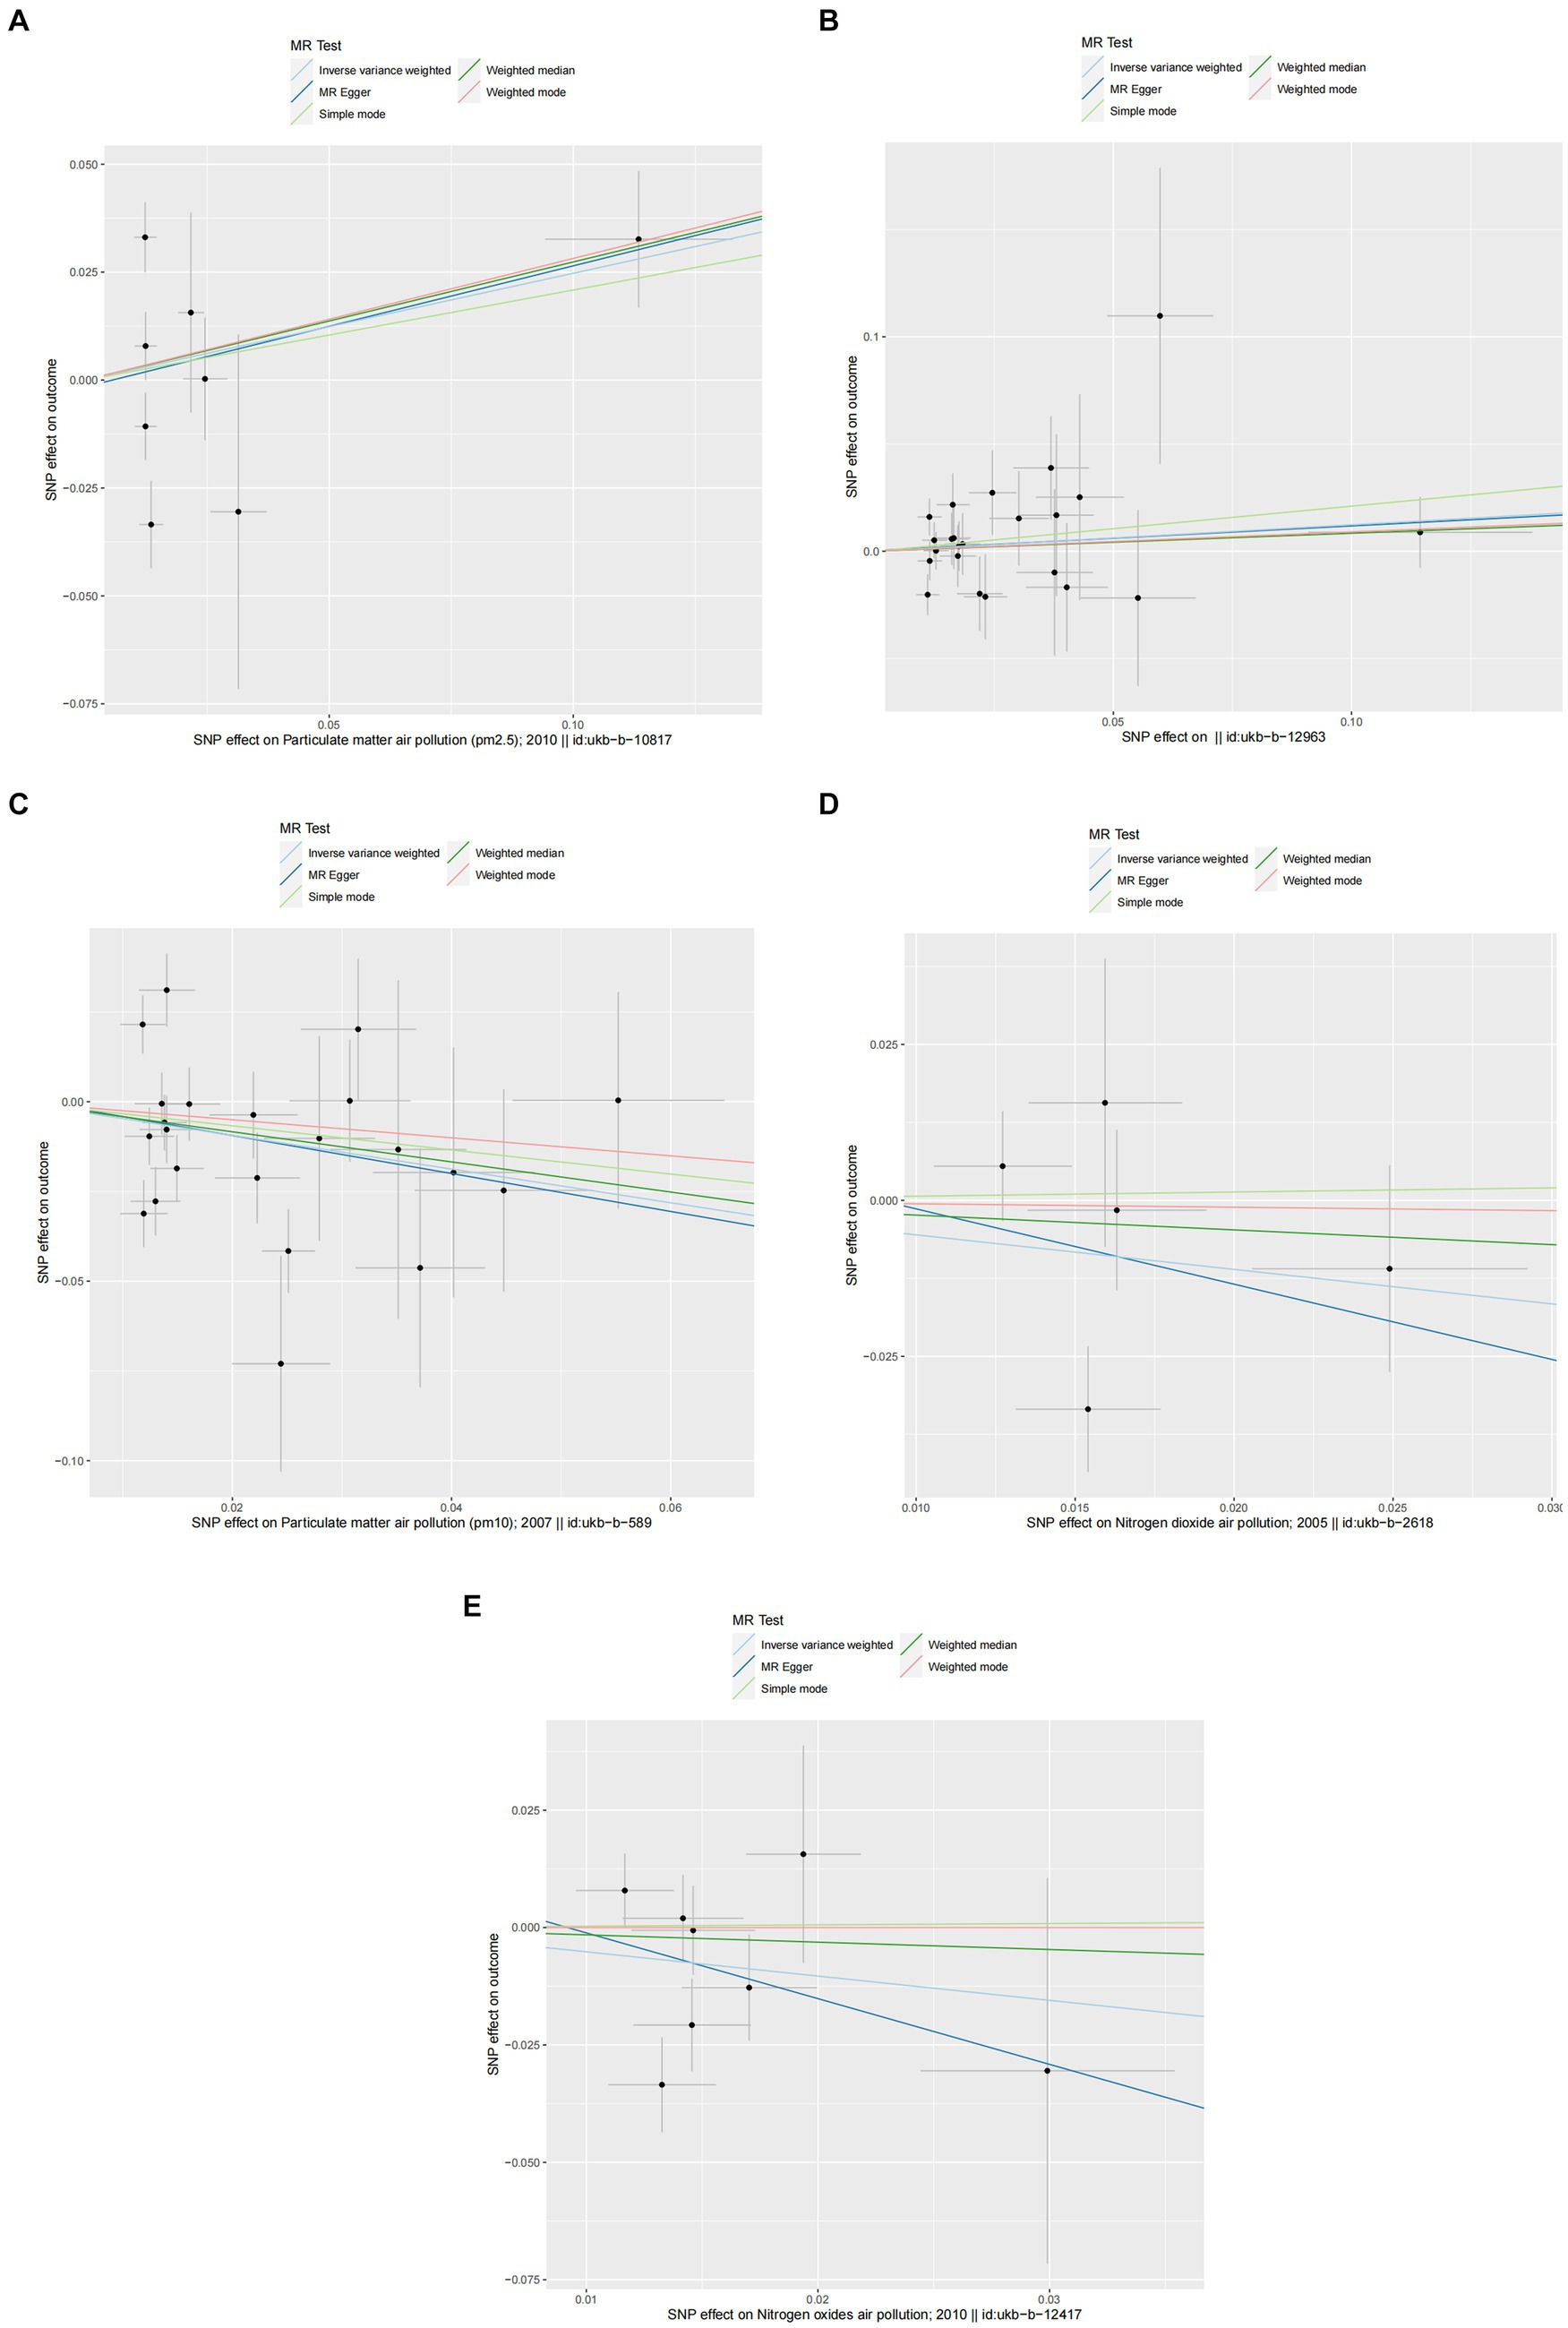
Figure 5. Scatter plots of SNPs associated with air pollution and asthma. Each black point representing each SNP on the exposure (horizontal-axis) and on the outcome (vertical-axis) is plotted with error bars corresponding to each standard error (SE). The Mendelian randomization (MR) regression slopes of the lines represent the causal estimates using five approaches (inverse-variance weighted (IVW), MR-Egger, weighted median, simple mode, and weighted mode). (A) PM2.5. (B) PM2.5–10. (C) PM10. (D) Nitrogen dioxide. (E) Nitrogen oxides.
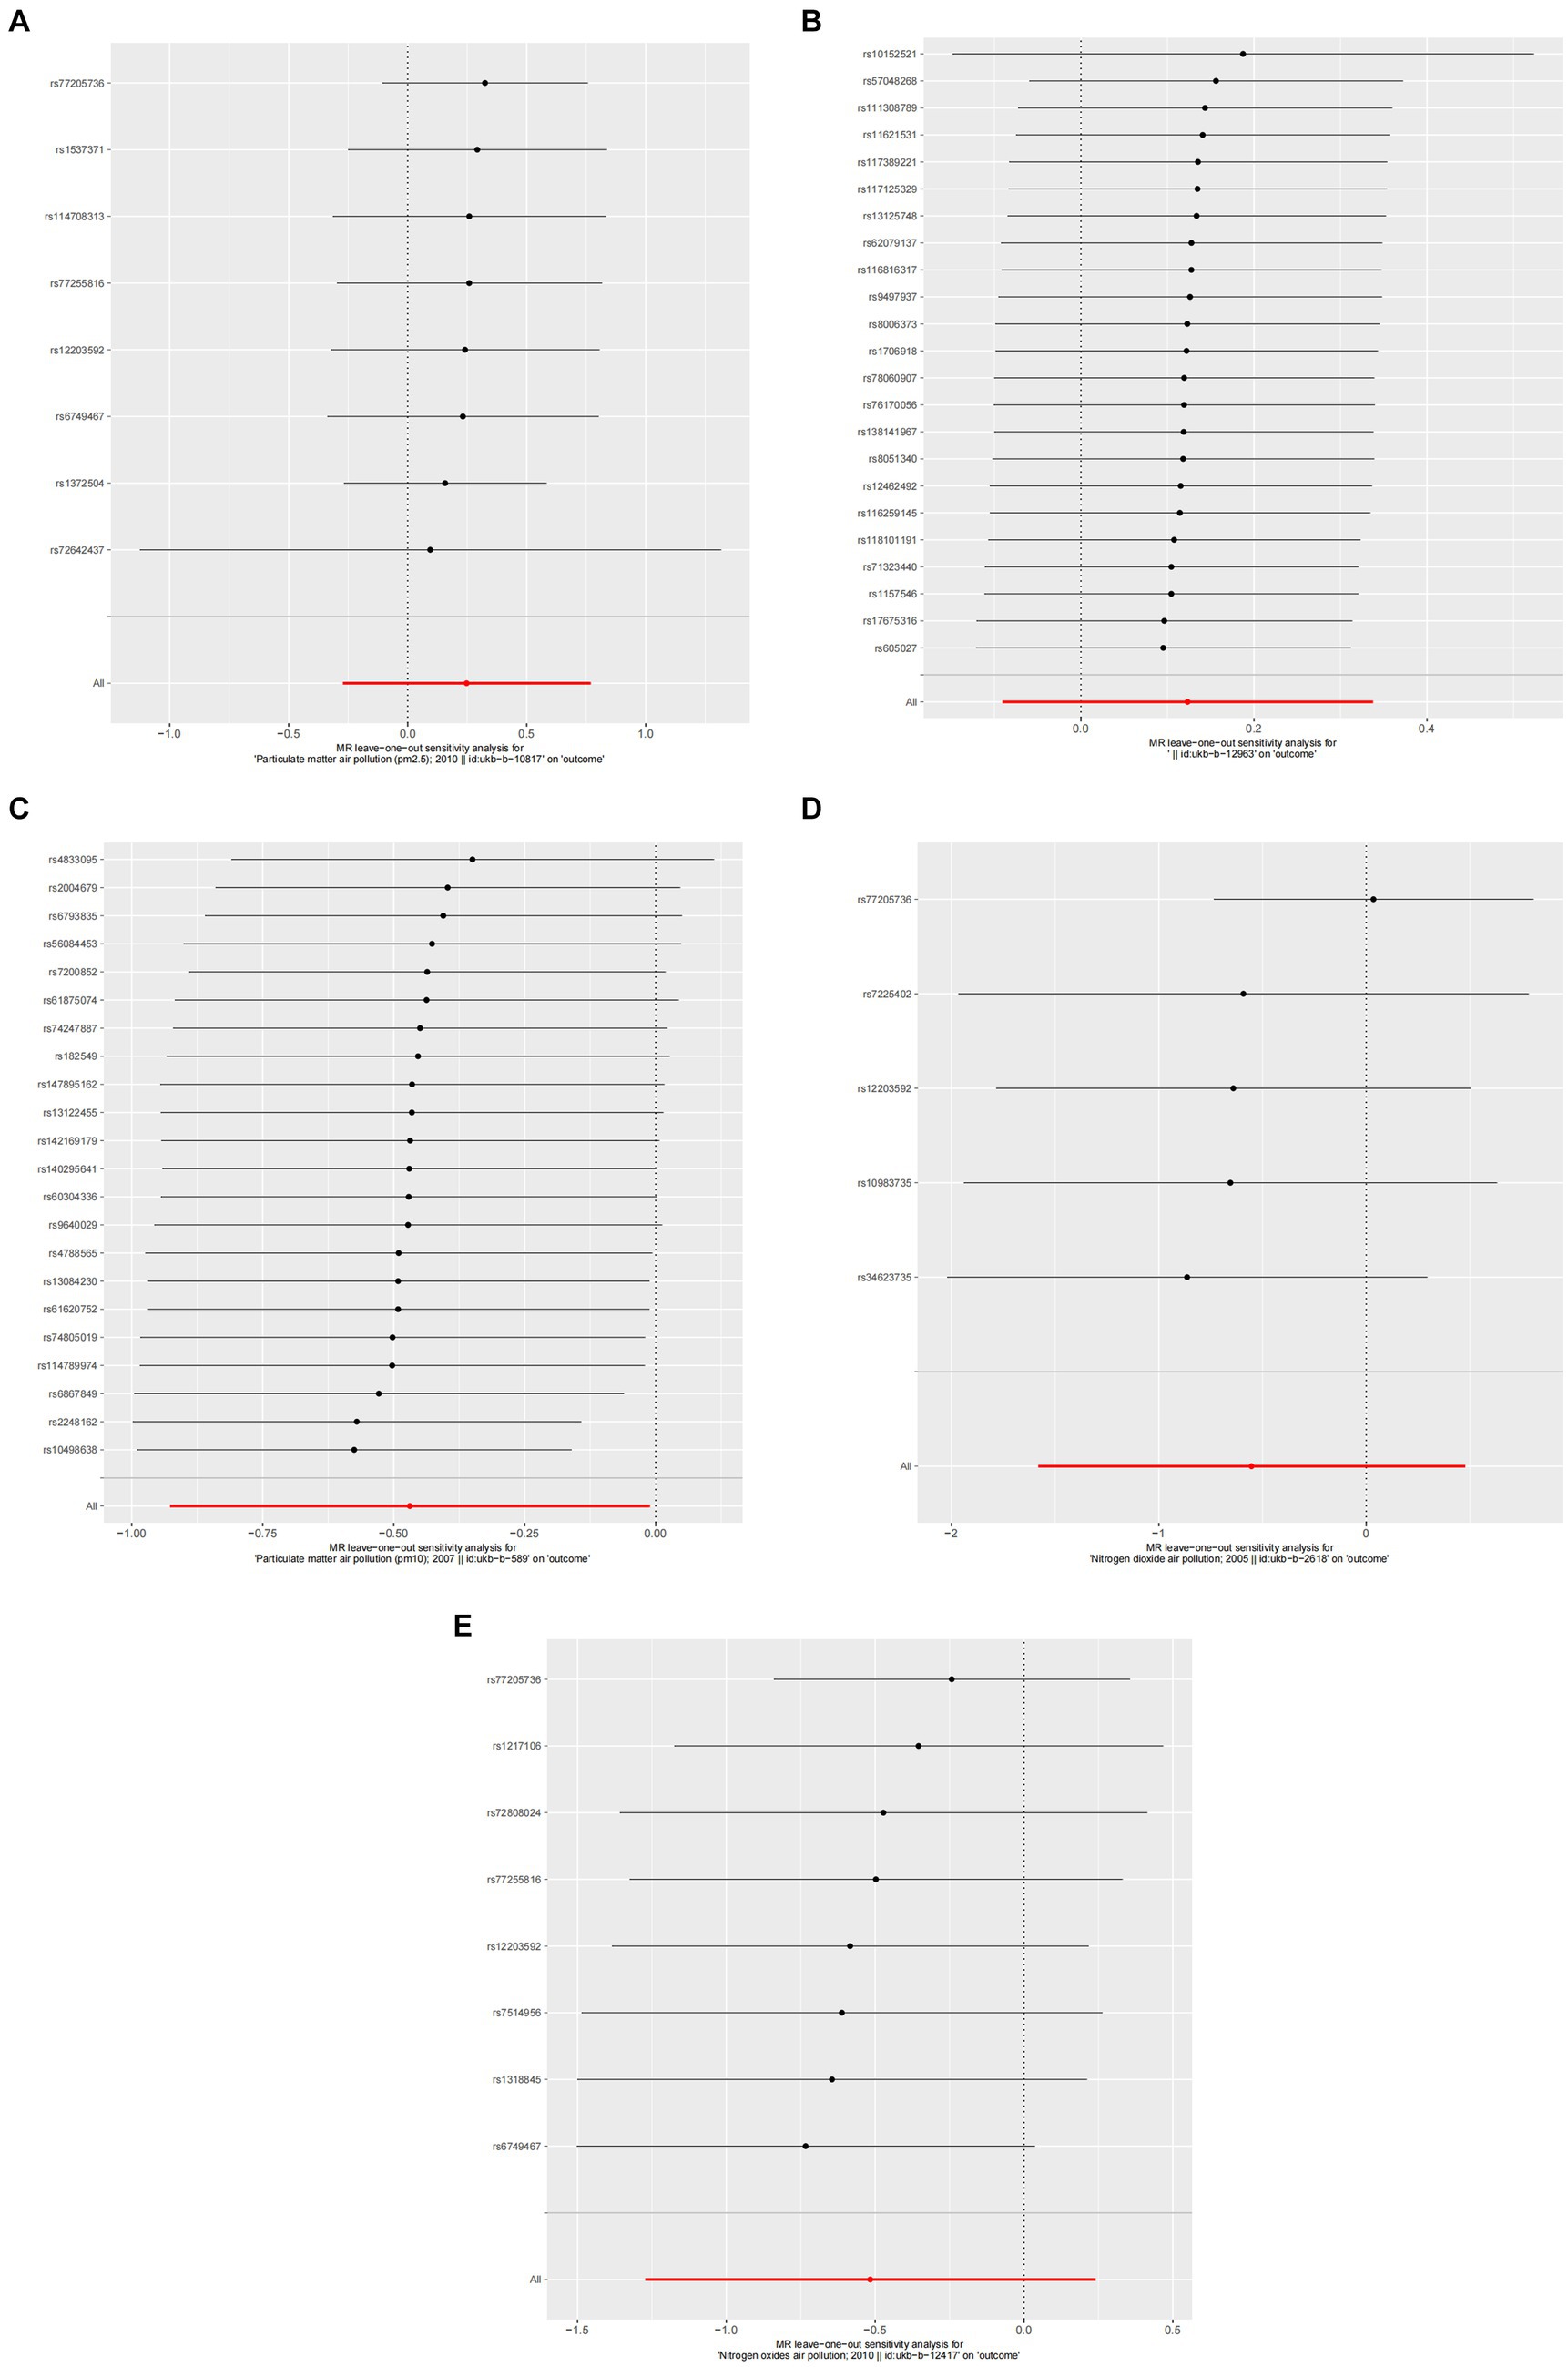
Figure 6. Forest plots of Leave-one-out analyses for causal SNP effect of air pollution on asthma. The error bars indicate the 95% confidence interval (CI). (A) PM2.5; (B) PM2.5–10; (C) PM10; (D) Nitrogen dioxide; (E) Nitrogen oxides.
3.3 Pleiotropy and heterogeneity analysis
The MR-Egger intercept test results for allergic rhinitis indicated the absence of pleiotropy (p > 0.05, as detailed in Table 2), suggesting that the SNPs associated with the exposures under investigation do not directly contribute to allergic rhinitis, independent of their exposure levels. The analysis also detected heterogeneity in the data for various pollutants (PM2.5: p = 0.089, Q = 18.789; PM2.5–10: p = 0.118, Q = 30.015; PM10: p = 0.088, Q = 283.967; nitrogen dioxide: p < 0.001, Q = 154.568; nitrogen oxides: p = 0.232, Q = 96.648, as seen in Table 2).
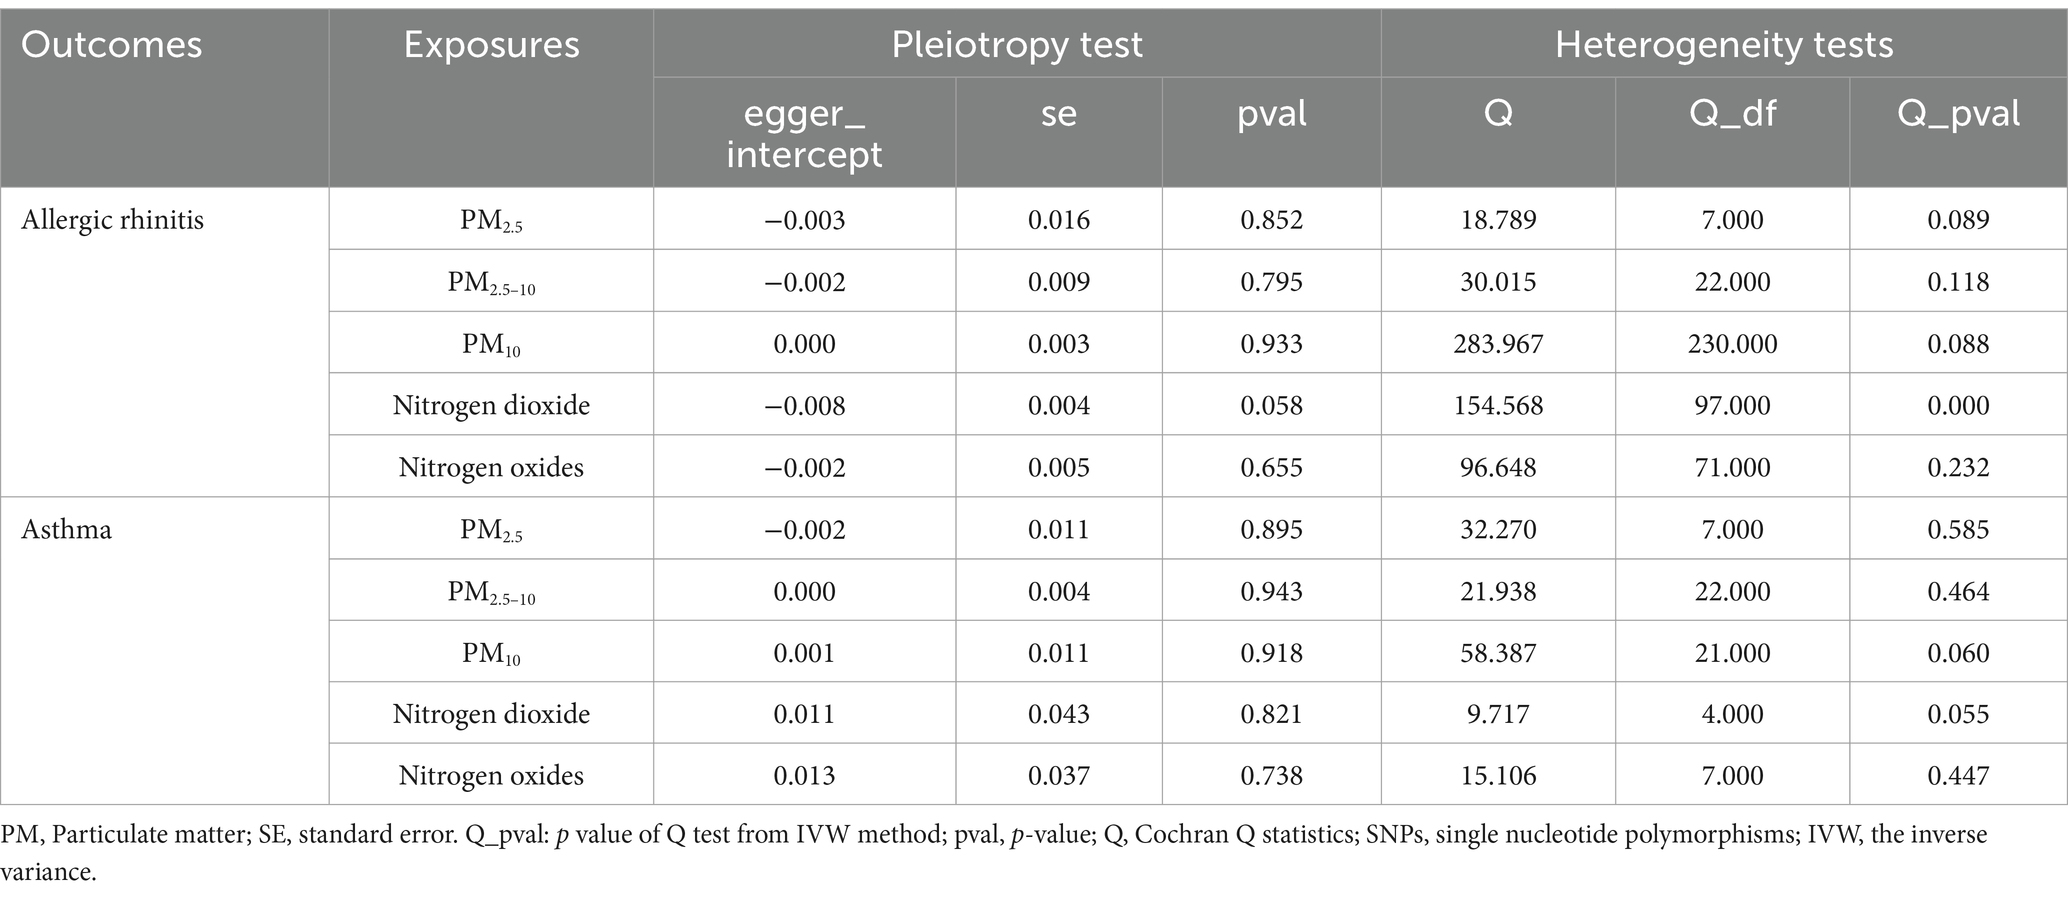
Table 2. Assessment of air pollution genetic determinants’ pleiotropy and heterogeneity in GWAS, targeting allergic rhinitis and asthma.
Similarly, for asthma, the MR-Egger intercept test results showed no signs of pleiotropy (p > 0.05, referenced in Table 2), indicating that the SNPs linked to the pollutants studied do not have a direct contribution to asthma, irrespective of their exposure levels. Heterogeneity was observed across the pollutants (PM2.5: p = 0.585, Q = 32.270; PM2.5–10: p = 0.464, Q = 21.938; PM10: p = 0.060, Q = 58.387; nitrogen dioxide: p = 0.055, Q = 9.717; nitrogen oxides: p = 0.447, Q = 15.106, as reported in Table 2).
3.4 Sensitivity analysis
A detailed sensitivity analysis was conducted on the MR study results. In the case of AR, scrutinizing the influence of each individual SNP across all examined exposures demonstrated minimal effect on the derived outcomes. This finding suggests that the removal of any single SNP did not substantially alter the computed overall causal effect estimates, as depicted in Figure 4. Regarding asthma, the leave-one-out sensitivity analysis, particularly focusing on the effect of PM10, revealed that the instrumental variable lines consistently appeared to the left of the zero mark. Importantly, the omission of any single SNP did not significantly change the results, as illustrated in Figure 6. These stable MR results underscore PM10 as a contributing risk factor for asthma. Furthermore, the analysis concerning other exposures similarly showed that the exclusion of each SNP, one at a time, had negligible effects on the outcomes. This consistency further reinforces that no individual SNP significantly influences the overall causal effect estimation, as shown in Figure 6.
4 Discussion
In our MR investigation, we explored the potential causal links between exposure to various forms of air pollution (including particulate matter sizes PM2.5 and PM2.5–10, as well as PM10, nitrogen dioxide, and nitrogen oxides) and respiratory conditions such as allergic rhinitis and asthma. The analysis did not demonstrate a causal connection between the specified air pollutants and the incidence of allergic rhinitis. Our analysis, employing the IVW approach, indicated that elevated levels of PM10 are linked to a heightened asthma risk within a European demographic. Specifically, an increase in PM10 by each standard deviation was associated with a rise in asthma risk, based on the selection of instrumental variables using a p-value threshold of less than 5 × 10⁻⁶ (OR = 0.625, 95% CI = 0.396–0.988). The IVW model presupposes the validity of all genetic instruments and the absence of horizontal pleiotropy. In essence, our findings reveal a significant causal connection between PM10 levels and the risk of developing asthma. Conversely, we observed no causal link between other pollutants and allergic rhinitis within the European context.
The investigation into the association between allergic respiratory ailments, namely asthma and allergic rhinitis, with air pollution, has been a focal point of scientific inquiry. The principle of “one airway-one disease” underscores a unified inflammatory process in both upper and lower airways, manifesting as allergic rhinitis and asthma, respectively. These disorders not only emerge from common triggers, displaying concurrent prevalence and benefiting from similar treatment strategies due to analogous etiological factors and inflammatory cell profiles, but also exhibit a nuanced relationship with air pollution (42). Our analysis diverges from the direct causal linkage for pollutants such as PM2.5–10, PM2.5, nitrogen dioxide, and nitrogen oxides with these respiratory conditions. Nonetheless, it aligns with existing epidemiological research pinpointing PM10 as a significant asthma risk factor. Illustratively, research conducted by Chuansha Wu et al. underscores the pronounced risk of childhood asthma associated with early-life exposure to PM10 in a cohort of children aged 3 to 6 years across several Chinese cities (43). Additional studies, including one by Betancourt and a Korean study focusing on PM10 exposure during pregnancy linked to asthma in offspring among 1,572 mother-infant pairs (44, 45), further validate PM10’s detrimental effects. A study involving a Southern Taiwanese adult population also found that individuals exposed to elevated PM10 levels experienced more severe asthma symptoms (46). In light of the scarcity of research on the genetic mechanisms underpinning the link between air pollution and asthma susceptibility, our study employed a two-sample Mendelian randomization technique. This approach unveiled a significant genetic causal relationship between PM10 exposure and an increased risk of developing asthma, thereby enriching the discourse on the interplay between air pollutants and asthma.
The pathways through which PM10 elevates asthma risk remain largely elusive. Research conducted by Matteo Bonato et al. revealed that acute exposure to elevated PM10 levels correlates with diminished IFN-β expression in airway epithelial cells, potentially facilitating heightened viral replication (47). Particulate matter (PM10) has a noticeable impact on asthma, but particles with a size of 2.5 or 2.5–10 not affected it. Animal research provided strong evidence on this issue. Asthmatic mice were studied to determine the effects of PM2.5 and PM10 on Th17 cell development (48). Conclusions Asthmatic mice exposed to PM10 exhibited a dramatic increase in lung bronchiole remodeling and inflammatory cell infiltration compared to those exposed to PM2.5, according to the study. Additionally, there was a notable rise in the release of the cytokines IL-17A, IL-21, IL-22, and IL-23 by Th17 cells. As a result, when asthma attacks first appear, PM10 is believed to have a more potent pro-inflammatory impact than PM2.5. In a separate study, Huang (49) sought to determine how healthy BALB/c mice’s immune systems responded to different sizes of particulate matter (PM10), specifically PM2.5, PM1, and PM0.1 samples. An asthma model in mice was used to assess the impact of PM on the sensitization phase. Mice given high doses of PM2.5 and medium or high doses of PM10 had considerably higher neutrophil percentages in blood-borne pathogen load (BLL). Additionally, when comparing the BALF samples of mice exposed to high doses of PM10 to those of the control and other treatment groups, higher amounts of TNF-α, IFN-γ, IL-5, IL-13, IL-17A, and IL-6 were discovered. Additionally, BALF analysis demonstrated that high dosages of PM10 alone raised inflammatory cytokine expression (IL-5 and IL-13), eosinophil counts, and percentages. No influence on eosinophilic inflammation was found in extensive examination of individual PM2.5, PM1, and PM0.1 samples. When comparing mice treated with high doses of PM10 to those in the control and other treatment groups, Huang found that, in BALF, neutrophils and expression levels of inflammatory cytokines (TNF-α, IFN-γ, and IL-6) were considerably elevated. In a similar vein, an earlier research study that examined healthy mice exposed to PM from six US cities at levels of 25 μg and 100 μg found that coarse PM caused greater lung inflammation than fine or ultrafine PM (50). Coarse PM and PM2.5–1 were similarly determined by Happo et al. (51) to be far more inflammatory than PM1. Coarse PM caused higher lung inflammation than fine and ultrafine PM when comparing mass in a comparable investigation that examined size-fractioned PM toxicity in samples taken close to and far from metropolitan roadways (52). The highest level of airway inflammation observed in PM10 may be due to chemical contents attached to PM10 (53), more biogenic components with high endotoxin contents (51), or enhanced metal constituents in PM10 (54). This is just one of several potential reasons why complex urban PM can have a wide variety of mixed effects.
While there is a substantial amount of data linking PM10 to asthma, current studies investigating the impact of air pollution on the start of AR in children (55) and adults (56) have shown conflicting results. A study in France involving 36,397 patients with AR found that air pollution did not affect the severity of rhinitis (57). Conversely, air pollutants such as O3, PM2.5, PM10, SO2, and NO2 were found to have a substantial impact on AR, according to a recent study in China that involved 12,868 instances of AR outpatients (58). A other study from 2023 found that there was a correlation between short-term exposure to PM2.5, PM10, SO2, NO2, and CO with an increase in AR clinic visits (59). This contentious matter can be explained by two primary factors. Firstly, the risk of AR is increased when allergens (pollen, fungal spores, etc.) mix with air pollutants (PM10, nitrogen oxides, etc.). According to reports, air pollutants not only affect the respiratory system directly, but they also interact with plants and fungi, making pollen (from plants like ragweed or cypress) and fungal spores more allergenic (60). Ragweed, for instance, developed more quickly, flowered earlier, and produced more pollen when grown in an urban environment with high CO2 concentrations as compared to ragweed grown in a rural area (61). New evidence suggests that contaminants can indirectly trigger allergen release by damaging cells directly (12). The bioactive chemicals included in pollen grains and fungal spores have the potential to cause inflammation and allergies (62, 63). Results may vary depending on the location due to differences in air pollution and allergens. Another possible reason could be the discrepancy in the measured levels of air contaminants. Data on air pollutants, including daily average concentrations of PM2.5, PM10, SO2, NO2, CO, and O3-8h (max), were sourced from the local Municipal Ecological Environmental Bureau in 12,868 cases study (58). It goes without saying that there is no one-size-fits-all degree of contamination exposure. Alternatively, in the Changsha study (55), the data on air pollutants were measured at monitoring stations using the standard methods established by the State Environmental Protection Agency of China. The researchers then estimated individual exposure to air pollution, with the concentrations of air pollutants at kindergartens being used to calculate the exposure of the children. This method is divided into two steps (55): first, calculate the daily average concentration for each kindergarten based on the daily concentrations from the four nearest monitoring stations; second, compute the monthly average concentration of air pollutants for each kindergarten as the daily average concentration for each month.
Studies have reported several approaches about how Compute the individual level of air pollutants. The use of measuring instruments and equipment is prevalent because it provides more precise results. To achieve the personal real-time 24-h PM2.5 exposure estimates in an APACR Study (64), researchers utilized a PM2.5 size-selective intake operated by a 1.5 L/min pump in conjunction with a personal DataRam (pDR, model 1,200, Thermo Scientific, Boston MA). Also, optical PM2.5 sensors (Zefan Technol., China) were used for real-time microenvironment air pollution measurement (65). In order to regulate the airflow rate through the PM measurement channel, each monitor is outfitted with a steady-speed fan and a laser scattering sensor (Plantower PMS7003, Beijing, China). Every home that participated in the study had a real-time PM2.5 monitor installed in the kitchen, living room, and bedroom. Other ways of estimating populations from individuals have also been documented. Data on particulate matter 2.5, particulate matter 10, nitric oxide, sulfur dioxide, and CO are collected hourly from 25 monitoring stations, one for each district, by the Seoul Research Institute of Public Health and Environment. We calculated the yearly air pollutants for everyone included by combining the participants’ most recent updated addresses with the average pollution level recorded at the monitoring sites (66). However, a greater number of confounding factors make it impossible to use either population-to-individual estimation or equipment data of air contaminants (67, 68). Our study does not establish a causal relationship between air pollution and allergic rhinitis. Investigating the potential correlation between an exposure and its subsequent effects is crucial to MR research, which relies on genetic data. Similar to how randomized controlled trials (RCTs) assign participants to either a treatment or control group, MR studies “randomize” genes based on one or more alleles that affect risk factors to see if there is a difference in disease risk between carriers and non-carriers. Genetic variants are inherited and do not change during a person’s lifetime, in contrast to the usual methods of observational studies that rely on questionnaires, biochemical markers, or imaging to determine exposure. That is why MR-derived associations are immune to confounding variables and causal inversion. As a result, our study provides a means to eliminate genetic confounding factors. This is a benefit of MR studies and a difference from earlier studies.
The study employs a MR framework, presenting distinct strengths. Initially, it utilizes genetic variations as markers for exposure levels to air pollution, aligning with Mendel’s principles of genetic segregation and independent assortment. This method significantly enhances the credibility of establishing a causal link between exposure to air pollutants and the incidence of asthma. Additionally, the genetic approach inherently eliminates the possibility of reverse causation, as the genetic predispositions exist prior to disease development. Furthermore, the study capitalizes on data aggregated from comprehensive GWAS, which encompass a vast array of samples, thereby reinforcing the statistical foundation of the findings. The consideration of participants primarily of European descent further mitigates the risk of confounding effects due to population stratification, ensuring a more focused analysis. This research effectively fills a critical gap in the existing body of epidemiological studies, offering a refined theoretical and practical framework to combat the health risks associated with air pollution.
Our investigation encounters certain limitations. Initially, to enhance the applicability of our findings, it is essential to conduct further studies involving populations from different countries. This necessity stems from the reliance on a GWAS dataset of European origin for the MR analyses, which may not reflect the associations in individuals from diverse ancestries. Secondly, the scarcity of SNPs meeting the genome-wide significance threshold of 5 × 10⁻⁸ led us to adopt a less stringent significance level of 5 × 10⁻⁶ for our results. Expanding the sample size could provide more robust support for our conclusions. Given the reliance on summary statistics from a MR study for our analysis, the findings suggesting a causal link between PM10 exposure and increased asthma risk remain provisional. It is imperative to conduct more comprehensive research to uncover the specific pathways through which PM10 influences the likelihood of developing asthma.
5 Conclusion
Our research contributes genetic evidence supporting the notion that heightened PM10 exposure correlates with an increased asthma risk. Asthma is a condition known for its progressive nature, tends to deteriorate over time; however, its adverse impacts are reversible, manageable, and preventable. Hence, this discovery holds significant implications for public health, highlighting the detrimental effects of PM10 on the well-being of European populations. It underscores the necessity for policymakers and the general public to recognize the critical need for air quality improvements. Furthermore, the findings lay a groundwork for governments and environmental agencies to enact stricter air quality regulations and initiatives aimed at curbing PM10 emissions. Moreover, this study paves the way for further investigations into the biological underpinnings, potential confounding variables, and additional environmental contributors that influence the delicate balance between PM10 exposure and asthma risk. Such research endeavors will advance our comprehension and clarification of the intricate causal dynamics at play.
Data availability statement
The original contributions presented in the study are included in the article/Supplementary material, further inquiries can be directed to the corresponding author.
Author contributions
JZ: Writing – original draft, Methodology, Data curation. WL: Writing – review & editing, Software, Investigation. SY: Writing – original draft, Resources, Project administration, Investigation, Formal analysis. YS: Writing – original draft, Supervision, Investigation, Data curation, Conceptualization. XL: Writing – review & editing, Writing – original draft, Supervision, Funding acquisition, Data curation.
Funding
The author(s) declare that financial support was received for the research, authorship, and/or publication of this article. This work was supported by National Natural Science Foundation of China (No. 82174198, 81774131); 2024 Provincial Science and Technology Project of Sichuan Provincial Science and Technology Department (Popular Science Works Creation Category) (No. 2024JDKP0125).
Acknowledgments
The authors thank the IEU Open GWAS project (https://gwas.mrcieu.ac.uk/datasets/) for providing open summary results data for the analyses.
Conflict of interest
The authors declare that the research was conducted in the absence of any commercial or financial relationships that could be construed as a potential conflict of interest.
Publisher’s note
All claims expressed in this article are solely those of the authors and do not necessarily represent those of their affiliated organizations, or those of the publisher, the editors and the reviewers. Any product that may be evaluated in this article, or claim that may be made by its manufacturer, is not guaranteed or endorsed by the publisher.
Supplementary material
The Supplementary material for this article can be found online at: https://www.frontiersin.org/articles/10.3389/fpubh.2024.1386341/full#supplementary-material
References
1. Di, Q, Wang, Y, Zanobetti, A, Wang, Y, Koutrakis, P, Choirat, C, et al. Air pollution and mortality in the Medicare population. N Engl J Med. (2017) 376:2513–22. doi: 10.1056/NEJMoa1702747
2. Jia, Y, Lin, Z, He, Z, Li, C, Zhang, Y, Wang, J, et al. Effect of air pollution on heart failure: systematic review and Meta-analysis. Environ Health Perspect. (2023) 131:76001. doi: 10.1289/EHP11506
3. Liu, F, Wang, Z, Wei, Y, Liu, R, Jiang, C, Gong, C, et al. The leading role of adsorbed lead in PM (2.5)-induced hippocampal neuronal apoptosis and synaptic damage. J Hazard Mater. (2021) 416:125867. doi: 10.1016/j.jhazmat.2021.125867
4. Liu, S, Lim, YH, Chen, J, Strak, M, Wolf, K, Weinmayr, G, et al. Long-term air pollution exposure and pneumonia-related mortality in a large pooled European cohort. Am J Respir Crit Care Med. (2022) 205:1429–39. doi: 10.1164/rccm.202106-1484OC
5. Konduracka, E, and Rostoff, P. Links between chronic exposure to outdoor air pollution and cardiovascular diseases: a review. Environ Chem Lett. (2022) 20:2971–88. doi: 10.1007/s10311-022-01450-9
6. Avellaneda-Gómez, C, Vivanco-Hidalgo, RM, Olmos, S, Lazcano, U, Valentin, A, Milà, C, et al. Air pollution and surrounding greenness in relation to ischemic stroke: a population-based cohort study. Environ Int. (2022) 161:107147. doi: 10.1016/j.envint.2022.107147
7. Duchesne, J, Gutierrez, LA, Carrière, I, Mura, T, Chen, J, Vienneau, D, et al. Exposure to ambient air pollution and cognitive decline: results of the prospective Three-City cohort study. Environ Int. (2022) 161:107118. doi: 10.1016/j.envint.2022.107118
8. Huang, Y, Zhu, M, Ji, M, Fan, J, Xie, J, Wei, X, et al. Air pollution, genetic factors, and the risk of lung Cancer: a prospective study in the UK biobank. Am J Respir Crit Care Med. (2021) 204:817–25. doi: 10.1164/rccm.202011-4063OC
9. Chin, WS, Pan, SC, Huang, CC, Chen, PJ, and Guo, YL. Exposure to air pollution and survival in follow-up after hepatocellular carcinoma. Liver Cancer. (2022) 11:474–82. doi: 10.1159/000525346
10. Deng, SZ, Jalaludin, BB, Antó, JM, Hess, JJ, and Huang, CR. Climate change, air pollution, and allergic respiratory diseases: a call to action for health professionals. Chin Med J. (2020) 133:1552–60. doi: 10.1097/CM9.0000000000000861
11. Pathak, JL, Yan, Y, Zhang, Q, Wang, L, and Ge, L. The role of oral microbiome in respiratory health and diseases. Respir Med. (2021) 185:106475. doi: 10.1016/j.rmed.2021.106475
12. Reinmuth-Selzle, K, Kampf, CJ, Lucas, K, Lang-Yona, N, Fröhlich-Nowoisky, J, Shiraiwa, M, et al. Air pollution and climate change effects on allergies in the Anthropocene: abundance, interaction, and modification of allergens and adjuvants. Environ Sci Technol. (2017) 51:4119–41. doi: 10.1021/acs.est.6b04908
13. D'Amato, M, Cecchi, L, Annesi-Maesano, I, and D'Amato, G. News on climate change, air pollution, and allergic triggers of asthma. J Investig Allergol Clin Immunol. (2018) 28:91–7. doi: 10.18176/jiaci.0228
14. Carlsten, C, Blomberg, A, Pui, M, Sandstrom, T, Wong, SW, Alexis, N, et al. Diesel exhaust augments allergen-induced lower airway inflammation in allergic individuals: a controlled human exposure study. Thorax. (2016) 71:35–44. doi: 10.1136/thoraxjnl-2015-207399
15. Han, X, Krempski, JW, and Nadeau, K. Advances and novel developments in mechanisms of allergic inflammation. Allergy. (2020) 75:3100–11. doi: 10.1111/all.14632
16. Rajaee, A, Masquelin, ME, and Pohlgeers, KM. Pediatric allergy: an overview. Prim Care. (2021) 48:517–30. doi: 10.1016/j.pop.2021.04.006
17. Siddiqui, ZA, Walker, A, Pirwani, MM, Tahiri, M, and Syed, I. Allergic rhinitis: diagnosis and management. Br J Hosp Med (Lond). (2022) 83:1–9. doi: 10.12968/hmed.2021.0570
18. Pang, K, Li, G, Li, M, Zhang, L, Fu, Q, Liu, K, et al. Prevalence and risk factors for allergic rhinitis in China: a systematic review and Meta-analysis. Evid Based Complement Alternat Med. (2022) 2022:1–14. doi: 10.1155/2022/7165627
19. Dierick, BJH, van der Molen, T, Flokstra-de Blok, BMJ, Muraro, A, Postma, MJ, Kocks, JWH, et al. Burden and socioeconomics of asthma, allergic rhinitis, atopic dermatitis and food allergy. Expert Rev Pharmacoecon Outcomes Res. (2020) 20:437–53. doi: 10.1080/14737167.2020.1819793
20. Papi, A, Brightling, C, Pedersen, SE, and Reddel, HK. Asthma. Lancet. (2018) 391:783–800. doi: 10.1016/S0140-6736(17)33311-1
21. Rehman, A, Amin, F, and Sadeeqa, S. Prevalence of asthma and its management: a review. J Pak Med Assoc. (2018) 68:1823–7.
22. Park, KH, Sim, DW, Lee, SC, Moon, S, Choe, E, Shin, H, et al. Effects of air purifiers on patients with allergic rhinitis: a multicenter, randomized, double-blind, and placebo-controlled study. Yonsei Med J. (2020) 61:689–97. doi: 10.3349/ymj.2020.61.8.689
23. Li, L, Zhang, L, Mo, JH, Li, YY, Xia, JY, Bai, XB, et al. Efficacy of indoor air purification in the treatment of Artemisia pollen-allergic rhinitis: a randomised, double-blind, clinical controlled trial. Clin Otolaryngol. (2020) 45:394–401. doi: 10.1111/coa.13514
24. Carlsten, C, Dybuncio, A, Becker, A, Chan-Yeung, M, and Brauer, M. Traffic-related air pollution and incident asthma in a high-risk birth cohort. Occup Environ Med. (2011) 68:291–5. doi: 10.1136/oem.2010.055152
25. Schildcrout, JS, Sheppard, L, Lumley, T, Slaughter, JC, Koenig, JQ, and Shapiro, GG. Ambient air pollution and asthma exacerbations in children: an eight-city analysis. Am J Epidemiol. (2006) 164:505–17. doi: 10.1093/aje/kwj225
26. Bowden, J, and Holmes, MV. Meta-analysis and Mendelian randomization: a review. Res Synth Methods. (2019) 10:486–96. doi: 10.1002/jrsm.1346
27. Davey Smith, G, and Hemani, G. Mendelian randomization: genetic anchors for causal inference in epidemiological studies. Hum Mol Genet. (2014) 23:R89–98. doi: 10.1093/hmg/ddu328
28. Bycroft, C, Freeman, C, Petkova, D, Band, G, Elliott, LT, Sharp, K, et al. The UK biobank resource with deep phenotyping and genomic data. Nature. (2018) 562:203–9. doi: 10.1038/s41586-018-0579-z
29. Kurki, MI, Karjalainen, J, Palta, P, Sipilä, TP, Kristiansson, K, Donner, KM, et al. FinnGen provides genetic insights from a well-phenotyped isolated population. Nature. (2023) 613:508–18. doi: 10.1038/s41586-022-05473-8
30. Si, S, Li, J, Tewara, MA, and Xue, F. Genetically determined chronic low-grade inflammation and hundreds of health outcomes in the UK biobank and the FinnGen population: a phenome-wide Mendelian randomization study. Front Immunol. (2021) 12:720876. doi: 10.3389/fimmu.2021.720876
31. Hemani, G, Zheng, J, Elsworth, B, Wade, KH, Haberland, V, Baird, D, et al. The MR-base platform supports systematic causal inference across the human phenome. eLife. (2018) 7:7. doi: 10.7554/eLife.34408
32. Wootton, RE, Lawn, RB, Millard, LAC, Davies, NM, Taylor, AE, Munafò, MR, et al. Evaluation of the causal effects between subjective wellbeing and cardiometabolic health: mendelian randomisation study. BMJ. (2018) 362:k3788. doi: 10.1136/bmj.k3788
33. Zhou, J, Ye, Z, Wei, P, Yi, F, Ouyang, M, Xiong, S, et al. Effect of basal metabolic rate on osteoporosis: a Mendelian randomization study. Front Public Health. (2023) 11:1096519. doi: 10.3389/fpubh.2023.1096519
34. Bowden, J, Del Greco, MF, Minelli, C, Davey Smith, G, Sheehan, NA, and Thompson, JR. Assessing the suitability of summary data for two-sample Mendelian randomization analyses using MR-egger regression: the role of the I2 statistic. Int J Epidemiol. (2016) 45:1961–74. doi: 10.1093/ije/dyw220
35. Burgess, S, and Thompson, SG. Avoiding bias from weak instruments in Mendelian randomization studies. Int J Epidemiol. (2011) 40:755–64. doi: 10.1093/ije/dyr036
36. Burgess, S, Butterworth, A, and Thompson, SG. Mendelian randomization analysis with multiple genetic variants using summarized data. Genet Epidemiol. (2013) 37:658–65. doi: 10.1002/gepi.21758
37. Bowden, J, Del Greco, MF, Minelli, C, Davey Smith, G, Sheehan, N, and Thompson, J. A framework for the investigation of pleiotropy in two-sample summary data Mendelian randomization. Stat Med. (2017) 36:1783–802. doi: 10.1002/sim.7221
38. Burgess, S, and Thompson, SG. Interpreting findings from Mendelian randomization using the MR-egger method. Eur J Epidemiol. (2017) 32:377–89. doi: 10.1007/s10654-017-0255-x
39. Bowden, J, del Greco, MF, Minelli, C, Zhao, Q, Lawlor, DA, Sheehan, NA, et al. Improving the accuracy of two-sample summary-data Mendelian randomization: moving beyond the NOME assumption. Int J Epidemiol. (2019) 48:728–42. doi: 10.1093/ije/dyy258
40. Verbanck, M, Chen, CY, Neale, B, and Do, R. Detection of widespread horizontal pleiotropy in causal relationships inferred from Mendelian randomization between complex traits and diseases. Nat Genet. (2018) 50:693–8. doi: 10.1038/s41588-018-0099-7
41. Nolte, IM . Metasubtract: an R-package to analytically produce leave-one-out metaanalysis GWAS summary statistics. Bioinformatics. (2020) 36:4521–2. doi: 10.1093/bioinformatics/btaa570
42. Paiva Ferreira, LKD, Paiva Ferreira, LAM, Monteiro, TM, Bezerra, GC, Bernardo, LR, and Piuvezam, MR. Combined allergic rhinitis and asthma syndrome (CARAS). Int Immunopharmacol. (2019) 74:105718. doi: 10.1016/j.intimp.2019.105718
43. Wu, C, Zhang, Y, Wei, J, Zhao, Z, Norbäck, D, Zhang, X, et al. Associations of early-life exposure to submicron particulate matter with childhood asthma and wheeze in China. JAMA Netw Open. (2022) 5:e2236003. doi: 10.1001/jamanetworkopen.2022.36003
44. Betancourt, A, Zapatero, A, Pola-Bibian, B, and Dominguez-Ortega, J. Impact of short-term exposure to below recommended PM10 pollution levels on asthma exacerbations. J Investig Allergol Clin Immunol. (2021) 31:439–40. doi: 10.18176/jiaci.0663
45. Kim, HB, Lim, H, Kim, S, Lee, SY, Kim, HC, Kang, MJ, et al. Particulate matter exposure during pregnancy increases risk of childhood asthma: modified by gender and NRF2 genotype. Asian Pac J Allergy Immunol. (2023) 41:220–6. doi: 10.12932/AP-120421-1109
46. Wu, TJ, Wu, CF, Chen, BY, Lee, YL, and Guo, YL. Age of asthma onset and vulnerability to ambient air pollution: an observational population-based study of adults from southern Taiwan. BMC Pulm Med. (2016) 16:54. doi: 10.1186/s12890-016-0218-0
47. Bonato, M, Gallo, E, Turrin, M, Bazzan, E, Baraldi, F, Saetta, M, et al. Air pollution exposure impairs airway epithelium IFN-β expression in pre-school children. Front Immunol. (2021) 12:731968. doi: 10.3389/fimmu.2021.731968
48. Ge, DD, Lian, Z, and Yang, YG. Effect of PM_(10) and PM_(2.5) on Th17 cell differentiation in asthmatic mice. Fujian J Med. (2023) 45:136–81.
49. Huang, KL, Liu, SY, Chou, CC, Lee, YH, and Cheng, TJ. The effect of size-segregated ambient particulate matter on Th1/Th2-like immune responses in mice. PLoS One. (2017) 12:e0173158. doi: 10.1371/journal.pone.0173158
50. Gilmour, MI, McGee, J, Duvall, RM, Dailey, L, Daniels, M, Boykin, E, et al. Comparative toxicity of size-fractionated airborne particulate matter obtained from different cities in the United States. Inhal Toxicol. (2007) 19:7–16. doi: 10.1080/08958370701490379
51. Happo, MS, Hirvonen, MR, Hälinen, AI, Jalava, PI, Pennanen, AS, Sillanpää, M, et al. Seasonal variation in chemical composition of size-segregated urban air particles and the inflammatory activity in the mouse lung. Inhal Toxicol. (2010) 22:17–32. doi: 10.3109/08958370902862426
52. Cho, SH, Tong, H, McGee, JK, Baldauf, RW, Krantz, QT, and Gilmour, MI. Comparative toxicity of size-fractionated airborne particulate matter collected at different distances from an urban highway. Environ Health Perspect. (2009) 117:1682–9. doi: 10.1289/ehp.0900730
53. Schlesinger, RB, and Cassee, F. Atmospheric secondary inorganic particulate matter: the toxicological perspective as a basis for health effects risk assessment. Inhal Toxicol. (2003) 15:197–235. doi: 10.1080/08958370304503
54. Dye, JA, Lehmann, JR, McGee, JK, Winsett, DW, Ledbetter, AD, Everitt, JI, et al. Acute pulmonary toxicity of particulate matter filter extracts in rats: coherence with epidemiologic studies in Utah Valley residents. Environ Health Perspect. (2001) 109:395–403. doi: 10.1289/ehp.01109s3395
55. Deng, Q, Lu, C, Yu, Y, Li, Y, Sundell, J, and Norbäck, D. Early life exposure to traffic-related air pollution and allergic rhinitis in preschool children. Respir Med. (2016) 121:67–73. doi: 10.1016/j.rmed.2016.10.016
56. Burte, E, Leynaert, B, Bono, R, Brunekreef, B, Bousquet, J, Carsin, AE, et al. Association between air pollution and rhinitis incidence in two European cohorts. Environ Int. (2018) 115:257–66. doi: 10.1016/j.envint.2018.03.021
57. Annesi-Maesano, I, Rouve, S, Desqueyroux, H, Jankovski, R, Klossek, JM, Thibaudon, M, et al. Grass pollen counts, air pollution levels and allergic rhinitis severity. Int Arch Allergy Immunol. (2012) 158:397–404. doi: 10.1159/000332964
58. Yang, D, Yan, Y, and Pu, K. The association between air pollutants and daily outpatient visits for allergic rhinitis: a time-series analysis based on distribution lag nonlinear model in Chongqing. China Risk Manag Healthc Policy. (2022) 15:1501–15. doi: 10.2147/RMHP.S373085
59. Wang, X, Gao, C, Xia, Y, Xu, X, Li, L, Liu, Y, et al. Effect of air pollutants and meteorological factors on daily outpatient visits of allergic rhinitis in Hohhot. China J Asthma Allergy. (2023) 16:1217–28. doi: 10.2147/JAA.S430062
60. Donders, TH, Hagemans, K, Dekker, SC, de Weger, LA, de Klerk, P, and Wagner-Cremer, F. Region-specific sensitivity of anemophilous pollen deposition to temperature and precipitation. PLoS One. (2014) 9:e104774. doi: 10.1371/journal.pone.0104774
61. Ziska, LH, Gebhard, DE, Frenz, DA, Faulkner, S, Singer, BD, and Straka, JG. Cities as harbingers of climate change: common ragweed, urbanization, and public health. J Allergy Clin Immunol. (2003) 111:290–5. doi: 10.1067/mai.2003.53
62. García-Mozo, H . Poaceae pollen as the leading aeroallergen worldwide: a review. Allergy. (2017) 72:1849–58. doi: 10.1111/all.13210
63. Carsin, A, Romain, T, Ranque, S, Reynaud-Gaubert, M, Dubus, JC, Mège, JL, et al. Aspergillus fumigatus in cystic fibrosis: an update on immune interactions and molecular diagnostics in allergic bronchopulmonary aspergillosis. Allergy. (2017) 72:1632–42. doi: 10.1111/all.13204
64. He, F, Shaffer, ML, Li, X, Rodriguez-Colon, S, Wolbrette, DL, Williams, R, et al. Individual-level PM₂.₅ exposure and the time course of impaired heart rate variability: the APACR study. J Expo Sci Environ Epidemiol. (2011) 21:65–73. doi: 10.1038/jes.2010.21
65. Li, Y, Wang, Y, Wang, J, Chen, L, Wang, Z, Feng, S, et al. Quantify individual variation of real-time PM2.5 exposure in urban Chinese homes based on a novel method. Indoor Air. (2022) 32:e12962. doi: 10.1111/ina.12962
66. Jo, S, Kim, YJ, Park, KW, Hwang, YS, Lee, SH, Kim, BJ, et al. Association of NO2 and other air pollution exposures with the risk of Parkinson disease. JAMA Neurol. (2021) 78:800–8. doi: 10.1001/jamaneurol.2021.1335
67. Ziello, C, Sparks, TH, Estrella, N, Belmonte, J, Bergmann, KC, Bucher, E, et al. Changes to airborne pollen counts across Europe. PLoS One. (2012) 7:e34076. doi: 10.1371/journal.pone.0034076
Keywords: air pollution, allergic rhinitis, asthma, Mendelian randomization, air pollutants
Citation: Zhong J, Li W, Yang S, Shen Y and Li X (2024) Causal association between air pollution and allergic rhinitis, asthma: a Mendelian randomization study. Front. Public Health. 12:1386341. doi: 10.3389/fpubh.2024.1386341
Edited by:
Herberto Jose Chong-Neto, Federal University of Paraná, BrazilReviewed by:
Linjing Deng, Jiangsu University, ChinaMohd Faiz Ibrahim, Ministry of Health, Malaysia
Nuray Bayar Muluk, Kırıkkale University, Türkiye
Copyright © 2024 Zhong, Li, Yang, Shen and Li. This is an open-access article distributed under the terms of the Creative Commons Attribution License (CC BY). The use, distribution or reproduction in other forums is permitted, provided the original author(s) and the copyright owner(s) are credited and that the original publication in this journal is cited, in accordance with accepted academic practice. No use, distribution or reproduction is permitted which does not comply with these terms.
*Correspondence: Xinrong Li, amz.3@163.com
†These authors have contributed equally to this work and share first authorship