
94% of researchers rate our articles as excellent or good
Learn more about the work of our research integrity team to safeguard the quality of each article we publish.
Find out more
ORIGINAL RESEARCH article
Front. Public Health, 05 June 2024
Sec. Health Economics
Volume 12 - 2024 | https://doi.org/10.3389/fpubh.2024.1384729
This article is part of the Research TopicGender Inequalities, Sexual and Reproductive Health, and Sustainable Development in the Global SouthView all 10 articles
 Asebe Hagos1*
 Misganaw Guadie Tiruneh1
 Kaleab Mesfin Abera2
 Yawkal Tsega3
 Abel Endawkie4
 Wubshet Debebe Negash1Amare Mesfin Workie5
 Lamrot Yohannes6
 Mihret Getnet7,8
 Nigusu Worku1Adina Yeshambel Belay1
 Lakew Asmare4Hiwot Tadesse Alemu1Demiss Mulatu Geberu1
 Kaleb Assegid Demissie1
 Melak Jejaw1
Background: Addressing health inequity is a top priority for achieving sustainable development goals. The existing evidences in Ethiopia have shown that there are substantial inequalities in the use of health services among various socioeconomic strata. Therefore, the present study aimed to measure socioeconomic inequalities and the contributing factors in postnatal health checks for newborns in Ethiopia.
Methods: We used a secondary data from the recent 2019 Ethiopia Mini Demographic and Health Survey dataset. The study includes a weighted sample of 2,105 women who gave birth in the 2 years preceding to the survey. The study participants were selected using two stage cluster sampling techniques. The socioeconomic inequality in postnatal health checks for newborns was measured using the Erreygers Normalized Concentration Index (ECI) and illustrated by the concentration curve. A decomposition analysis was done to identify factors contributing to the socioeconomic related inequality in postnatal health checks for newborns in Ethiopia.
Results: The concentration curve of postnatal health checks for newborns lay below the line of equality, and the Erreygers normalized concentration index was 0.133, with a standard error = 0.0333, and a p value <0.001; indicating that the postnatal health check for newborns was disproportionately concentrated among newborns with higher socioeconomic status. The decomposition analysis reported that antenatal care (ANC) visit (59.22%), household wealth index (34.43%), and educational level of the mother (8.58%) were the major contributors to the pro-rich socioeconomic inequalities in postnatal health checks for newborns.
Conclusion: The finding revealed that there is a pro-rich inequality in postnatal health checks for newborns in Ethiopia. To reduce the observed socioeconomic health inequality, the government needs to improve ANC visits, implement strategies to access health service for economically disadvantaged groups, and increase educational attainment among women.
Globally, there has been a substantial improvement in child survival and newborn health during the last 30 years. The number of neonatal deaths fell from 5 million to 2.3 million between 1990 and 2021, and the neonatal mortality rate was reduced by more than half, from 37 to 18 deaths per 1,000 live births. In 2019, approximately 6,700 neonatal deaths occur each day, accounting for 47% of all child mortality under the age of five (1–3). According to 2019 world health organization (WHO) report, neonatal mortality rates (NMRs) vary greatly throughout the world; from 0.9 in Japan, to 44 deaths per 1,000 live births in Pakistan and nearly 75% of newborn deaths occur in Southern Asia and sub-Saharan Africa (4, 5). Globally, in 2020, five countries accounted for more than half of all newborn deaths, which means the number of newborn deaths was reported at 468,000 in India; 277,000 in Nigeria, 257,000 in Pakistan, 106,000 in the Democratic Republic of the Congo, and 104,000 in Ethiopia (2).
According to the 2019 Ethiopia Minin Demographic Health Survey (EMDHS), NMR increased in Ethiopia from 29/1000 in 2016 to 33/1000 in 2019 (6). Moreover, greater disparities in NMR were observed among regions, with particularly high mortality rates in the Benishangul-Gumuz and Somali regions (7). The disparities in NMR were much more increased on the basis of educational level, residence, and wealth status (7, 8).
Studies on neonatal mortality report that about half of newborn deaths occur within the first 2 days of life (3, 9). Such evidence suggests newborns are most vulnerable during the first hours and days of life. Postnatal health checks for newborns within 2 days after birth are very important to provide essential newborn care and to detect any neonatal complications early (1, 6). Studies in Ethiopia showed that the proportion of newborns receiving adequate content of postnatal health checks ranged from 8 to 16% (10–13). Additionally, another study reported that 84.3% of newborns did not receive postnatal health checks within 2 days after birth (14). Based on the 2019 EMDHS report, within the past 20 years, Ethiopia has made impressive progress on a number of maternal and child health indicators. However, the socioeconomic inequalities in health service coverage and utilization have persisted over the past two decades between rural and urban populations, as well as between the wealthiest and poorest (6, 15).
Health outcomes are significantly influenced by social, economic, and environmental factors. Disparities in health outcomes are caused by these factors, which are typically distributed unevenly across socioeconomic groups (16). Currently, health inequality is a global concern and has become a health policy goal in the health system (17). Health inequalities are observable differences in health between subgroups of a population. Subgroups can be defined by demographic, geographic, or socioeconomic factors such as age, economic status, education, place of residence, and sex (18).
Every child has the right to survive, according to the United Nations Convention on the Rights of the Child. This comprises the most vulnerable newborns residing in disadvantaged communities. From the standpoint of public health, the most vulnerable newborns are those who are born into marginalized communities, such as rural residents, urban slums, and those with poor socioeconomic status, who are most likely to die (4). Studies have reported that there has been a growing concern related to inequalities in maternal health service utilization and postnatal health checks and newborn in various regions of the world (19).
Currently, the utilization of postnatal health care services is not fairly distributed in low and middle income countries, and it varies significantly on the basis of socioeconomic status (20). In Ethiopia, studies have described the existence of substantial inequality in the utilization of health services including postnatal health checks across socioeconomic groups (7, 12, 21). Findings from southwest Ethiopia highlighted that neonatal health service utilization was highly concentrated among newborns from educated mothers and households (21). Likewise, another research also found that the quality of postnatal newborn care is more prevalent among newborns from higher socioeconomic households (12).
The government of Ethiopia has developed a national health equity strategic plan to address the issue of inequality in health and ensure that no one is left behind. Consequently, having recent data on the level of inequality is vital to enhance effort toward narrowing the inequality across socioeconomic strata. However, the level of socioeconomic related health inequality in postnatal health checks for newborns and the contributing factors for the socioeconomic inequalities have not been well investigated in Ethiopia. Furthermore, to the best of our knowledge, no studies have been conducted to measure socioeconomic inequality in postnatal health checks for newborns in Ethiopia using the 2019 EMDHS data.
Therefore, this study aimed to measure socioeconomic inequalities and the contributing factors in postnatal health checks for newborns in Ethiopia. The findings of this study can help policy makers and health managers to formulate evidence-driven approaches to reduce socioeconomic inequality in postnatal health checks for newborns in Ethiopia.
Currently, Ethiopia has 12 administrative regions and two city administrations. Ethiopia’s population is estimated to be 126 million people, making it the second most populous country in Africa (22). For this study, we used data from the 2019 EMDHS dataset. EMDHS is a nationally representative household survey and was conducted from March 21 to June 28, 2019. The survey was carried out to provide updated information on selected maternal and child health outcomes.
Women between the ages of 15 and 49 who had given birth in the 2 years before the survey in the selected enumeration areas (EAs) were the study population. The study included 2,105 weighted samples (Figure 1).
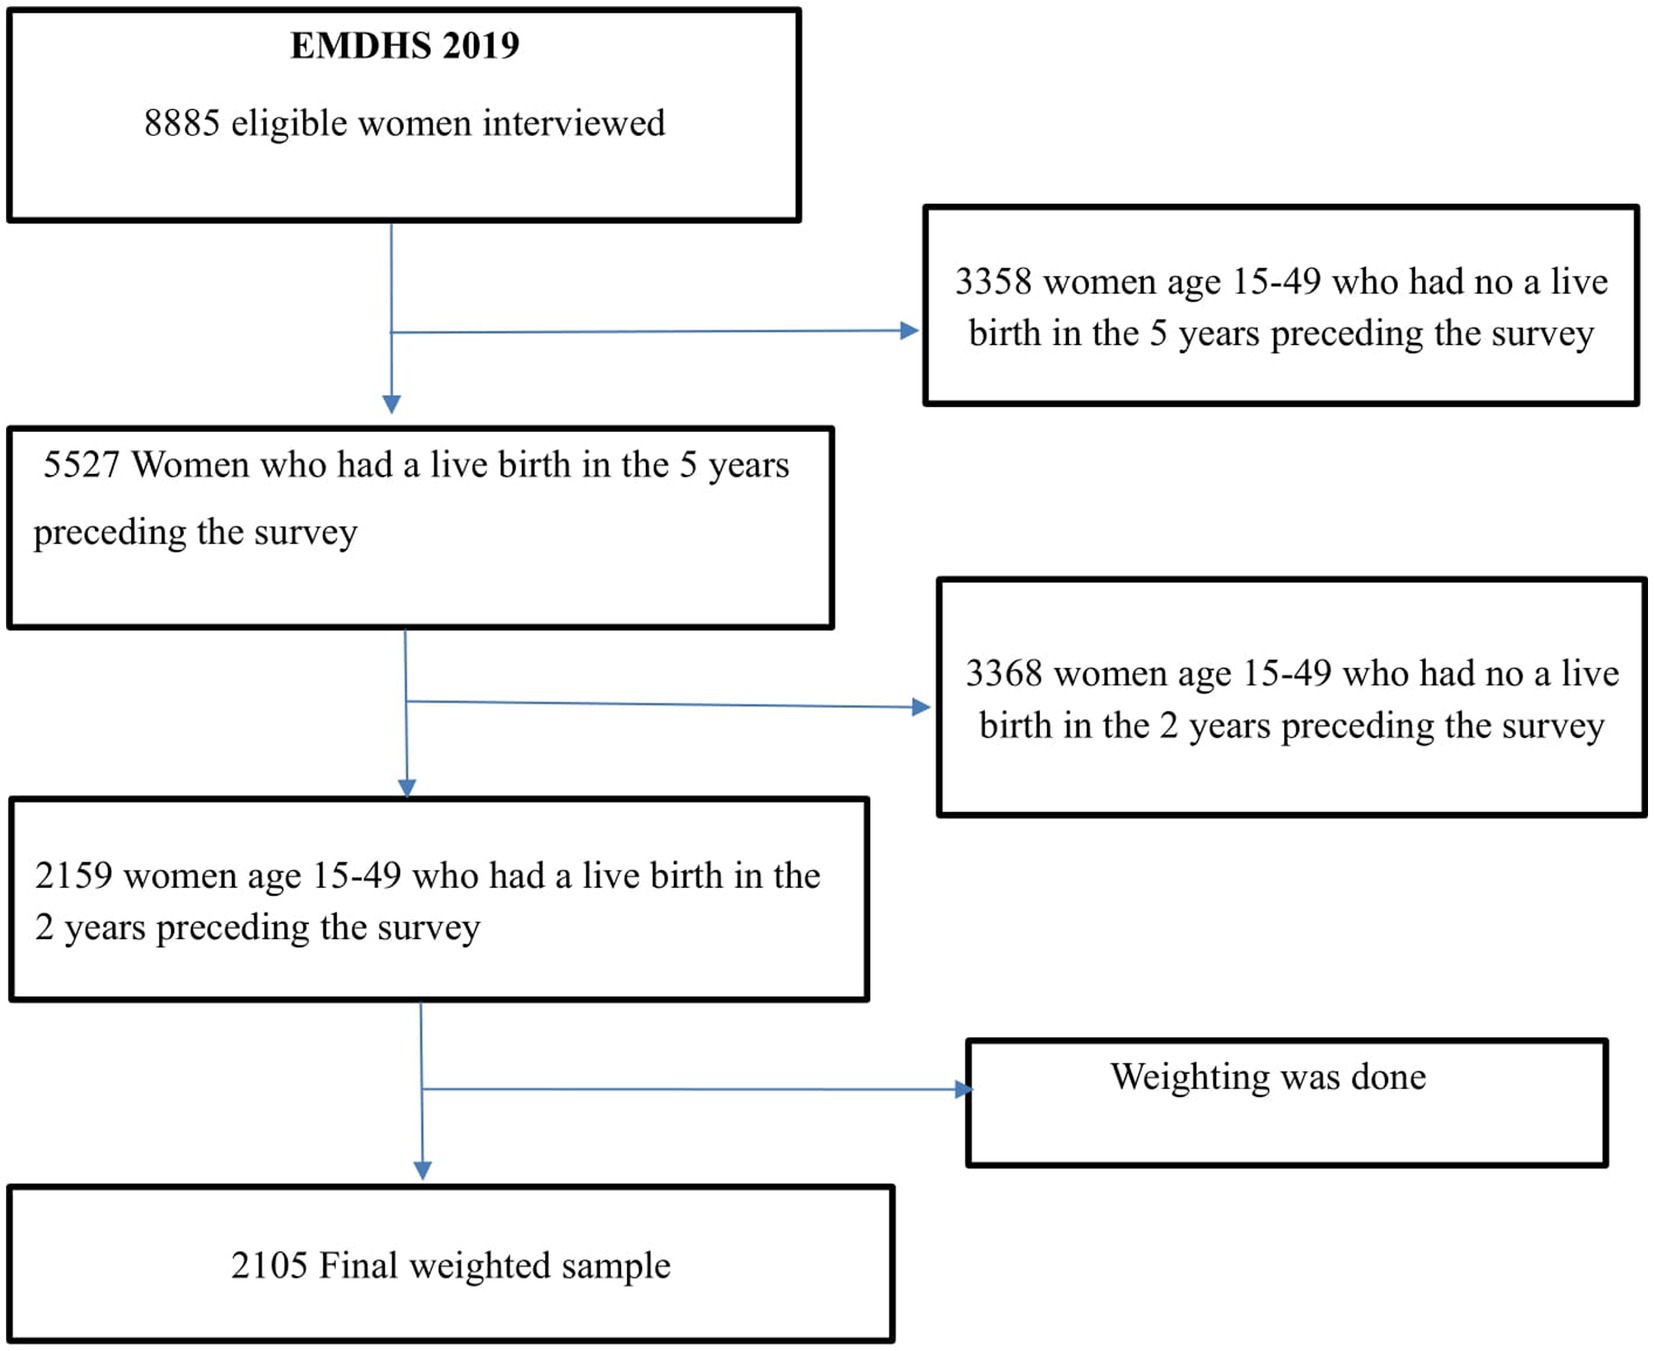
Figure 1. The final sample size and a schematic presentation of how the study sample was selected.
Using a two-stage stratified cluster sampling technique, each region was divided into urban and rural areas. Accordingly, 21 sampling strata were created, and an equal allocation of samples was done in each region, wherein 25 EAs were selected from eight regions, whereas, 35 EAs were selected from three larger regions.
In the first stage, 305 clusters (93 urban and 212 rural) were selected with probability proportional to EAs size and with independent selection in each sampling stratum. In the second stage, a fixed number of 30 households per cluster was selected. Finally, women aged 15–49 in 9,150 (2,790 urban and 6,360 rural) households from 305 clusters were selected. Detail information about the whole procedure of sampling is available on the 2019 EMDHS report (6).
In this study, the outcome variable was postnatal health checks for newborns within 2 days after birth. It was created by computing the five contents of postnatal care for newborns. The computing variables were cord examined, temperature measured, counseling on danger signs, counseling on breastfeeding, and observation of breastfeeding. The postnatal health check for newborns was coded as 1 “yes” if a woman had received the five selected contents of postnatal care for her baby within 2 days, otherwise coded as 0 “no” if the woman had not received the five selected contents of postnatal care (12–14, 23, 24).
The potential contributing factors considered for the decomposition analysis were identified through reviewing of various literatures sources (10, 11, 25–27). Place of residence (urban and rural), age of the mother (15–19, 20–34, and 35–49 years), education level of the mother (no education, primary education, secondary and higher education), respondent’s religion (Orthodox, Protestant, Muslim, others), marital status of the mother (single and married), sex of the household head (male and female), administrative regions of Ethiopia (city administrations, established regions, and emerging regions), antenatal care visits (no ANC visits, 1–3 ANC visits, and 4 and above ANC visits), and birth order of the child (first, second or third, fourth or fifth, and sixth or above).
During the survey period the country had nine regions and two city administrations. However, this study classified the regions into three groups according to their respective levels of economic growth and infrastructure accessibility. The established regions are relatively developed and include Tigray, Amhara, Oromia, Southern Nation Nationalities and People (SNNP), and Harari; the emerging regions are relatively less developed and include Afar, Somali, Benishangul-Gumuz, and Gambela, which are primarily pastoral people. Addis Ababa and Dire Dawa are considered urban areas (25, 26).
The DHS surveys do not collect information on income or expenditure, wealth index is frequently used in DHS as a relative measure of the socioeconomic status of households in low- and middle-income countries (27, 28).
The wealth index is constructed from several indicators that are assumed to be connected with a household’s wealth status. The indicators include, for example, possession of assets such as electricity, television, radio, watch, telephone, refrigerator, types of vehicles, and variables describing the water supply and dwelling such as the source of drinking water, type of toilet, material of principal floor, walls, roof, cooking fuel, and ownership of agricultural land, type and number of animals owned (29, 30). Principal component analysis was used to construct the wealth index of the households (31). The wealth index of the household ranked in five quantiles (poorest, poorer, middle, wealthier, and wealthiest).
Socioeconomic inequalities of postnatal health check for newborns were measured using the concentration curve (CC) and concentration index (CI). The CC plots the cumulative proportion of the postnatal health check on newborns in the y-axis against the cumulative proportion of the population ranked by wealth index, ranked from the poorest to the richest, in the x-axis. If the postnatal health check for newborns is equally distributed across the socioeconomic groups, the concentration curve will coincide with the diagonal line (line of equality). If the postnatal health check for newborns is concentrated in the higher socioeconomic groups, the concentration curve will lie below the diagonal line (32, 33).
The concentration curve measures the socioeconomic inequality of health care utilization across socioeconomic groups. However, it does not provide a measure of the magnitude of inequality. The concentration index is defined as twice the area between the concentration curve and the line of equality (the 45-degree line). It provides a measure of the extent of inequalities in postnatal health checks for newborns. Thus, we used the concentration index to measure the extent (degree) of wealth-related inequality of postnatal health checks for newborn (32–35).
Since the outcome variable is binary, we used Erreygers normalized concentration index, as shown in Equation 1 (ECI) (36).
Where ECI is the Erreygers concentration index, μ is the mean of the postnatal health check for newborns and CI is the generalized concentration index. The value of ECI ranges from −1 to +1. When the value of ECI is positive, it indicates the postnatal health check for newborns is disproportionately concentrated among the rich (pro rich). If it is negative, it indicates the postnatal health checks for newborns is disproportionately concentrated among the poor (pro poor). Larger absolute values of CI indicate wider inequalities in postnatal health checks for newborns (32, 37). When an index is 0, it shows an absence of socioeconomic inequalities in postnatal health checks for newborns.
Identifying the cause of inequality is a critical step in addressing socioeconomic inequality in health. Due to this reason, policymakers and researchers are concerned in investigating the contributing factors of socioeconomic inequality in health (38, 39). Therefore, a decomposition analysis of ECI was done to identify factors contributing to socioeconomic related inequality in the postnatal health check of newborns.
Equation 2 shows that for any linear additive regression model of the health outcome variable (32), y, such as
The concentration index for y, CI, is given as:
Where “y” is the health outcome variable (in this case postnatal health check for newborn), is a set of the socioeconomic determinants of the outcome variable, α is intercept, and is the coefficient of and, is the residual of the error term.
Where “CI” represents the overall concentration index, indicates the mean of y (health outcome variable), represents the mean of (determinants), is the concentration index for , andrepresents the generalized concentration index for .
Equation 3 shows that the overall inequality in health outcomes has two components: an explained component and an unexplained component; the explained component ), which indicates the contribution of each explanatory variable to the socioeconomic inequality of postnatal health checks for newborns, and the unexplained (residual) component (), indicates the socioeconomic inequality of postnatal health check for newborn that cannot be explained by systematic variations across income groups in the ,which should be approach zero for a well specified model (32).
The decomposition approach was initially introduced to use with a linear, additively separable model. However, the outcome variable, the postnatal health check for newborn is non-linear. Thus, a probit regression model is applied to analyze the influences of determinants on the probability of a postnatal health check for newborns. One possibility when dealing with a discrete change from 0 to 1 is to use marginal or partial effects, which show the change in an explanatory variable (40–42). The marginal or partial effects have been analyzed in the analysis of health sector inequalities in non-linear settings (40, 43).
Equation 4 explains the linear approximation of the non-linear estimations
Where , is the marginal effect of the explanatory variable (dy/dxk).
The procedure in decomposition analysis can be summarized in the following steps: The first, the regression model of the health outcome variable is performed for all to obtain the marginal effects of determinants , which show the association between the explanatory variable and the outcome variable (postnatal health check for newborn). In the second step, the elasticity of the outcome variables was estimated for each (), which is a level of responsiveness of the outcome variable to a change in its determinant variable . In the third step, the CI is calculated for the health outcome variable and each explanatory variable. In the fourth step, the contribution of each explanatory variable to the overall ECI is calculated by multiplying the elasticity of each determinant by its concentration index . Finally, the percentage contribution of each explanatory variable to the overall inequality was obtained by dividing its contribution by the ECI and multiplying by one hundred (26, 32, 43–45). Stata version 17 was used to carry out the statistical analysis.
A total of 2,105 women who gave birth in the 2 years preceding the survey were participated in the present study. Nearly, three-fourth 1,538 (73.06%) of the women were 20–34 years old. The vast majority of the women 1982 (94.1%) were married. Nearly, half 978 (46.4%) of respondents were had no education. The majority of the study participants were from rural areas 1,552 (73.7%) and the established regions 1830 (86.9%). Additionally, 926 (43.9%) of women had four and above ANC visits, whereas, 550 (26.13%) women had no any ANC follow-up (Table 1).
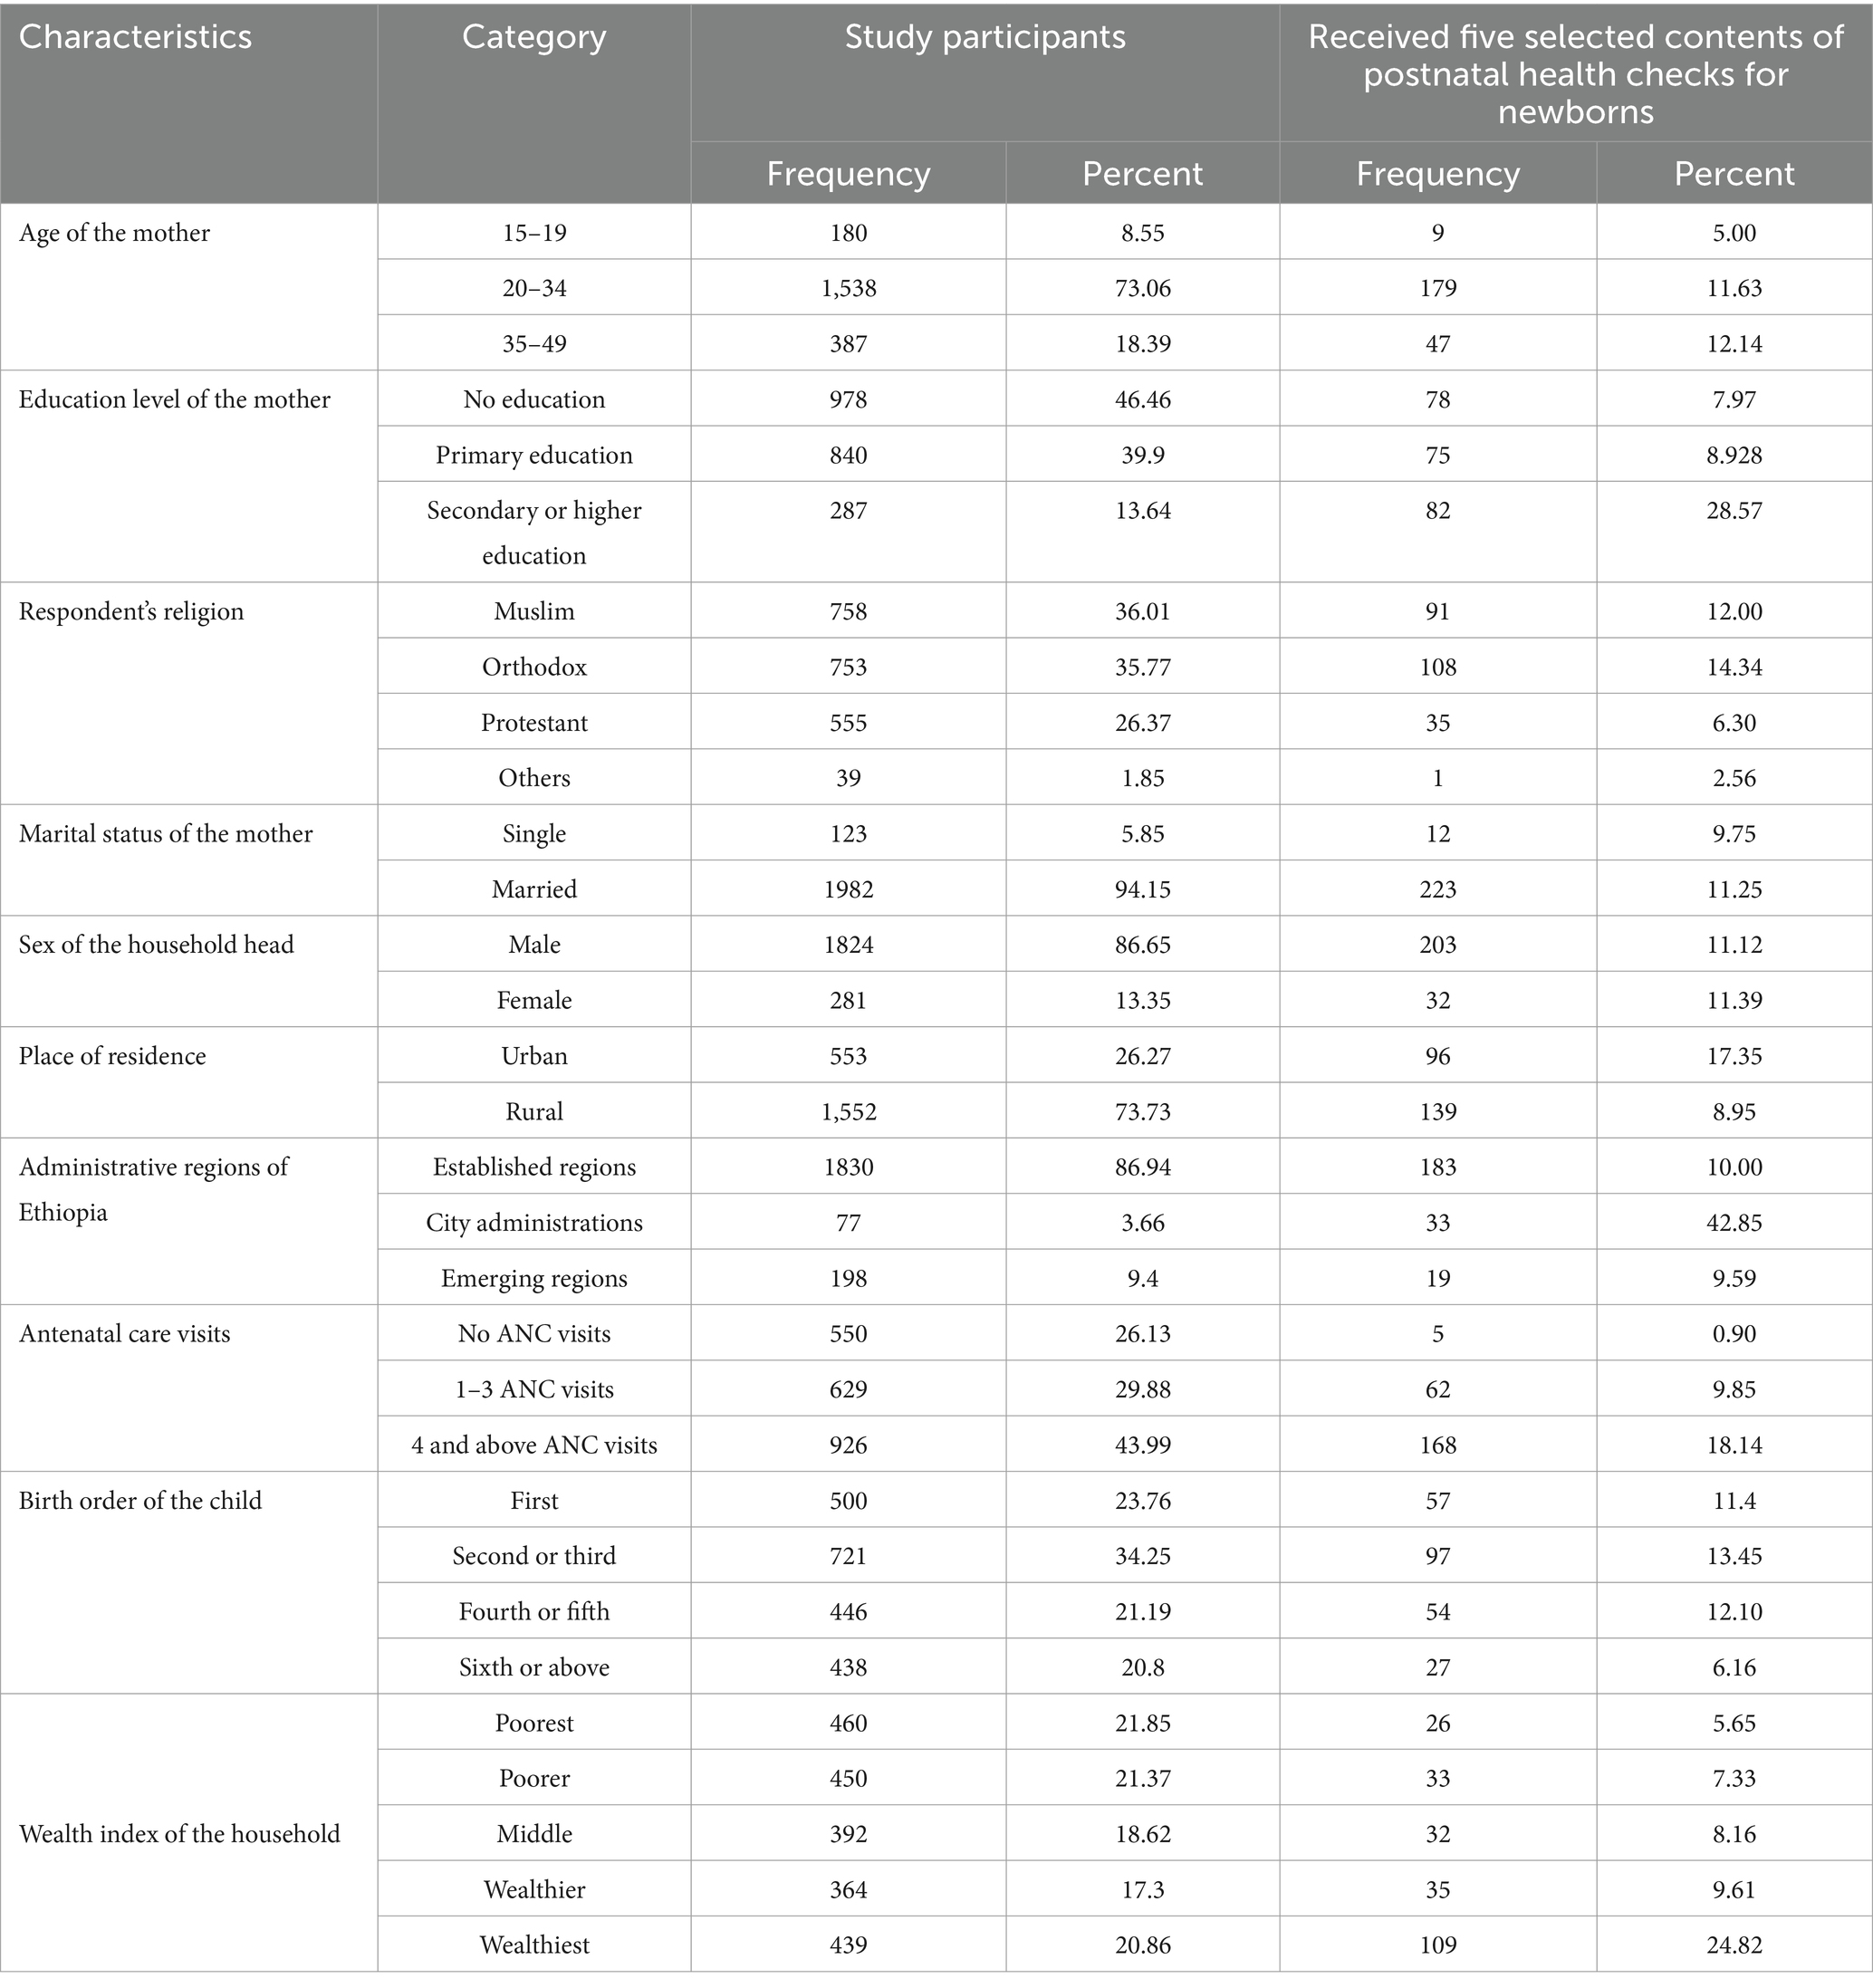
Table 1. Study participants characteristics and percentage of selected content of the postnatal health checks for newborn in Ethiopia (N = 2,105; EMDHS, 2019).
The overall prevalence of selected content of postnatal health check for newborns within 2 days after birth in Ethiopia was 11.16 (95% CI: 8.6–14.2). The prevalence of postnatal health checks for newborn for urban residents was 17.3%, that is higher than that of rural residents 8.9%. Post natal health checks for newborn were 42.8% in city administration of Ethiopia, whereas, it was 10 and 9.5% in established and emerging regions of Ethiopia, respectively. Moreover, the prevalence of postnatal health checks for newborn was reported from respondents who attained secondary and above education 28.5%, and respondents from higher household wealth index (wealthiest) 24%, however the prevalence of postnatal health check for newborn from poorest household was 5.6%. Furthermore, women who had four and above ANC visits the prevalence of postnatal health checks for newborns was 18.1% (Table 1).
Figure 2 depicts the concentration curve of the postnatal health check for newborns in Ethiopia. The concentration curves lay below the 45° line, demonstrating that the postnatal health check for newborns was more concentrated amongst the wealthiest or higher socioeconomic groups (pro-rich distribution).
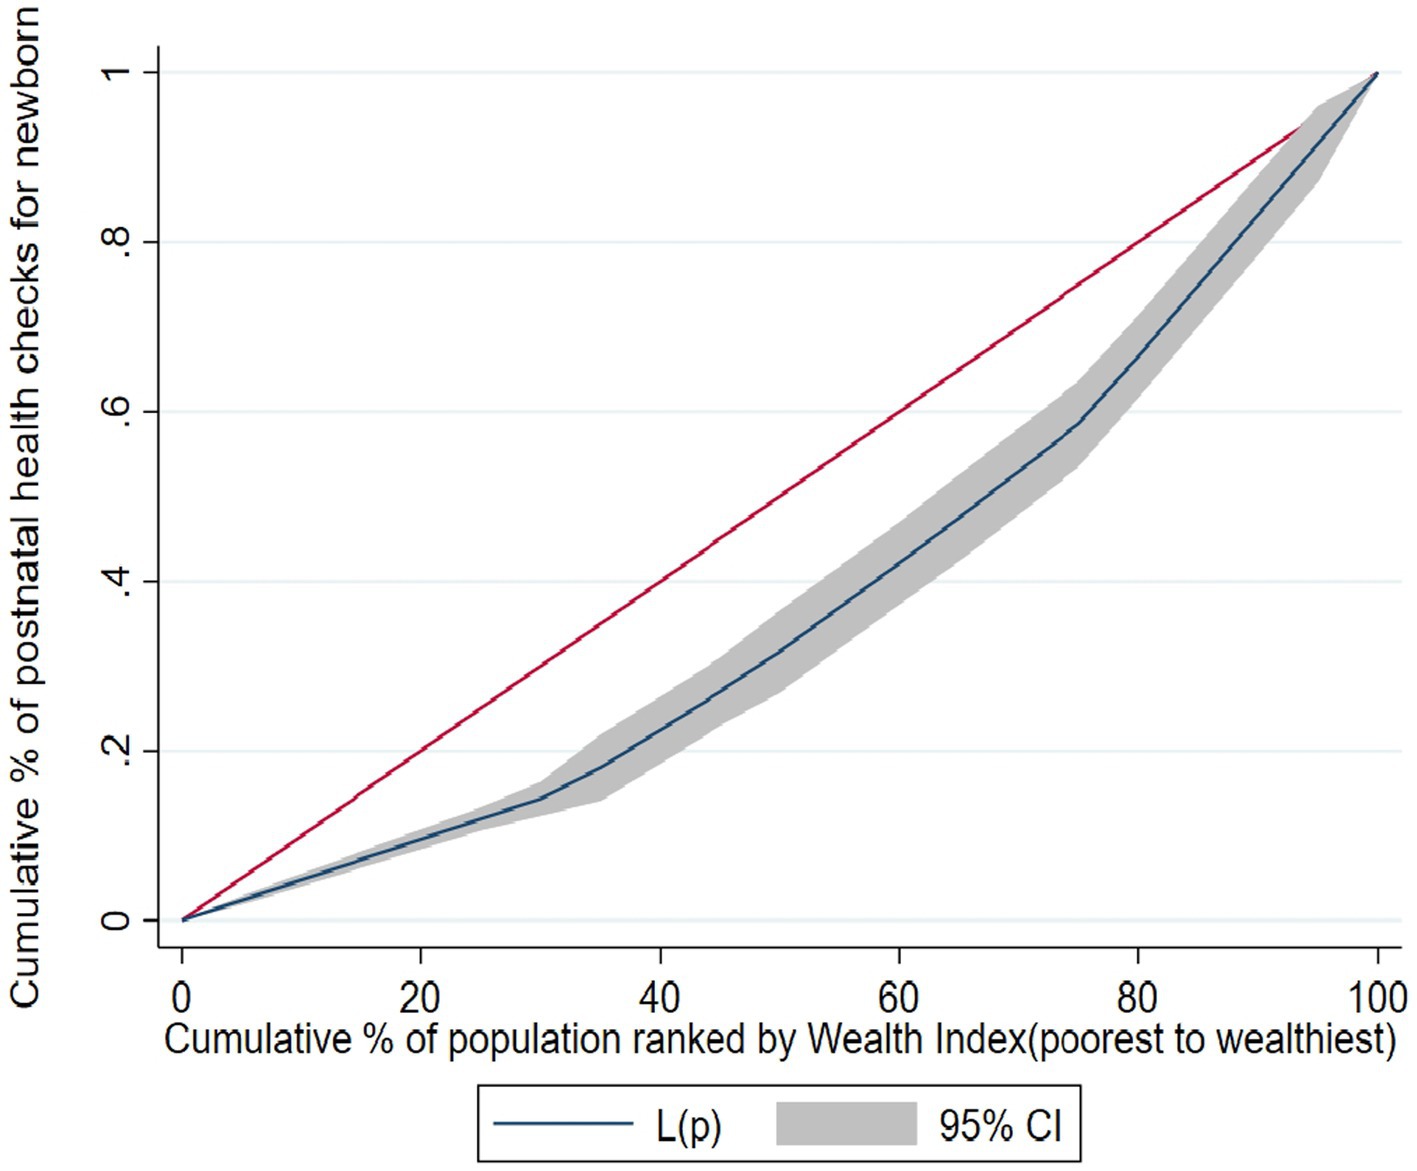
Figure 2. The concentration curve for postnatal health check for newborn in Ethiopia, 2019 EMDHS.
The overall ECI analysis of socioeconomic related inequality of postnatal checks for newborns in Ethiopia was 0.1336, with a standard error = 0.0333, p value <0.001. The positive sign of concentration indices in postnatal health checks for newborns confirms the presence of pro-rich inequalities. This concentration index, 0.1336 implies that the postnatal health checks for newborns is 13.36% higher among the rich or higher socioeconomic groups.
Findings from the decomposition analysis indicate the contributions of each factor to the overall socioeconomic inequality of the postnatal health check for newborns in Ethiopia. The marginal effect column from Table 2 indicated that variables such as secondary and higher education status, administrative regions of Ethiopia, antenatal care visits, and wealth index had a significant effect on the postnatal health check for newborns. Women from the city administration of Ethiopia had a 7% higher chance of receiving a postnatal health check for the newborn compared to those from established regions of Ethiopia. Similarly, women from wealthier households had a 9% higher probability of receiving a postnatal health check for the newborn when compared with those from the poorest. In contrast, compared to women who had four or more ANC visits, the likelihood of a postnatal health check for a newborn was 15% lower for women who had no ANC visits.
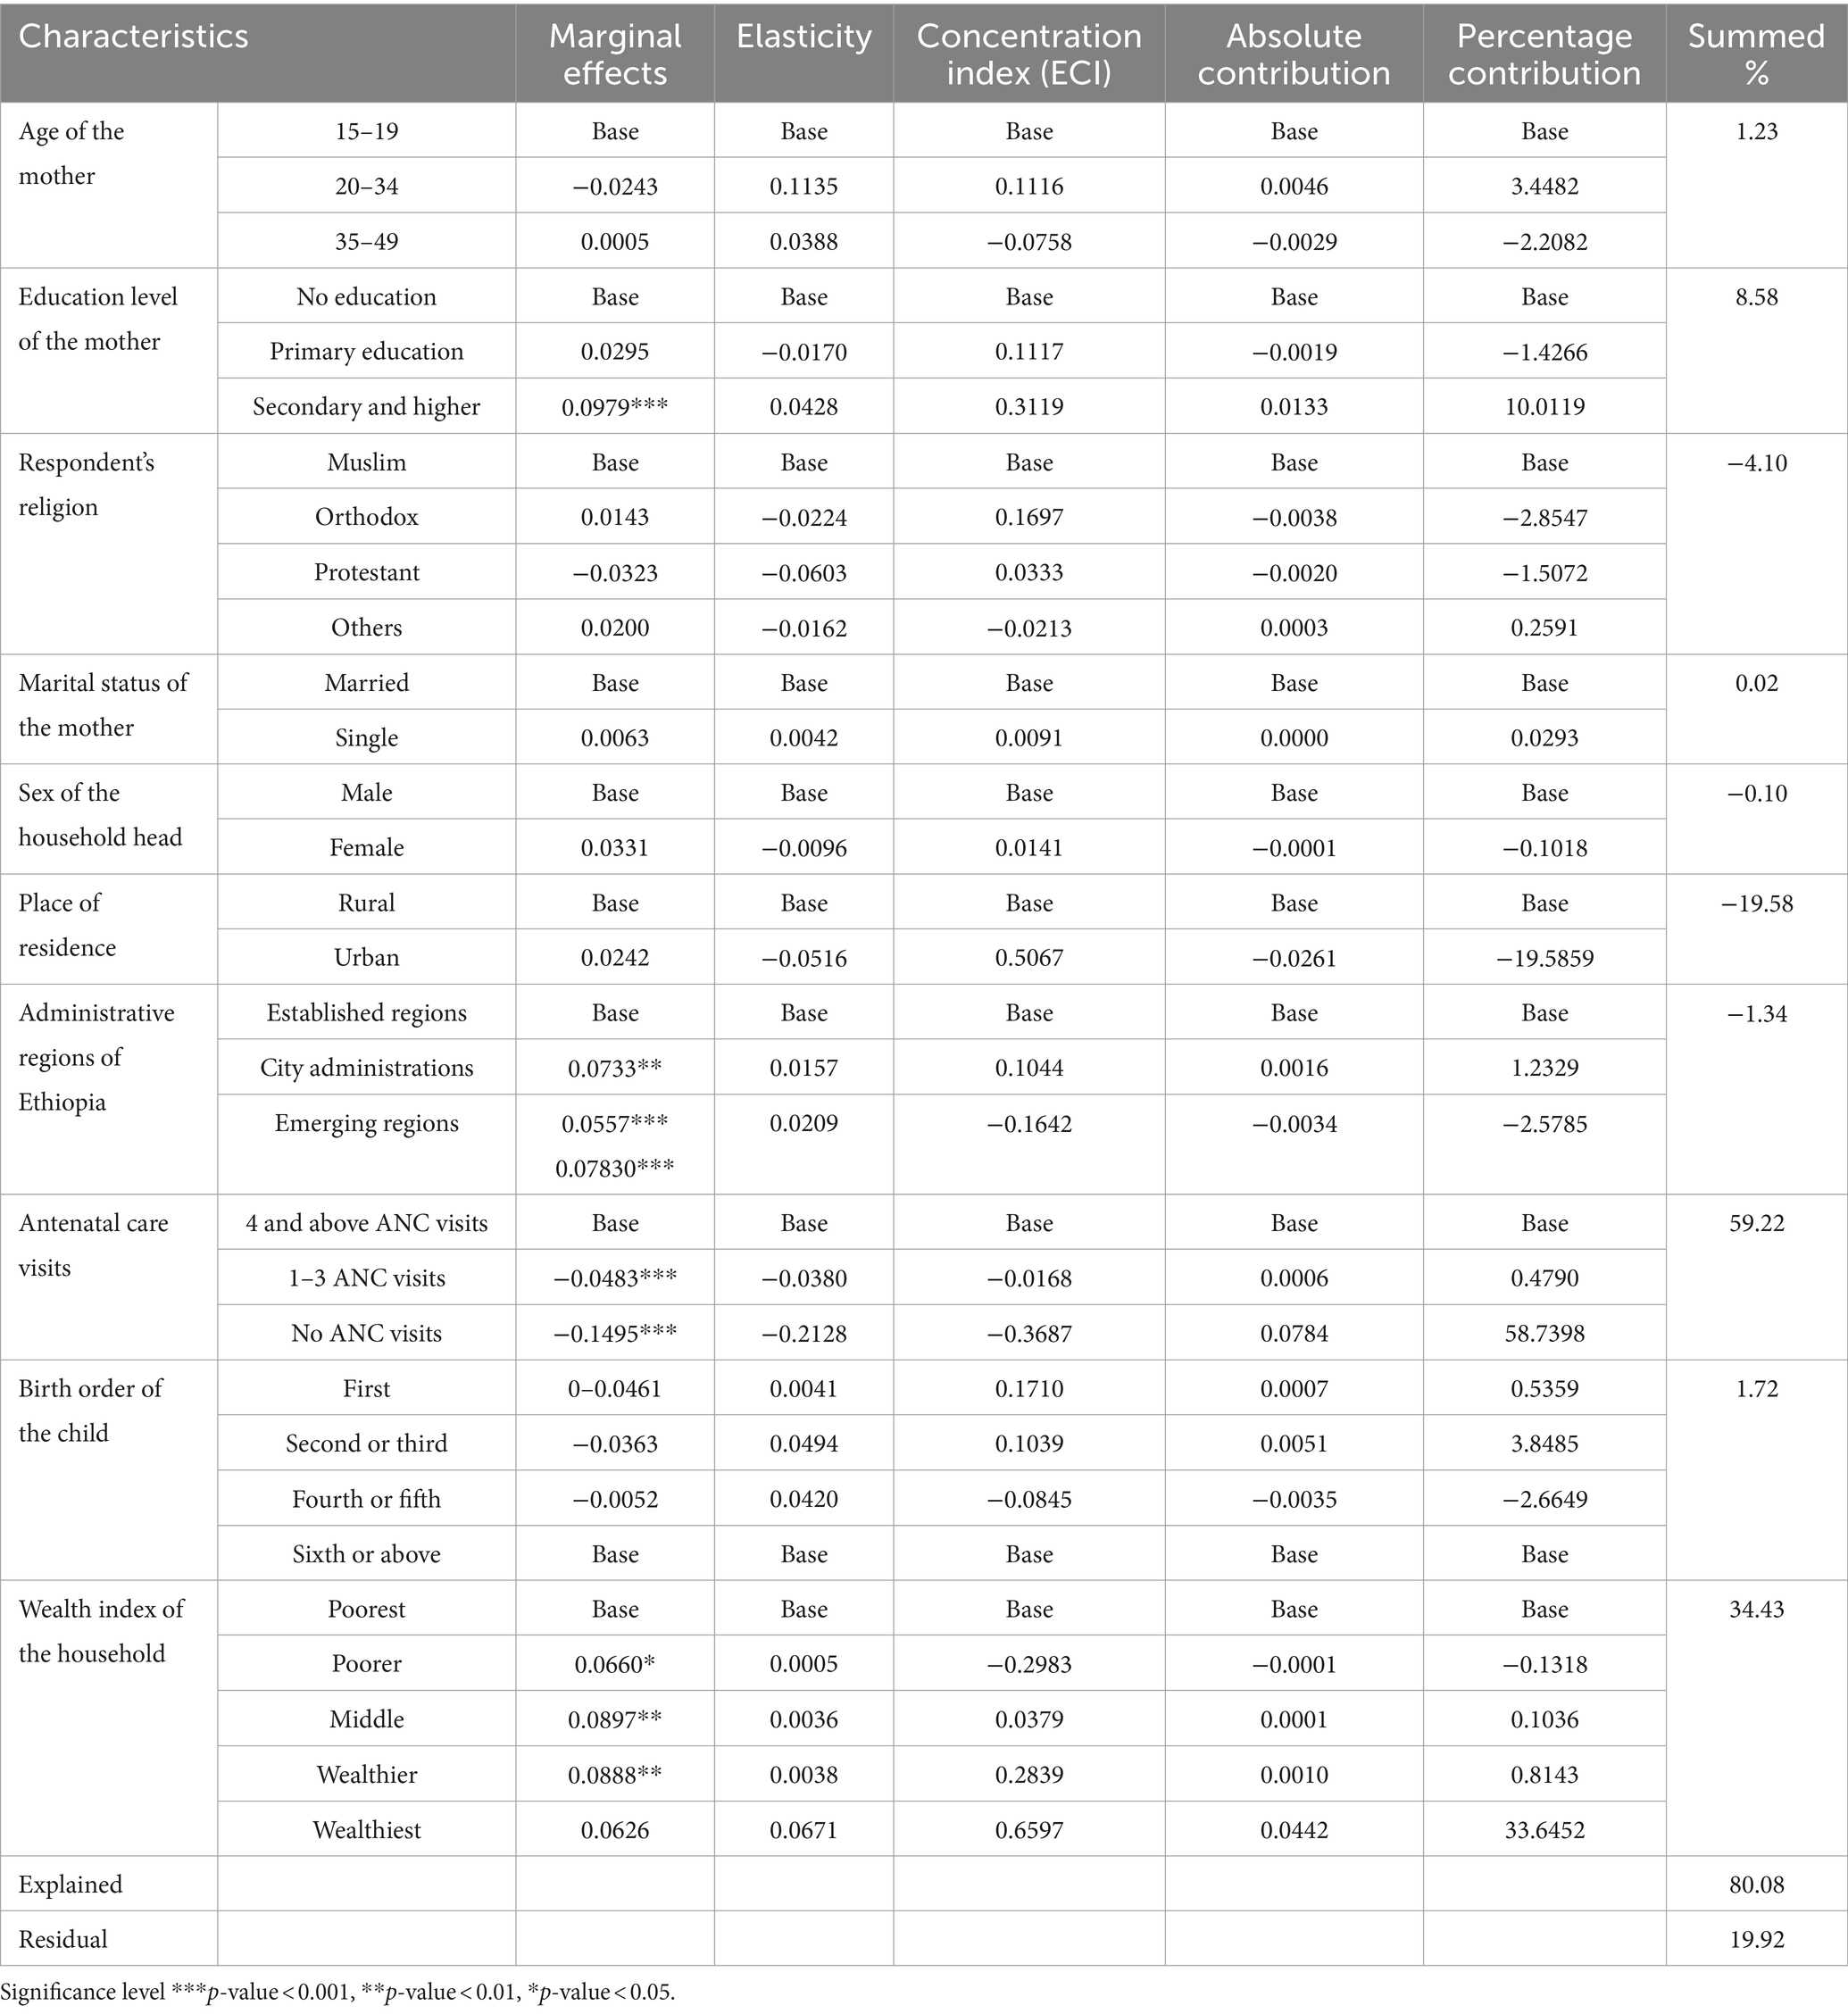
Table 2. A decomposition analysis of socioeconomic inequalities in the postnatal health check for newborn care in Ethiopia.
Elasticity is the sensitivity of the outcome variable to each explanatory variable. Table 2, elasticity column shows the elasticity of the postnatal health check for newborns. For instance, Women who reside in urban areas have an elasticity value of −0.0516, meaning that a change in residence from a rural to an urban area will reduce pro-rich socioeconomic inequality in postnatal health check in newborns by 5.1%. Conversely, the elasticity of household wealth index was found to be 0.0671, meaning that a change in women’s household wealth status from the poorest to the wealthiest would result in a 6.7% increment in the pro-rich socioeconomic inequality of postnatal health checks for newborns.
The concentration index in each variable describes the extent and direction of socioeconomic related inequality in postnatal health checks for newborns that corresponds to specific explanatory variables. Table 2, the ECI column show how each explanatory variable is distributed across socioeconomic status. Explanatory variable such as primary educational level (ECI = 0.1117), secondary and higher educational level (ECI = 0.3119), age of the mother 20–34 (ECI = 0.1116), being Orthodox religion follower (ECI = 0.1697), being Protestant religion follower (ECI = 0.0333), single marital status (ECI = 0.0091), male sex of the household head (ECI = 0.0141), urban resident (ECI = 0.5067), City administrations regions of Ethiopia (ECI = 0.1044), first birth order (ECI = 0.1710), second or third birth order (ECI = 0.1039), household wealth index middle (ECI = 0.0379), household wealth index wealthier (ECI = 0.2839), and household wealth index wealthiest (ECI = 0.6597) had positive Erreygers concentration index indicating that these variables were concentrated more among women with better socioeconomic status. In contrast, the age of the mother 35–49 (ECI = −0.0758), other religion follower (ECI = −0.0213), emerging regions of Ethiopia (ECI = –0.1642), no ANC visits (ECI = −0.3687), 1–3 ANC visits (ECI = −0.0168), fourth or fifth birth order (ECI = −0.0845), and poorer household wealth index (ECI = −0.2983) had a negative Erreygers concentration index, indicating these factors were more concentrated among economically disadvantaged women. This, therefore, implies that women from lower socioeconomic status were less likely to receive postnatal health check of newborn.
In this study, the contribution of each variable to the overall inequality of postnatal health checks for newborns was estimated and presented in Table 2. The explanatory variables included in our model explained 80.08% of the overall variability of socioeconomic inequality in postnatal health checks for newborns in Ethiopia. Antenatal care visits (59.22%), household wealth index (34.43%), and education level of the mother (8.58%) were the major contributors to the socioeconomic inequality in postnatal health checks for newborns. Birth order (1.72%) and age of mother (1.23%) had relatively minimal contribution to the inequality. On the contrary, women’s place of residence negatively contributed to inequality by −19.58%. About 19.92% of the overall inequality was contributed by unexplained variables or residuals.
The findings from concentration indices and decomposition analysis play a key role in informing evidence-based policy decisions, helping to reduce socioeconomic related health inequality (38, 46, 47). Therefore, study aimed to measure the level of socioeconomic inequalities and the contributing factors in postnatal health checks for newborns in Ethiopia. The result of this study demonstrated that there is socioeconomic inequality in postnatal health checks for newborns in Ethiopia. The findings of the present study imply that the postnatal health check for newborns was concentrated among newborns with high socioeconomic status. Our study is comparable with the findings of the previous studies (12, 20, 21). However, the magnitude of pro-rich inequalities in postnatal health checks for newborns was not comparable with the previous studies. In this study the magnitude of pro-rich inequalities was higher than in Vietnam (20). The difference might be explained by a variation in economic development, social policy, and the context of the health system. However, it was lower than the previous study in Ethiopia (12). The difference might be the fact that there was a difference in the study period and there was a variation in the measurement of the outcome variable. Several studies documented that women with higher socioeconomic status were more likely to use various maternal health services, such as ANC visits, skilled birth attendance, and postnatal health checks (15, 48–52). Newborns who belong to socioeconomically disadvantaged households experience a higher rate of mortality and morbidity. They are being left behind in accessing health services, in spite of having greater levels of health care need (32). In alignment with SDG 3.2, Ethiopia targets reducing the death of neonates to less than 12 per 1,000 live births in 2030. However, socioeconomic inequality in health can impose considerable challenge to attain the sustainable development goal of ending preventable newborns deaths. Thus, targeting reducing socioeconomic inequalities and ensuring the poorest have access to and utilize maternal and newborn services is essential to achieving universal coverage of maternal and neonatal healthcare (7).
The identification of contributing factors to the inequality in postnatal health checks for newborns is a critical step in designing relevant policy interventions to reduce the observed socioeconomic inequalities (38, 53). Accordingly, the decomposition analysis of this study identified various significant contributors to socioeconomic inequality in postnatal health checks for newborns. ANC visits, the wealth status of the household, and educational status of the mother were the factors with the highest contribution to the overall inequality of postnatal health checks for newborns.
In this study, ANC visit was a predominant contributor to the overall socioeconomic related health inequality (Figure 3). It explained about 59.22% of the total inequality in postnatal health checks for newborns. Existing studies have documented that ANC visit is an important contributing factor to newborn and child health service inequality (26, 54, 55). Research conducted in Ethiopia reported that having four or more ANC visits was associated with a higher likelihood of receiving newborn care (56–58). However, currently, ANC service utilization is low, only four out of ten women have received four or more ANC visits in Ethiopia (6). According to the reports of previous studies, ANC service utilization was much lower among the women from economically disadvantaged groups (51, 59). The decomposition analysis in this study implies that the socioeconomic inequality in the postnatal health checks for newborns would reduce by 59%, if the ANC visits equally distributed among the women. Therefore, our findings highlight ANC visit is an important target variable for policy intervention. Efforts are required to improve four or more ANC visits in Ethiopia among economically disadvantaged women. Addressing inequality in ANC visits can significantly reduce the overall socioeconomic inequality postnatal health check for newborn.
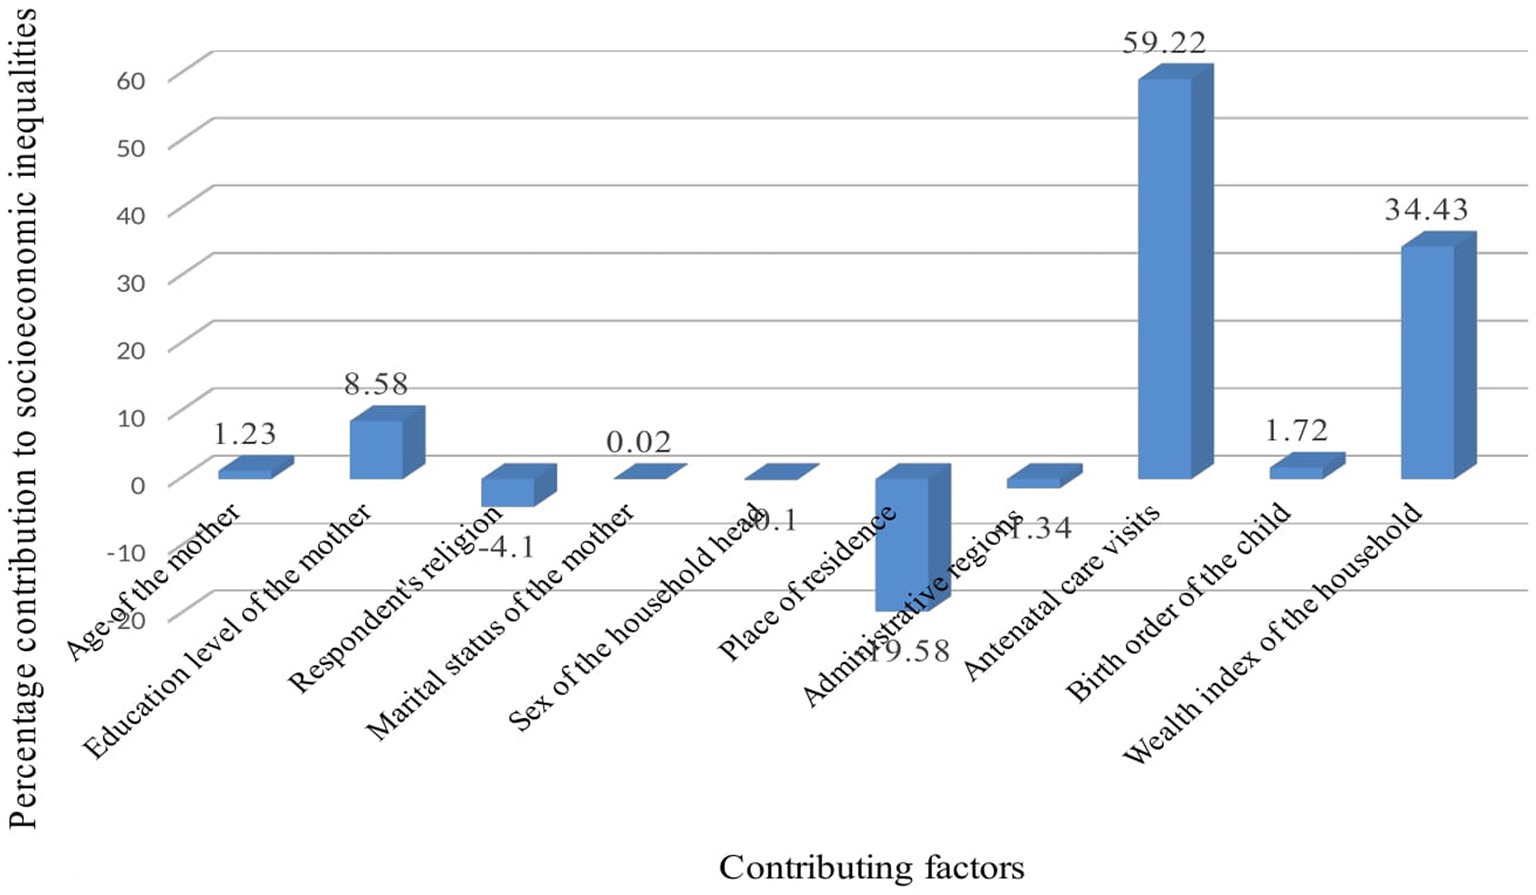
Figure 3. Contributions of various factors to postnatal health checks for newborns in Ethiopia.
The wealth status of the household was the second most contributing factor to the observed inequality. It explained about 34.43% of the overall inequality in postnatal health checks for newborns. This finding was similar to that in previous literature (54, 60). This could be women with higher wealth status can easily receive postnatal health checks for newborns anywhere at health facilities. In Ethiopia, maternal and newborn health care services are provided free of charge (free of direct medical costs) in public health facilities. However, women from lower socioeconomic groups, non-medical costs can impose a considerable financial burden. Non-medical costs such as transport and accommodation costs can deter women from obtaining a postnatal health check for their newborn.
This study also found that about 8.58% of the overall socioeconomic inequality in postnatal health checks for newborns was explained by the educational level of the mother. Several studies documented that the educational level of the mother was a significant contributing factor for socioeconomic inequality in child health services (26, 60–62). Possible explanations for this finding could be that educated women may be relatively empowered and have more autonomy than their poorer counterparts. Additionally, they have relatively better access to and use of health information. Furthermore, educated women can easily understand the benefits of a postnatal health check for newborns (63).
The strengths of this study include: to the best of our knowledge, this is the first study in Ethiopia to measure socioeconomic inequality in postnatal health checks for newborns using decomposition analysis. A nationally representative survey from the most recent DHS surveys was employed in the study. The findings of this study can help policymakers and planners to design evidence-based interventions. However, our study has some limitations. Since the DHS lacks direct measures of income, spending, or consumption, an asset-based wealth index was utilized in this study as a proxy for socioeconomic status. Second, because the study employed a cross-sectional survey, it was not possible to determine a causal relationship between the newborn’s determinant and the postnatal health check. Third, there was a time gap between the child’s birth and the interview period, as a result, there will be a possibility of recall bias.
The results of the present study confirmed that there was a pro-rich inequality in postnatal health checks for newborns in Ethiopia. ANC visit, wealth status of the household, and educational status of the mother were the major contributing factors to the pro-rich socioeconomic inequalities of postnatal health checks for newborns. Therefore, to reduce the socioeconomic related health inequality in postnatal health checks for newborns, the government needs to improve ANC visits, implement strategies to access health service for economically disadvantaged groups, and increase educational attainment among women.
The original contributions presented in the study are included in the article/supplementary material, further inquiries can be directed to the corresponding author.
No ethical clearance was required because we used data from the DHS program. However, in order to access the data, requests for measure DHS and online registration were made. After obtaining authorization, the dataset was obtained from the DHS online archive (http://www.dhsprogram.com). All procedures were followed in compliance with the Helsinki Declaration.
AH: Conceptualization, Data curation, Formal analysis, Investigation, Methodology, Project administration, Resources, Software, Validation, Visualization, Writing – original draft, Writing – review & editing. MT: Data curation, Formal analysis, Methodology, Resources, Software, Visualization, Writing – review & editing. KA: Data curation, Formal analysis, Methodology, Resources, Visualization, Writing – review & editing. YT: Data curation, Formal analysis, Investigation, Methodology, Resources, Software, Validation, Visualization, Writing – review & editing. AE: Formal analysis, Investigation, Methodology, Software, Validation, Visualization, Writing – review & editing. WN: Data curation, Formal analysis, Investigation, Methodology, Resources, Software, Validation, Visualization, Writing – review & editing. AW: Data curation, Formal analysis, Methodology, Resources, Software, Writing – review & editing. LY: Data curation, Formal analysis, Investigation, Methodology, Resources, Visualization, Writing – review & editing. MG: Data curation, Formal analysis, Methodology, Visualization, Writing – review & editing. NW: Data curation, Formal analysis, Investigation, Methodology, Resources, Software, Validation, Visualization, Writing – review & editing. AB: Data curation, Formal analysis, Investigation, Methodology, Writing – review & editing. LA: Investigation, Methodology, Resources, Validation, Writing – review & editing. HA: Data curation, Formal analysis, Methodology, Software, Validation, Writing – review & editing. DG: Formal analysis, Investigation, Methodology, Software, Visualization, Writing – review & editing. KD: Formal analysis, Investigation, Methodology, Software, Visualization, Writing – review & editing. MJ: Investigation, Methodology, Resources, Software, Supervision, Writing – review & editing.
The author(s) declare that no financial support was received for the research, authorship, and/or publication of this article.
We would like to acknowledge the DHS program for granting permission to use the data.
The authors declare that the research was conducted in the absence of any commercial or financial relationships that could be construed as a potential conflict of interest.
All claims expressed in this article are solely those of the authors and do not necessarily represent those of their affiliated organizations, or those of the publisher, the editors and the reviewers. Any product that may be evaluated in this article, or claim that may be made by its manufacturer, is not guaranteed or endorsed by the publisher.
ANC, Antenatal Care; ECI, Erreygers Concentration Index; EMDHS, Ethiopia Mini Demographic and Health Survey.
1. World Health Organization, Making every baby count: Audit and review of stillbirths and neonatal deaths. Final report. (2016). Available at: https://www.who.int/docs/default-source/mca-documents/maternal-nb/making-every-baby-count.pdf?Status=Master&sfvrsn=6936f980_2
2. World Health Organization. Improving maternal and newborn health and survival and reducing stillbirth: Progress report. Geneva: WHO. (2023).
3. The United Nations International Children's Emergency Fund. Newborn care. Available at: https://data.unicef.org/topic/maternal-health/newborn-care/ (Accessed January 2024).
4. World Health Organization. Survive and thrive: Transforming care for every small and sick newborn. Geneva: WHO (2019). Available at: https://www.who.int/publications/i/item/9789241515887
5. World Health Organization. Newborns: improving survival and well-being. Available at: https://www.who.int/news-room/fact-sheets/detail/newborns-reducing-mortality (Accessed March 2024).
6. Ethiopian Public Health Institute (EPHI) [Ethiopia] and ICF. Ethiopia mini demographic and health survey 2019: Final report. Rockville, Maryland, USA: EPHI and ICF (2021).
7. Ethiopian Public Health Institute (EPHI), More action needed: building on Ethiopia's success to accelerates survival of maternal and newborns. Report. (2022). Available at: https://ephi.gov.et/wp-content/uploads/2023/01/3.-MNH-Ethiopia-Policy_brief-report.pdf
8. McKinnon, B, Harper, S, Kaufman, JS, and Bergevin, Y. Socioeconomic inequality in neonatal mortality in countries of low and middle income: a multicountry analysis. Lancet Glob Health. (2014) 2:e165–73. doi: 10.1016/S2214-109X(14)70008-7
9. Oza, S, Cousens, SN, and Lawn, JE. Estimation of daily risk of neonatal death, including the day of birth, in 186 countries in 2013: a vital-registration and modelling-based study. Lancet Glob Health. (2014) 2:e635–44. doi: 10.1016/S2214-109X(14)70309-2
10. Ashemo, MY, Shiferaw, D, Biru, B, and Feyisa, BR. Prevalence and determinants of adequate postnatal care in Ethiopia: evidence from 2019 Ethiopia mini demographic and health survey. BMC Pregnancy Childbirth. (2023) 23:834. doi: 10.1186/s12884-023-06147-7
11. Birhane, BM, Bayih, WA, Mekonen, DK, Chanie, ES, Demis, S, Shimelis, H, et al. Level of postnatal Checkup in Ethiopia–implications for child health services. Front Pediatr. (2022) 10:895339. doi: 10.3389/fped.2022.895339
12. Gebremedhin, AF, Dawson, A, and Hayen, A. Effective coverage of newborn postnatal care in Ethiopia: measuring inequality and spatial distribution of quality-adjusted coverage. PLoS One. (2023) 18:e0293520. doi: 10.1371/journal.pone.0293520
13. Habte, A, and Dessu, S. Determinants of frequency and contents of postnatal care among women in Ezha District, southern Ethiopia, 2020: based on WHO recommendation. Int J Women's Health. (2021) 13:189–203. doi: 10.2147/IJWH.S291731
14. Kassie, DG, Assimamaw, NT, Tamir, TT, Alemu, TG, Techane, MA, Wubneh, CA, et al. Spatial distribution and determinants of newborns not receiving postnatal check-up within two days after birth in Ethiopia: a spatial and multilevel analysis of EDHS 2016. BMC Pediatr. (2022) 22:495. doi: 10.1186/s12887-022-03506-9
15. Gebre, E, Worku, A, and Bukola, F. Inequities in maternal health services utilization in Ethiopia 2000–2016: magnitude, trends, and determinants. Reprod Health. (2018) 15:1–9.
16. Saunders, M, McHale, P, and Hamelmann, C. Key policies for addressing the social determinants of health and health inequities. Copenhagen: WHO Regional Office for Europe (2017). 52 p.
17. Asada, Y, Hurley, J, Norheim, OF, and Johri, M. A three-stage approach to measuring health inequalities and inequities. Int J Equity Health. (2014) 13:1–13. doi: 10.1186/s12939-014-0098-y
18. World Health Organization. State of inequality: Reproductive maternal newborn and child health: Interactive visualization of health data. Geneva, Switzerland: World Health Organization (2015).
19. Singh, A, Padmadas, SS, Mishra, US, Pallikadavath, S, Johnson, FA, and Matthews, Z. Socio-economic inequalities in the use of postnatal care in India. PLoS One. (2012) 7:e37037. doi: 10.1371/journal.pone.0037037
20. Lam, ND, Anh, ND, Ha, NTT, Vinh, TQ, Anh, VTM, and Kien, VD. Socioeconomic inequalities in post-natal health checks for the newborn in Vietnam. Int J Equity Health. (2019) 18:1–7. doi: 10.1186/s12939-019-1029-8
21. Yitbarek, K, Hurlburt, S, Hagen, TP, Berhane, M, Abraham, G, Adamu, A, et al. Inequitable utilization of neonatal health Services in Southwest Ethiopia: the effects of socioeconomic disparities. J Health Care Organ Provision Financing. (2021) 58:00469580211018290.
22. United Nations Population Fund World Population Dashboard. World population dashboard. (2023) Available at: https://www.unfpa.org/data/world-population-dashboard
23. Carvajal–Aguirre, L, Amouzou, A, Mehra, V, Ziqi, M, Zaka, N, and Newby, H. Gap between contact and content in maternal and newborn care: an analysis of data from 20 countries in sub–Saharan Africa. J Glob Health. (2017) 7:3. doi: 10.7189/jogh.07.020501
24. Kawuki, J, Gatasi, G, and Sserwanja, Q. Prevalence of adequate postnatal care and associated factors in Rwanda: evidence from the Rwanda demographic health survey 2020. Arch Public Health. (2022) 80:1–11. doi: 10.1186/s13690-022-00964-6
25. Bareke, ML, Agezew, BH, Dedho, NH, Herut, AH, Demissie, MM, Yimer, B. M., et al. (2020). Education inequalities in Ethiopia: a macro-level analysis and its policy implications.
26. Wondimu, A, van der Schans, J, van Hulst, M, and Postma, MJ. Inequalities in rotavirus vaccine uptake in Ethiopia: a decomposition analysis. Int J Environ Res Public Health. (2020) 17:2696. doi: 10.3390/ijerph17082696
27. Howe, LD. The wealth index as a measure of socio-economic position. PhD thesis. London: London School of Hygiene & Tropical Medicine (2009).
28. Howe, LD, Hargreaves, JR, and Huttly, SR. Issues in the construction of wealth indices for the measurement of socio-economic position in low-income countries. Emerg Themes Epidemiol. (2008) 5:1–14. doi: 10.1186/1742-7622-5-3
29. Rogers, DJ, Wint, GR, Alexander, N, Pozzi, F, and Robinson, TP. (2011) Wealth index mapping in the horn of Africa. FAO Animal Production and Health Working Paper 4.
30. Rutstein, SO. Steps to constructing the new DHS wealth index, vol. 6. Rockville, MD: ICF International (2015).
31. Vyas, S, and Kumaranayake, L. Constructing socio-economic status indices: how to use principal components analysis. Health Policy Plan. (2006) 21:459–68. doi: 10.1093/heapol/czl029
32. Wagstaff, A, O’Donnell, O, Van Doorslaer, E, and Lindelow, M. Analyzing health equity using household survey data: a guide to techniques and their implementation. World Bank Publications (2007). (Accessed November 2, 2007).
33. Wagstaff, A, Paci, P, and Van Doorslaer, E. On the measurement of inequalities in health. Soc Sci Med. (1991) 33:545–57. doi: 10.1016/0277-9536(91)90212-U
34. Kakwani, N, Wagstaff, A, and Van Doorslaer, E. Socioeconomic inequalities in health: measurement, computation, and statistical inference. J Econ. (1997) 77:87–103. doi: 10.1016/S0304-4076(96)01807-6
35. Koolman, X, and Van Doorslaer, E. On the interpretation of a concentration index of inequality. Health Econ. (2004) 13:649–56. doi: 10.1002/hec.884
36. Erreygers, G. Correcting the concentration index. J Health Econ. (2009) 28:504–15. doi: 10.1016/j.jhealeco.2008.02.003
37. Alaba, O, and Chola, L. Socioeconomic inequalities in adult obesity prevalence in South Africa: a decomposition analysis. Int J Environ Res Public Health. (2014) 11:3387–406. doi: 10.3390/ijerph110303387
38. Cai, J, Coyte, PC, and Zhao, H. Decomposing the causes of socioeconomic-related health inequality among urban and rural populations in China: a new decomposition approach. Int J Equity Health. (2017) 16:1–14. doi: 10.1186/s12939-017-0624-9
39. Heckley, G, Gerdtham, U-G, and Kjellsson, G. A general method for decomposing the causes of socioeconomic inequality in health. J Health Econ. (2016) 48:89–106. doi: 10.1016/j.jhealeco.2016.03.006
40. Doorslaer, Ev, Koolman, X, and Jones, AM. Explaining income-related inequalities in doctor utilisation in Europe. Health Econ. (2004) 13:629–47. doi: 10.1002/hec.919
41. Liu, X, Gao, W, and Yan, H. Measuring and decomposing the inequality of maternal health services utilization in western rural China. BMC Health Serv Res. (2014) 14:1–7. doi: 10.1186/1472-6963-14-102
42. Wagstaff, A, Van Doorslaer, E, and Watanabe, N. On decomposing the causes of health sector inequalities with an application to malnutrition inequalities in Vietnam. J Econ. (2003) 112:207–23. doi: 10.1016/S0304-4076(02)00161-6
43. Yiengprugsawan, V, Lim, LLY, Carmichael, GA, Sidorenko, A, and Sleigh, AC. Measuring and decomposing inequity in self-reported morbidity and self-assessed health in Thailand. Int J Equity Health. (2007) 6:1–17. doi: 10.1186/1475-9276-6-23
44. Astawesegn, FH, Conroy, E, Mannan, H, and Stulz, V. Measuring socioeconomic inequalities in prenatal HIV test service uptake for prevention of mother to child transmission of HIV in East Africa: a decomposition analysis. PLoS One. (2022) 17:e0273475. doi: 10.1371/journal.pone.0273475
45. Najafi, F, Pasdar, Y, Hamzeh, B, Rezaei, S, Moradi Nazar, M, and Soofi, M. Measuring and decomposing socioeconomic inequalities in adult obesity in Western Iran. J Prev Med Public Health. (2018) 51:289–97. doi: 10.3961/jpmph.18.062
46. Contoyannis, P, Hurley, J, and Walli-Attaei, M. When the technical is also normative: a critical assessment of measuring health inequalities using the concentration index-based indices. Popul Health Metrics. (2022) 20:21. doi: 10.1186/s12963-022-00299-y
47. Shibre, G, Mekonnen, W, and Haile Mariam, D. Decomposition analysis of women’s empowerment-based inequalities in the use of maternal health care services in Ethiopia: evidence from demographic and health surveys. PLoS One. (2023) 18:e0285024. doi: 10.1371/journal.pone.0285024
48. Kpodotsi, A, Baku, EA, Adams, JH, and Alaba, O. Socioeconomic inequalities in access and use of skilled birth attendants during childbirth in Ghana: a decomposition analysis. BMC Pregnancy Childbirth. (2021) 21:1–13. doi: 10.1186/s12884-021-04290-7
49. Lukwa, AT, Siya, A, Odunitan-Wayas, FA, and Alaba, O. Decomposing maternal socioeconomic inequalities in Zimbabwe; leaving no woman behind. BMC Pregnancy Childbirth. (2022) 22:239. doi: 10.1186/s12884-022-04571-9
50. Novignon, J, Ofori, B, Tabiri, KG, and Pulok, MH. Socioeconomic inequalities in maternal health care utilization in Ghana. Int J Equity Health. (2019) 18:1–11. doi: 10.1186/s12939-019-1043-x
51. Nwosu, CO, and Ataguba, JE. Socioeconomic inequalities in maternal health service utilisation: a case of antenatal care in Nigeria using a decomposition approach. BMC Public Health. (2019) 19:1–11. doi: 10.1186/s12889-019-7840-8
52. Zere, E, Oluwole, D, Kirigia, JM, Mwikisa, CN, and Mbeeli, T. Inequities in skilled attendance at birth in Namibia: a decomposition analysis. BMC Pregnancy Childbirth. (2011) 11:1–10. doi: 10.1186/1471-2393-11-34
53. Hwang, J. Decomposing socioeconomic inequalities in the use of preventive eye screening services among individuals with diabetes in Korea. Int J Public Health. (2016) 61:613–20. doi: 10.1007/s00038-016-0804-1
54. Bobo, F, and Hayen, A. Decomposition of socioeconomic inequalities in child vaccination in Ethiopia: results from the 2011 and 2016 demographic and health surveys. BMJ Open. (2020) 10:e039617. doi: 10.1136/bmjopen-2020-039617
55. van Malderen, C, Ogali, I, Khasakhala, A, Muchiri, SN, Sparks, C, van Oyen, H, et al. Decomposing Kenyan socio-economic inequalities in skilled birth attendance and measles immunization. Int J Equity Health. (2013) 12:3–13. doi: 10.1186/1475-9276-12-3
56. Amsalu, ET, Kefale, B, Muche, A, Fentaw, Z, Dewau, R, Chanie, MG, et al. The effects of ANC follow up on essential newborn care practices in East Africa: a systematic review and meta-analysis. Sci Rep. (2021) 11:12210. doi: 10.1038/s41598-021-91821-z
57. Ayele, AD, Tenaw, LA, Kassa, BG, Mihretie, GN, Belay, HG, Teffera, AG, et al. Knowledge and practice of essential newborn care and associated factors among women in Ethiopia: systematic review and meta-analysis. Reprod Health. (2022) 19:172. doi: 10.1186/s12978-022-01480-0
58. Tafere, TE, Afework, MF, and Yalew, AW. Does antenatal care service quality influence essential newborn care (ENC) practices? In Bahir Dar City Administration, north West Ethiopia: a prospective follow up study. Ital J Pediatr. (2018) 44:105. doi: 10.1186/s13052-018-0544-3
59. Selebano, KM, and Ataguba, JE. Decomposing socio-economic inequalities in antenatal care utilisation in 12 southern African development community countries. SSM Popul Health. (2022) 17:101004. doi: 10.1016/j.ssmph.2021.101004
60. Asif, A, and Akbar, M. Inequalities in child health care in Pakistan: measurement and decomposition analysis of maternal educational impact. Public Health. (2020) 183:94–101. doi: 10.1016/j.puhe.2020.03.029
61. Maharatha, TM, and Dash, U. Inequity in health care utilization for common childhood illnesses in India: measurement and decomposition analysis using the India demographic and health survey 2015–16. BMC Health Serv Res. (2021) 21:1–17. doi: 10.1186/s12913-021-06887-2
62. Siriwardhana, DD, Pathmeswaran, A, and Wickremasinghe, AR. Socioeconomic inequality and determinants of postnatal home visits made by public health midwives: an analysis of the Sri Lanka demographic and health survey. PLoS One. (2019) 14:e0215816. doi: 10.1371/journal.pone.0215816
Keywords: inequities, socioeconomic inequality, health checkup, newborn, concentration curve, concentration index, decomposition analysis, Ethiopia
Citation: Hagos A, Tiruneh MG, Abera KM, Tsega Y, Endawkie A, Negash WD, Workie AM, Yohannes L, Getnet M, Worku N, Belay AY, Asmare L, Alemu HT, Geberu DM, Demissie KA and Jejaw M (2024) Measuring socioeconomic inequalities in postnatal health checks for newborns in Ethiopia: a decomposition analysis. Front. Public Health. 12:1384729. doi: 10.3389/fpubh.2024.1384729
Edited by:
Shah Md Atiqul Haq, Shahjalal University of Science and Technology, BangladeshReviewed by:
Umesh Ghimire, University of Minnesota Twin Cities, United StatesCopyright © 2024 Hagos, Tiruneh, Abera, Tsega, Endawkie, Negash, Workie, Yohannes, Getnet, Worku, Belay, Asmare, Alemu, Geberu, Demissie and Jejaw. This is an open-access article distributed under the terms of the Creative Commons Attribution License (CC BY). The use, distribution or reproduction in other forums is permitted, provided the original author(s) and the copyright owner(s) are credited and that the original publication in this journal is cited, in accordance with accepted academic practice. No use, distribution or reproduction is permitted which does not comply with these terms.
*Correspondence: Asebe Hagos, YXNlYmVoYWdvczIxQGdtYWlsLmNvbQ==
Disclaimer: All claims expressed in this article are solely those of the authors and do not necessarily represent those of their affiliated organizations, or those of the publisher, the editors and the reviewers. Any product that may be evaluated in this article or claim that may be made by its manufacturer is not guaranteed or endorsed by the publisher.
Research integrity at Frontiers
Learn more about the work of our research integrity team to safeguard the quality of each article we publish.