
95% of researchers rate our articles as excellent or good
Learn more about the work of our research integrity team to safeguard the quality of each article we publish.
Find out more
ORIGINAL RESEARCH article
Front. Public Health , 27 June 2024
Sec. Infectious Diseases: Epidemiology and Prevention
Volume 12 - 2024 | https://doi.org/10.3389/fpubh.2024.1381204
 Zhi Yun1†
 Panpan Li1†Jinzhong Wang2†
 Feng Lin1
 Wenting Li3Minhua Weng3Yanru Zhang1Huazhi Wu1Hui Li1Xiaofang Cai1Xiaobo Li4Xianxian Fu5
 Tao Wu1,6*
 Yi Gao1*
Objective: Exploring the Incidence, Epidemic Trends, and Spatial Distribution Characteristics of Sporadic Hepatitis E in Hainan Province from 2013 to 2022 through four major tertiary hospitals in the Province.
Methods: We collected data on confirmed cases of hepatitis E in Hainan residents admitted to the four major tertiary hospitals in Haikou City from January 2013 to December 2022. We used SPSS software to analyze the correlation between incidence rate and economy, population density and geographical location, and origin software to draw a scatter chart and SAS 9.4 software to conduct a descriptive analysis of the time trend. The distribution was analyzed using ArcMap 10.8 software (spatial autocorrelation analysis, hotspot identification, concentration, and dispersion trend analysis). SAS software was used to build an autoregressive integrated moving average model (ARIMA) to predict the monthly number of cases in 2023 and 2024.
Results: From 2013 to 2022, 1,922 patients with sporadic hepatitis E were treated in the four hospitals of Hainan Province. The highest proportion of patients (n = 555, 28.88%) were aged 50–59 years. The annual incidence of hepatitis E increased from 2013 to 2019, with a slight decrease in 2020 and 2021 and an increase in 2022. The highest number of cases was reported in Haikou, followed by Dongfang and Danzhou. We found that there was a correlation between the economy, population density, latitude, and the number of cases, with the correlation coefficient |r| value fluctuating between 0.403 and 0.421, indicating a linear correlation. At the same time, a scatter plot shows the correlation between population density and incidence from 2013 to 2022, with r2 values fluctuating between 0.5405 and 0.7116, indicating a linear correlation. Global Moran’s I, calculated through spatial autocorrelation analysis, showed that each year from 2013 to 2022 all had a Moran’s I value >0, indicating positive spatial autocorrelation (p < 0.01). Local Moran’s I analysis revealed that from 2013 to 2022, local hotspots were mainly concentrated in the northern part of Hainan Province, with Haikou, Wenchang, Ding’an, and Chengmai being frequent hotspot regions, whereas Baoting, Qiongzhong, and Ledong were frequent cold-spot regions. Concentration and dispersion analysis indicated a clear directional pattern in the average density distribution, moving from northeast to southwest. Time-series forecast modeling showed that the forecast number of newly reported cases per month remained relatively stable in 2023 and 2024, fluctuating between 17 and 19.
Conclusion: The overall incidence of hepatitis E in Hainan Province remains relatively stable. The incidence of hepatitis E in Hainan Province increased from 2013 to 2019, with a higher clustering of cases in the northeast region and a gradual spread toward the southwest over time. The ARIMA model predicted a relatively stable number of new cases each month in 2023 and 2024.
Hepatitis E virus (HEV) is a spherical viral particle with a diameter of approximately 27–34 nm. It has spikes and indentations on its surface (1). In 1983, it was discovered in a patient’s feces using immunoelectron microscopy (2). Acute HEV infection generally has a good prognosis, however, there is still the possibility of extrahepatic complications, such as neurological symptoms and kidney damage (3). During pregnancy, HEV infection increases the risk of adverse outcomes, particularly during the second and third trimesters. After infection with HEV genotypes 1 and 2, a significant proportion of pregnant women progress to acute liver failure, with a mortality rate of up to 15–25% (4). A prospective study found that pregnant women infected with HEV have worse outcomes than those with acute viral hepatitis caused by other hepatitis viruses (5). In immunocompromised individuals and those with concomitant chronic hepatitis B infection, HEV infection often imposes a greater burden with a significantly longer course, higher economic burden, and greater resultant health loss (6). The prevention and control of hepatitis E (HE) is a major public health issue (7–10).
According to the World Health Organization, an estimated 20 million new HEV infections occur worldwide each year, with over 3 million people experiencing symptoms and 56,600 deaths related to HEV infection. The prevalence of HEV infection is high in developing countries in Asia and Africa (11, 12). In these countries, HE accounts for more than half of all cases of acute hepatitis. In North America, Europe, and other countries, reported cases and localized HE outbreaks are increasing yearly (13). The seroprevalence of HEV antibodies in the European population ranges from 7.5 to 31.9% (14). HE is endemic in China. The incidence rate of HE in China has been gradually increasing and HE is the most frequent cause of acute viral hepatitis in China (15). According to the latest data from the Chinese Center for Disease and Prevention,1 from 2018 to 2021 the number of cases and deaths from HE were higher than those from hepatitis A. Therefore, it is important to explore the spatiotemporal distribution characteristics of HE. Spatial epidemiology has been widely applied in infectious disease research (16–18). Recently, it has been applied to predict various infectious diseases such as hand-foot-and-mouth disease (19), tuberculosis, and COVID-19 (20, 21). By integrating geographical location and time information, these models can reveal the patterns and influencing factors of disease transmission and can thus be used to prevent and control various legally reportable infectious diseases (22). The autoregressive integrated moving average (ARIMA) model is a statistical model used for time-series analysis and forecasting. This model has been widely applied to the study of Hantavirus hemorrhagic fever (23) and COVID-19 The study aimed to use the model to analyze the epidemiological data of patients with HE to understand the spatiotemporal dynamics and epidemiological characteristics of HE incidence in Hainan Province in China. In addition, this study aimed to forecast the monthly incidence in 2023 and 2024 using this model.
Data on confirmed cases of HE from January 2013 to December 2022 were collected from four tertiary hospitals in Haikou, Hainan Province. The data collected included age, sex, date of onset, date of admission, date of diagnosis, residential address, and liver function indicators. These hospitals in Hainan Province can detect HE and are also the four hospitals with the highest number of admitted cases in the past decade. According to the comparison of the incidence data collected and the public health data (published up to 2020) released by the Chinese Center for Disease Control and Prevention,2 the data trends of both are the same. Among them, from 2016 to 2020, the number of cases in these four hospitals exceeded 50% of the cases in Hainan Province (Figure 1).
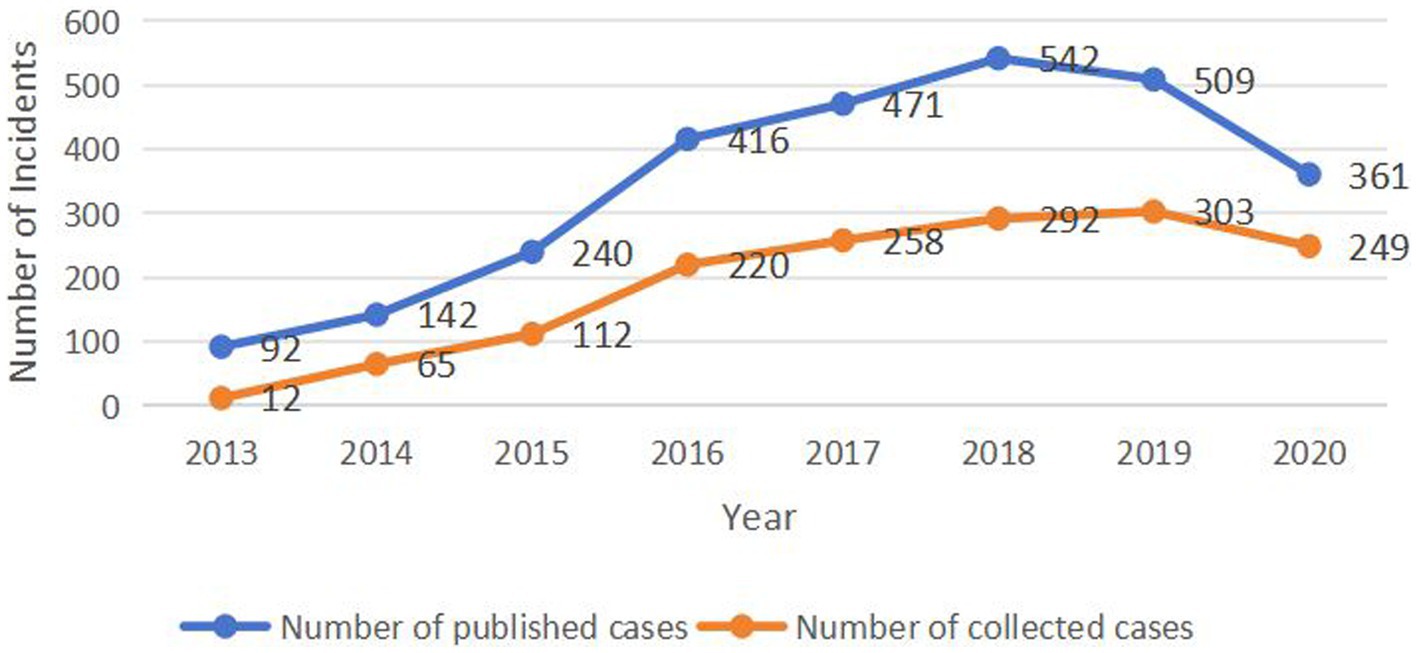
Figure 1. Comparison of the number of published and collected cases.
Demographic data were obtained from the Hainan Provincial Government Data Unified Open Platform.3 The electronic map source for the fourth-level coordinate boundary data for cities and counties in the province was obtained from the Hainan Provincial Geographic Information Public Service Platform.4 Population density and economic data from the 2023 Hainan Statistical Yearbook. The longitude and latitude data of each city and county are sourced from Tianmap.5 In this study, all cases of HE were categorized according to the 2018 ESAL Clinical Practice Guidelines for HE Infection (24), based on accurate diagnostic criteria.
The study was approved by the institutional review boards of each of the project implementation hospitals, and all procedures complied with the local ethical standards, and the Declaration of Helsinki of 1964 and subsequent amendments. As this was a retrospective observational study, the requirement for informed consent was waived.
The administrative code was used as the linking field to link the incidence data of each city and county in Hainan Province with its vector electronic map (*shop format) using ArcGIS software. IBM SPSS Statistics 24.0 was used to analyze the correlation between population density, economy, geographical location (longitude and latitude), and incidence rate, and origin software was used to draw scatter plots. Data management and statistical analysis, including logistic regression, were performed using SAS 9.4 (version 9.4, SAS Institute, Inc., Cary, NC, United States). Plots were constructed using R version 4.3.2 (R Foundation for Statistical Computing, Vienna, Austria). Categorical variables were constructed using frequencies and percentages. Between-group comparisons were performed using the chi-square test. Fisher’s exact test was used when the expected frequency in any cell was <5.
ArcMap 10.8 was used for map drawing, spatial hotspot analysis, and spatial concentration and dispersion trend analysis of the HE epidemic. SAS 9.4 software was used to build an ARIMA model and the “auto. Arima” function in R was used to automatically search for the best parameters based on the Akaike information criterion (AIC), to determine the optimal model. The model was tested using the Ljung-Box test to assess the goodness of fit. Finally, a well-fitted model was used to predict the monthly incidence time series of HE in Hainan Province for 2023 and 2024. The specific indicators are described in the sections that follow.
The spatial patterns of the entire study area were explored by using a single value to reflect the autocorrelation pattern of the region. The primary indicator in the global autocorrelation analysis is Moran’s I index, with a range of values between −1 and 1. A value closer to 1 indicates a higher degree of clustering, whereas a value closer to −1 indicates greater dispersion. The formula is as follows:
In this context, = , where n represents the total number of cities and counties, and represent the incidence numbers of the ith and jth spatial units, respectively, and represents the mean incidence of cases across all cities and counties and serves as the spatial weighting value. The global Moran’s I require a significance test, typically a Z-test. The formula for the Z-test of the global Moran’s I is as follows:
Where the calculation methods for the mean and variance are:
Local Moran’s I analysis was used to study the degree of correlation between the attributes of each spatial unit and its neighboring units. It can effectively detect spatial variation caused by spatial correlation, complementing the limitations of the global Moran’s I analysis and identifying spatial hot spots or high-incidence areas. The specific indicator was the local Moran’s I index. For each calculated value, its standardized Z-value was computed for significance testing, determining whether it passed the test and identifying hot spots and cold spots. In this study, Z-value >2.58 indicated hotspots, and Z-values <2.58 indicated cold-spots. p-values <0.1, < 0.05, and < 0.01 corresponded to the 90, 95, and 99% confidence levels, respectively. The results were visually presented using ArcMap software in the form of a local indicator of a spatial association (LISA) cluster map. The formula is as follows:
In this context, , where represents spatial weighting values, n represents the total number of all cities and counties, represents the local Moran’s I index for the i-th city or county, represents the incidence of HE in the i-th city or county, represents the incidence of HE in the j-th city or county, and represents the average incidence of HE across all cities and counties. The local Moran’s I require a Z-test, and the formula for the Z-test is:
In this context, is the expected value of the local Moran’s I, and is the variance of the local Moran’s I. Based on the Z-value, the corresponding p-value is calculated to assess the local pattern for each city or county.
Time series can be represented as a set of data points arranged chronologically. The ARIMA model was used to predict the univariate time-series data. This model uses a combination of differencing, autoregression, and moving averages to estimate the peak time and magnitude of HE cases monthly and annually for each city and county in the province in 2023 and 2024. This included:
1. Data preparation: Checks were performed to determine whether the sequence satisfied stationarity and the augmented Dickey-Fuller test results for time-series stationarity were examined. The t-value was analyzed to determine whether the assumption of non-stationarity could be significantly rejected (p < 0.05). The data were inspected before and after differencing (d-value) to confirm stationarity (small fluctuation amplitudes).
2. Model order determination: The ARIMA model is represented as ARIMA (p, d, q), where p (autoregressive order), d (differencing order), and q (moving average order) are the three essential parameters. The d-value was determined by differentiating the time-series data in a certain order. The p-value was determined by examining the autocorrelation coefficient plots (ACF) for tailing and partial autocorrelation coefficient plots (PACF) for truncation. The q value was determined from the ACF truncation and PACF tailing.
3. Model parameter estimation: The AIC values were combined and the AIC values for different differencing orders were compared. The “auto. Arima” function in R was used to search for the best parameters based on the AIC (minimizing the value).
4. Model evaluation: Model residuals were visualized to check whether they follow a normal distribution (normality test). The p-value of the Q statistic (p > 0.01 indicates white noise) was used to test the model’s white noise; that is, the Ljung-Box test was used to assess whether the residual sequence was random and evaluate the model fitting effect.
5. Model prediction: The well-fitted ARIMA (0,1,1)(1,0,0)[12] model was used to forecast the monthly incidence time series of HE in Hainan Province for 2023 and 2024. The predicted results were plotted to visualize the forecast.
From 2013 to 2022, the total incidence of HE among residents of the four hospitals of Hainan Province was 1,922, with 1,466 cases in males and 456 in females, resulting in a sex ratio of 3.21:1. From 2013 to 2019, the HE incidence increased from 0.134 per 100,000 to 3.207 per 100,000, showing an overall upward trend. The incidence rate rose from 0.13 per 100,000 in 2013 to 3.21 per 100,000 in 2019, decreased slightly in 2020 and 2021, and increased again to 2.25 per 100,000 in 2022 (Table 1). In the province, 1,922 cases of HE were reported, with seven cases in the 0–14-year age group, 1,284 cases in the 15–59-year age group, and 631 cases aged 60 years and above, representing 0.37, 66.80, and 32.83% of the population, respectively. The highest percentage was in the 50–59-year age group (555 cases, 28.88%; Figure 2).
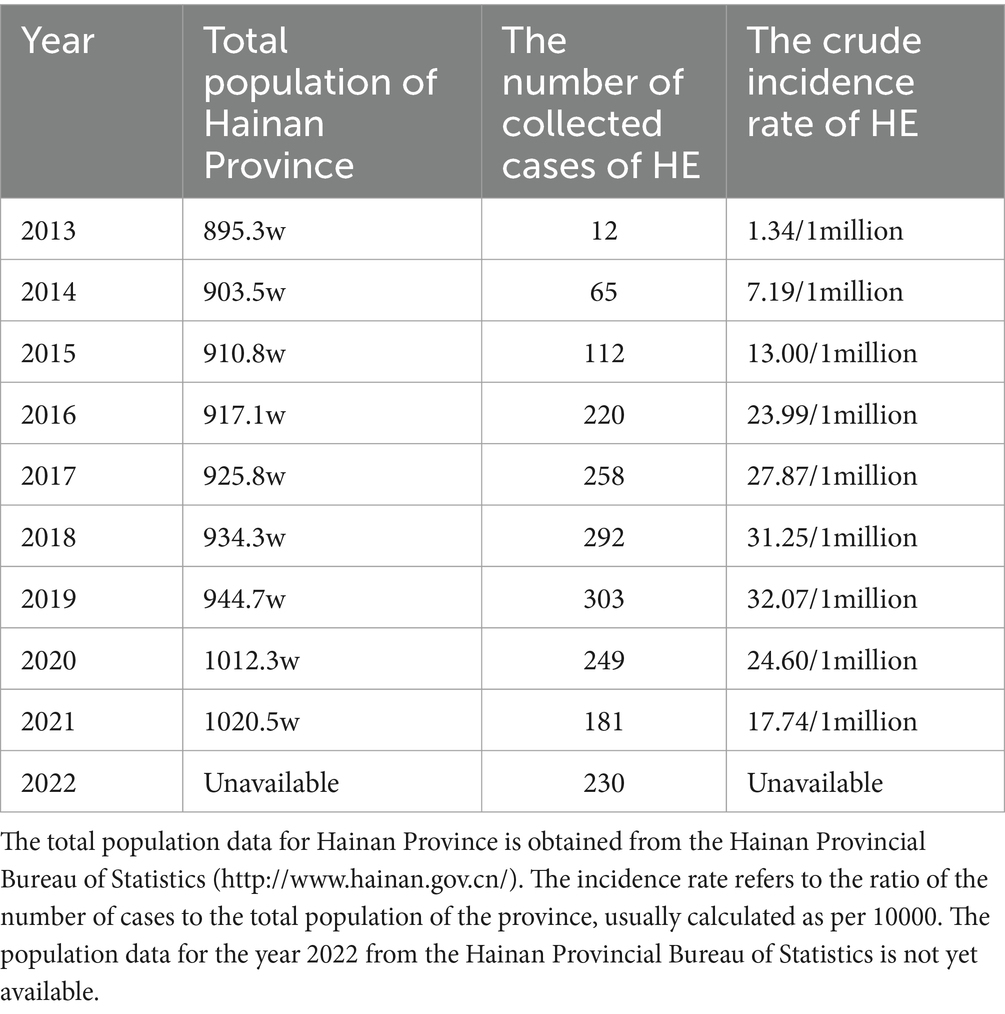
Table 1. Collected Hepatitis E cases data and estimated crude incidence rates from 2013 to 2022.
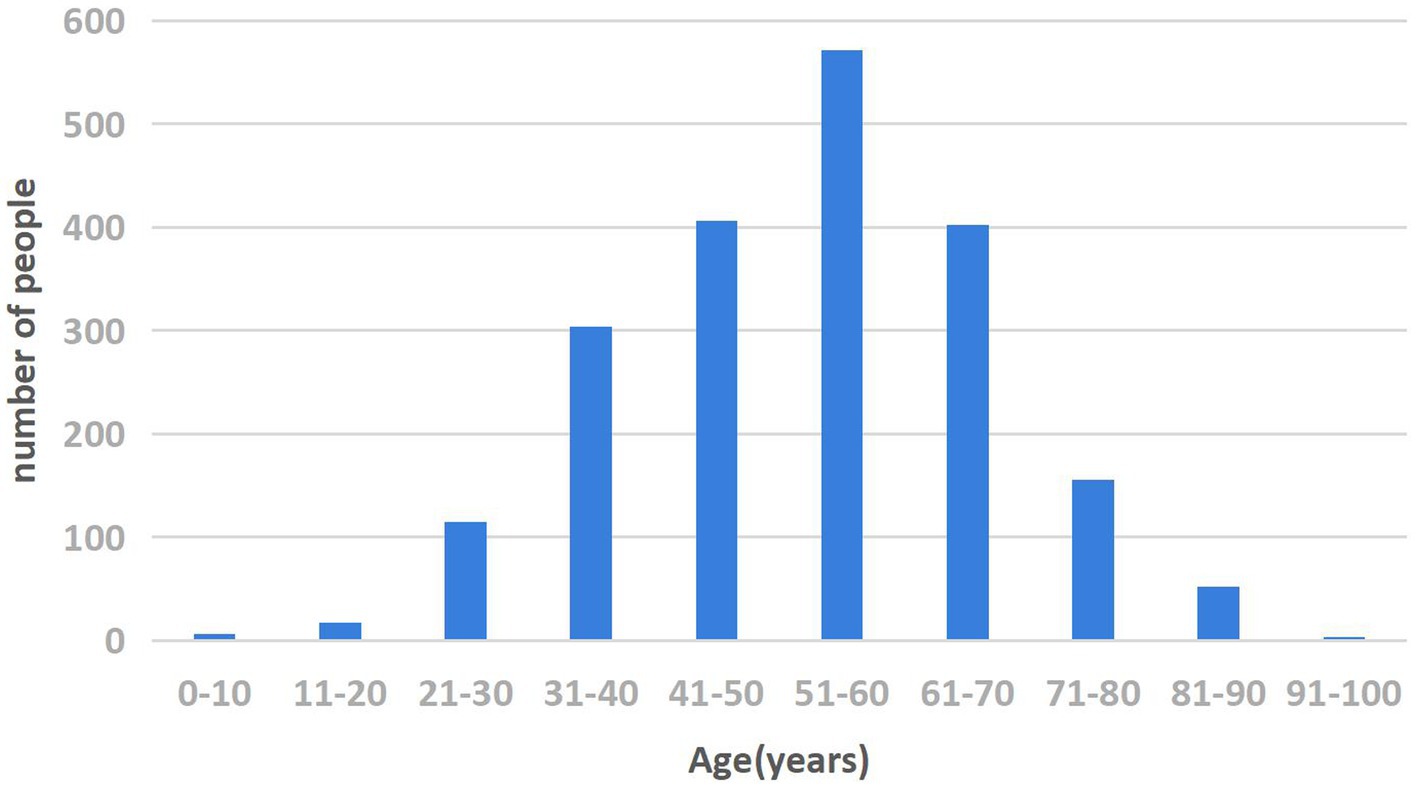
Figure 2. Age distribution of HE in the four hospitals of Hainan Province from 2013 to 2022.
From 2013 to 2022, the incidence of HE in the four hospitals of Hainan Province was highest in Haikou, with 498 cases, followed by Dongfang City and Danzhou City, with 234 and 170 cases, respectively. The least affected area was Wuzhishan (14 cases). The five areas with the highest incidence of HE from 2013 to 2022 were Haikou City, Dongfang City, Danzhou City, Wanning City, and Lin Gao County. The incidence was higher in the northwest areas of Hainan Province and lower in the southeast (Figure 3).
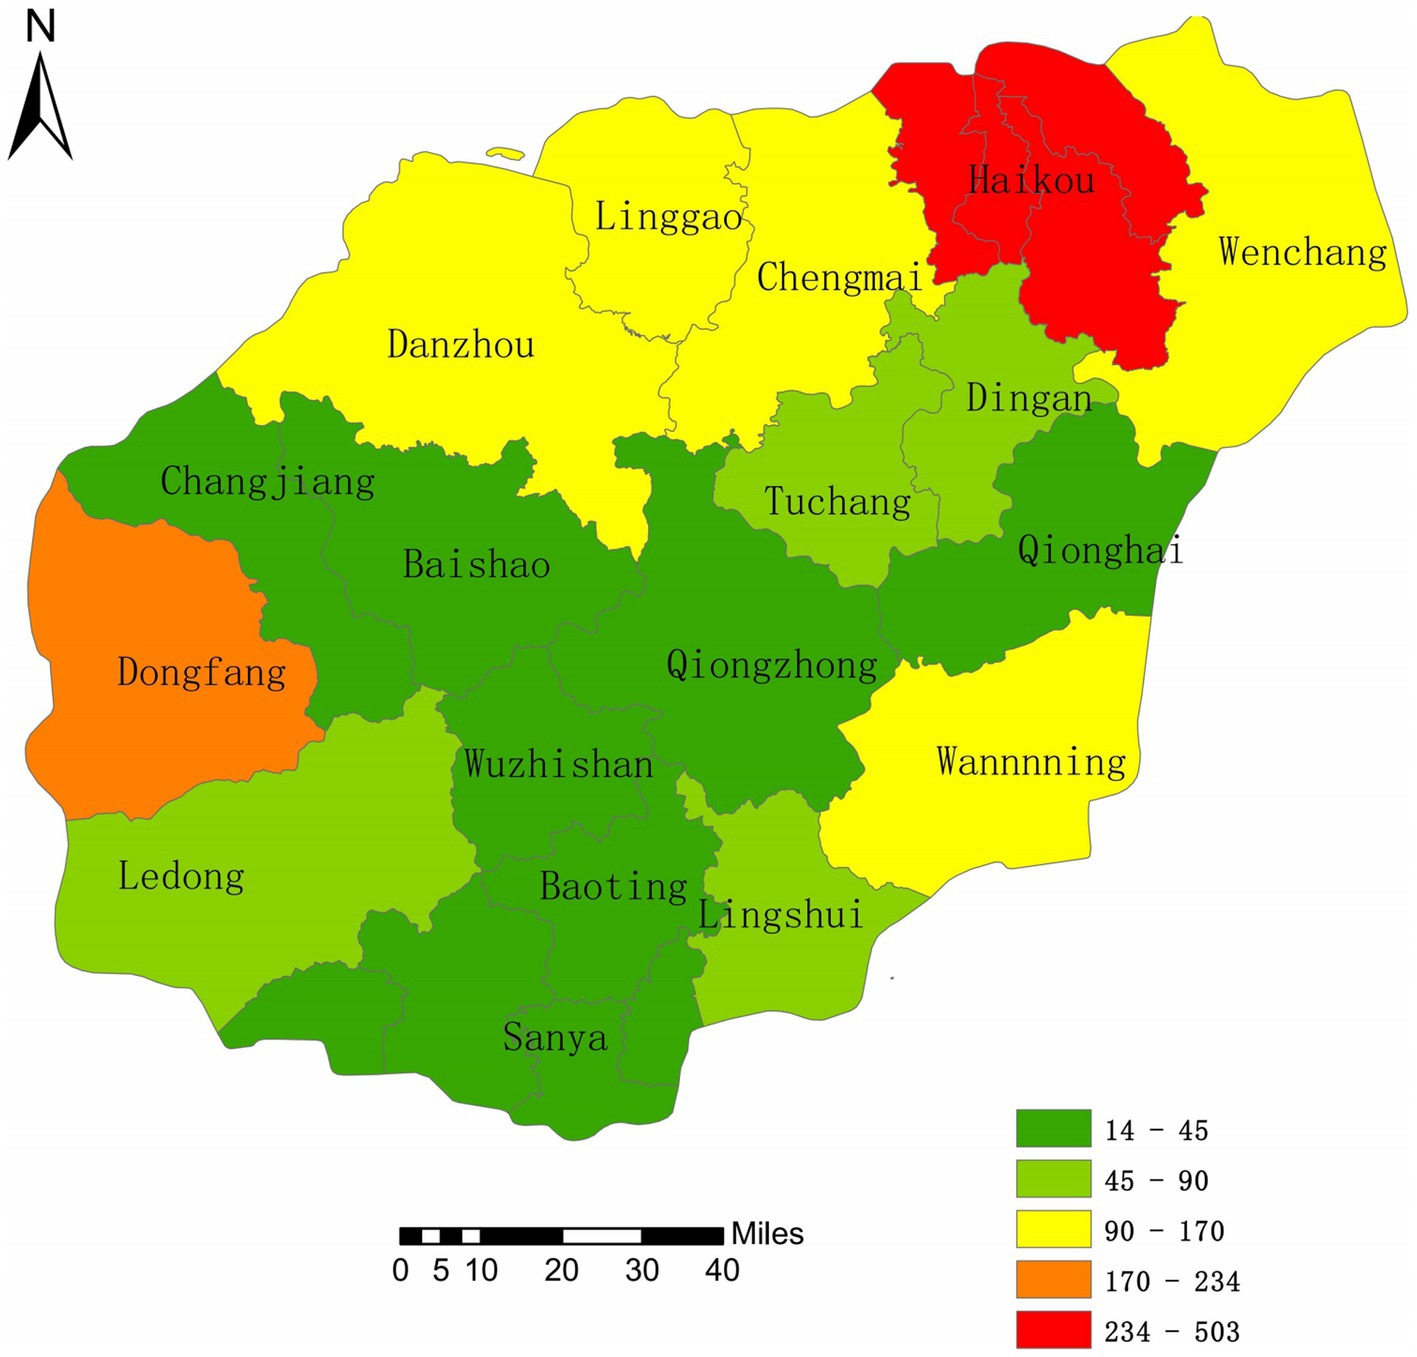
Figure 3. Spatial distribution Map of HE incidence.
We conducted a correlation analysis on the influencing factors of morbidity, specifically focusing on population density, economy, and geographical location. We conducted a normality test on the number of reported cases from 2013 to 2022, and the significance p-value was less than 0.05, indicating that the data does not follow a normal distribution. The calculation of Spearman correlation coefficients showed that the correlation coefficients (r-values) between morbidity and population density, economy, and geographical location (latitude) are 0.414, 0.421, and 0.403, respectively (Table 2). At the same time, a scatter plot was drawn to show the correlation between population density and incidence from 2013 to 2022, with r2 values fluctuating between 0.5405 and 0.7116, indicating a linear correlation (Figure 4).
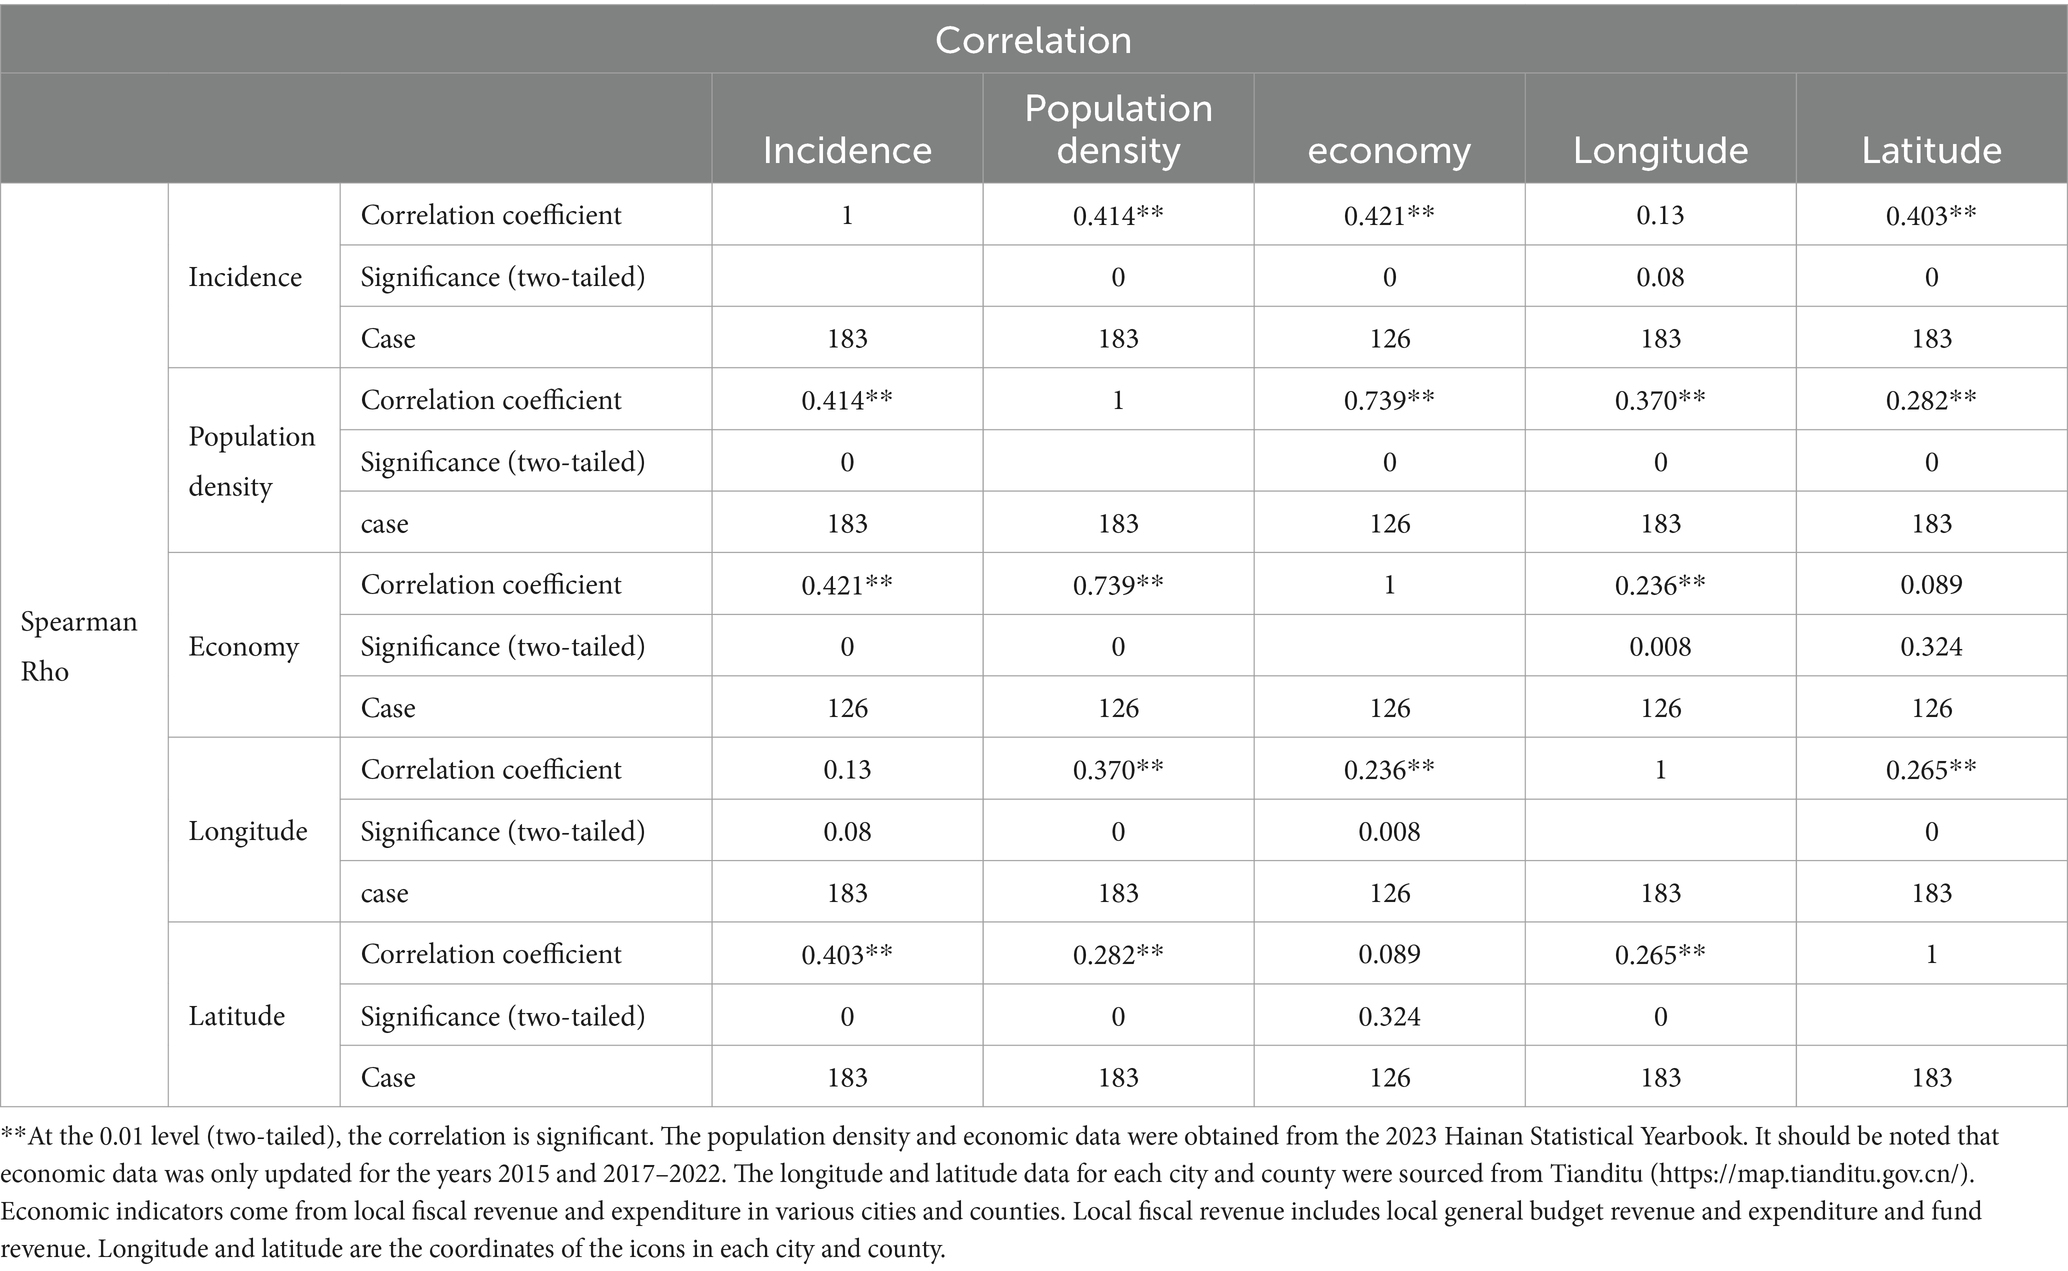
Table 2. Spearman correlation coefficients of population density, economy, geographic location (latitude and longitude), and incidence from 2013 to 2022.
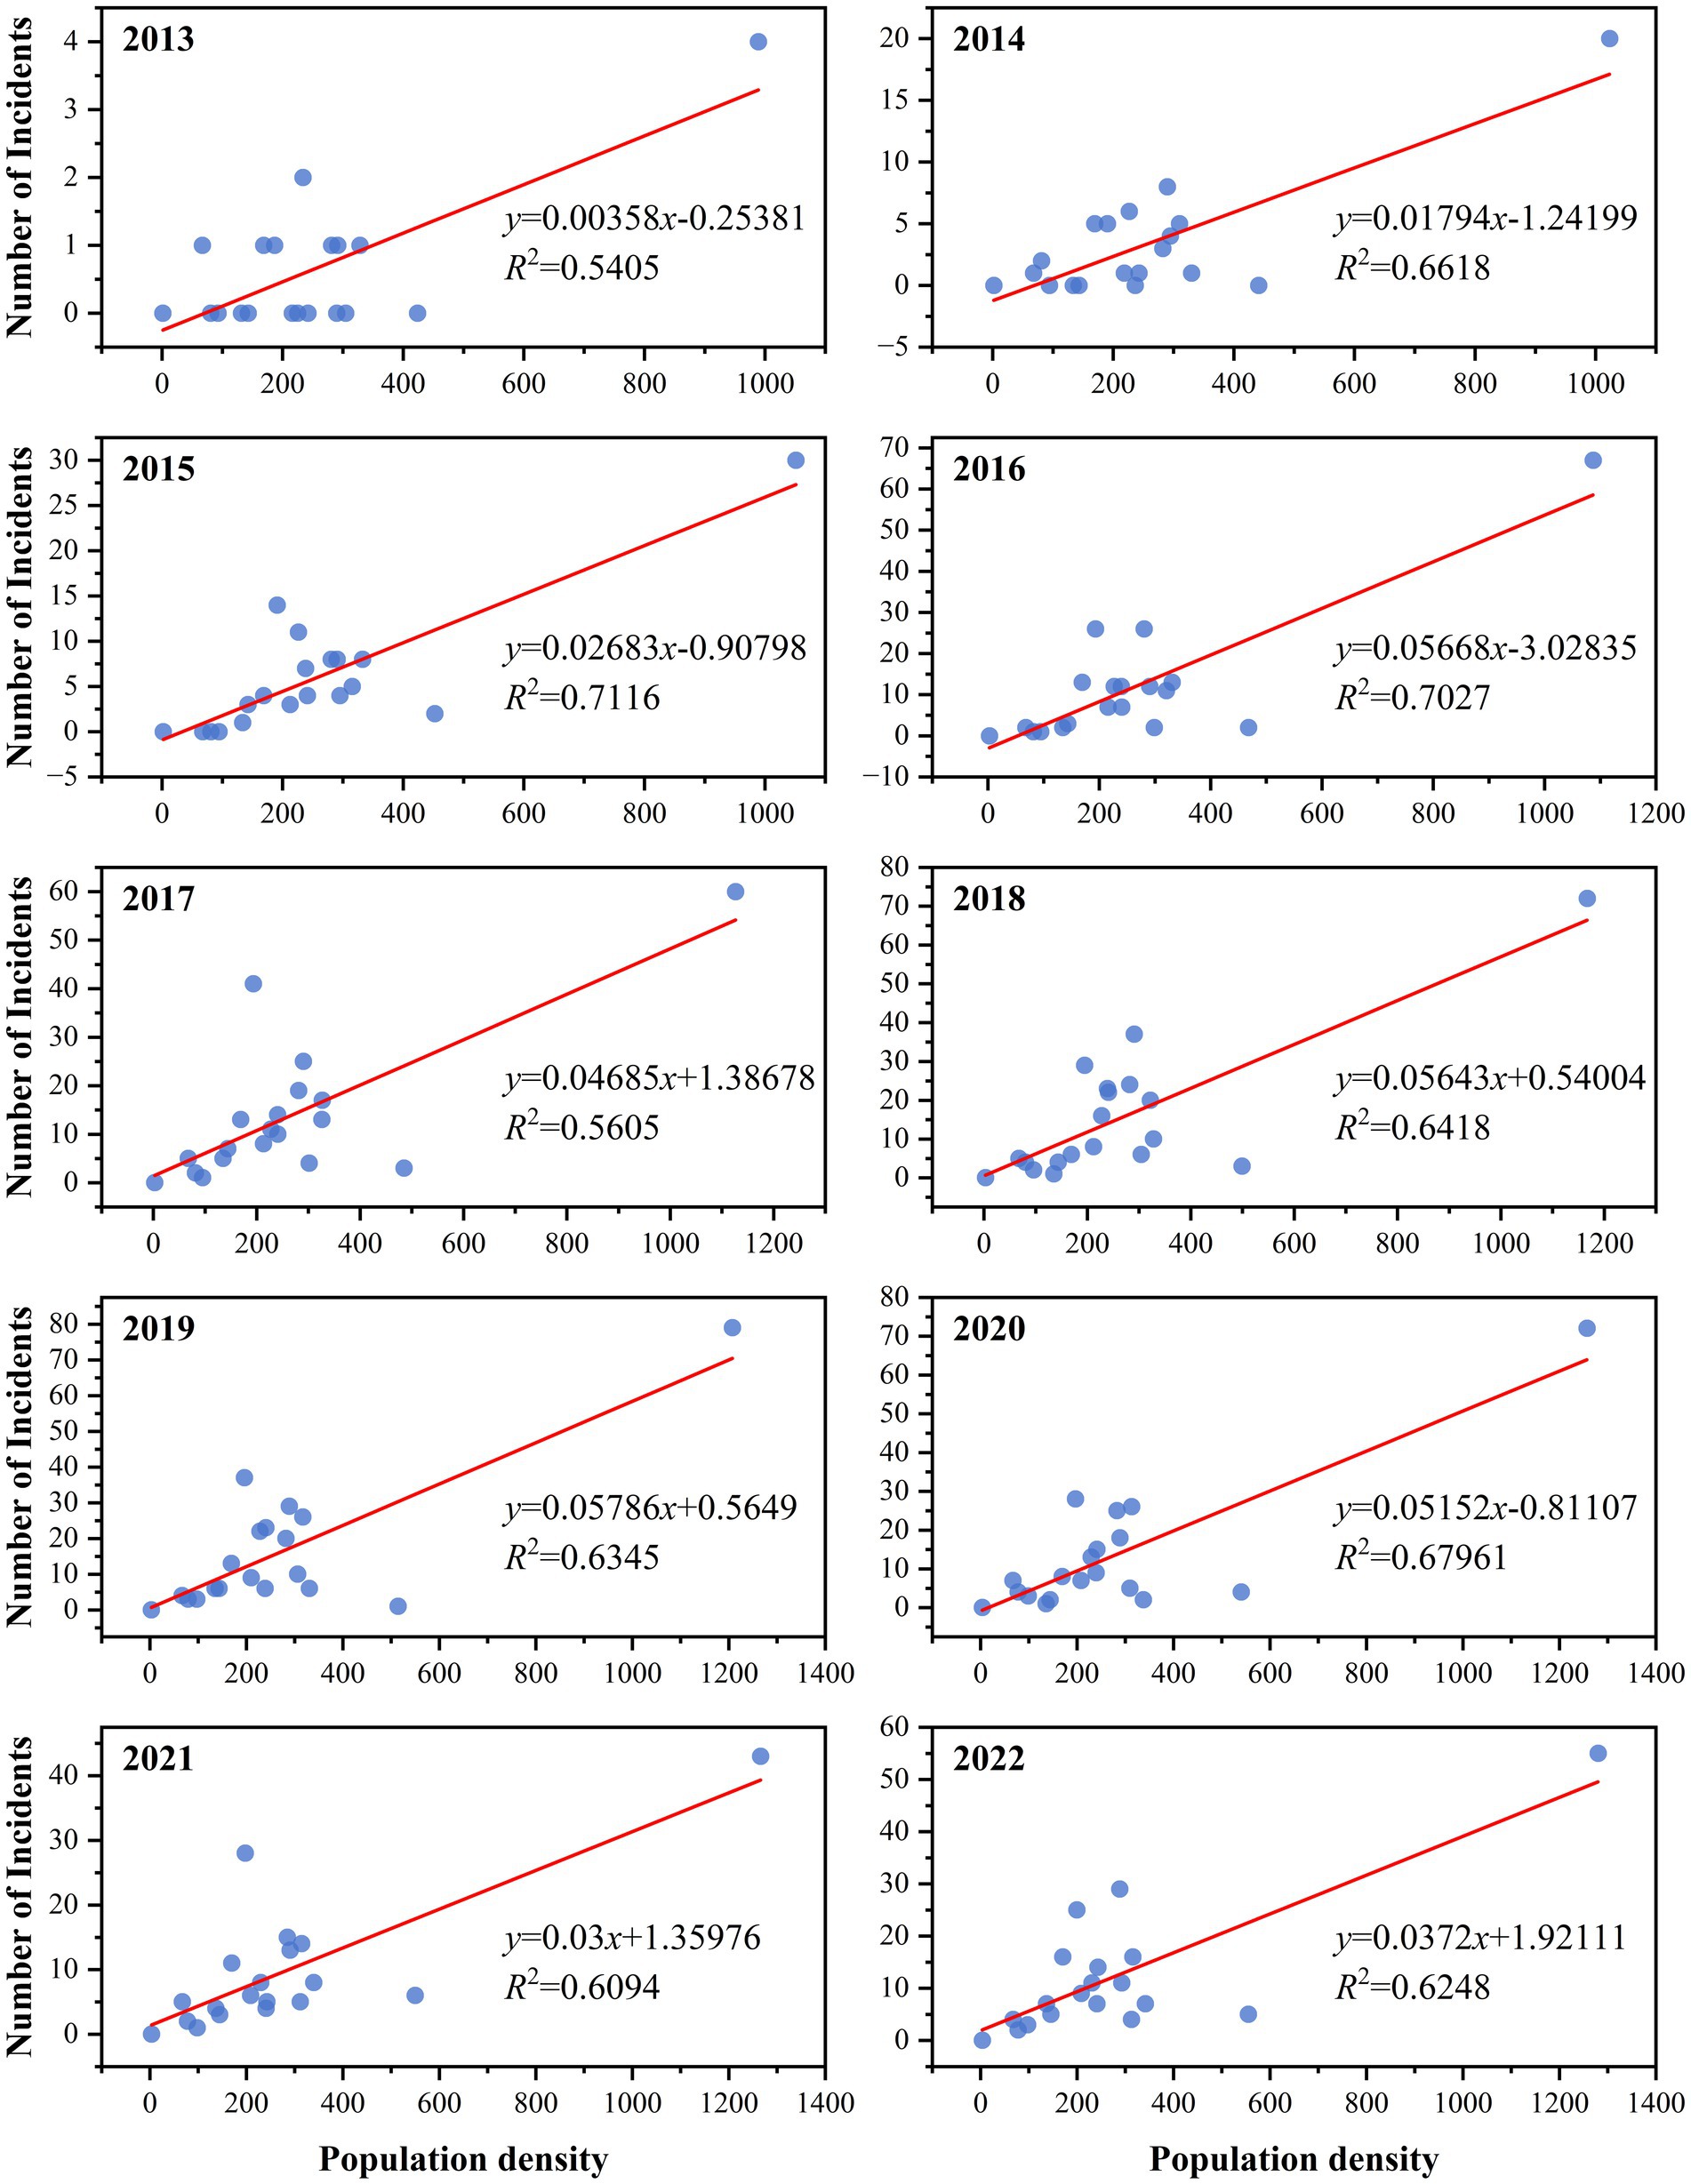
Figure 4. Scatter plot of the correlation between population density and the incidence of hepatitis E from 2013 to 2022.
From 2013 to 2022, Moran’s I index for each year was consistently positive, ranging from 0.40 to 0.57. The year 2018 (Moran’s I = 0.57) had the highest value, whereas 2021 (Moran’s I = 0.40) had the lowest value. This suggests that the data were not randomly distributed and exhibited a significant positive spatial autocorrelation, indicating a clear clustered distribution (Table 3).
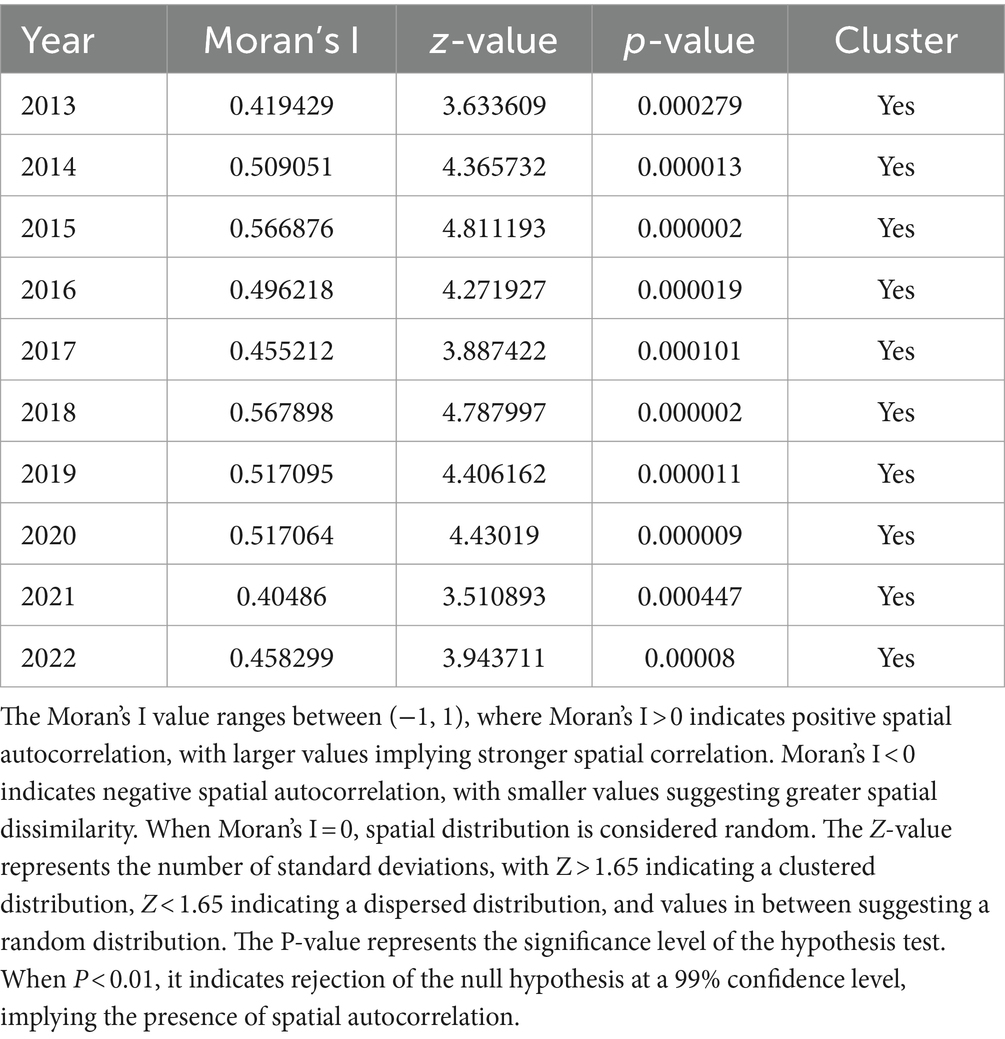
Table 3. Moran’s I values for the overall spatial autocorrelation of HE incidence rate in Hainan Province from 2013 to 2022.
From 2013 to 2022, the average density of HE incidence in the four hospitals of Hainan Province revealed seven clusters. During this period, the incidence was concentrated in the northern region (Figure 5). HE hotspots varied yearly from 2013 to 2022. In 2013, the hotspots were Haikou and Wenchang, with Baoting being the only cold-spot. In 2014, the hotspots were Haikou, Wenchang, Chengmai, and Ding’an, with cold spots in Ledong and Baoting. In 2015, the hotspots were the same as those in 2014, with cold spots in Wuzhishan, Baisha, Ledong, Baoting, and Qiongzhong. In 2016 and 2017, the hotspots were Haikou and Ding’an, with cold spots in Ledong, Baoting, and Qiongzhong. In 2018, the hotspots were Haikou and Ding’an, with cold spots in Ledong, Baoting, and Sanya. In 2019 and 2020, the hotspots were Haikou and Ding’an, with cold spots in Ledong, Baoting, and Sanya. In 2021, the hotspot was Haikou, with cold spots in Baoting and Qiongzhong. In 2022, the hotspots were Haikou and Ding’an, with cold spots in Baoting and Qiongzhong (Figure 5).
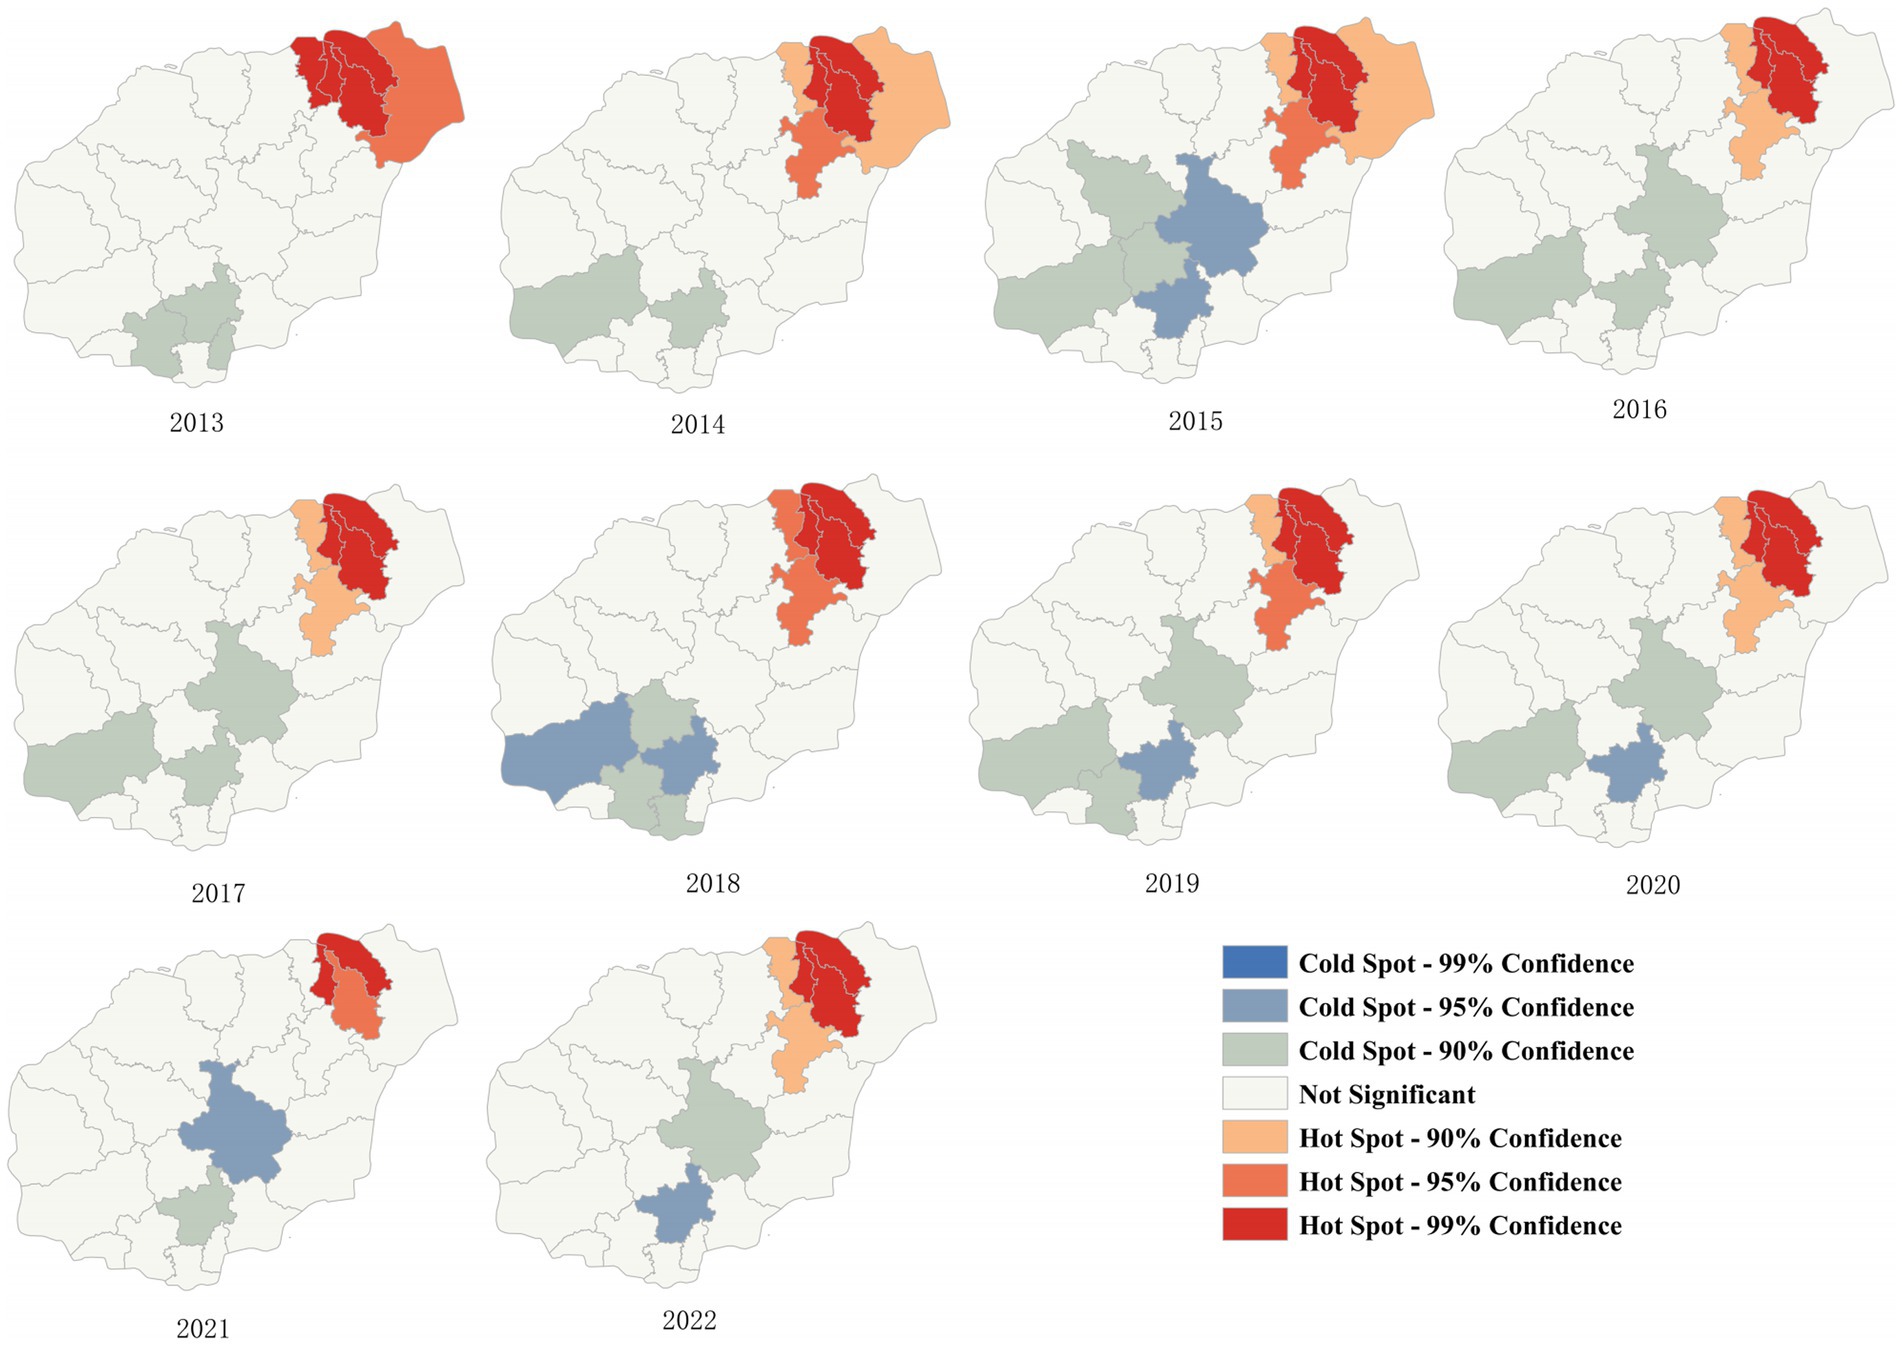
Figure 5. LISA of the four hospitals of Hainan Province from 2013 to 2022.
Figure 6 shows the changes in the average center and standard deviation ellipse of the average density distribution of HE incidence cases in Hainan Province from 2013 to 2022. The average center of the density distribution of HE cases in Hainan Province initially moved from the northeast to the southwest in 2013, continued to move from the northeast to the southwest after 2015, shifted from the northeast to the southwest again after 2019, and moved back to the northeast by 2022. From 2013 to 2021, the distribution was mainly concentrated at the junction of Chengmai, Tunchang, and Ding’an Counties, whereas in 2022, it was mainly concentrated in Haikou City.
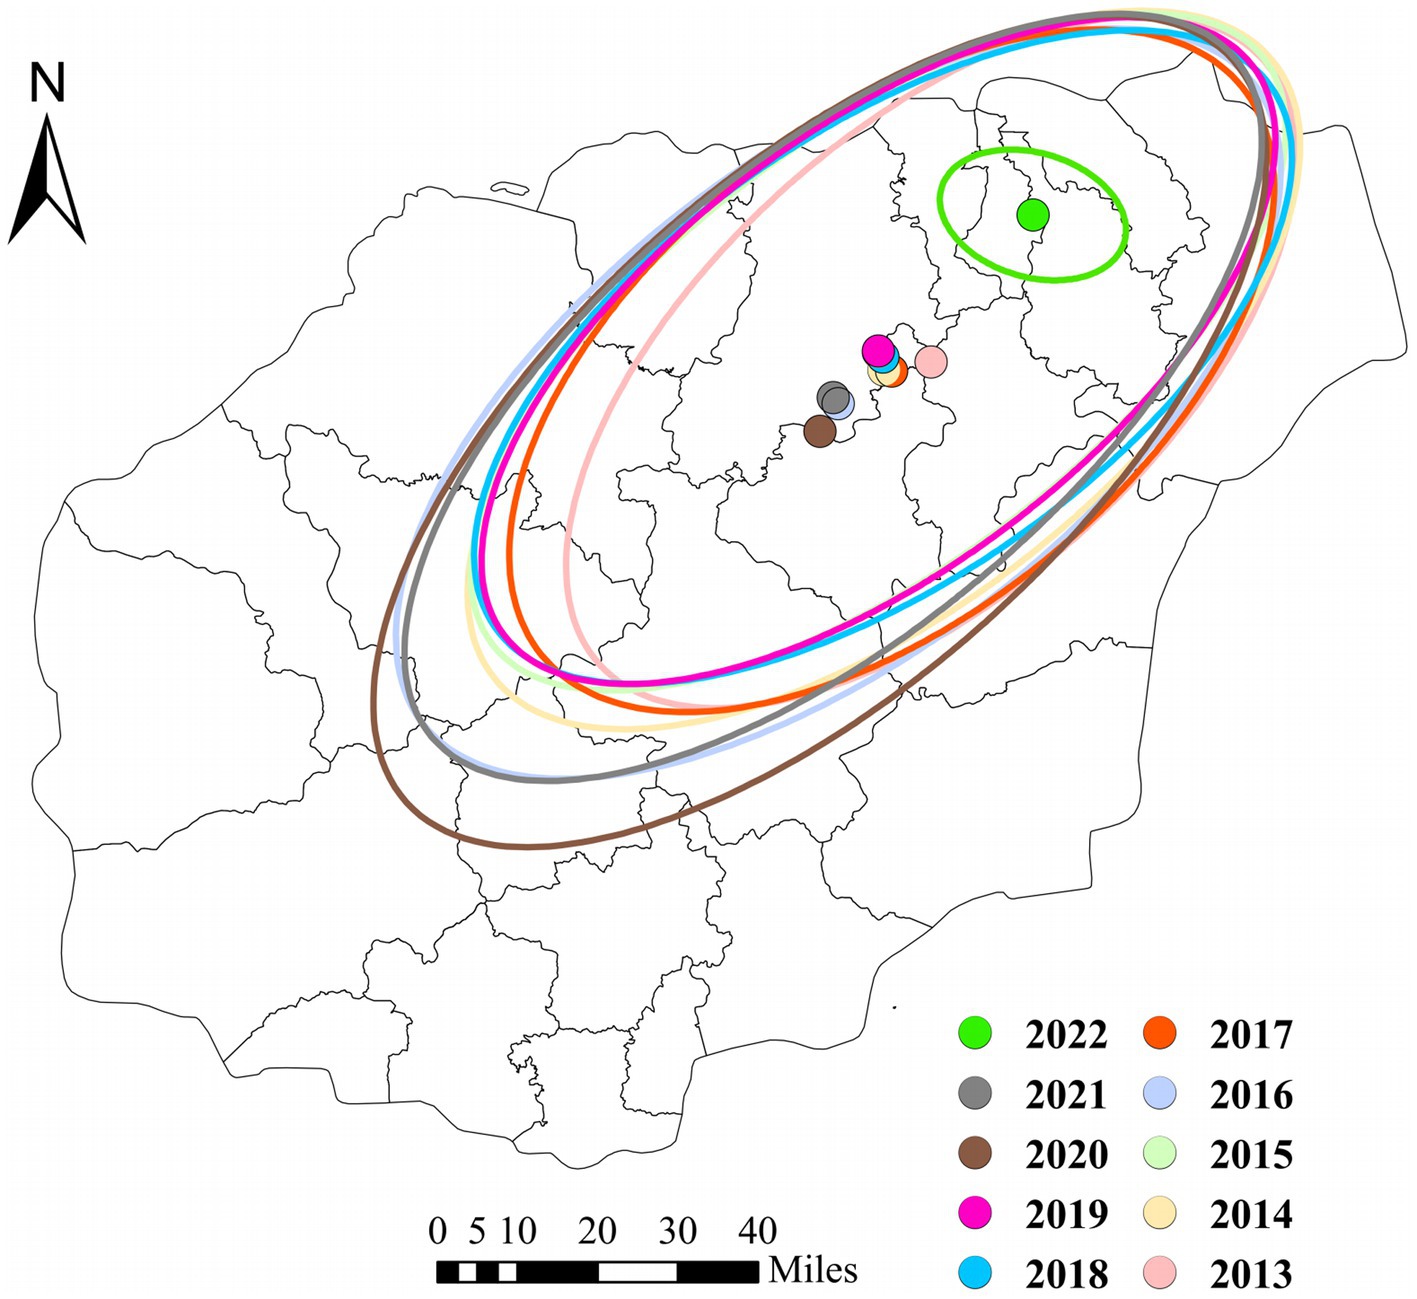
Figure 6. Changes in the Center and Dispersion Trend of Average Density of HE Cases in the four hospitals of Hainan Province from 2013 to 2022.
The reported incidence of HE in the four hospitals of Hainan Province increased from 12 cases in 2013 to 230 cases in 2022, with cases reported throughout all four seasons, constituting a seasonal cycle of 12 months. As shown in the time-series plot of HE incidence in the four hospitals of Hainan Province from 2013 to 2022 (Figure 7), there is no clear seasonal peak or regularity in the number of HE cases, indicating a non-stationary sequence (P for stationary test before differencing = 0.3922). After adjustment, the autocorrelation and partial autocorrelation coefficients were within the 95% confidence interval (CI). The autocorrelation function exhibits a rapid decay, suggesting that the adjusted series is similar to a stationary sequence (P for the stationary test after first-order differencing = 0.01). Figure 8 shows the autocorrelation and partial autocorrelation plots before and after differencing, confirming that the time series meets the requirements of a stationary non-white noise sequence. Using the “auto. Arima” function in R, based on AIC for automatic parameter selection, the model with ARIMA (0,1,1)(1,0,0)[12] had the lowest AIC value of 713.2863, indicating that the preliminary model is an ARIMA (0,1,1)(1,0,0)[12] model with a 12-month cycle. The parameters of the ARIMA (0,1,1)(1,0,0)[12] model are specified as follows: p = 0, d = 1, and q = 1, indicating a differencing order of 1 and a moving average order of 1. (1,0,0) denotes a seasonal differencing order of 1, indicating a seasonal difference at the 12-time points (Table 4). The Ljung-Box test was used to evaluate the model’s fitting effect (p > 0.05), with Q = 17.378 and p = 0.7422, indicating that the established model parameters were statistically significant, with the white noise test passed (Figure 9). Therefore, the fitted model is considered effective, and the predicted values suggest that the monthly newly reported cases will be relatively stable in 2023 and 2024, fluctuating between 17 and 19 cases (Table 5). Visualization of the prediction results showed that the 95% CI of the true values was within the predicted range, indicating that the dynamic trend of the prediction model was generally consistent with the actual incidence (Figure 10).
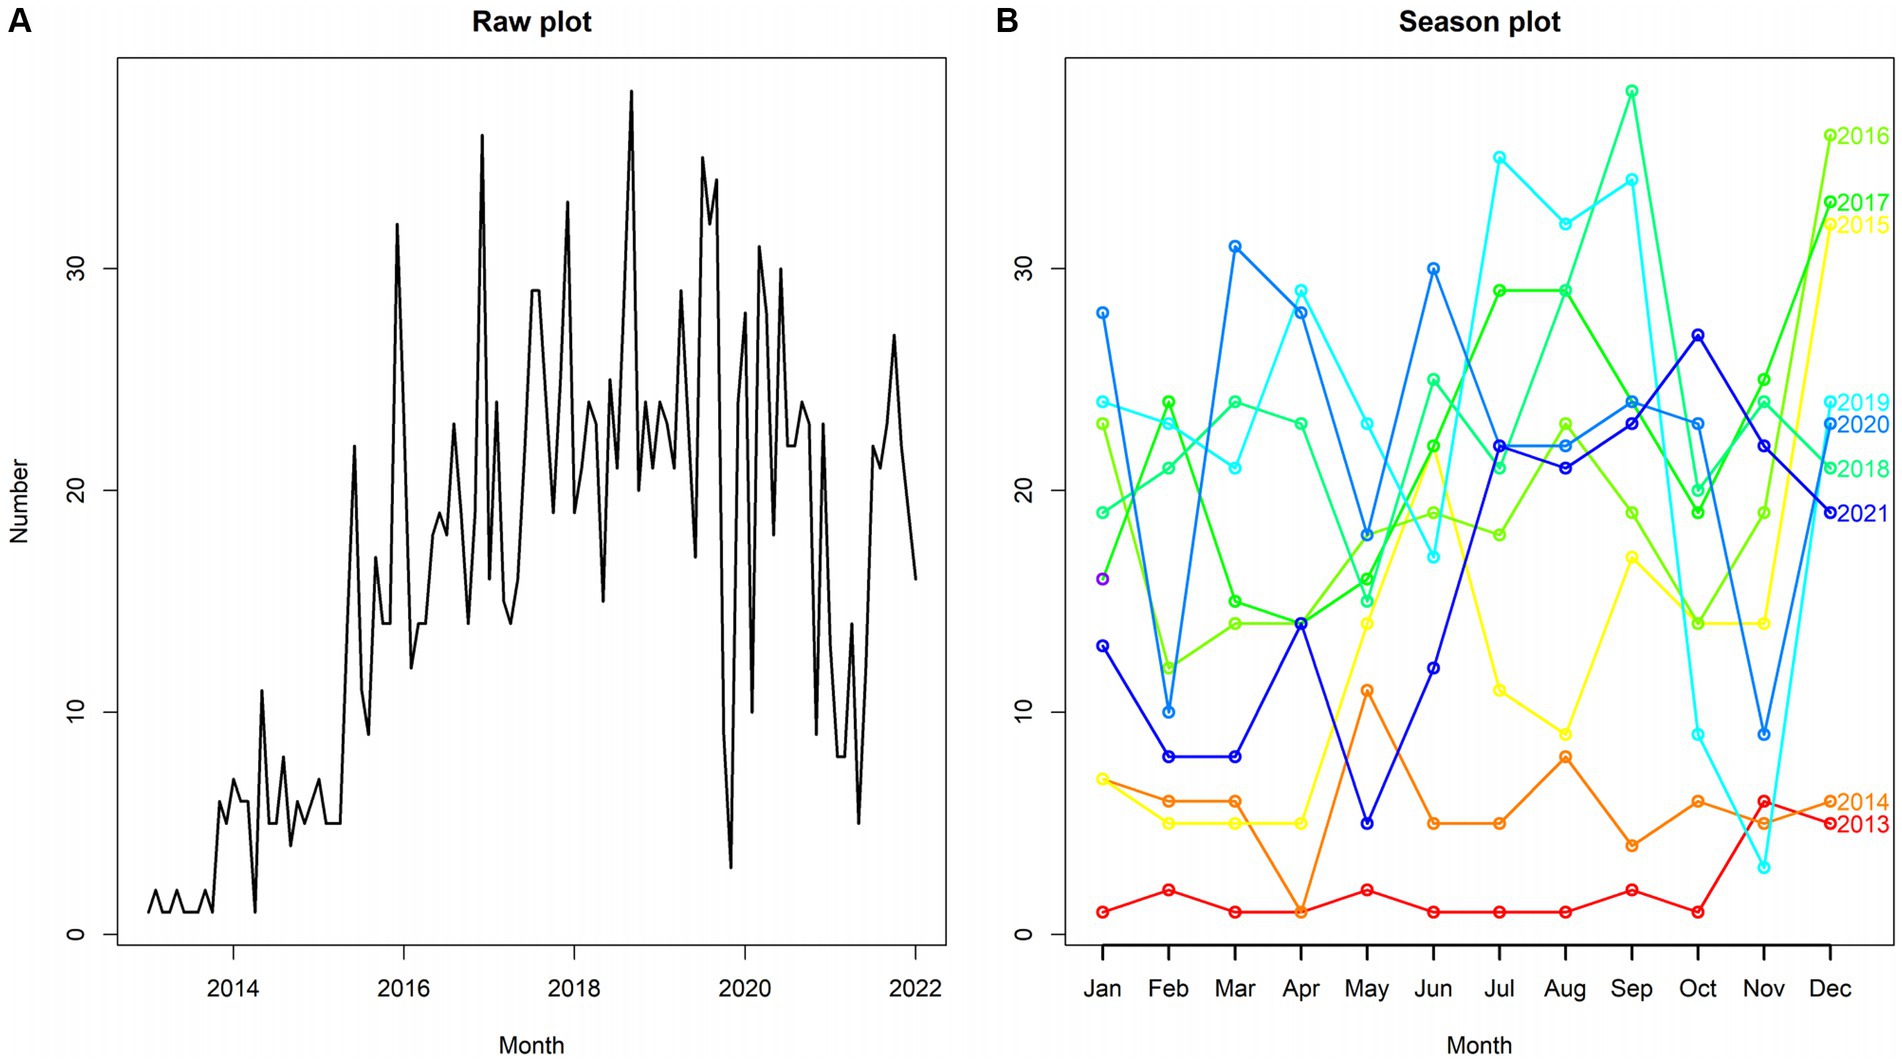
Figure 7. Time series chart of hepatitis E incidence in the four hospitals of Hainan Province from 2013 to 2022.
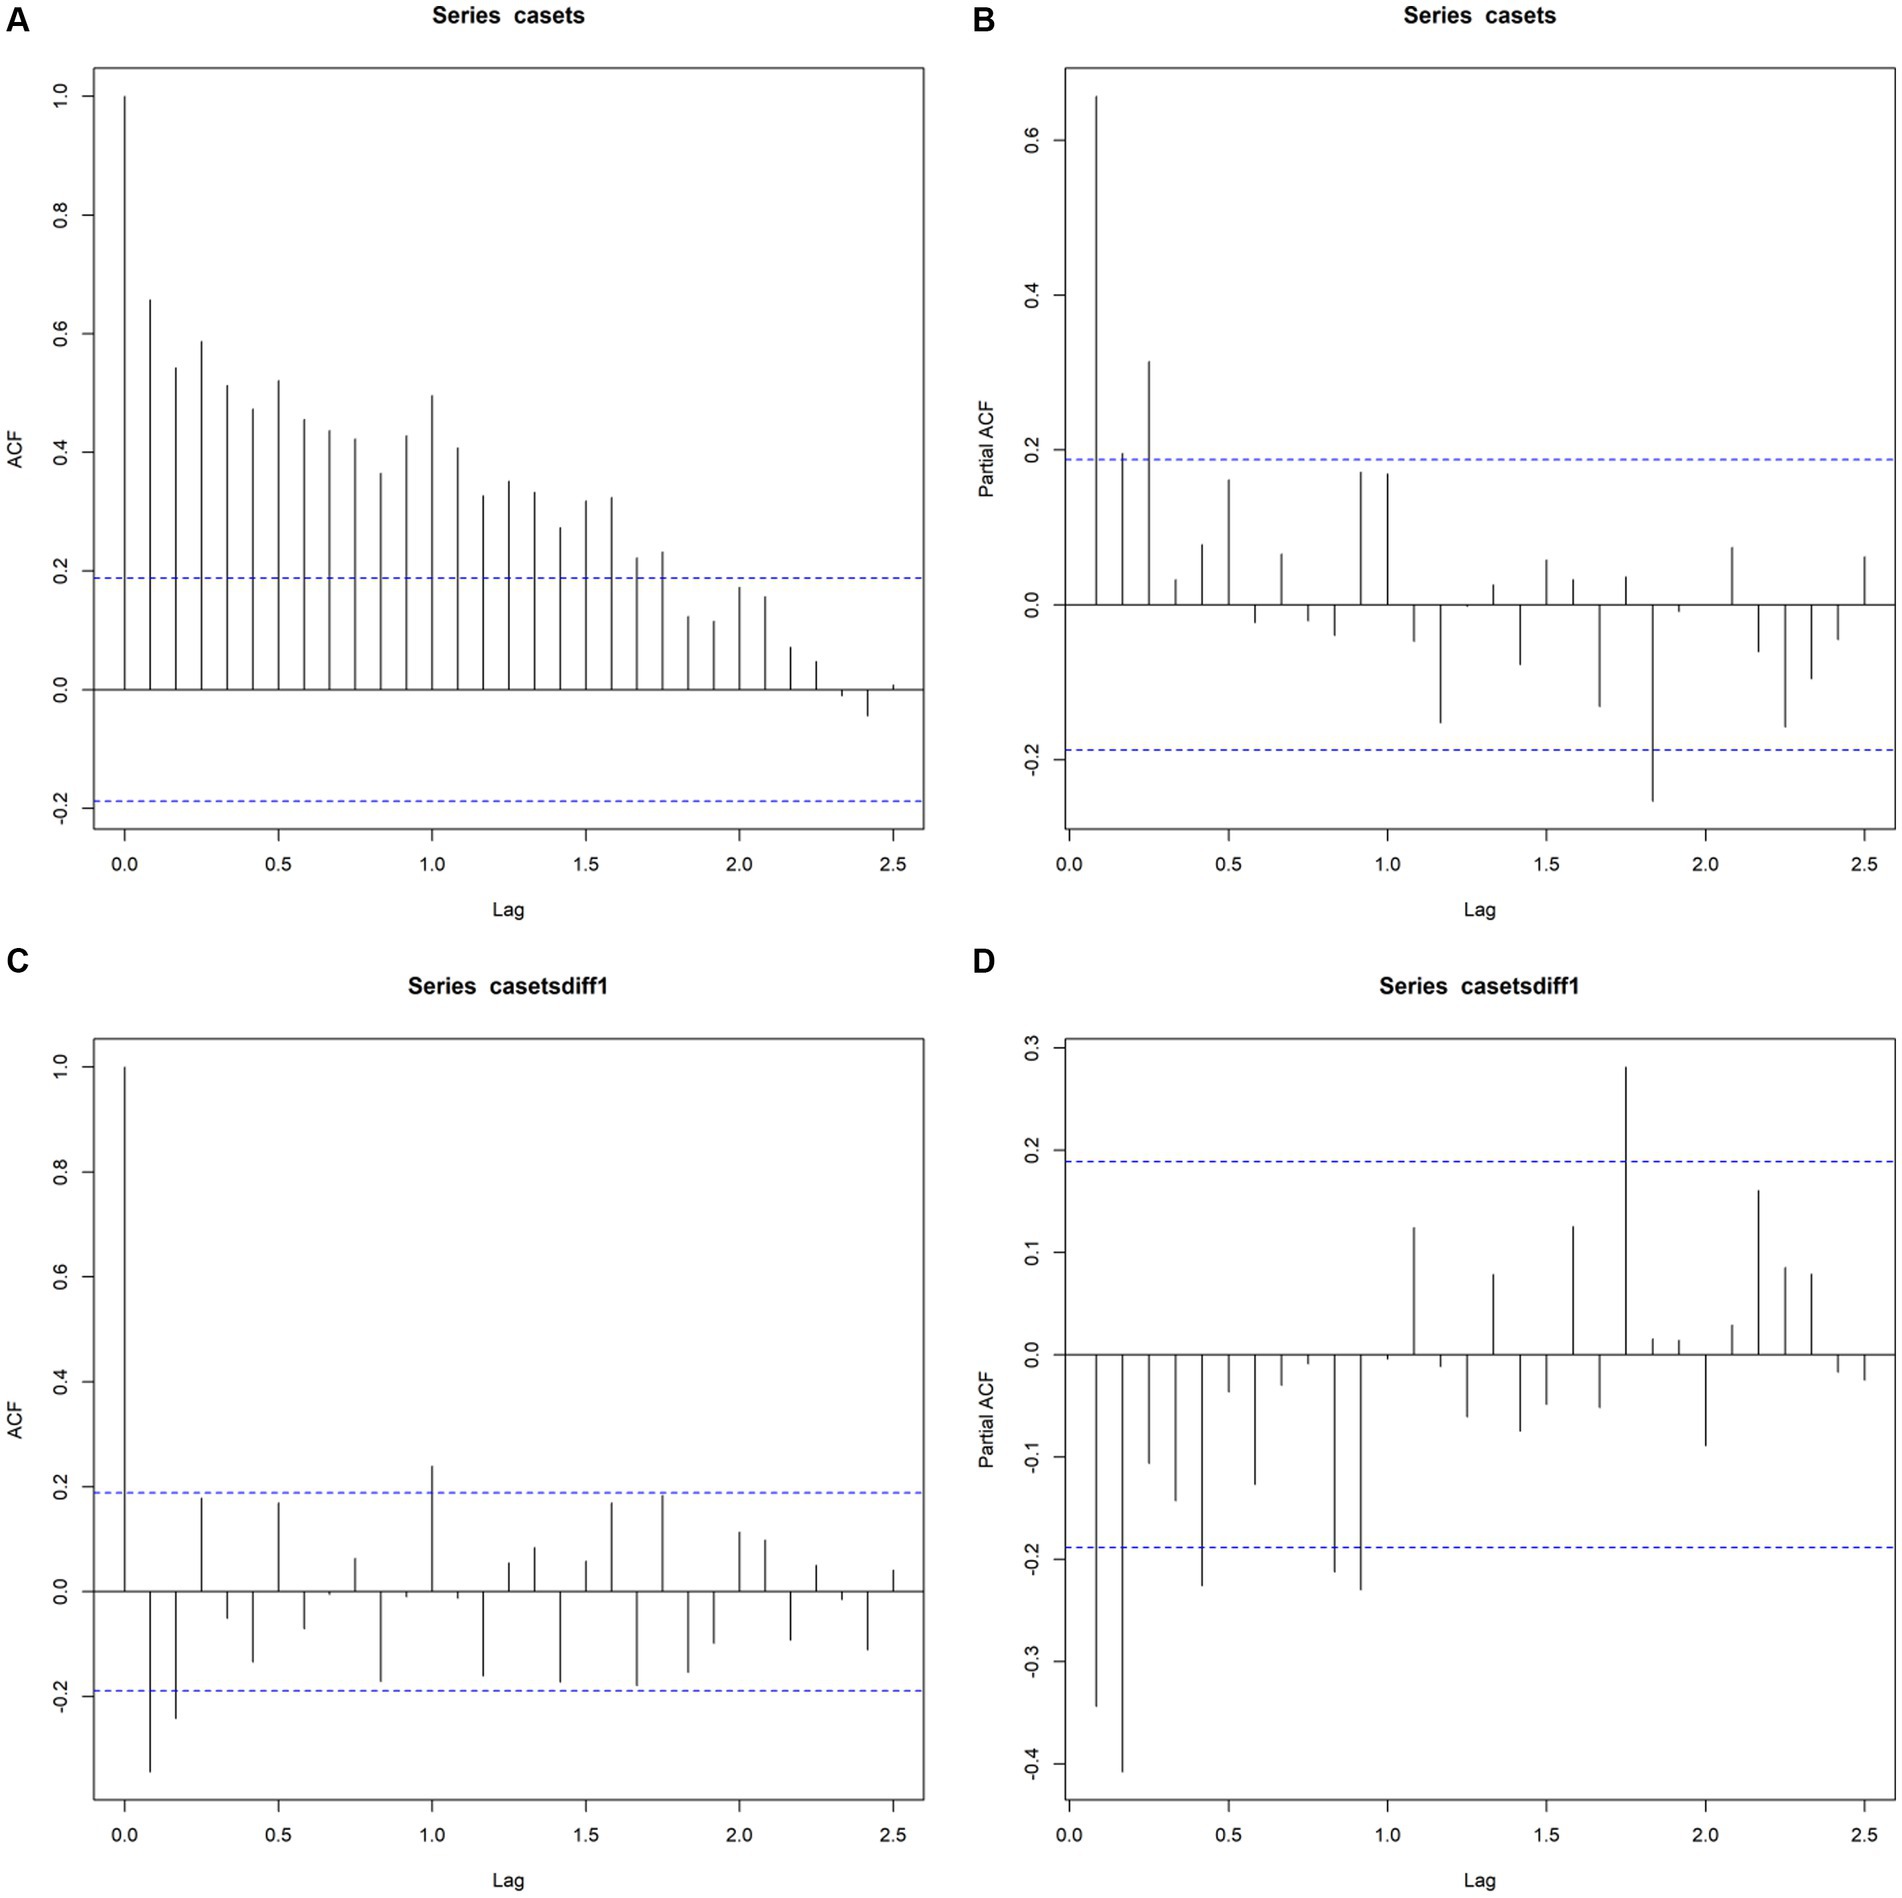
Figure 8. Autocorrelation and partial autocorrelation plots before and after differencing (A,B), represents ACF and PACF plots of the original sequence, and (C,D) represents ACF and PACF plots after first-order differencing.
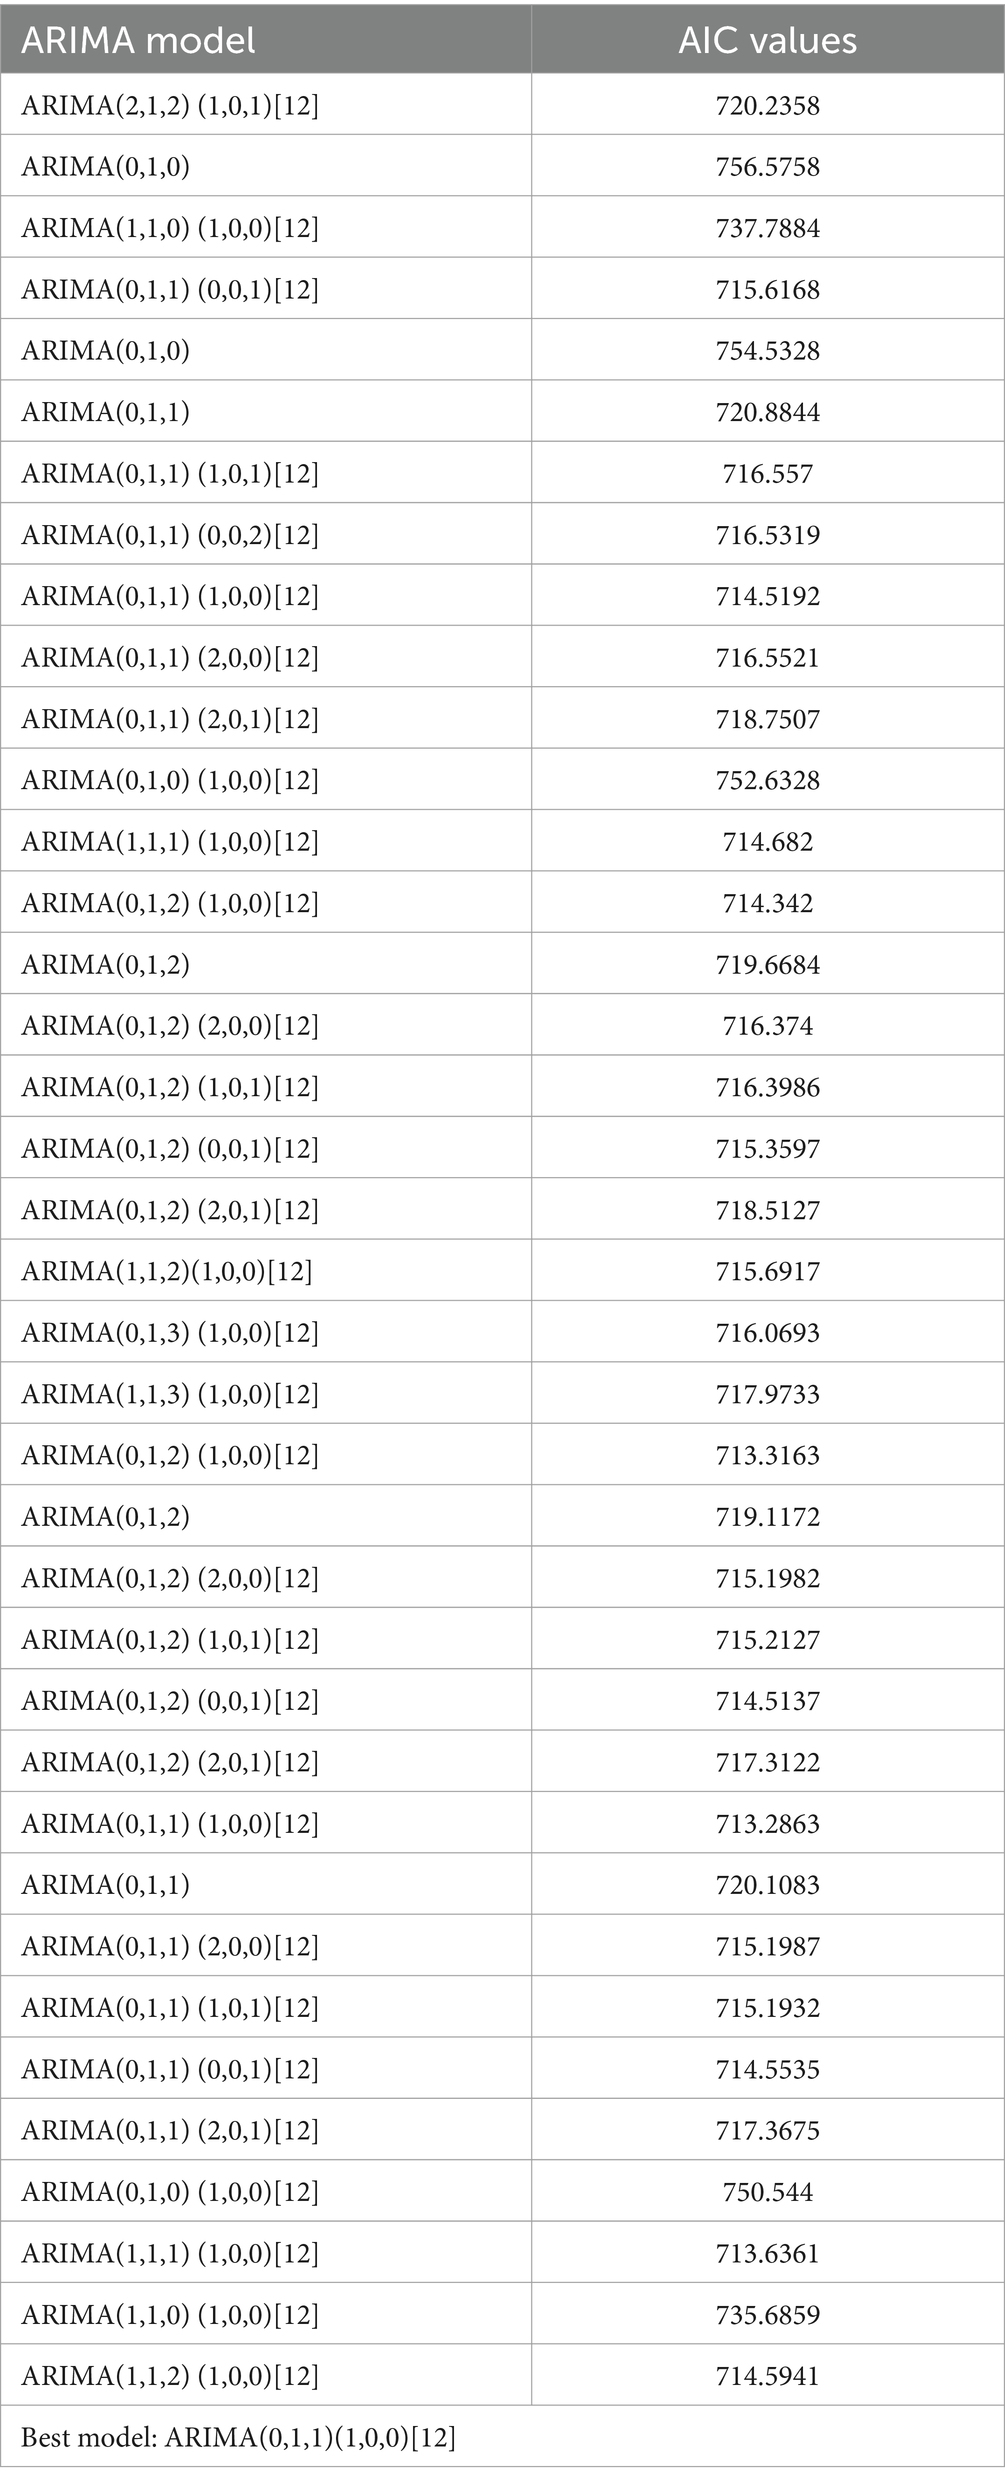
Table 4. Model selection process table.
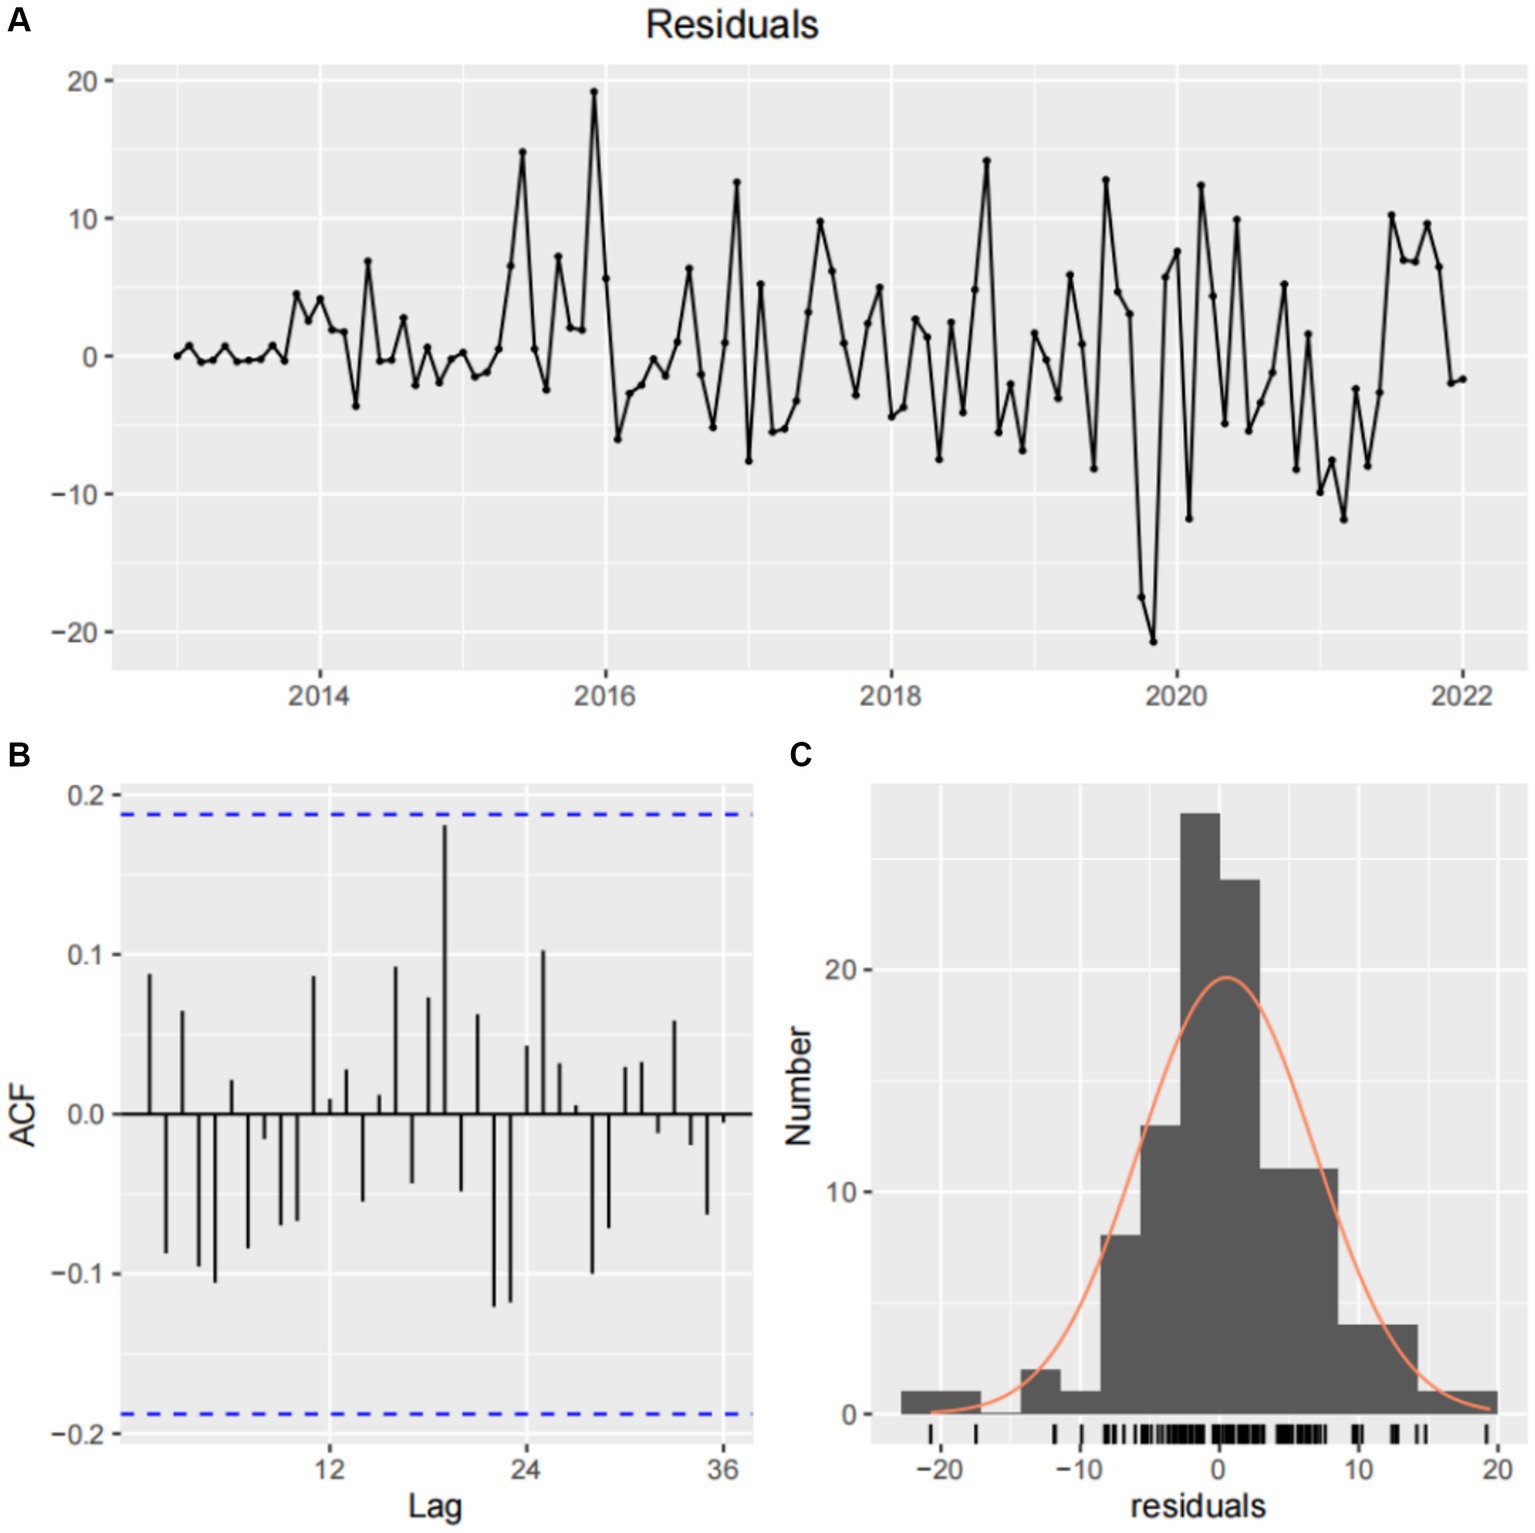
Figure 9. White noise test after differencing and normal distribution of model residuals. (A) Residual sequence plot. (B) Model residual autocorrelation diagram. (C) Normal distribution plot of model residuals.
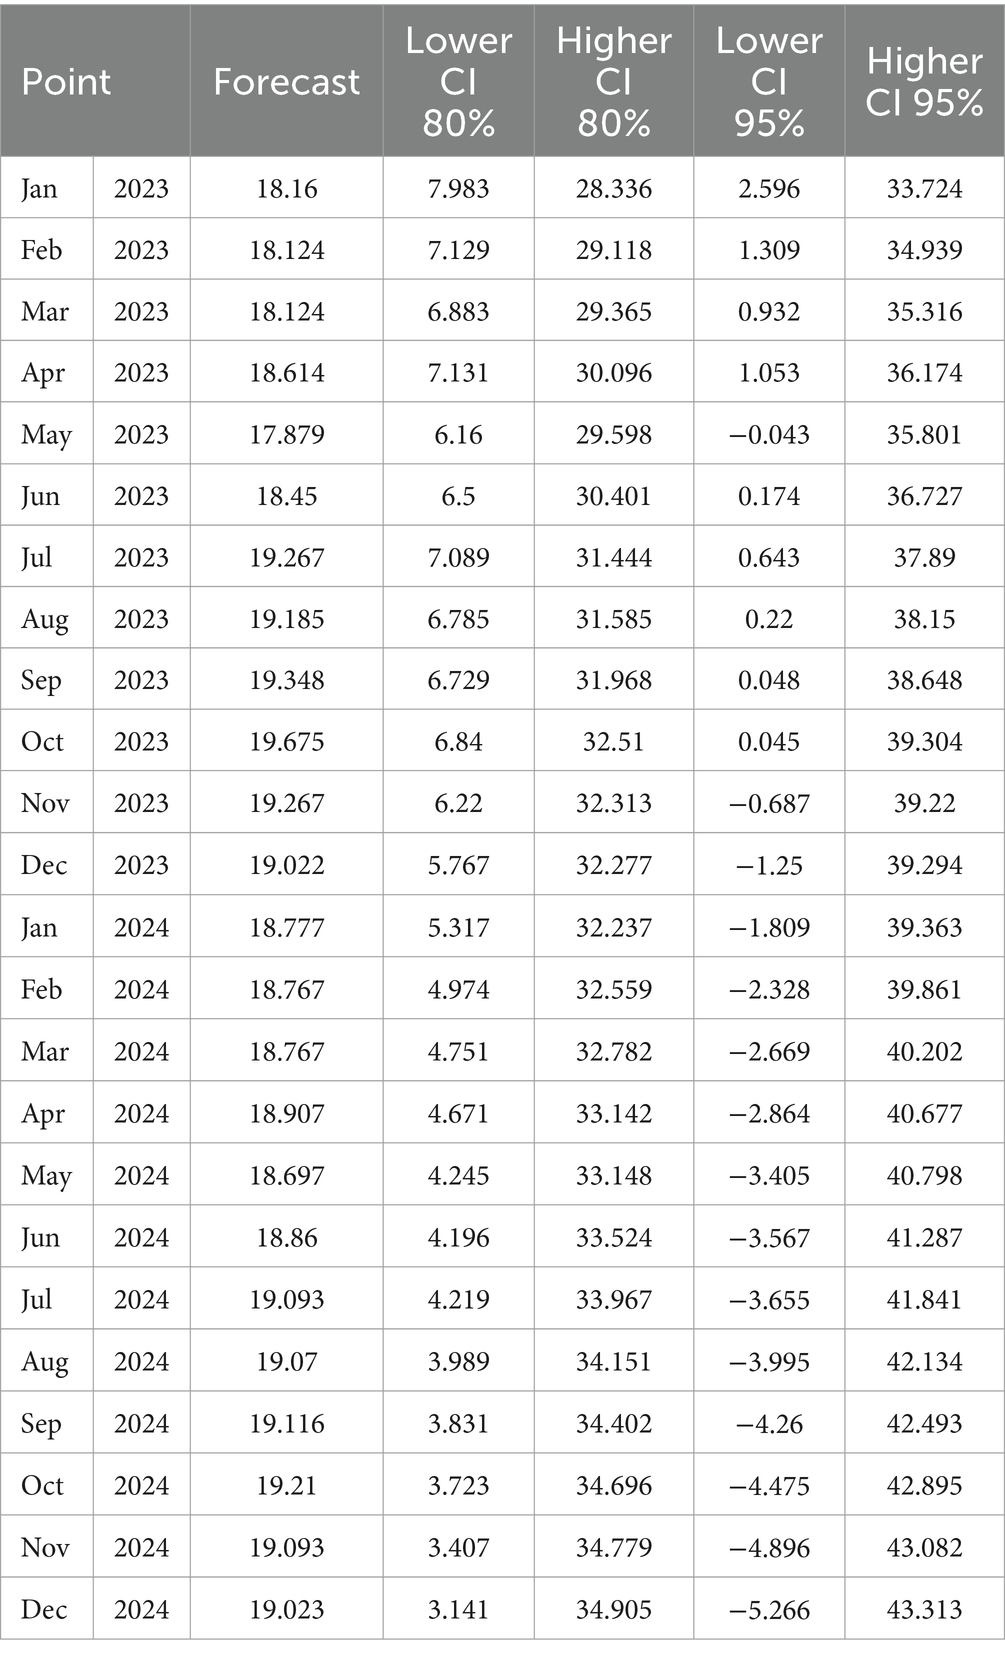
Table 5. Projected monthly incidence of hepatitis E in Hainan Province, 2023–2024.
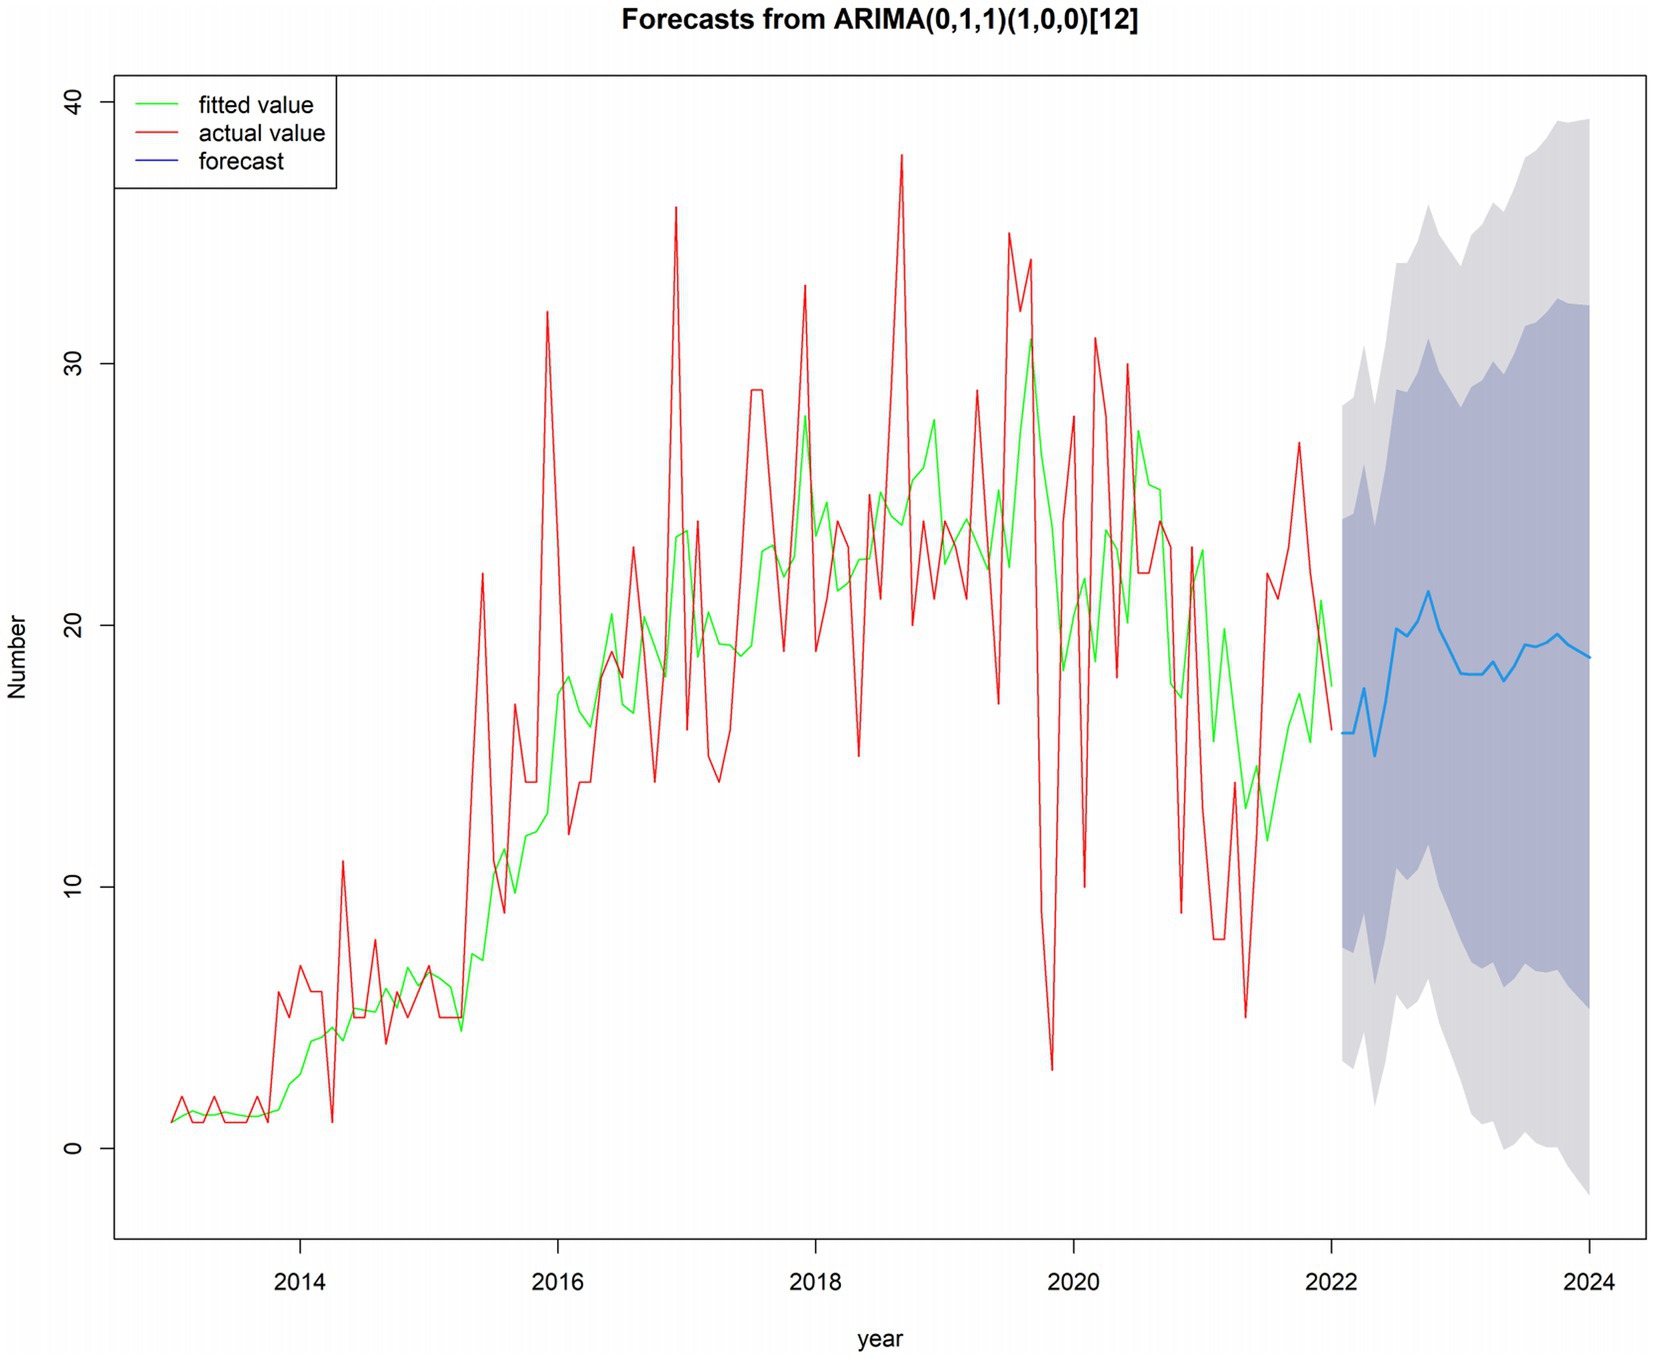
Figure 10. Time series plot: future 24 months based on incidence data from January 2013 to December 2022.
We analyzed HE incidence in the four hospitals of Hainan Province from 2013 to 2022 and performed a descriptive analysis considering time, region, age, and sex to elucidate the distribution and epidemiological characteristics of HE in the region. The research findings indicate that males are more susceptible to HE than females, which is consistent with previous research results (25), and may be associated with higher occupational exposure and greater participation in social activities among males (26). The incidence occurs across different age groups, primarily affecting middle-aged and older adults. Studies have suggested a close relationship between age and the presence of anti-HEV IgG antibodies, reflecting potential cumulative exposure to the virus (9). Multiple studies have also confirmed the possibility of long-term preservation of anti-HEV antibodies after exposure (8, 9, 27). However, this is insufficient to explain why the incidence of HE is higher in middle-aged and older adults. Therefore, further epidemiological and laboratory studies are required to confirm the reasons for the higher incidence in this age group. The overall trend of HE incidence in Hainan Province showed an initial increase followed by a decrease, consistent with the trend observed in previous studies in other regions of the country (15). The increase in HE incidence could be attributed to implementing measures to control the COVID-19 pandemic, resulting in reduced social activities and decreased cases compared with previous periods. The reasons for the elevated HE incidence are as follows: (1) With rapid economic growth and the development of the tourism and catering industry, there has been an increase in population mobility, leading to a higher chance of human-source infections (28); (2) With the improvement of medical conditions, there has been an increase in the rate of testing and higher diagnostic levels, and research indicates that the increase in the rate of diagnosed HE cases closely corresponds to the increase in the rate of diagnostic test kits sold in the Chinese market (29); and (3) With the advent of electronic medical record systems, there has been an enhancement in doctor reporting awareness (30, 31), with various medical institutions strengthening the quality of infectious disease reporting and reducing the number of underreported cases (32, 33).
From the thematic maps of HE incidence in this study, it is evident that the northern regions of Hainan Province, particularly Haikou City, are focal points for disease occurrence. This may be due to the large population, high density, significant population movement, and multiple ports in these urban areas (34, 35). The higher incidence in these areas may be related to increased economic and cultural exchange activities. Research suggests that medical resources, economic factors, ethnicity, and provincial background can influence disease spread (36). The occurrence and distribution of diseases are closely associated with geographical and meteorological factors (22, 37). Spatial epidemiology is widely applied in the monitoring of infectious diseases, particularly in analyzing spatial distribution patterns and regional clustering of infectious diseases (38). Analyzing the spatial autocorrelation of infectious diseases makes it possible to quickly identify regions with disease occurrence and recognize spatial clustering. This provides a scientific basis for developing measures to prevent and control infectious diseases (38, 39). The global spatial autocorrelation results of this study indicated that Moran’s I values for HE incidence in the province from 2013 to 2022 were consistently positive, suggesting that disease occurrence during this period was not randomly distributed. A significant positive spatial autocorrelation indicated a clear clustered distribution of HE cases (p < 0.01, statistically significant difference). The local spatial autocorrelation results showed that the hotspots of HE incidence from 2013 to 2022 were mostly concentrated in the economically developed northern region. Through concentration trends and dispersion analysis, the results suggested a clear directionality in HE incidence, indicating a trend of spreading toward the southern part of the province. The northern region, with its high population density and strong population mobility, coupled with the development of the catering and tourism industries, may be related to the increased incidence and transmission rate of HE (19).
Time-series forecasting analysis can incorporate various influencing factors, including the combined effects of unknown components, into the time variable (22). The ARIMA model is used to prevent and control various legally reportable infectious diseases (40–42). The forecast results of the ARIMA(0,1,1)(1,0,0)[12] model in this study indicate that newly reported cases are relatively stable, fluctuating between 17 and 19 cases per month in 2023 and 2024. Although the risk of HE transmission persists, the likelihood of short-term outbreaks appears to be low.
Our study had several limitations. First, the data we selected came from four hospitals in Haikou City that detected HE over the past decade. We only used the HE cases reported in the hospital system for statistical analysis and did not obtain data from some potential carriers or asymptomatic patients, which may lead to selection bias. However, these patients usually do not seek medical attention or testing, so even the data from the disease control department cannot detect this portion of the infected. In the future, we can adopt sampling survey methods to test HE antibodies in people from various regions to understand their prevalence levels. Second, the incidence of HE is influenced not only by time but also by factors such as population, social activities, economy, climate, and the environment. This study did not collect and analyze potential factors that may affect the distribution of HE incidence. The data were updated as time progressed, and the established model was not static. Therefore, we need to continue to update the HE incidence data, constantly revise the model parameters, and improve the prediction accuracy. At the same time, incorporating factors that affect the incidence of HE into the prediction model will help us obtain a more accurate HE prediction model. Thirdly, our research did not investigate the relevant factors that affect clustering.
From 2013 to 2019, the incidence of HE in Hainan Province increased. The incidence rate was significantly higher in males than in females, and the distribution of incidence rates across all age groups tended to be higher in middle-aged adults, with lower rates in younger and older age groups, and the incidence was highest in the 50–59-year age group. The areas with the highest incidence were mainly concentrated in the northeast, with a tendency to gradually spread toward the southwest over time. The HE status in Hainan Province from 2013 to 2024 remained relatively stable, and the ARIMA model accurately predicted the epidemic. This model can be used for short-term forecasting of HE incidence and predicts a relatively stable number of new cases each month in 2023 and 2024.
The original contributions presented in the study are included in the article/Supplementary material, further inquiries can be directed to the corresponding author.
This study was approved by the Research Ethics Committee of Hainan General Hospital (No. 2021-241). Written informed consent was not required as the data was anonymized for the study. Consent was waived by the Research Ethics Committee.
ZY: Writing – original draft, Methodology, Data curation, Conceptualization. P-PL: Writing – review & editing, Formal analysis. J-ZW: Writing – review & editing, Formal analysis. FL: Writing – review & editing, Methodology, Data curation, Conceptualization. W-TL: Writing – review & editing, Formal analysis. M-HW: Writing – review & editing, Formal analysis. Y-RZ: Writing – review & editing, Formal analysis. H-ZW: Writing – review & editing, Formal analysis. HL: Writing – review & editing, Formal analysis. X-FC: Writing – review & editing, Formal analysis. X-BL: Writing – review & editing, Formal analysis. X-XF: Writing – review & editing, Formal analysis. TW: Writing – review & editing, Project administration, Methodology, Data curation. YG: Writing – review & editing, Project administration, Methodology, Data curation, Conceptualization.
The author(s) declare financial support was received for the research, authorship, and/or publication of this article. This study was supported by the Youth Fund Project of the National Health Commission Key Laboratory of Tropical Disease Control at Hainan Medical University (grant no: 2021NHCTDCKFKT21010). Funding agencies did not participate in the study design, data collection and analysis, decision to publish, or manuscript preparation.
We would like to express our gratitude to Professor Li Li and Panpan Zhu for their suggestions on the statistical part.
The authors declare that the research was conducted in the absence of any commercial or financial relationships that could be construed as a potential conflict of interest.
All claims expressed in this article are solely those of the authors and do not necessarily represent those of their affiliated organizations, or those of the publisher, the editors and the reviewers. Any product that may be evaluated in this article, or claim that may be made by its manufacturer, is not guaranteed or endorsed by the publisher.
The Supplementary material for this article can be found online at: https://www.frontiersin.org/articles/10.3389/fpubh.2024.1381204/full#supplementary-material
1. ^http://www.nhc.gov.cn/jkj/
2. ^https://www.chinacdc.cn/images/jlogo.png
1. Xiong, XY, Liu, X, and Yin, X. Research progress in the etiology of hepatitis type E virus. Zhonghua Gan Zang Bing Za Zhi. (2023) 31:460–5. doi: 10.3760/cma.j.cn501113-20230221-00072
2. Balayan, MS, Andjaparidze, AG, Savinskaya, SS, Ketiladze, ES, Braginsky, DM, Savinov, AP, et al. Evidence for a virus in non-a, non-B hepatitis transmitted via the fecal-oral route. Intervirology. (1983) 20:23–31. doi: 10.1159/000149370
3. Kamar, N, Marion, O, Abravanel, F, Izopet, J, and Dalton, HR. Extrahepatic manifestations of hepatitis E virus. Liver Int. (2016) 36:467–72. doi: 10.1111/liv.13037
4. Naidu, SS, and Viswanathan, R. Infectious hepatitis in pregnancy during Delhi epidemic. Indian J Med Res. (1957) 45:71–6.
5. Patra, S, Kumar, A, Trivedi, SS, Puri, M, and Sarin, SK. Maternal and fetal outcomes in pregnant women with acute hepatitis E virus infection. Ann Intern Med. (2007) 147:28–33. doi: 10.7326/0003-4819-147-1-200707030-00005
6. Cui, T, Zhang, X, Wang, Q, Yue, N, Bao, C, Jiang, R, et al. Cost-effectiveness analysis of hepatitis E vaccination strategies among patients with chronic hepatitis B in China. Hepatol Res. (2023) 2023:967. doi: 10.1111/hepr.13967
7. Nicolini, L, Stoney, RJ, Della Vecchia, A, Grobusch, M, Gautret, P, Angelo, KM, et al. Travel-related hepatitis E: a two-decade GeoSentinel analysis. J Travel Med. (2020) 27:taaa 132. doi: 10.1093/jtm/taaa132
8. Pisano, MB, Campbell, C, Anugwom, C, Ré, VE, and Debes, JD. Hepatitis E virus infection in the United States: Seroprevalence, risk factors and the influence of immunological assays. PLoS One. (2022) 17:e0272809. doi: 10.1371/journal.pone.0272809
9. Mikhailov, MI, Karlsen, AA, Potemkin, IA, Isaeva, OV, Kichatova, VS, Malinnikova, EY, et al. Geographic and temporal variability of hepatitis E virus circulation in the Russian Federation. Viruses. (2022) 15:37. doi: 10.3390/v15010037
10. Mansuy, JM, Abravanel, F, Miedouge, M, Mengelle, C, Merviel, C, Dubois, M, et al. Acute hepatitis E in south-West France over a 5-year period. J Clin Virol. (2009) 44:74–7. doi: 10.1016/j.jcv.2008.09.010
11. Tsega, E, Krawczynski, K, Hansson, BG, Nordenfelt, E, Negusse, Y, Alemu, W, et al. Outbreak of acute hepatitis E virus infection among military personnel in northern Ethiopia. J Med Virol. (1991) 34:232–6. doi: 10.1002/jmv.1890340407
12. Khuroo, MS, Khuroo, MS, and Khuroo, NS. Transmission of hepatitis E virus in developing countries. Viruses. (2016) 8:253. doi: 10.3390/v8090253
13. Adlhoch, C, Avellon, A, Baylis, SA, Ciccaglione, AR, Couturier, E, de Sousa, R, et al. Hepatitis E virus: assessment of the epidemiological situation in humans in Europe, 2014/15. J Clin Virol. (2016) 82:9–16. doi: 10.1016/j.jcv.2016.06.010
14. Mauceri, C, Grazia Clemente, M, Castiglia, P, Antonucci, R, and Schwarz, KB. Hepatitis E in Italy: a silent presence. J Infect Public Health. (2018) 11:1–8. doi: 10.1016/j.jiph.2017.08.004
15. Wang, YS, Wang, SN, Pan, JH, and Wang, WB. Trend analysis and prediction of viral hepatitis incidence in China, 2009-2018. Zhonghua Liu Xing Bing Xue Za Zhi. (2020) 41:1460–4. doi: 10.3760/cma.j.cn112338-20191024-00761
16. Chen, J, Qiu, Y, Yang, R, Li, L, Hou, J, Lu, K, et al. The characteristics of spatial-temporal distribution and cluster of tuberculosis in Yunnan Province, China, 2005-2018. BMC Public Health. (2019) 19:1715. doi: 10.1186/s12889-019-7993-5
17. Paphitis, K, Pearl, DL, Berke, O, McEwen, SA, and Trotz-Williams, L. Detection of spatial, temporal, and space-time Salmonella Heidelberg and Salmonella Typhimurium clusters in Ontario in 2015, and comparisons to known outbreaks. Zoonoses Public Health. (2020) 67:617–28. doi: 10.1111/zph.12741
18. Zhang, Y, Bambrick, H, Mengersen, K, Tong, S, Feng, L, Zhang, L, et al. Resurgence of pertussis infections in Shandong, China: space-time cluster and trend analysis. Am J Trop Med Hyg. (2019) 100:1342–54. doi: 10.4269/ajtmh.19-0013
19. Yu, C, Xu, C, Li, Y, Yao, S, Bai, Y, Li, J, et al. Time series analysis and forecasting of the hand-foot-mouth disease morbidity in China using an advanced exponential smoothing state space TBATS model. Infect Drug Resist. (2021) 14:2809–21. doi: 10.2147/IDR.S304652
20. Ceylan, Z. Estimation of COVID-19 prevalence in Italy, Spain, and France. Sci Total Environ. (2020) 729:138817. doi: 10.1016/j.scitotenv.2020.138817
21. Li, ZQ, Pan, HQ, Liu, Q, Song, H, and Wang, JM. Comparing the performance of time series models with or without meteorological factors in predicting incident pulmonary tuberculosis in eastern China. Infect Dis Poverty. (2020) 9:151. doi: 10.1186/s40249-020-00771-7
22. Chyon, FA, Suman, M, Fahim, M, and Ahmmed, MS. Time series analysis and predicting COVID-19 affected patients by ARIMA model using machine learning. J Virol Methods. (2022) 301:114433. doi: 10.1016/j.jviromet.2021.114433
23. Wang, Y, Wei, X, Jia, R, Peng, XY, Zhang, X, Yang, M, et al. The spatiotemporal pattern and its determinants of hemorrhagic fever with renal syndrome in northeastern China: spatiotemporal analysis. JMIR Public Health Surveill. (2023) 9:e42673. doi: 10.2196/42673
24. European Association for the Study of the Liver. EASL clinical practice guidelines on hepatitis E virus infection. J Hepatol. (2018) 68:1256–71. doi: 10.1016/j.jhep.2018.03.005
25. Shi, Y, Shen, W, Liu, W, Zhang, X, Shang, Q, Cheng, X, et al. Analysis of the spatial-temporal distribution characteristics of hepatitis E in Jiangsu province from 2005 to 2020. Front Public Health. (2023) 11:1225261. doi: 10.3389/fpubh.2023.1225261
26. Dalton, HR, Thurairajah, PH, Fellows, HJ, Hussaini, HS, Mitchell, J, Bendall, R, et al. Autochthonous hepatitis E in Southwest England. J Viral Hepat. (2007) 14:304–9. doi: 10.1111/j.1365-2893.2006.00800.x
27. Liu, Y, Liang, W, Li, J, Liu, F, Zhou, G, Zha, W, et al. Characteristic of spatial-temporal distribution of hepatitis E in Hunan province, 2006-2014. Zhonghua Liu Xing Bing Xue Za Zhi. (2016) 37:543–7. doi: 10.3760/cma.j.issn.0254-6450.2016.04.021
28. Farshadpour, F, Taherkhani, R, Ravanbod, MR, Eghbali, SS, Taherkhani, S, and Mahdavi, E. Prevalence, risk factors and molecular evaluation of hepatitis E virus infection among pregnant women resident in the northern shores of Persian gulf. Iran PLoS One. (2018) 13:e0191090. doi: 10.1371/journal.pone.0191090
29. Zhao, Q, Zhang, J, Wu, T, Li, SW, Ng, MH, Xia, NS, et al. Antigenic determinants of hepatitis E virus and vaccine-induced immunogenicity and efficacy. J Gastroenterol. (2013) 48:159–68. doi: 10.1007/s00535-012-0701-1
30. Survey on the information quality and management of the national notifiable infectious diseases reporting system in 2015. Beijing: Chinese Center for Disease Control and Prevention (2016).
31. Brabazon, ED, O’Farrell, A, Murray, CA, Carton, MW, and Finnegan, P. Under-reporting of notifiable infectious disease hospitalizations in a health board region in Ireland: room for improvement. Epidemiol Infect. (2008) 136:241–7. doi: 10.1017/S0950268807008230
32. Zhu, B, Liu, J, Fu, Y, Zhang, B, and Mao, Y. Spatio-temporal epidemiology of viral hepatitis in China (2003-2015): implications for prevention and control policies. Int J Environ Res Public Health. (2018) 15:661. doi: 10.3390/ijerph15040661
33. Figueiras, A, Lado, E, Fernández, S, and Hervada, X. Influence of physicians' attitudes on under-notifying infectious diseases: a longitudinal study. Public Health. (2004) 118:521–6. doi: 10.1016/j.puhe.2003.12.015
34. Ma, X, Luo, XF, Li, L, Li, Y, and Sun, GQ. The influence of mask use on the spread of COVID-19 during pandemic in new York City. Results Phys. (2022) 34:105224. doi: 10.1016/j.rinp.2022.105224
35. Ijaz, S, Arnold, E, Banks, M, Bendall, RP, Cramp, ME, Cunningham, R, et al. Non-travel-associated hepatitis E in England and Wales: demographic, clinical, and molecular epidemiological characteristics. J Infect Dis. (2005) 192:1166–72. doi: 10.1086/444396
36. Li, H, Zhang, Y, Ma, Z, Liu, Z, Ikram, A, Liu, L, et al. HEV prevalence and potential risk factors in a large multi-ethnic youth cohort in China. Virol J. (2021) 18:3. doi: 10.1186/s12985-020-01470-3
37. Jia, P, Lakerveld, J, Wu, J, Stein, A, Root, ED, Sabel, CE, et al. Top 10 research priorities in spatial Lifecourse epidemiology. Environ Health Perspect. (2019) 127:74501. doi: 10.1289/EHP4868
38. Graham, AJ, Atkinson, PM, and Danson, FM. Spatial analysis for epidemiology. Acta Trop. (2004) 91:219–25. doi: 10.1016/j.actatropica.2004.05.001
39. Nemes, K, Persson, S, and Simonsson, M. Hepatitis a virus and hepatitis E virus as food-and waterborne pathogens-transmission routes and methods for detection in food. Viruses. (2023) 15:1725. doi: 10.3390/v15081725
40. LIU, L, LUAN, RS, YIN, F, ZHU, XP, and LÜ, Q. Predicting the incidence of hand, foot and mouth disease in Sichuan province, China using the ARIMA model. Epidemiol Infect. (2016) 144:144–51. doi: 10.1017/S0950268815001144
41. al-Shimari, FH, Rencken, CA, Kirkwood, CD, Kumar, R, Vannice, KS, and Stewart, BT. Systematic review of global hepatitis E outbreaks to inform response and coordination initiatives. BMC Public Health. (2023) 23:1120. doi: 10.1186/s12889-023-15792-8
Keywords: hepatitis E, trend analysis, spatial autocorrelation, forecasting model, Hainan Province
Citation: Yun Z, Li P, Wang J, Lin F, Li W, Weng M, Zhang Y, Wu H, Li H, Cai X, Li X, Fu X, Wu T and Gao Y (2024) Spatial-temporal analysis of hepatitis E in Hainan Province, China (2013-2022): insights from four major hospitals. Front. Public Health. 12:1381204. doi: 10.3389/fpubh.2024.1381204
Edited by:
Manuel Rodriguez-Iglesias, University of Cádiz, SpainReviewed by:
Wenxin Wang, Shantou University, ChinaCopyright © 2024 Yun, Li, Wang, Lin, Li, Weng, Zhang, Wu, Li, Cai, Li, Fu, Wu and Gao. This is an open-access article distributed under the terms of the Creative Commons Attribution License (CC BY). The use, distribution or reproduction in other forums is permitted, provided the original author(s) and the copyright owner(s) are credited and that the original publication in this journal is cited, in accordance with accepted academic practice. No use, distribution or reproduction is permitted which does not comply with these terms.
*Correspondence: Yi Gao, Z2FveWkwNUAxMjYuY29t; Tao Wu, V3V0YW8xX3JlbkAxNjMuY29t
†These authors have contributed equally to this work
Disclaimer: All claims expressed in this article are solely those of the authors and do not necessarily represent those of their affiliated organizations, or those of the publisher, the editors and the reviewers. Any product that may be evaluated in this article or claim that may be made by its manufacturer is not guaranteed or endorsed by the publisher.
Research integrity at Frontiers
Learn more about the work of our research integrity team to safeguard the quality of each article we publish.