 Chu Qin
 Huan Ma
 Mahong Hu2
 Xiujuan Xu
 Conghua Ji
94% of researchers rate our articles as excellent or good
Learn more about the work of our research integrity team to safeguard the quality of each article we publish.
Find out more
SYSTEMATIC REVIEW article
Front. Public Health, 31 July 2024
Sec. Infectious Diseases: Epidemiology and Prevention
Volume 12 - 2024 | https://doi.org/10.3389/fpubh.2024.1371852
This article is part of the Research TopicSingle and Multi-Pathogen Epidemiology and ControlView all 9 articles
Background: COVID-19-induced pneumonia has become a persistent health concern, with severe cases posing a significant threat to patient lives. However, the potential of artificial intelligence (AI) in assisting physicians in predicting the prognosis of severe COVID-19 patients remains unclear.
Methods: To obtain relevant studies, two researchers conducted a comprehensive search of the PubMed, Web of Science, and Embase databases, including all studies published up to October 31, 2023, that utilized AI to predict mortality rates in severe COVID-19 patients. The PROBAST 2019 tool was employed to assess the potential bias in the included studies, and Stata 16 was used for meta-analysis, publication bias assessment, and sensitivity analysis.
Results: A total of 19 studies, comprising 26 models, were included in the analysis. Among them, the models that incorporated both clinical and radiological data demonstrated the highest performance. These models achieved an overall sensitivity of 0.81 (0.64–0.91), specificity of 0.77 (0.71–0.82), and an overall area under the curve (AUC) of 0.88 (0.85–0.90). Subgroup analysis revealed notable findings. Studies conducted in developed countries exhibited significantly higher predictive specificity for both radiological and combined models (p < 0.05). Additionally, investigations involving non-intensive care unit patients demonstrated significantly greater predictive specificity (p < 0.001).
Conclusion: The current evidence suggests that artificial intelligence prediction models show promising performance in predicting the prognosis of severe COVID-19 patients. However, due to variations in the suitability of different models for specific populations, it is not yet certain whether they can be fully applied in clinical practice. There is still room for improvement in their predictive capabilities, and future research and development efforts are needed.
Systematic review registration: https://www.crd.york.ac.uk/prospero/ with the Unique Identifier CRD42023431537.
The novel coronavirus disease 2019 (COVID-19) pandemic, caused by severe acute respiratory syndrome coronavirus 2 (SARS-CoV-2), has had a profound effect worldwide (1). As of December 2023, the World Health Organization has reported 773,119,173 COVID-19 cases (2). Currently, the medical community has conducted extensive research on the infection and pathogenesis mechanisms of COVID-19 (3). A series of measures have been implemented to control its spread and infection (4), such as the development of vaccines and the implementation of policies (5, 6).
While most individuals infected with SARS-CoV-2 experience either no or mild respiratory symptoms, a small percentage develop severe COVID-19 pneumonia or acute respiratory distress syndrome (ARDS). These cases can be life-threatening and necessitate intensive care or tracheal intubation (7–9). Studies have indicated that patients who undergo invasive mechanical ventilation are vulnerable to secondary infections, which can further increase the mortality rate (10). Additionally, a study has indicated that the infection fatality rate (IFR), the anticipated ratio between deaths and infections, among COVID-19 patients, exponentially increases with age (11). Furthermore, as the post-pandemic era unfolds, numerous previously infected individuals are expected to experience complications and sequelae, some of which may be severe and fatal (12). Consequently, accurate prognosis prediction is crucial for effectively managing these cases.
In recent years, there have been significant advancements in technology, leading to the continuous evolution of computer-aided techniques. These techniques have gradually developed into a diverse set of diagnostic and prognostic systems, with a particular focus on the field of medical imaging. These systems are designed to perform various tasks, including classification, regression, segmentation, and tracking (13). Artificial intelligence (AI) in medicine is evolving, reshaping medicine, and improving the experience of clinicians and patients (14–16). Research has demonstrated that artificial intelligence and machine learning can outperform clinical doctors in disease prediction on certain occasions (17).
In the context of COVID-19, a considerable number of studies have been conducted, employing artificial intelligence models for the purposes of diagnosis, treatment, and prediction (18–20). In intensive care respiratory medicine, artificial intelligence has made initial achievements in the prognostic prediction of diseases and has gradually become an auxiliary diagnostic tool for clinicians (21, 22). Recently, a study successfully developed a random forest model to predict hypotensive events in the Intensive Care Unit (ICU). The model exhibited an impressive sensitivity of 92.7%, enabling the prediction of these events up to 15 min in advance (23).
Multiple studies have documented the utilization and advancement of AI in prognostic prediction for critically-ill COVID-19 patients. However, there is a dearth of comprehensive evaluations regarding its effectiveness. Consequently, the true potential of current AI technology in clinical practice remains uncertain. To address this gap, our study aims to investigate how well AI methods provide reproducible prognostic predictions.
This study was performed in accordance with the Preferred Reporting Items for Systematic Reviews and Meta-Analyses (PRISMA) statement and involved a secondary analysis based on published researches (24). This study was registered in the International Prospective Register of Systematic Reviews (PROSPERO) database (Registration Number CRD42023431537). Ethics approval was not obtained for this study.
We searched PubMed,1 Web of Science,2 and Embase3 for all studies published before October 31, 2023, on the use of artificial intelligence techniques to predict the death of patients with severe COVID-19. Our search strategy included a combination of controlled vocabulary terms (NCBI’s MeSH terms) and free keywords. The keywords used encompassed terms such as “Critical Care,” “Artificial Intelligence,” and “COVID-19.” An example of the search strategy employed on PubMed can be found in Table 1.
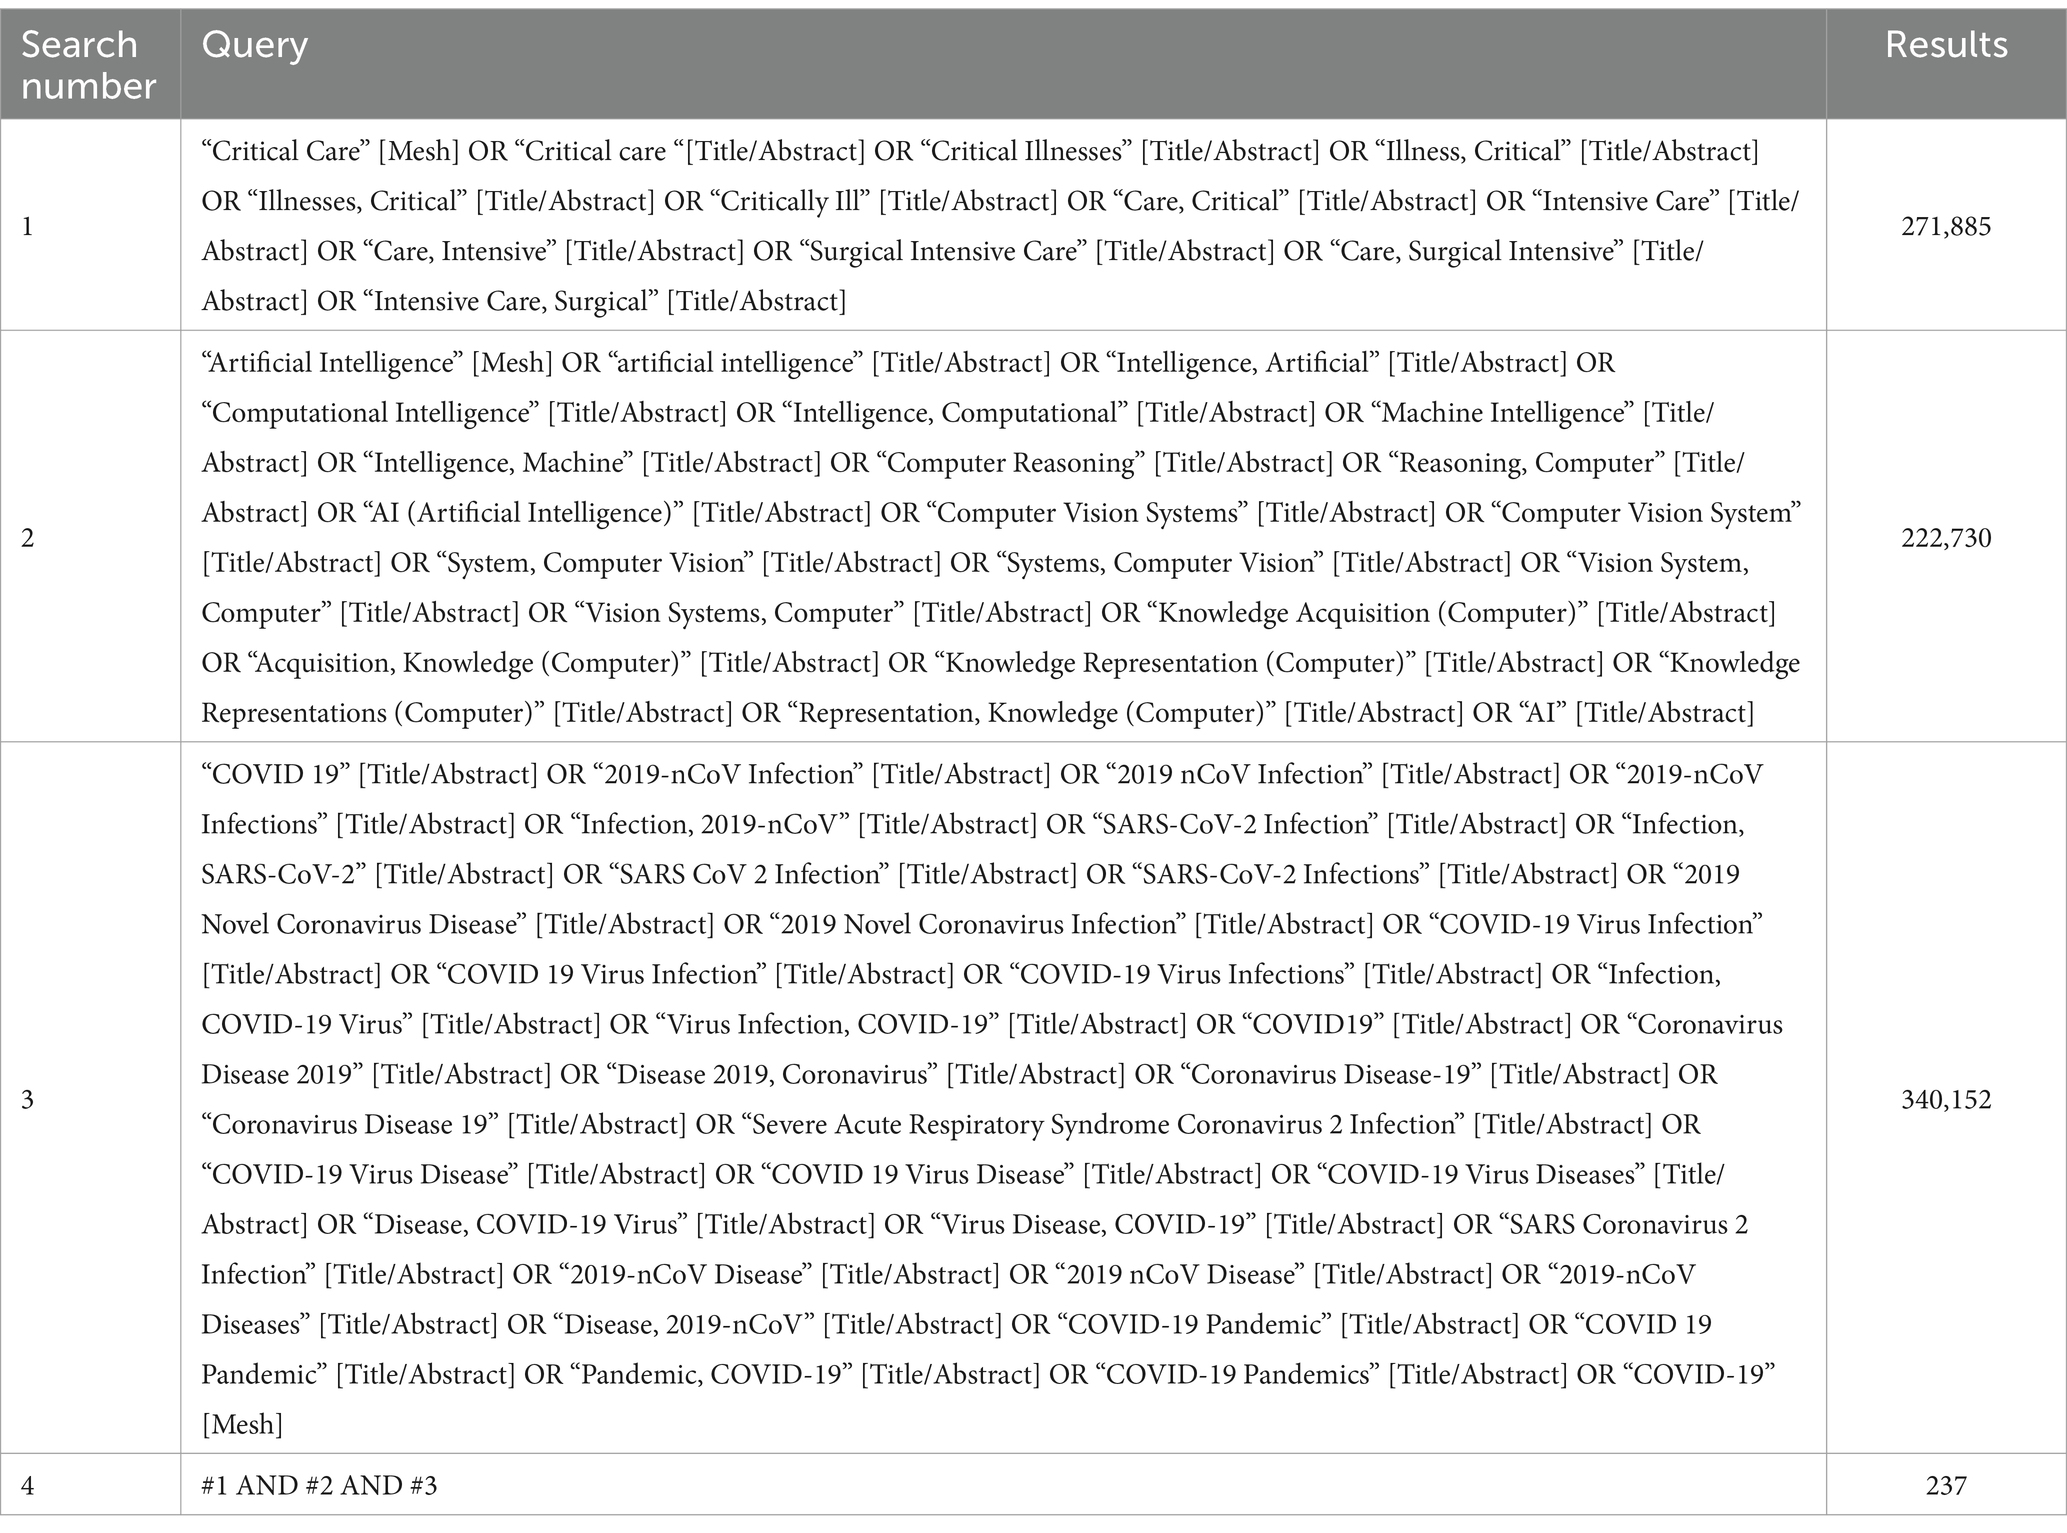
Table 1. Literature search strategy on PubMed.
(1) Research class: all articles in this study were published in English. (2) Study subjects: the participants were all patients aged >18 years diagnosed with COVID-19 and were either fully or partially treated in the ICU. (3) Patient grouping: deceased or surviving. (4) Outcome indicators: the actual number of deaths, actual number of survivors, at least two of AUC, sensitivity, specificity, accuracy, and F1-score were provided. (5) Study type: Cohort or case–control studies.
(1) Studies with missing outcome indicators, unavailable data, or inconvertible data were excluded, as were (2) duplicated reports and (3) review reports. (4) The original articles were not included.
After literature retrieval, repeated studies were excluded using the software. Two researchers read the titles and abstracts, screened them according to the inclusion and exclusion criteria, and obtained the full texts of the remaining literature. If the original text could not be obtained from the Internet, the author of the original text was contacted, and the full text was read and further screened.
Two researchers independently extracted the following literature data: author, publication year, study type, prediction model category, country, income level [high-income and non-high-income economies as defined by the World Bank (25)], total number of patients, actual number of dead patients, actual number of surviving patients, predicted number of dead patients, and predicted number of surviving patients (only the optimal model data of the external validation set were extracted; if not explicitly specified, the dataset provided in the article was assumed to be the validation set). After both researchers completed data extraction, the results were cross-checked, and discrepancies were discussed and finalized.
Individual study bias was independently evaluated by two researchers using PROBAST 2019 (26), which includes two parts: risk of bias and applicability. The risk of bias section evaluates mainly participants, predictors, outcomes, and analyses. The applicability section evaluates the participants, predictors, and outcomes.
In this study, we utilized the GRADE (Grading of Recommendations, Assessment, Development, and Evaluation) system to evaluate the credibility of the findings and assign a level of recommendation (27). It categorizes the evidence quality into four levels: high, moderate, low, and very low, considering factors such as quality of evidence, consistency of results, directness, precision, and potential bias.
(1) Stata 16 software was used for statistical analysis. (2) The study was evaluated using sensitivity, specificity, 95% CI, and receiver operating characteristic (ROC) curves; comparisons were performed using forest plot descriptive statistics. (3) Literature heterogeneity was analyzed using I2 analysis, with I2 > 50% indicating heterogeneity of the results. (4) If no heterogeneity was found among the studies, the fixed effect model was used. If heterogeneity was evident among the studies, the random effects model was used for calculation; (5) heterogeneity survey: subgroup analysis was used to investigate heterogeneity; (6) sensitivity analysis was performed to detect the literature most affecting the effect size on the Diagnostic Odds Ratio (DOR) value; and (7) publication bias was detected using Egger’s test and presented using Deeks’ funnel plot.
Figure 1 shows the PRISMA flow diagram of the study selection process. An exhaustive database search yielded 473 articles. Of these, 87 were eliminated through EndNote; the remaining 386 were screened for titles and abstracts. Following title and abstract screening, 285 publications were excluded, leaving 101 articles for full-text screening. The full texts of these 101 records were retrieved and reviewed for eligibility. For the reasons summarized in Figure 1, 82 articles were excluded. Ultimately, 19 studies were included in our Meta-analysis (22, 28–44).
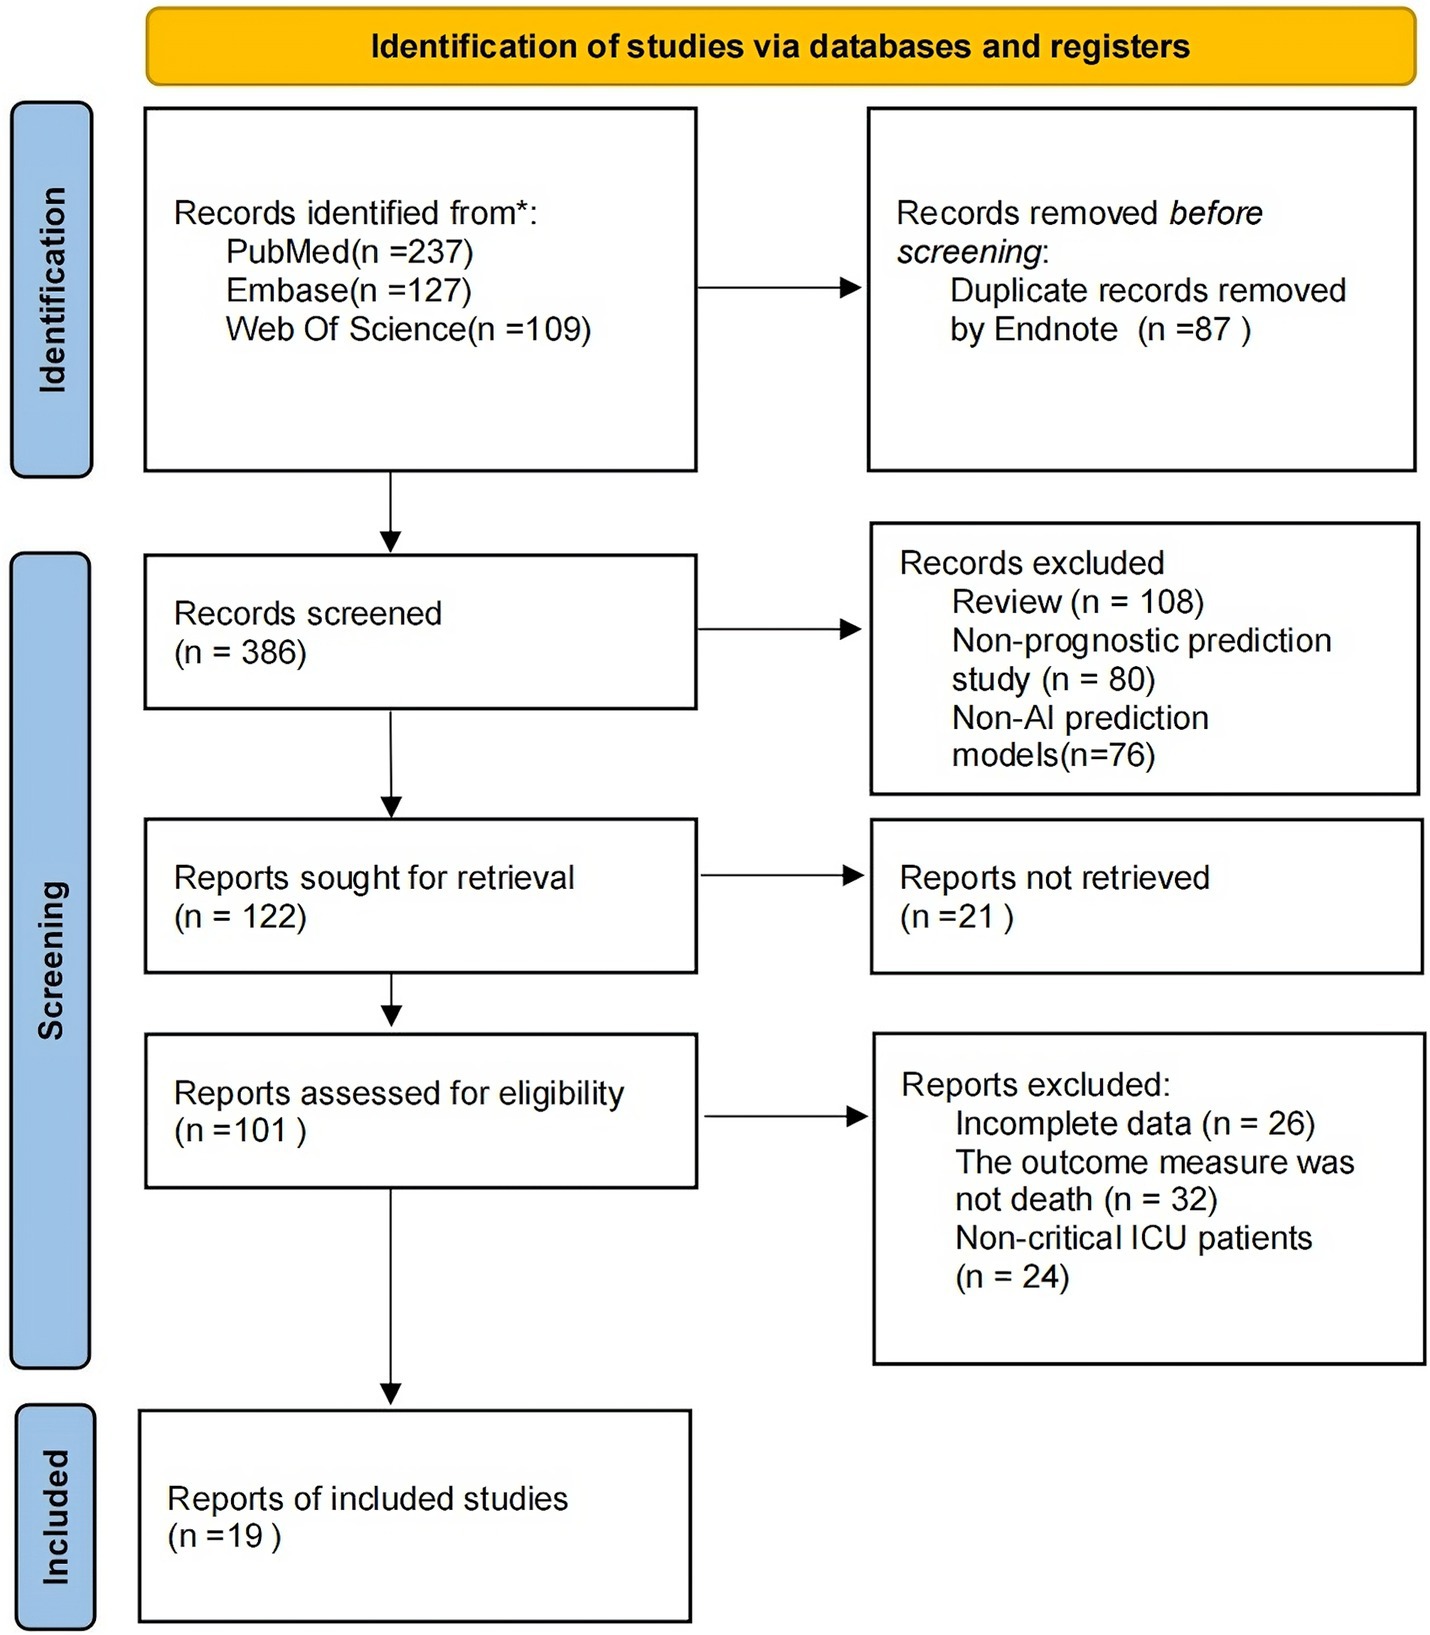
Figure 1. PRISMA flow diagram of study selection.
Table 2 lists the datasets extracted from selected articles. Briefly, they were published between 2021 and 2022 in Europe (n = 9), Asia (n = 4), North America (n = 3), South America (n = 1), and Africa (n = 1). Fifteen of the 18 studies were retrospective, in which past samples/images were evaluated; the remaining three articles were prospective. Clinical data were the most commonly used predictors (n = 12); a combination of clinical and imaging data were used to predict severe COVID-19 mortality (n = 8). The included studies had two main categories of AI models: machine learning (n = 9) and deep learning (n = 9).
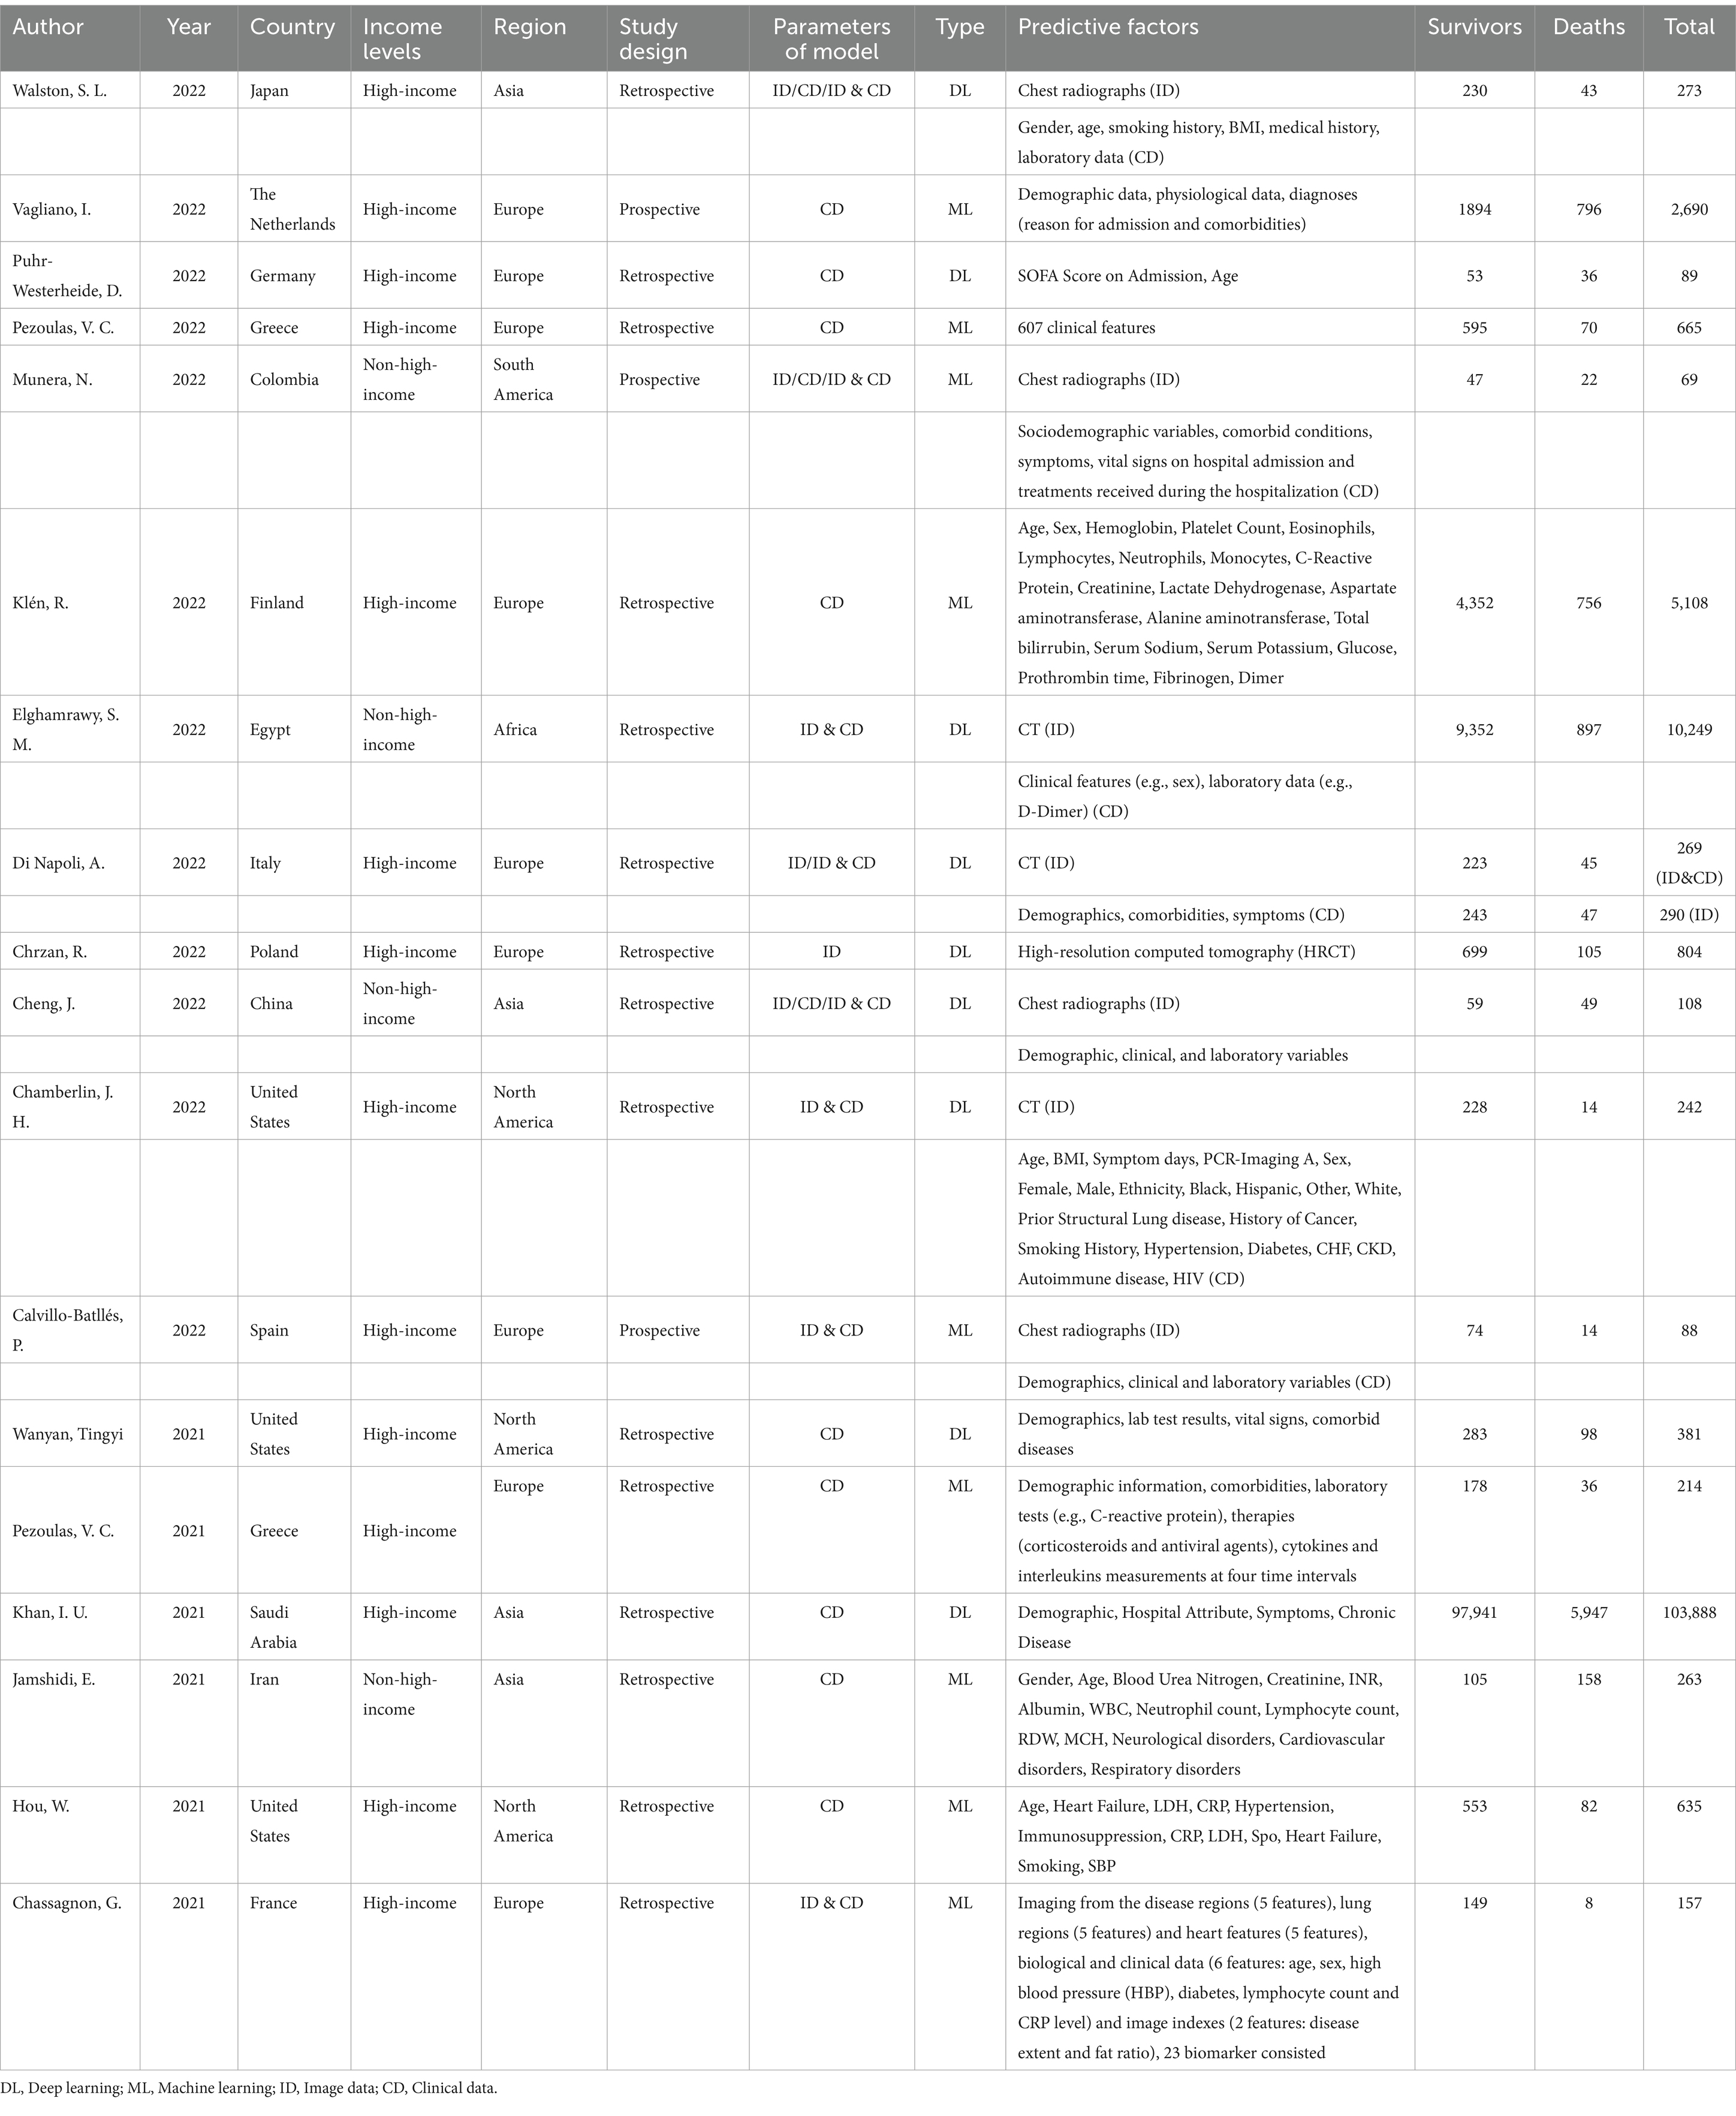
Table 2. Characteristics and extracted data from included studies.
Bias assessment included the risk of bias and applicability sections. The results of the qualitative assessment of the included studies are shown in Table 3.
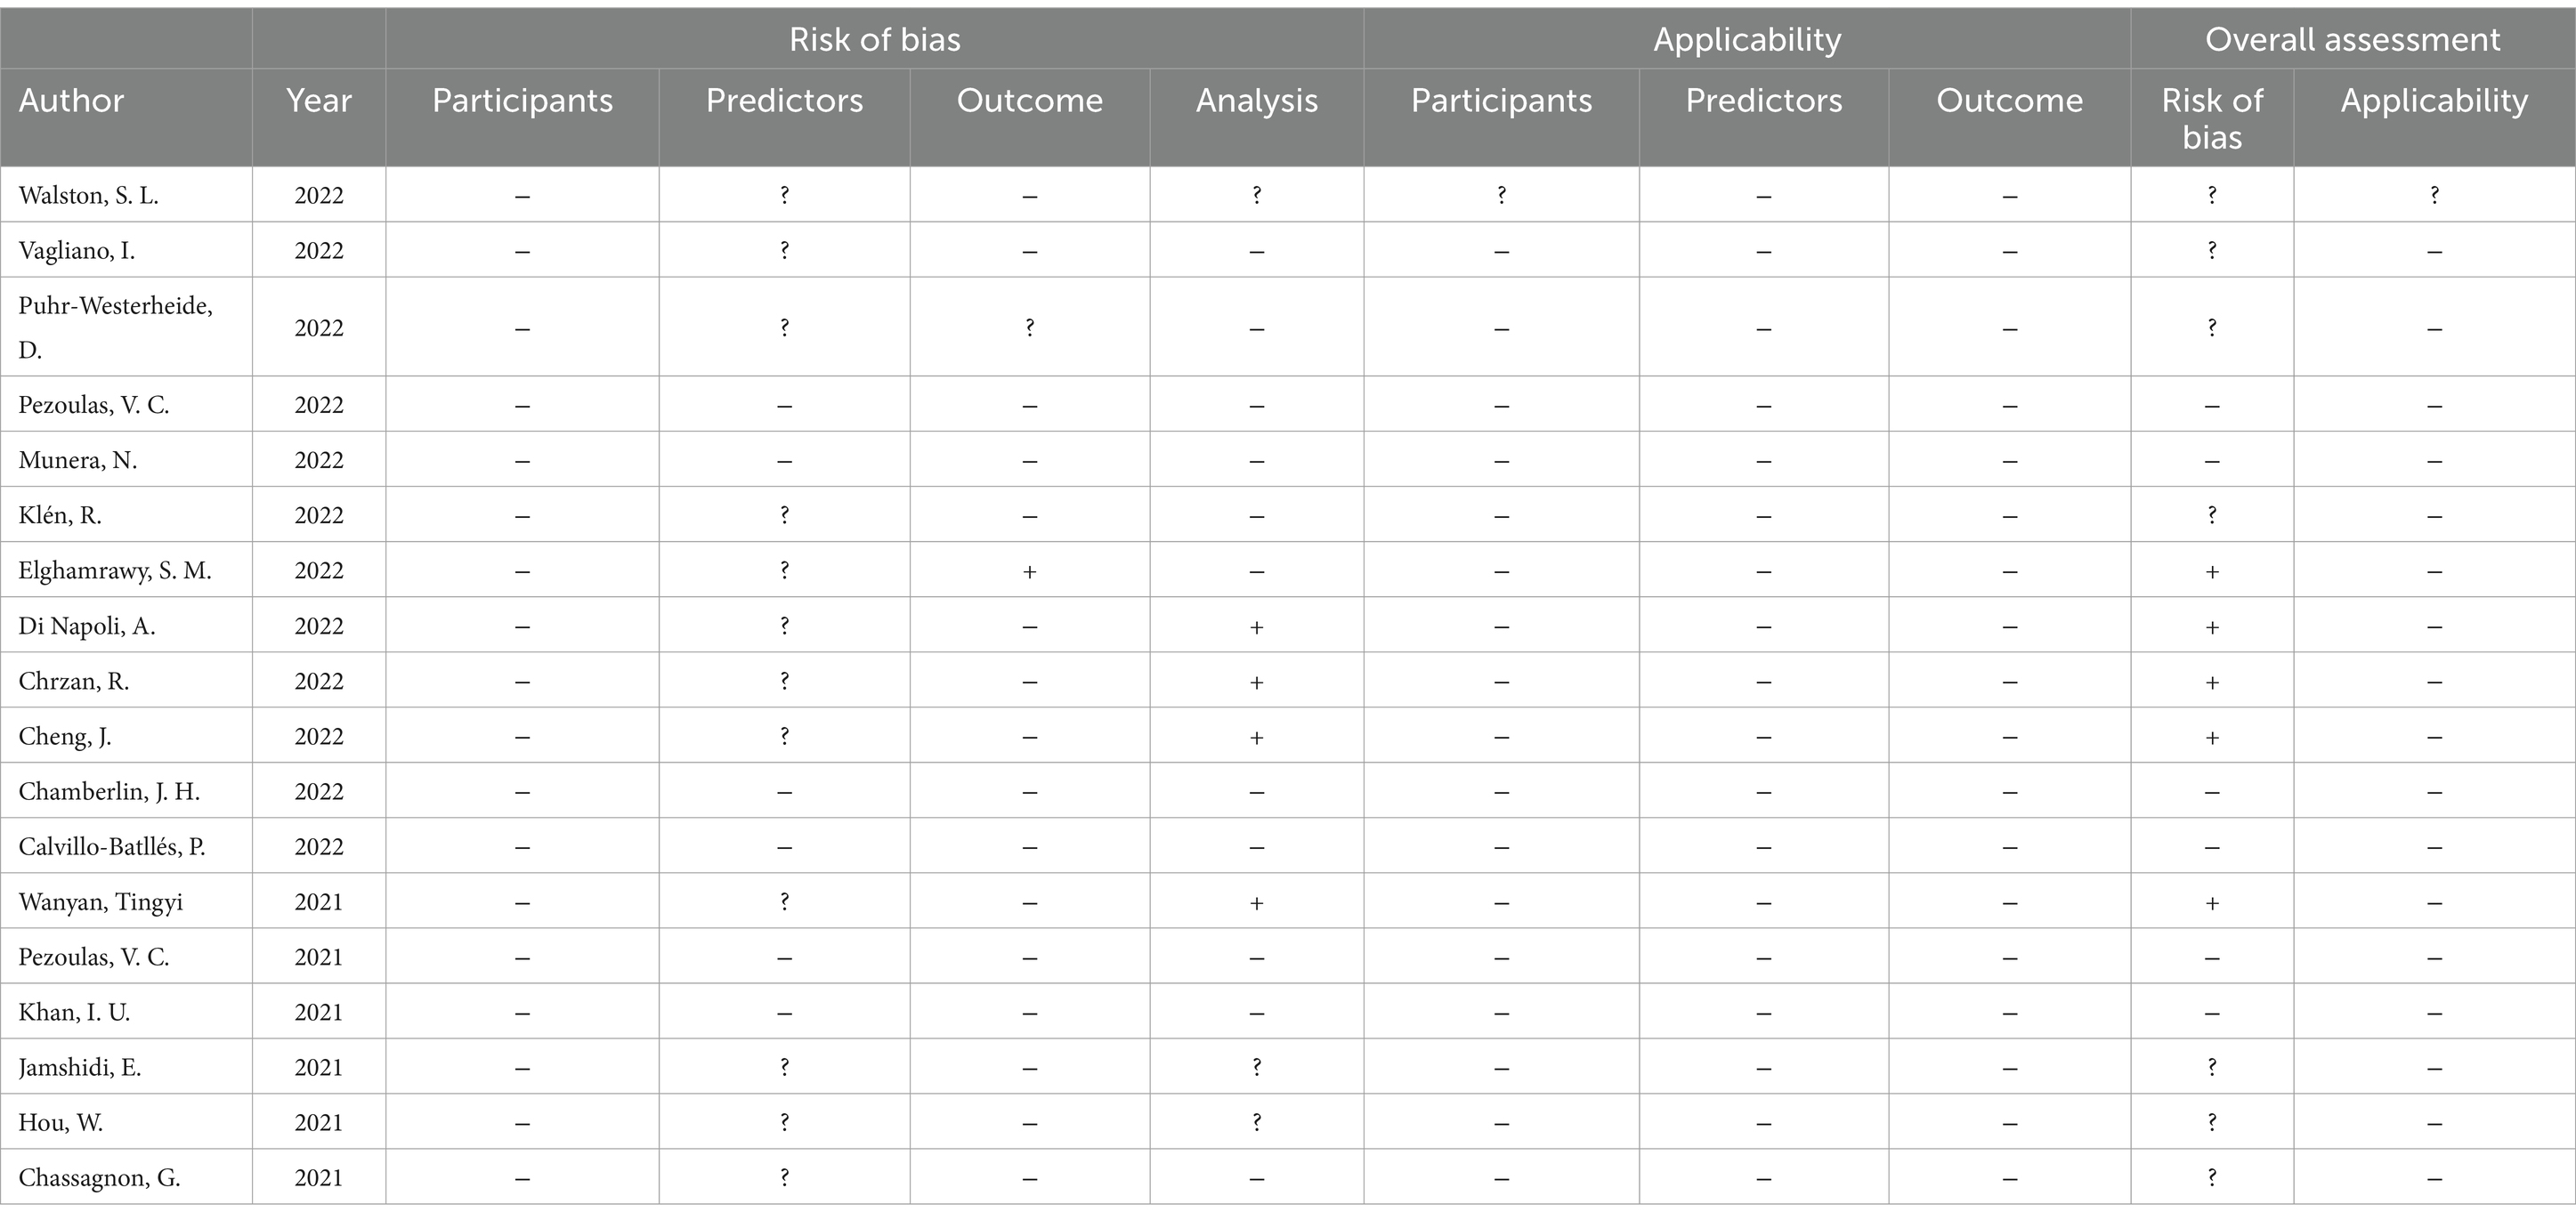
Table 3. Assessment of bias by PROBAST.
For bias risk assessment, six articles (22, 31, 37, 38, 40, 41) were determined to have a low risk, demonstrating robust methodologies and transparent reporting. Conversely, five articles (33–36, 39) were assigned a high risk of bias due to several factors. These included a lack of reporting on the appropriate handling of missing data and the determination of outcomes without prior knowledge of the predictive factor information. These issues pose a potential threat to the validity of our results. The risk levels for seven articles (28–30, 32, 42–44) remained ambiguous owing to insufficient information. The articles did not explicitly state whether the assessment of predictive factors was conducted without knowledge of the outcome data and whether issues such as model overfitting and optimistic model performance could be explained. This underscores the need for more comprehensive reporting.
With respect to the applicability assessment, the majority of articles (17 out of 18) were deemed to be of low risk, suggesting that their findings are likely relevant and applicable to the research context. However, one article (28) received an unclear rating due to insufficient evidence to confirm that the included participants and study setting aligned with the research question.
The 18 studies, including 25 AI prediction models, had an overall sensitivity of 0.74 (0.64–0.83, I2 = 99.94%) and a specificity of 0.86 (0.76–0.92, I2 = 99.26%) using clinical data, imaging data and the combination of clinical and imaging data. The overall AUC was 0.87 (0.83–0.89) (Figure 2).
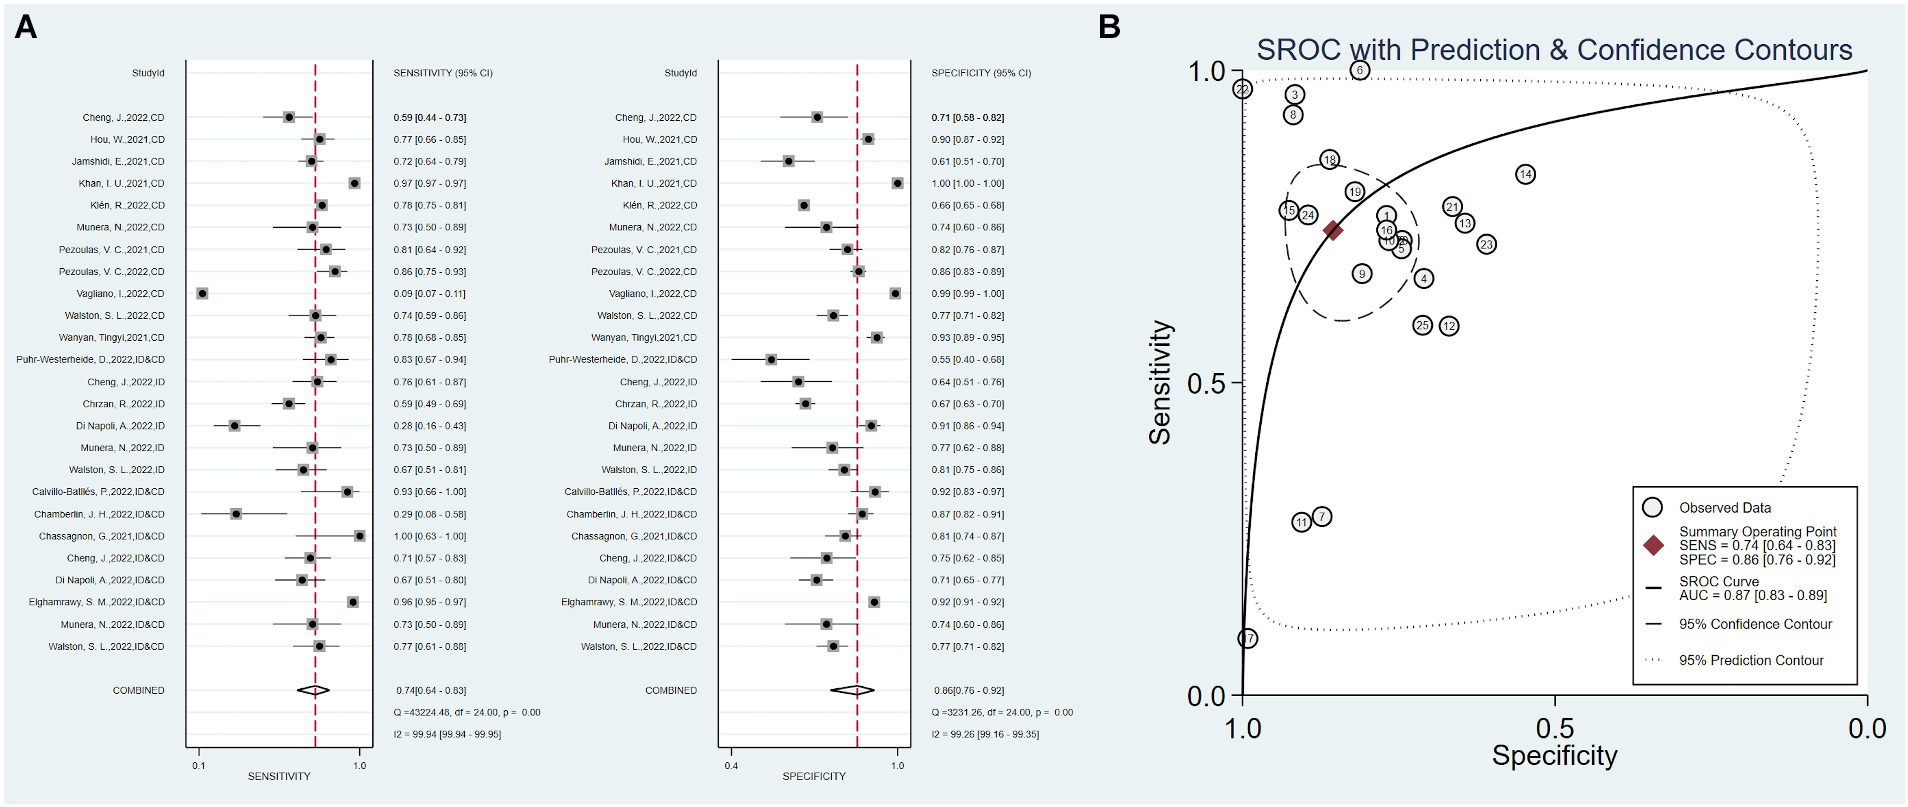
Figure 2. Overall sensitivity, specificity, and ROC curve. (A) Overall sensitivity and specificity, (B) overall ROC curve.
Twelve studies used only clinical data as predictors, with a total sensitivity of 0.75 (0.59–0.86) and I2 = 99.98%. The total specificity was 0.90 (0.70–0.97), I2 = 99.65% (Figure 3). The overall AUC was 0.88 (0.84–0.90).
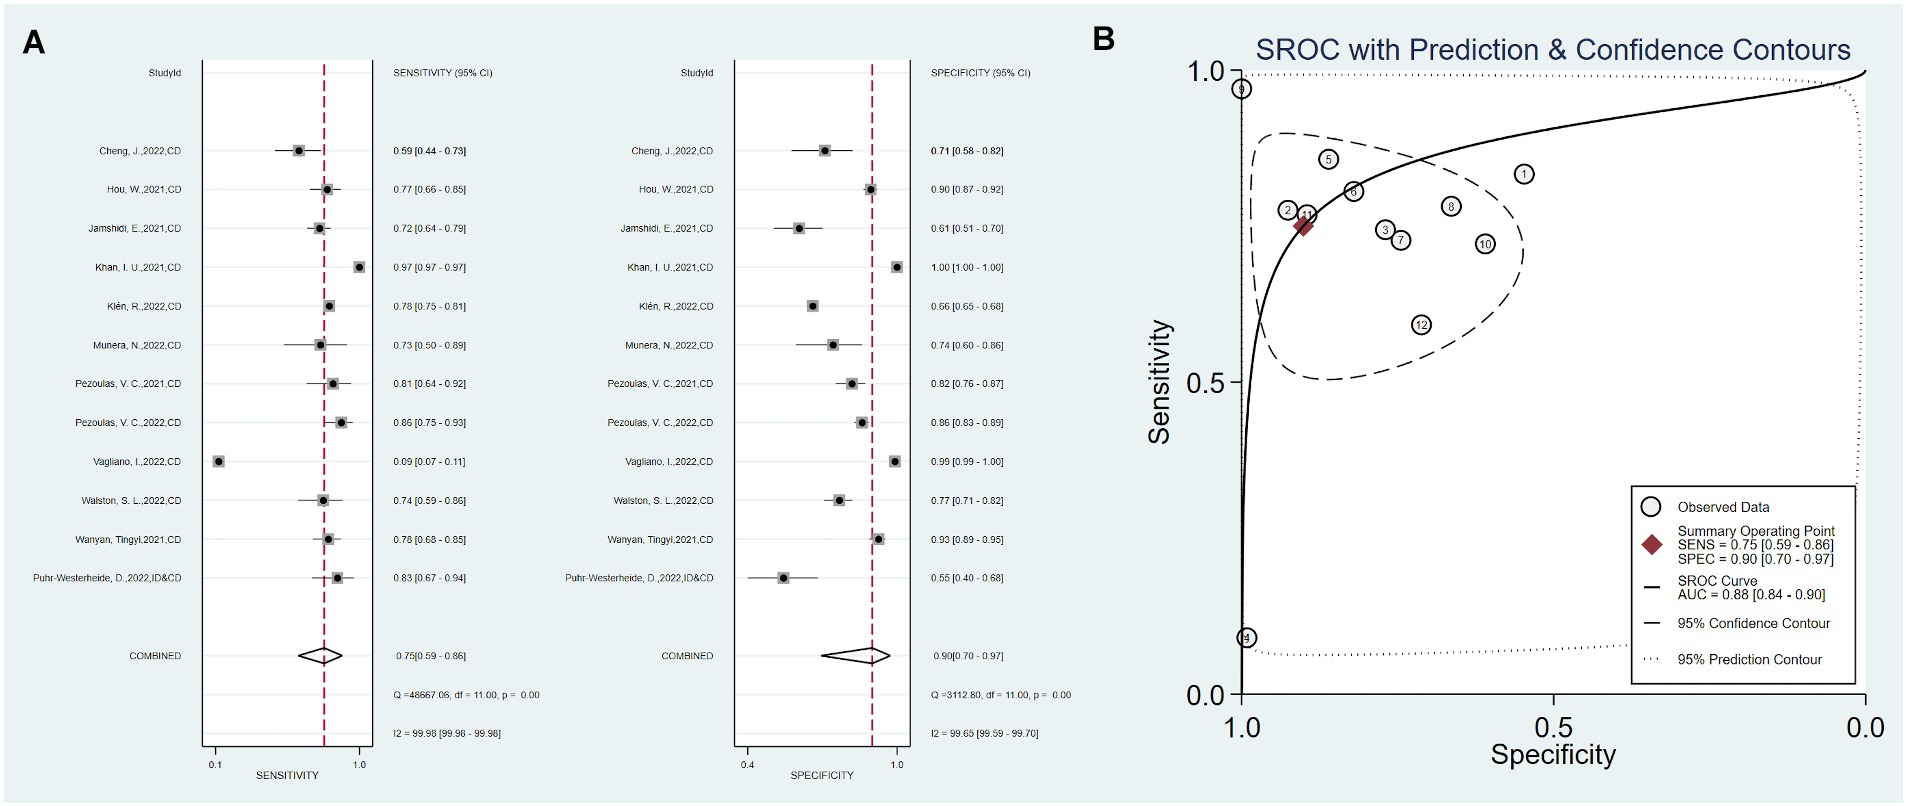
Figure 3. Sensitivity, specificity, and ROC curve based on clinical data. (A) Sensitivity and specificity based on clinical data model, (B) ROC curve based on clinical data.
Five studies used only imaging data as predictors, with a total sensitivity of 0.59 (0.43–0.47) and I2 = 86.29%. The total specificity was 0.77 (0.66–0.85), I2 = 94.85%. The overall AUC was 0.75 (0.71–0.79) (Figure 4).
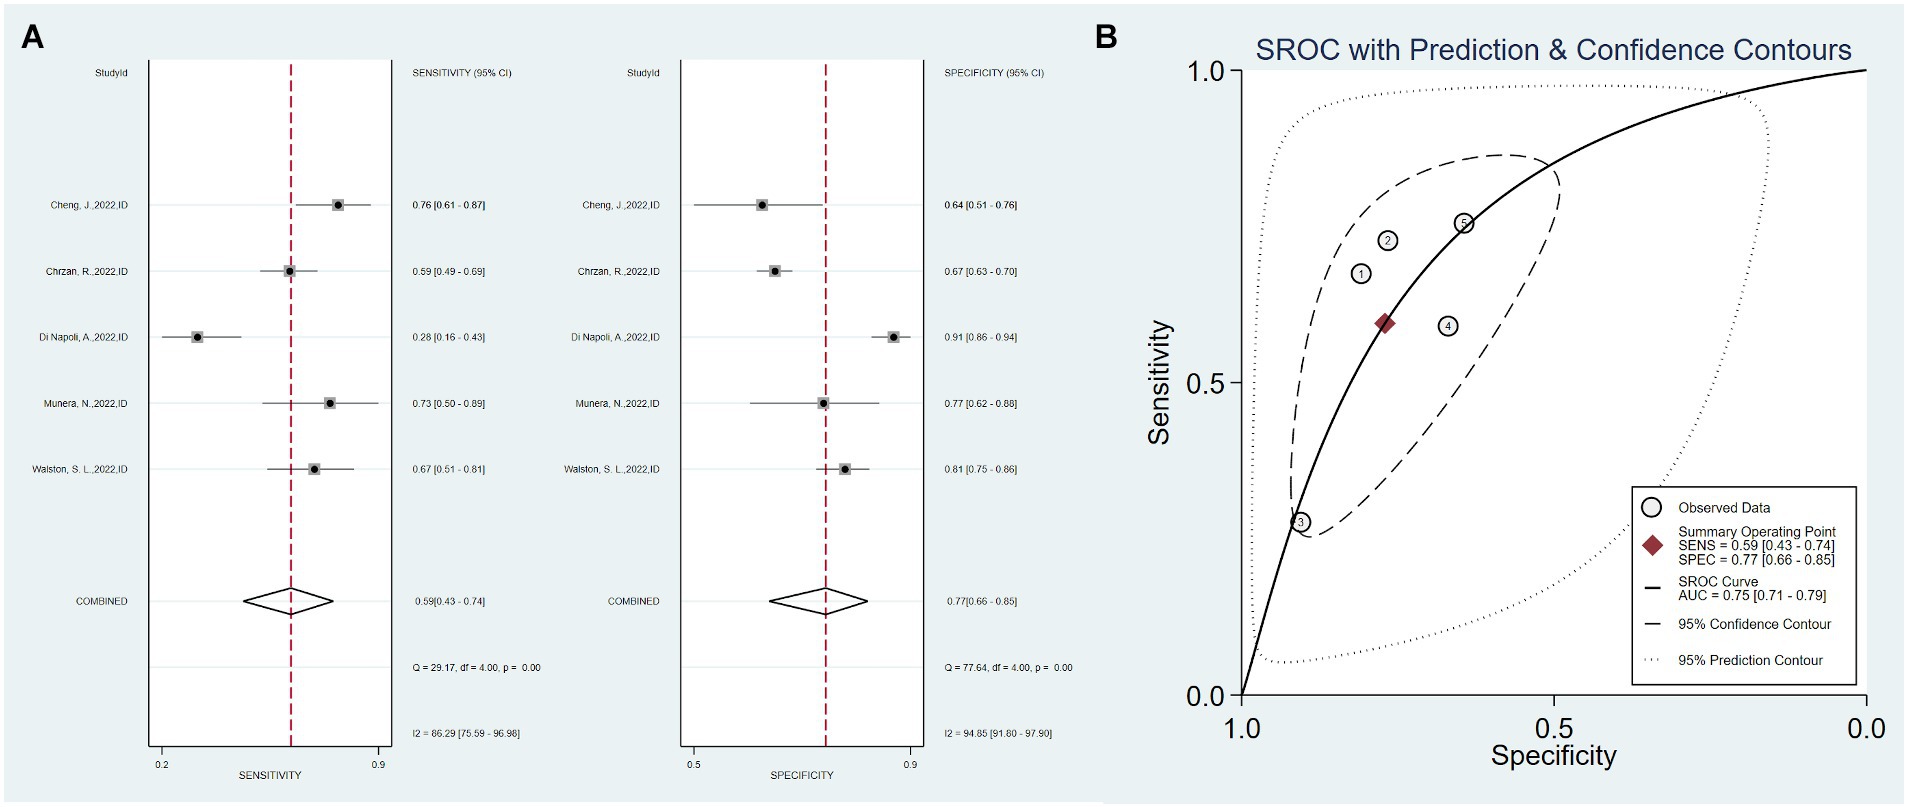
Figure 4. Sensitivity, specificity, and ROC curve based on imaging data. (A) Sensitivity and specificity based on imaging data model, (B) ROC curve based on imaging data.
Eight studies combined clinical data with imaging data, with a total sensitivity of 0.81 (0.64–0.91) and I2 = 95.18%. The total specificity was 0.77 (0.71–0.82), I2 = 98.99%. The overall AUC was 0.88 (0.85–0.90) (Figure 5).
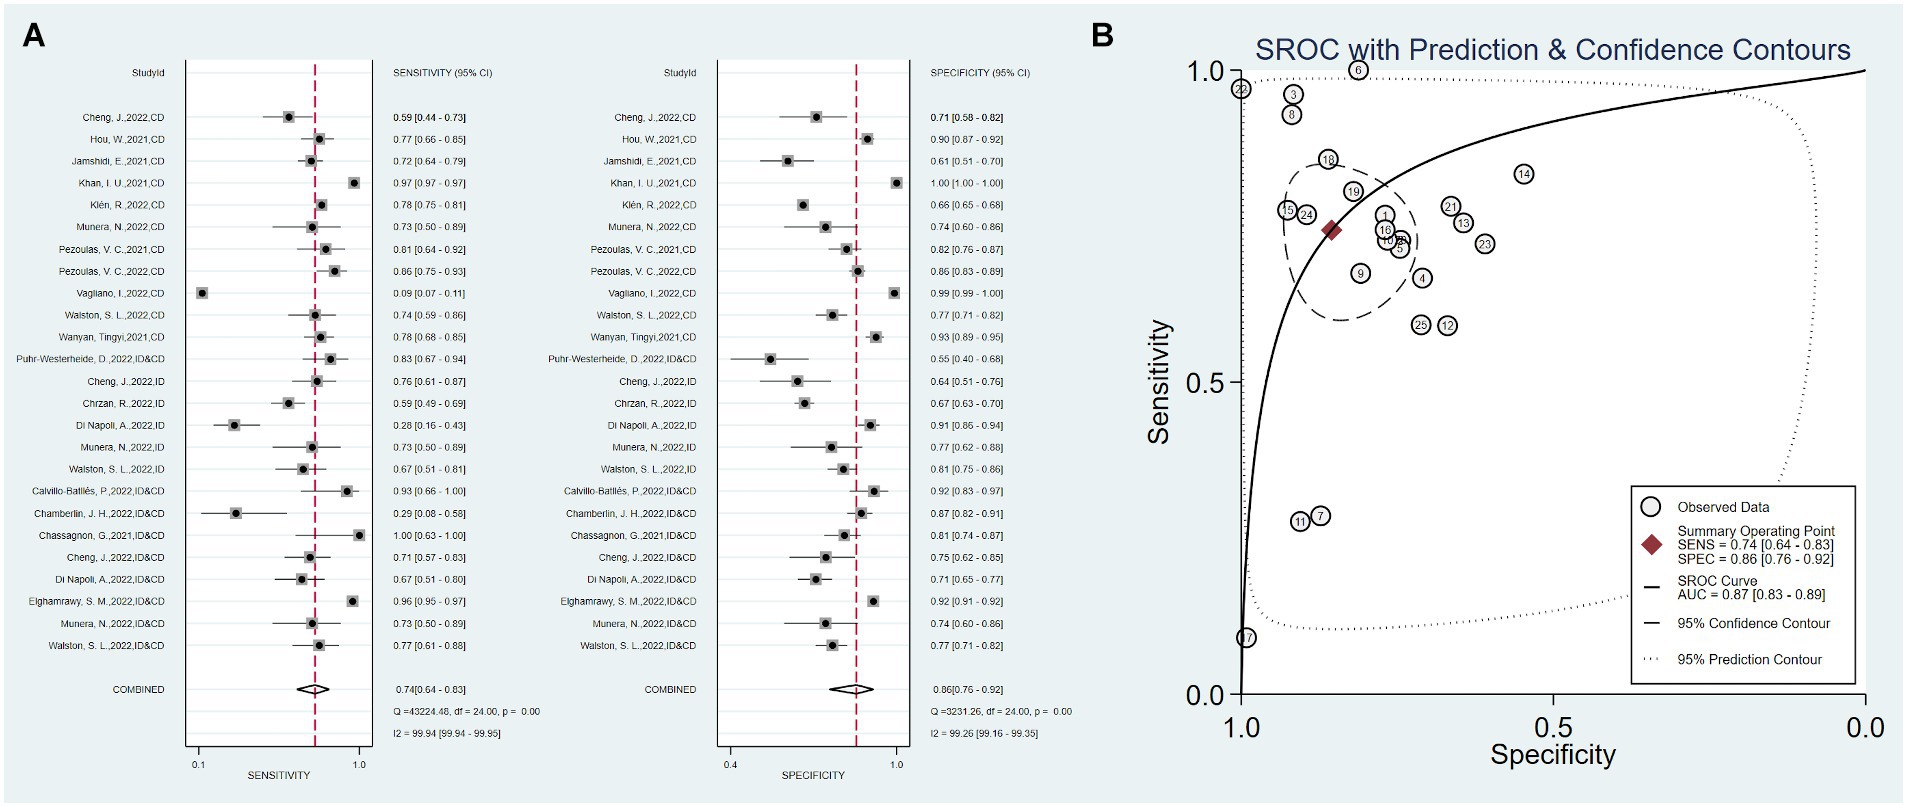
Figure 5. Sensitivity, specificity, and ROC curve based on combined clinical and imaging data. (A) Sensitivity and specificity based on combined data, (B) ROC curve based on combined data.
The Fagan’s nomogram was used to evaluate the diagnostic performance of the AI model in predicting mortality in severe COVID-19 cases. In Figure 6A, The pre-test probability, or the anticipated probability of mortality prior to the test results, was set at 20%. The likelihood ratios for positive and negative results for all the included articles were 5 and 0.30, respectively. These values yielded post-test probabilities of 56% for positive results and 7% for negative results.
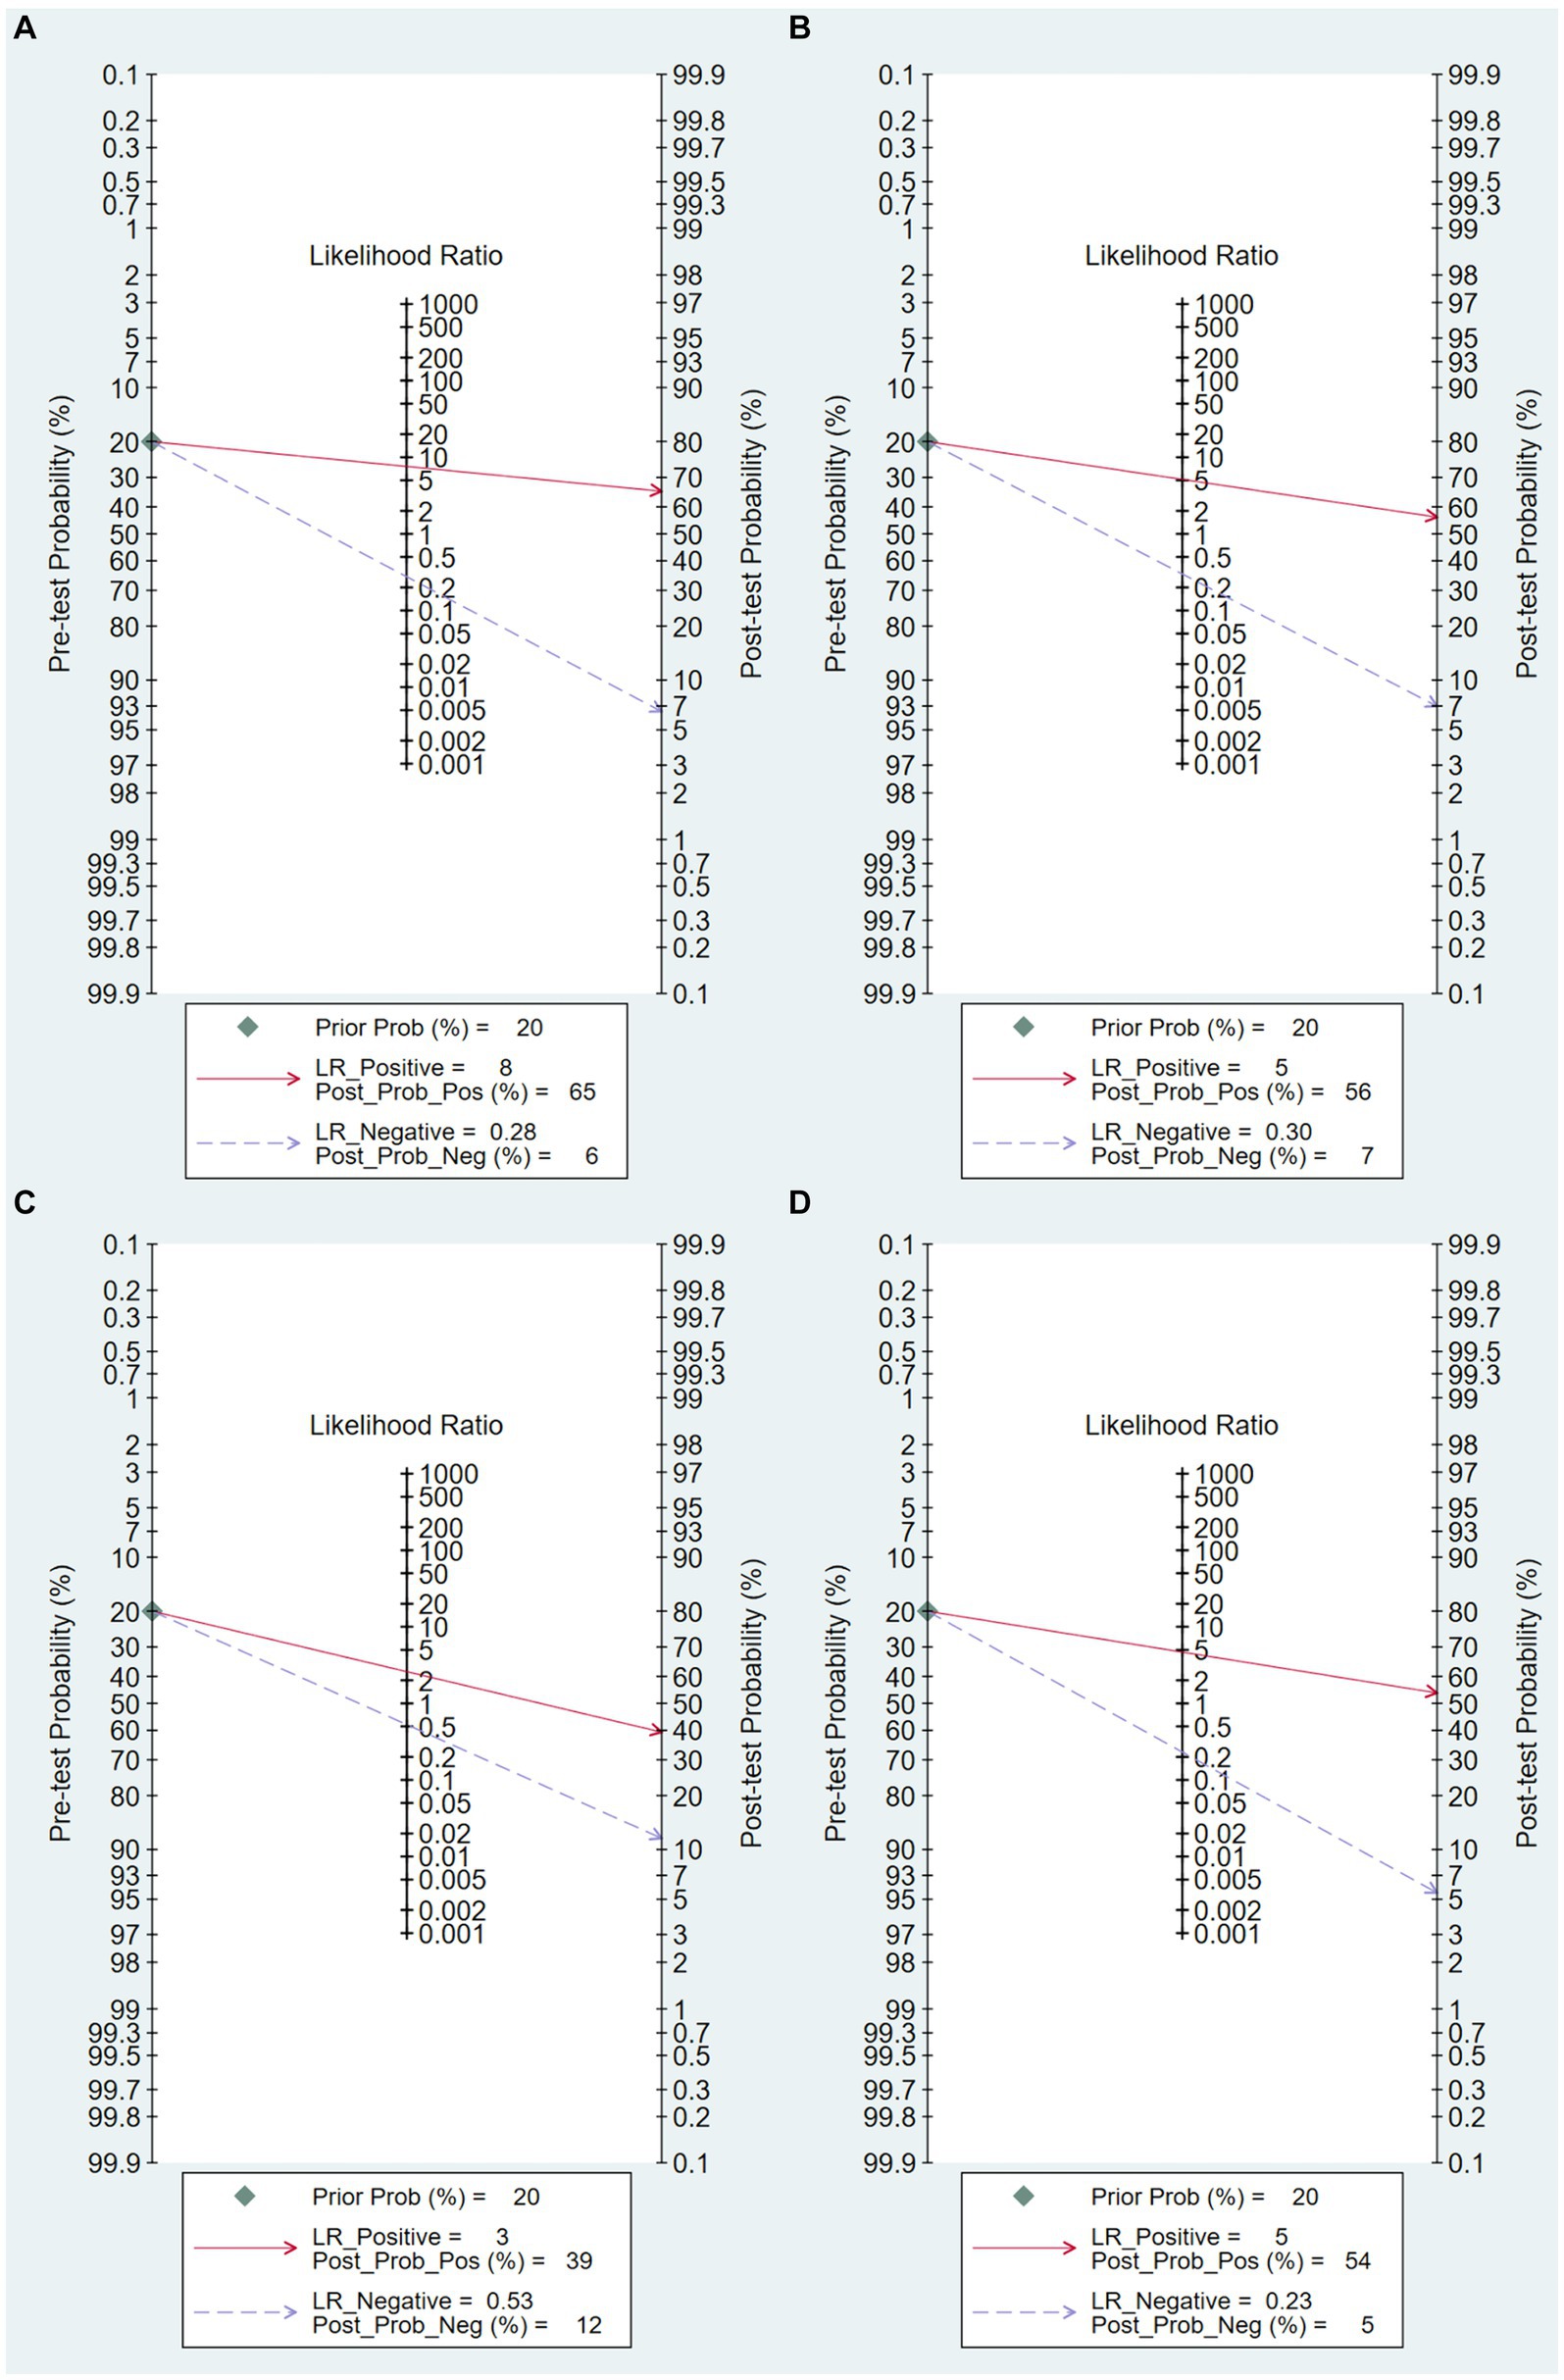
Figure 6. Fagan Plot. (A) Overall Fagan plot, (B) Fagan plot based on clinical data model, (C) Fagan plot based on imaging data model, (D) Fagan plot based on combined clinical and imaging data model.
Figure 6B illustrates that, given an initial expected mortality probability of 20% prior to testing, a prediction model solely utilizing clinical data as predictors yielded likelihood ratios of 8.0 for positive results and 0.28 for negative results. These values yielded post-test probabilities of 65% for positive results and 6% for negative results.
As shown in Figure 6C, under the presumption of a 20% mortality probability prior to testing, a prediction model solely utilizing imaging data as predictors yielded likelihood ratios of 3 for positive results and 0.58 for negative results. These values yielded post-test probabilities of 39% for positive results and 12% for negative results.
As shown in Figure 6D, with an assumed pre-test mortality probability of 20%, a prediction model that used a combination of clinical and radiographic data as predictors yielded likelihood ratios of 3 for positive results and 0.58 for negative results. These values yielded post-test probabilities of 39% for positive results and 12% for negative results.
Meta-regression and subgroup analyses we conducted to explore the effects of different model types, economic income levels, study design methods, and settings in which all patients came from the ICU on the prediction power.
The results show that, within the context of the imaging data prediction model, high-income economies exhibited heightened prediction sensitivity (p < 0.05). Conversely, as depicted in Figure 7A, the model type, study design, and ICU status did not show significant disparities. Within the combined clinical and radiological prediction model, we observed several significant differences. Notably, when all patients were exclusively from the Intensive Care Unit, as well as in the case of artificial intelligence prediction models utilizing deep learning and models originating from high-income economies, a higher predictive specificity was demonstrated (p < 0.05) as illustrated in Figure 7B.
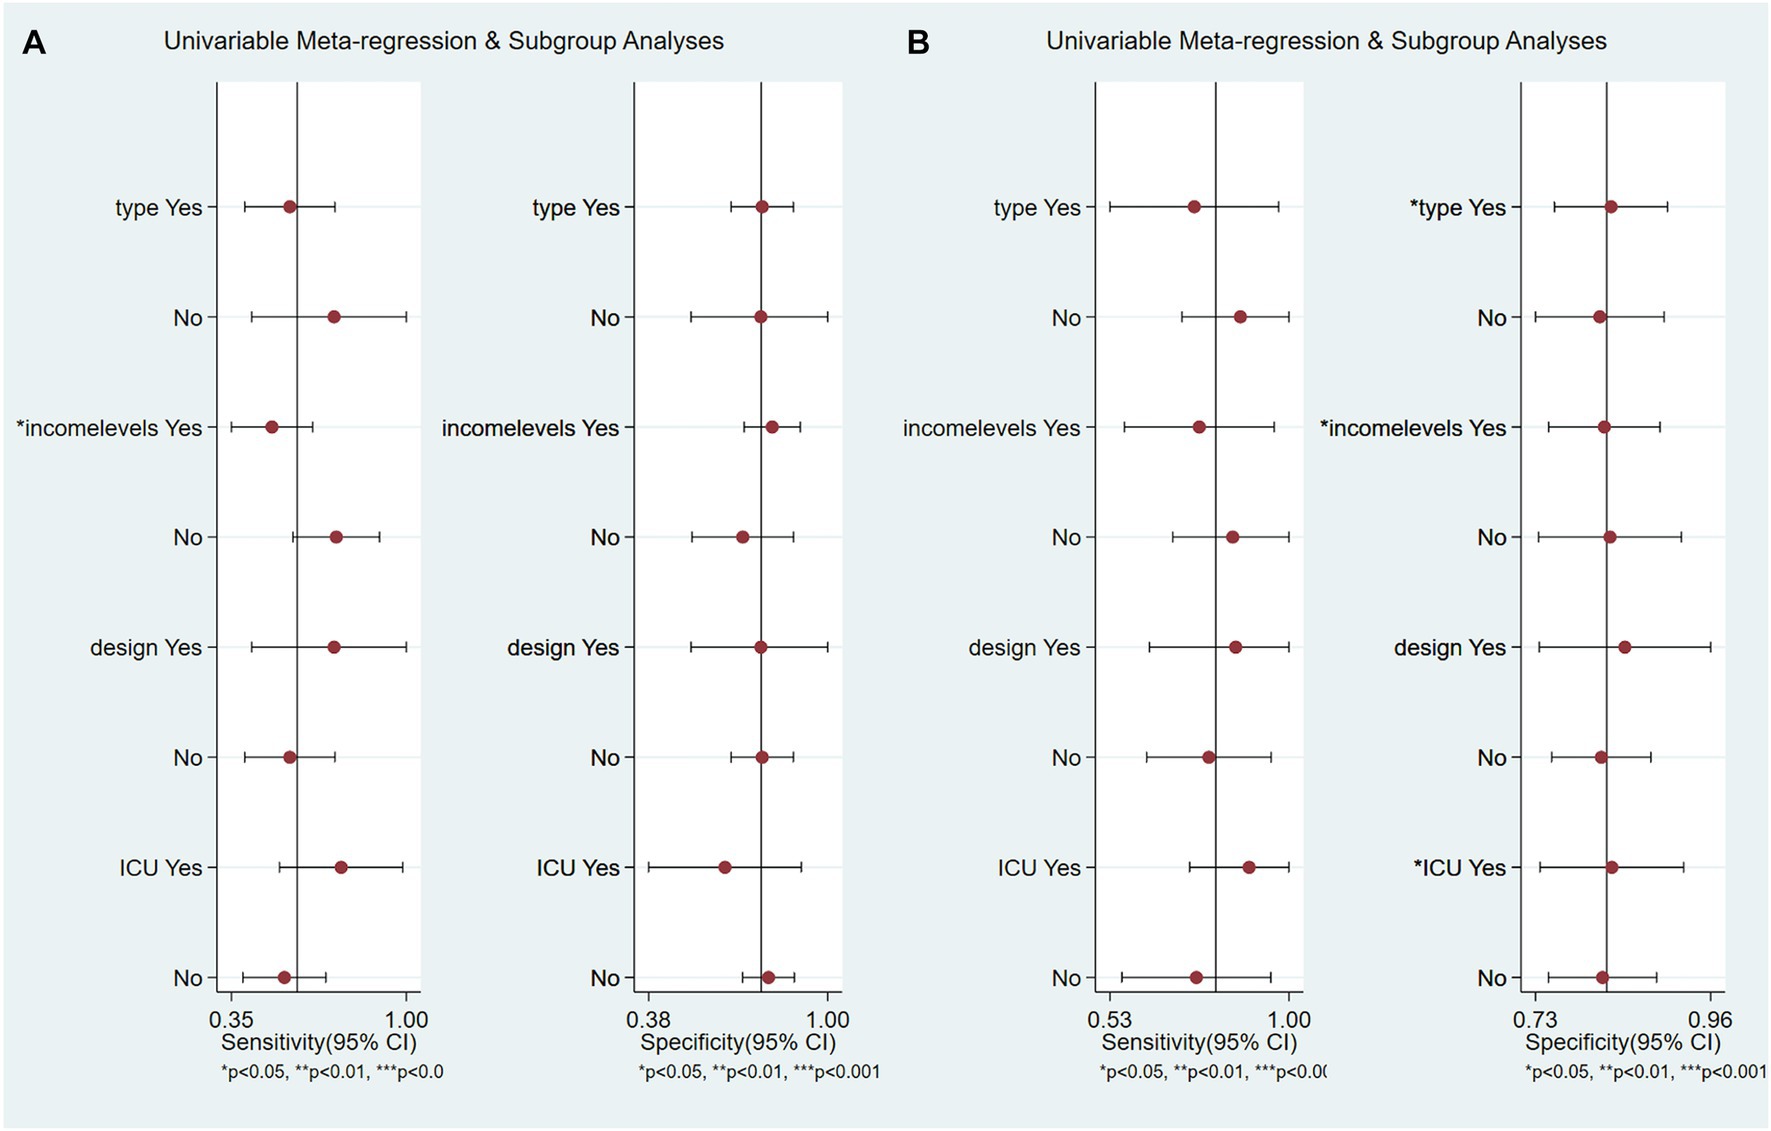
Figure 7. Meta-regression and subgroup analysis. (A) Based on imaging data prediction models, (B) Based on combination of imaging and clinical data prediction models.
A sensitivity analysis was conducted to explore the robustness and consistency of the results. As shown in Table 4, the overall value of the combined effect of DOR did not change significantly after removing them individually from the model; the stability was good. However, in the model based on imaging data, after excluding the studies by Walston et al. (28) and Chrzan et al. (35) the overall I2 changed from 55.6 to 29.30 and 2.70%, respectively, indicating that these two studies may be a source of heterogeneity (Tables 5, 6). In addition, among the eight studies based on the combination of clinical and imaging models, the overall heterogeneity was reduced from 96.2 to 58.6% after the exclusion of the study by Elghamrawy et al. (33) indicating that it may be the main source of heterogeneity (Table 7).
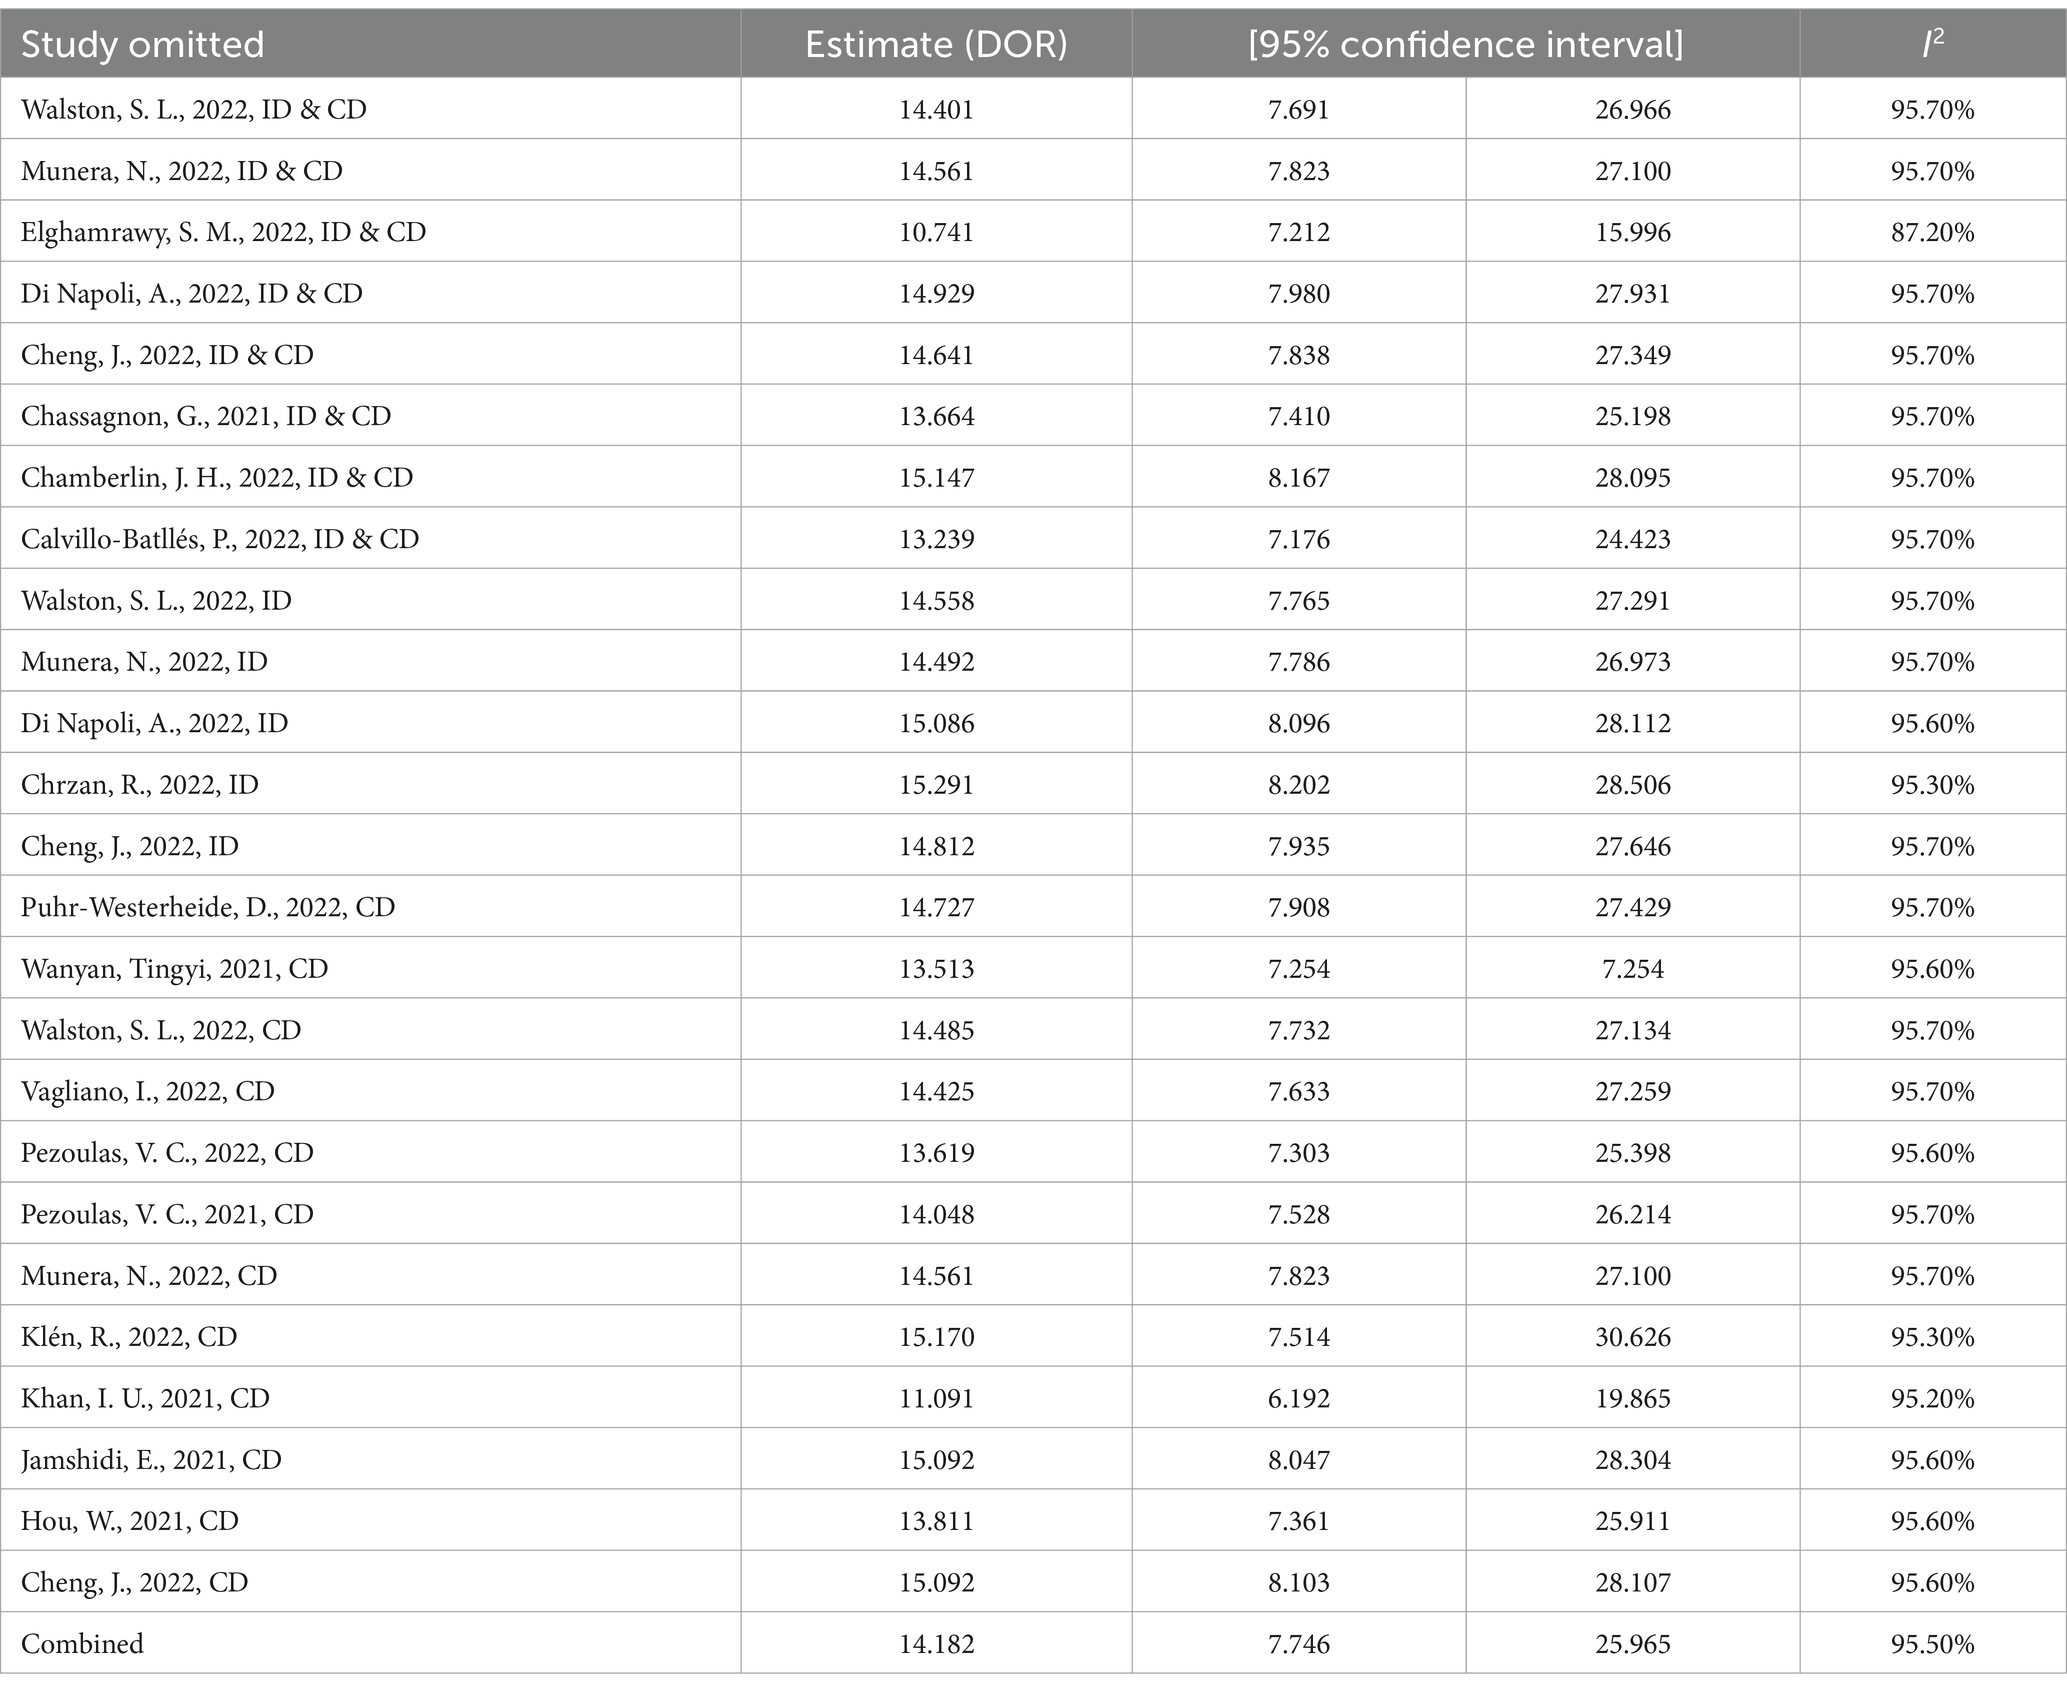
Table 4. Sensitivity analysis of included 25 studies (total).
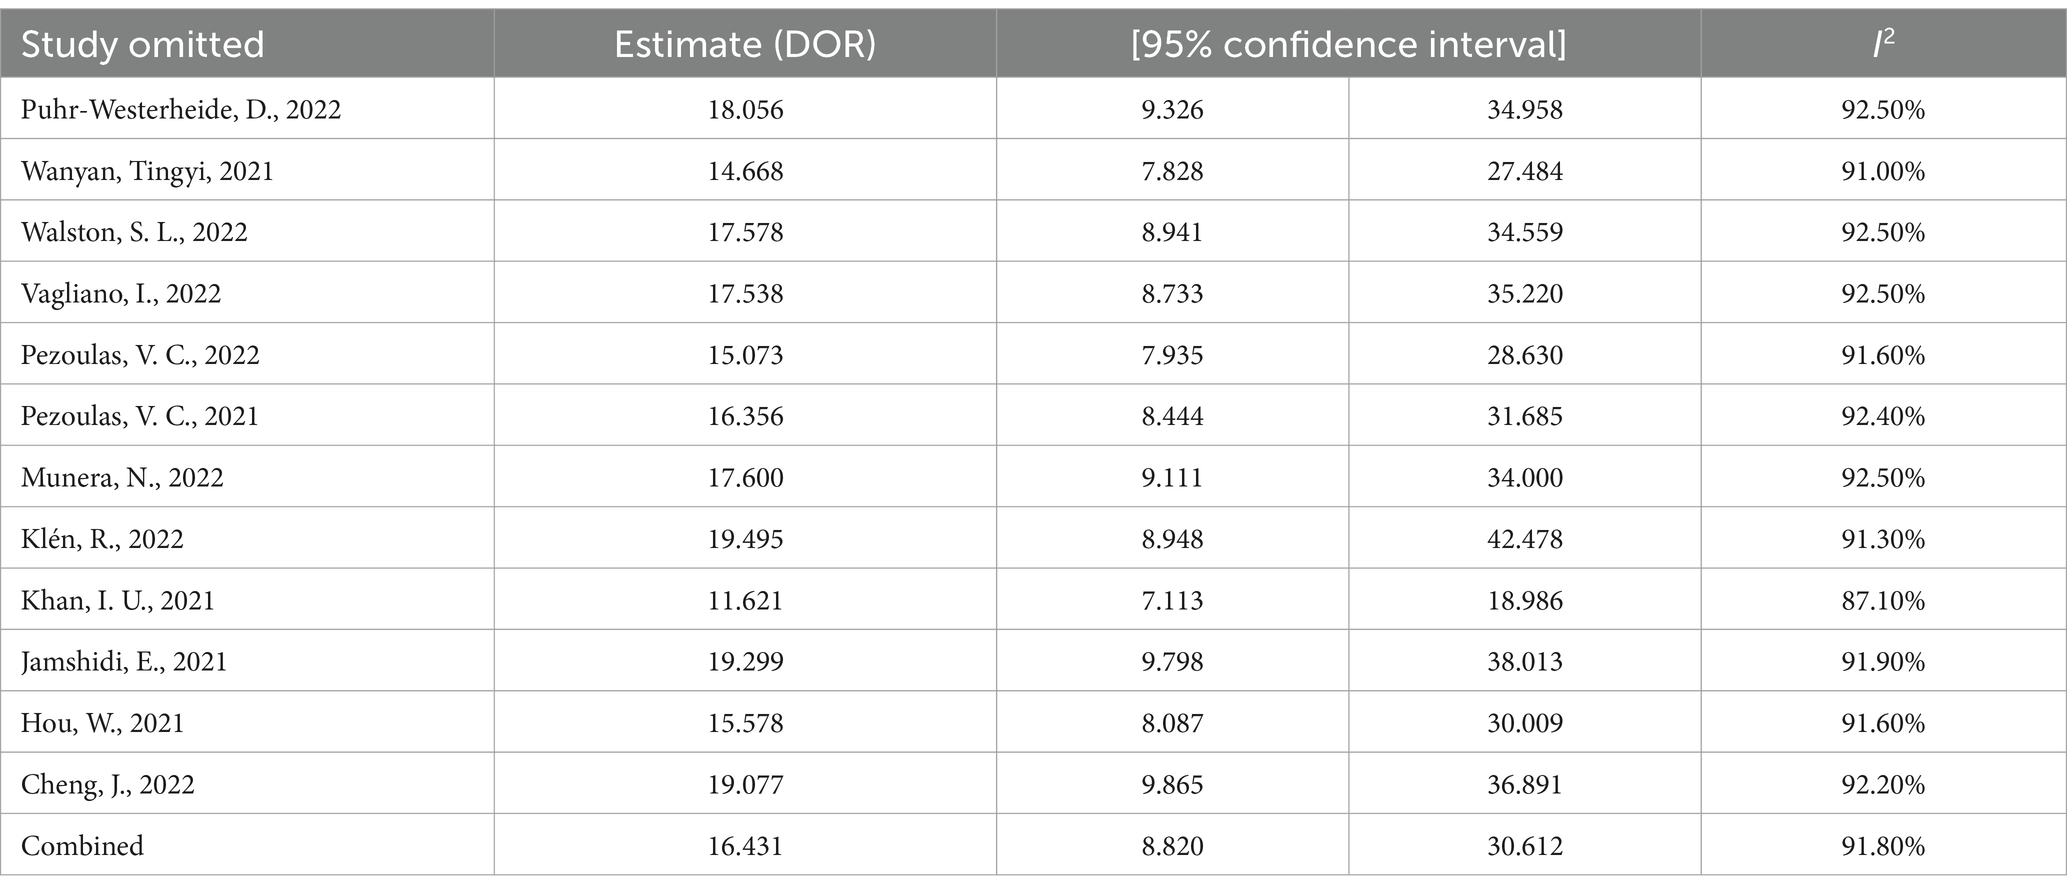
Table 5. Sensitivity analysis of included 12 studies (based on clinical data).
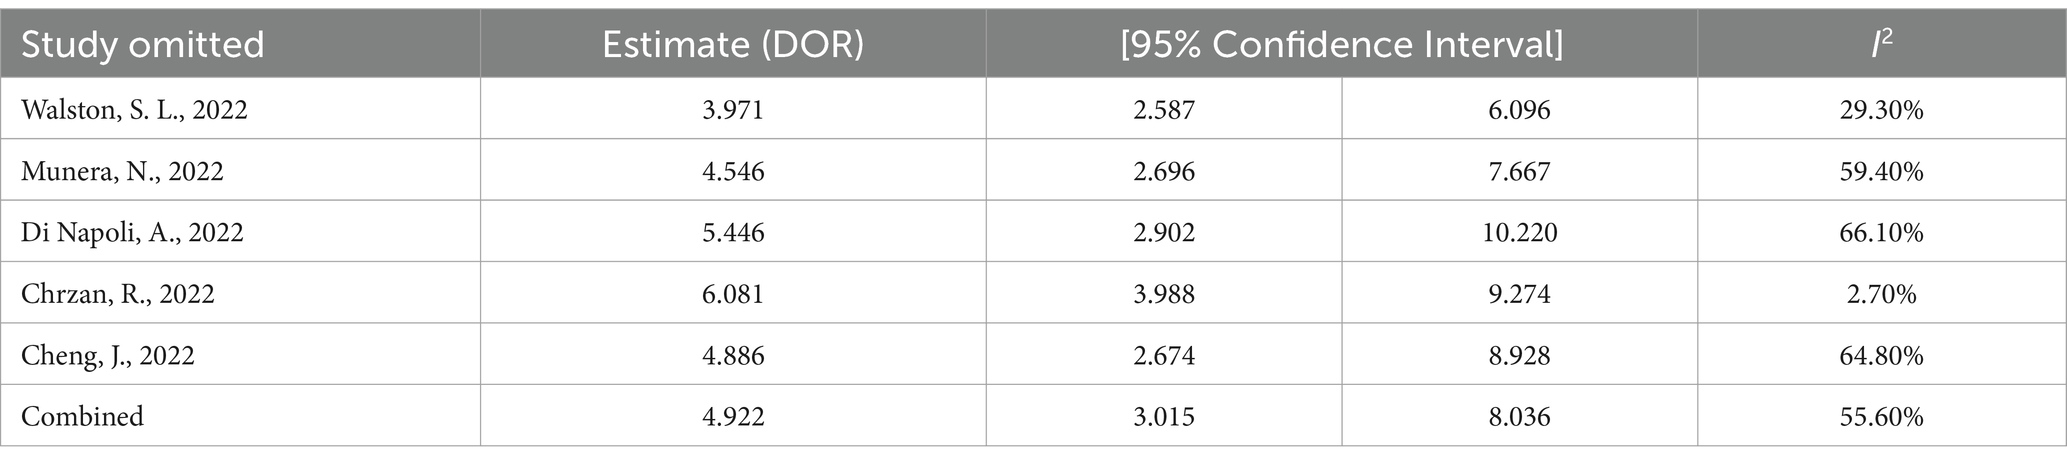
Table 6. Sensitivity analysis of included five studies (based on imaging data).
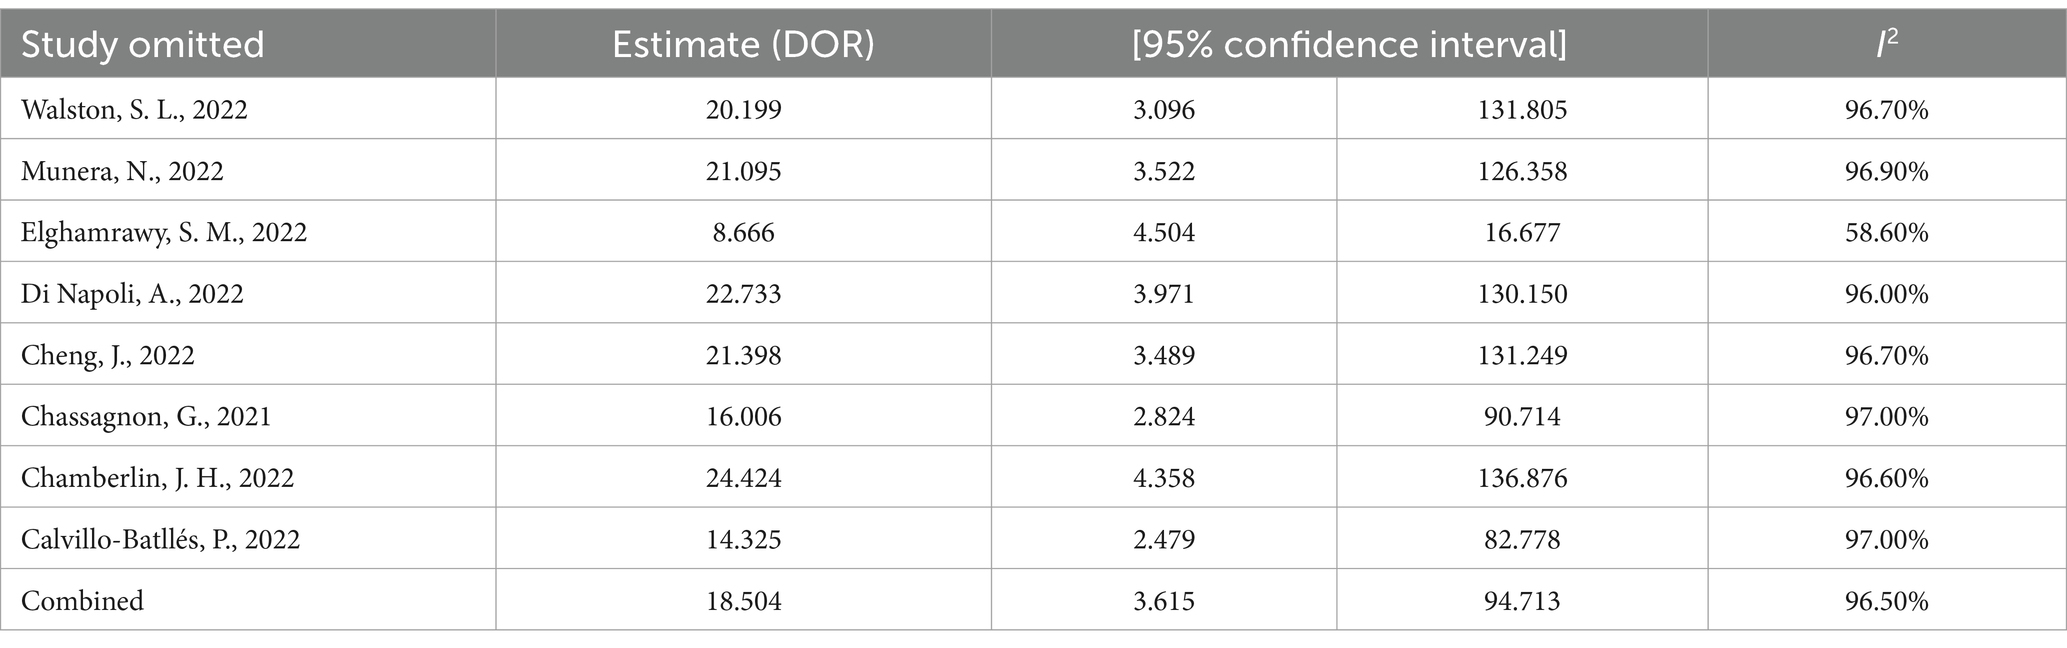
Table 7. Sensitivity analysis of included eight studies (based on the combined data).
The Deeks’ Funnel Plot Asymmetry Test, as depicted in Figure 8, was utilized to investigate the presence of publication bias. The studies, represented by individual data points, are not symmetrically distributed around the regression line (p < 0.001), suggesting the presence of publication bias or other small-study effects in the meta-analysis.
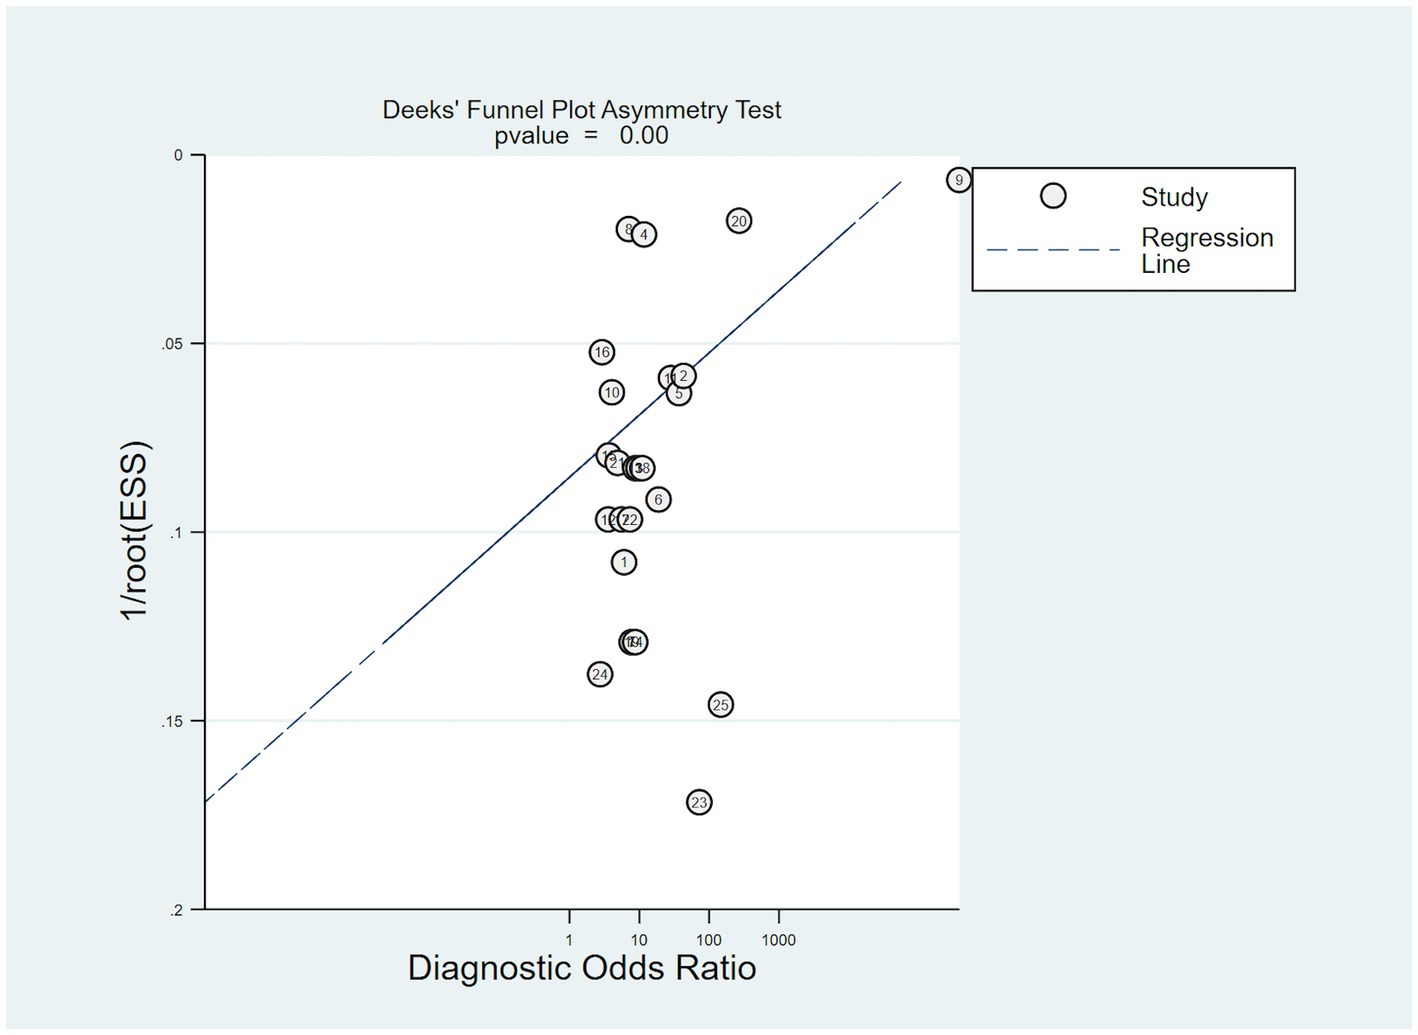
Figure 8. Deek’s funnel plot was used to evaluate publication bias.
The aforementioned four important outcomes in this meta-analysis were evaluated using the GRADE system. The evidence quality level for each outcome was found to be very low Table 8. Since all the included studies in this research had observational designs, the initial quality rating of the studies was assessed as “low.” The final overall level of evidence was rated as “very low,” which may decrease the credibility of any recommendations.
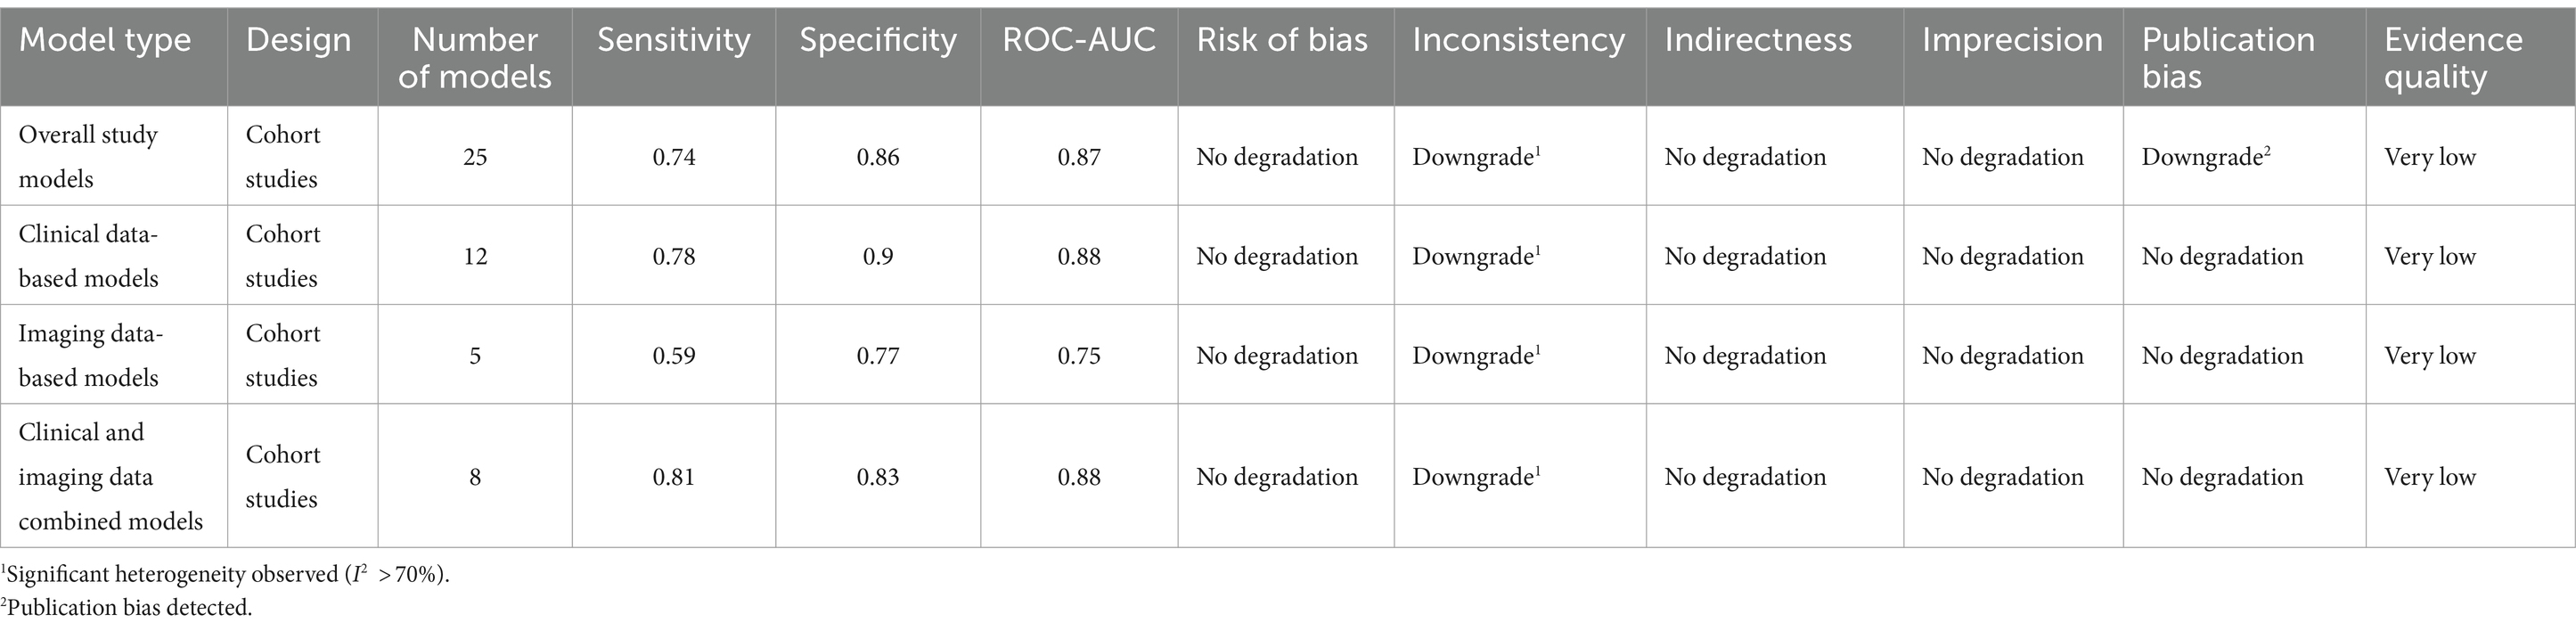
Table 8. The GRADE evidence quality for each outcome.
Since the emergence of COVID-19 in 2019, its global spread of novel coronavirus infection has caused significant disruptions in mortality patterns worldwide (45, 46). The ongoing 2019 coronavirus disease pandemic has prompted substantial efforts to prevent and treat COVID-19, leading to remarkable achievements (47–50). The World Health Organization ceased considering COVID-19 a global health emergency in May 2023. Despite these advancements, SARS-CoV-2 continues to persist, evolve, and threaten human life (51). Long COVID-19 is our big challenge (52, 53). Severe COVID-19 presents an ongoing and substantial risk to individual health and well-being, with mortality rates as high as 49% among critically ill individuals (54). Research exploring AI as an assistive tool for COVID-19 in this environment has gained prominence over the past 3 years (55–57). This study investigated this important topic.
AI is increasingly used in medicine (14). AI can autonomously search and extract intricate task-specific features, offering the advantage of cost-effectiveness (56, 58). This systematic review and meta-analysis meticulously synthesized the available evidence regarding the performance of AI prediction models for severe COVID-19 mortality. In the included literature, the clinical data encompassed elements including demographic information (such as age and sex), comorbidities (hypertension, stroke, atrial fibrillation, etc.), laboratory data (albumin, hemoglobin, sodium, potassium, etc.), and imaging data, typically consisting of CT scans, X-rays, and their associated parameters. Integrating clinical and imaging data is pivotal in precision medicine and large-scale research programs, enabling a comprehensive understanding of disease patterns and facilitating targeted and effective interventions (59, 60). The meta-analysis encompassed 25 prediction models, showing commendable sensitivity and specificity, with an area under the curve (AUC) of 0.74 (0.64–0.83) and 0.86 (0.76–0.92), respectively. Furthermore, the Fagan plot demonstrated commendable positive post-test probability (56%) and negative post-test probability (7%). This indicates that when the AI model provided a positive prediction, the probability of death increased from the pre-test probability of 20 to 56%. Conversely, negative predictions reduced the mortality rate by 7%. This substantial difference underscores the potential utility of AI models in identifying high-risk patients who may require more intensive care or intervention as well as their effectiveness in identifying patients with a lower risk of death. Overall, the results suggest that the AI prediction models hold promise for predicting severe COVID-19 mortality rates.
However, 25 studies included in our analysis exhibited significant heterogeneity. To explore the sources of heterogeneity, we conducted sensitivity and subgroup analyses. The overall results showed that despite Khan et al. (41) having a significantly larger sample size than the others, the exclusion of this study did not result in a significant change in the diagnostic odds ratio value and its heterogeneity. This suggests that an imbalance in the dataset was not the primary source of heterogeneity. We also conducted a sensitivity analysis of different subgroups of predictive factors. We found that, in models based on radiological data, the exclusion of the study by Chrzan et al. (35) resulted in a substantial decrease in I2 to 2.7% and an increase in the DOR value. This could be attributed to the unique nature of the predictive data used in this study, which were derived from High-Resolution Computed Tomography (HRCT) and its specific parameters such as absolute inflammation volume and absolute consolidation volume (ACV), as opposed to conventional CT scans or chest X-rays. We conjecture that HRCT, as a relatively novel diagnostic instrument, may not be universally applicable to all patient populations. This potential limitation could contribute to the observed decrease in the DOR value.
Additionally, we conducted subgroup analyses based on different model types, income levels, types of study designs, and ICU states. Our results indicate that studies employing deep learning, originating from high-income economies, or involving patients exclusively in the ICU, often exhibit higher specificity. A plausible explanation for this could be the urgent need for ICU patients and those in high-income economies to avoid death, which might cause the models to lean more toward predicting a higher risk of mortality. This could potentially enhance the model’s ability to correctly identify true-negative cases, thereby increasing specificity. However, it is important to note that although this might improve the model’s performance in an ICU setting, it may not necessarily work in other contexts. Furthermore, our findings suggest that studies employing deep learning models demonstrate higher specificity. This can be attributed to the inherent capabilities of deep learning models, which are adept at capturing complex nonlinear relationships in high-dimensional data. This allows them to discern subtle patterns that may be overlooked by traditional statistical models, thereby enhancing their ability to correctly identify true-negative cases, and consequently, increasing their specificity. However, it is important to note that although deep learning models can offer improved performance, their effectiveness is heavily dependent on the quality and diversity of the training data. Therefore, future studies should focus on ensuring the collection of comprehensive, high-quality datasets that capture a wide range of patient characteristics and clinical scenarios. Moreover, given the black-box nature of deep learning models, efforts should be made to improve their interpretability (61).
This study had limitations. First, the sample size of the included studies was relatively small, and only English literature was considered, potentially introducing language and publication biases. The exclusion of literature in other languages, including German, Japanese, and Korean, may have influenced the findings. Second, the funnel plot analysis revealed an asymmetric funnel distribution, suggesting the presence of publication bias. This bias could affect the overall interpretation of the results and the generalizability of the findings. Furthermore, the included studies exhibited high heterogeneity, which could affect the accurate assessment of the overall model performance and limit reliable inferences for specific subgroups. Variations in study design, patient characteristics, and data sources may have contributed to heterogeneity.
Although AI demonstrates promising outcomes in predicting severe COVID-19 mortality, it has ample scope for improvement. Continued research and development are necessary to enhance the sensitivity and specificity of prediction models. Moreover, AI applications of artificial intelligence extend beyond predicting COVID-19 prognoses. They are increasingly employed in diagnosing, screening, and managing other diseases, aligning with the objectives of tertiary prevention strategies. To promote the integration of AI and hospital digitalization, conducting high-quality, large-scale, multicenter studies is imperative. These studies advance the field of AI in healthcare and foster its effective implementation.
In summary, while artificial intelligence has shown promise in predicting severe mortality rates in COVID-19, the suitability of different models varies for specific populations, and there is still room for improvement in their predictive performance. In addition, The full applicability of these models in clinical practice remains uncertain. Therefore, ongoing research and development efforts are necessary to enhance the performance of these models. The application of AI extends beyond COVID-19; it is being utilized in diagnosing, screening, and managing other diseases, aligning with the objectives of tertiary prevention strategies. Therefore, conducting high-quality, large-scale, multicenter studies is imperative for advancing the field of AI in healthcare and ensuring its effective implementation.
The original contributions presented in the study are included in the article/supplementary material, further inquiries can be directed to the corresponding authors.
CQ: Conceptualization, Data curation, Formal analysis, Investigation, Methodology, Resources, Software, Visualization, Writing – original draft. HM: Data curation, Formal analysis, Investigation, Resources, Software, Supervision, Writing – original draft. MH: Conceptualization, Methodology, Supervision, Validation, Visualization, Writing – original draft. XX: Conceptualization, Funding acquisition, Methodology, Project administration, Writing – review & editing. CJ: Conceptualization, Formal analysis, Funding acquisition, Methodology, Project administration, Visualization, Writing – original draft, Writing – review & editing.
The author(s) declare financial support was received for the research, authorship, and/or publication of this article. This work was supported by the Department of Science and Technology of Zhejiang Province (No. 2023C25012), the People’s Republic of China.
The authors declare that the research was conducted in the absence of any commercial or financial relationships that could be construed as a potential conflict of interest.
All claims expressed in this article are solely those of the authors and do not necessarily represent those of their affiliated organizations, or those of the publisher, the editors and the reviewers. Any product that may be evaluated in this article, or claim that may be made by its manufacturer, is not guaranteed or endorsed by the publisher.
1. Shankar, A, Saini, D, Roy, S, Mosavi Jarrahi, A, Chakraborty, A, Bharti, SJ, et al. Cancer care delivery challenges amidst coronavirus disease −19 (COVID-19) outbreak: specific precautions for cancer patients and cancer care providers to prevent spread. Asian Pac J Cancer Prev. (2020) 21:569–73. doi: 10.31557/APJCP.2020.21.3.569
2. WHO. Number of COVID-19 cases reported to WHO.World Health Organization (2023). Available at: https://covid19.who.int
3. Chan, JF-W, Yuan, S, Kok, KH, To, KKW, Chu, H, Yang, J, et al. A familial cluster of pneumonia associated with the 2019 novel coronavirus indicating person-to-person transmission: a study of a family cluster. Lancet. (2020) 395:514–23. doi: 10.1016/S0140-6736(20)30154-9
4. Parodi, SM, and Liu, VX. From containment to mitigation of COVID-19 in the US. JAMA. (2020) 323:1441–2. doi: 10.1001/jama.2020.3882
5. Bernal, JL, Andrews, N, Gower, C, Stowe, J, Robertson, C, Tessier, E, et al. Early effectiveness of COVID-19 vaccination with BNT162b2 mRNA vaccine and ChAdOx1 adenovirus vector vaccine on symptomatic disease, hospitalisations and mortality in older adults in England. MedRxiv. (2021). 373:n1088. doi: 10.1101/2021.03.01.21252652
6. Chaudhary, V, Royal, A, Chavali, M, and Yadav, SK. Advancements in research and development to combat COVID-19 using nanotechnology. Nanotechnol Environ Eng. (2021) 6:8. doi: 10.1007/s41204-021-00102-7
7. Shao, W, Zhang, W, Fang, X, Yu, D, and Wang, X. Challenges of SARS-CoV-2 omicron variant and appropriate countermeasures. J Microbiol Immunol Infect. (2022) 55:387–94. doi: 10.1016/j.jmii.2022.03.007
8. Cheng, MY, Hsih, WH, Ho, MW, Lai, YC, Liao, WC, Chen, CY, et al. Younger adults with mild-to-moderate COVID-19 exhibited more prevalent olfactory dysfunction in Taiwan. J Microbiol Immunol Infect. (2021) 54:794–800. doi: 10.1016/j.jmii.2021.01.006
9. Lai, CC, Liu, YH, Wang, CY, Wang, YH, Hsueh, SC, Yen, MY, et al. Asymptomatic carrier state, acute respiratory disease, and pneumonia due to severe acute respiratory syndrome coronavirus 2 (SARS-CoV-2): facts and myths. J Microbiol Immunol Infect. (2020) 53:404–12. doi: 10.1016/j.jmii.2020.02.012
10. Zhang, H, Zhang, Y, Wu, J, Li, Y, Zhou, X, Li, X, et al. Risks and features of secondary infections in severe and critical ill COVID-19 patients. Emerg Microbes Infect. (2020) 9:1958–64. doi: 10.1080/22221751.2020.1812437
11. Herrera-Esposito, D. Age-specific rate of severe and critical SARS-CoV-2 infections estimated with multi-country seroprevalence studies. BMC Infect Dis. (2022) 22:311. doi: 10.1186/s12879-022-07262-0 G. de los Campos
12. Yang, K, Wen, G, Wang, J, Zhou, S, da, W, Meng, Y, et al. Complication and sequelae of COVID-19: what should we pay attention to in the post-epidemic era. Front Immunol. (2021) 12:711741. doi: 10.3389/fimmu.2021.711741
13. Yan, J, Lai, Y, Xu, Y, Zheng, Y, Niu, Z, and Tan, T. Editorial: artificial intelligence-based medical image automatic diagnosis and prognosis prediction. Front Phys. (2023) 11:1210010. doi: 10.3389/fphy.2023.1210010
14. Rajpurkar, P, Chen, E, Banerjee, O, and Topol, EJ. AI in health and medicine. Nat Med. (2022) 28:31–8. doi: 10.1038/s41591-021-01614-0
15. Deo, RC. Machine learning in medicine. Circulation. (2015) 132:1920–30. doi: 10.1161/CIRCULATIONAHA.115.001593
16. Topol, EJ. High-performance medicine: the convergence of human and artificial intelligence. Nat Med. (2019) 25:44–56. doi: 10.1038/s41591-018-0300-7
17. Zhang, B, Shi, H, and Wang, H. Machine learning and AI in cancer prognosis, prediction, and treatment selection: a critical approach. J Multidiscip Healthc. (2023) 16:1779–91. doi: 10.2147/JMDH.S410301
18. Gage, A, Brunson, K, Morris, K, Wallen, SL, Dhau, J, Gohel, H, et al. Perspectives of manipulative and high-performance nanosystems to manage consequences of emerging new severe acute respiratory syndrome coronavirus 2 variants. Front Nanotechnol. (2021) 3:700888. doi: 10.3389/fnano.2021.700888
19. Kaushik, A. Manipulative magnetic nanomedicine: the future of COVID-19 pandemic/endemic therapy. Expert Opin Drug Deliv. (2021) 18:531–4. doi: 10.1080/17425247.2021.1860938
20. Singh, CK, and Sodhi, KK. The emerging significance of nanomedicine-based approaches to fighting COVID-19 variants of concern: a perspective on the nanotechnology’s role in COVID-19 diagnosis and treatment. Front Nanotechnol. (2023) 4:1084033. doi: 10.3389/fnano.2022.1084033
21. Wu, CW, Pham, BT, Wang, JC, Wu, YK, Kuo, CY, and Hsu, YC. The COVIDTW study: clinical predictors of COVID-19 mortality and a novel AI prognostic model using chest X-ray. J Formos Med Assoc. (2023) 122:267–75. doi: 10.1016/j.jfma.2022.09.014
22. Pezoulas, VC, Liontos, A, Mylona, E, Papaloukas, C, Milionis, O, Biros, D, et al. Predicting the need for mechanical ventilation and mortality in hospitalized COVID-19 patients who received heparin. Annu Int Conf IEEE Eng Med Biol Soc. (2022) 2022:1020–3. doi: 10.1109/EMBC48229.2022.9871261
23. Yoon, JH, Jeanselme, V, Dubrawski, A, Hravnak, M, Pinsky, MR, and Clermont, G. Prediction of hypotension events with physiologic vital sign signatures in the intensive care unit. Crit Care. (2020) 24:661. doi: 10.1186/s13054-020-03379-3
24. Moher, D, Liberati, A, Tetzlaff, J, and Altman, DGThe PRISMA Group. Preferred reporting items for systematic reviews and meta-analyses: the PRISMA statement. PLoS Med. (2009) 6:e1000097. doi: 10.1371/journal.pmed.1000097
25. BANK, T.W., World Bank Country and Lending Groups.THE WORLD BANK (2023). Available at: https://datahelpdesk.worldbank.org/knowledgebase/articles/906519-world-bank-country-and-lending-groups
26. de Jong, Y, Ramspek, CL, Zoccali, C, Jager, KJ, Dekker, FW, and van Diepen, M. Appraising prediction research: a guide and meta-review on bias and applicability assessment using the Prediction model Risk Of Bias ASsessment Tool (PROBAST). Nephrology. (2021) 26:939–47. doi: 10.1111/nep.13913
27. Liu, JP. GRADE methods in traditional medicine. Integr Med Res. (2022) 11:100836. doi: 10.1016/j.imr.2022.100836
28. Walston, SL, Matsumoto, T, Miki, Y, and Ueda, D. Artificial intelligence-based model for COVID-19 prognosis incorporating chest radiographs and clinical data; a retrospective model development and validation study. Br J Radiol. (2022) 95:20220058. doi: 10.1259/bjr.20220058
29. Vagliano, I, Brinkman, S, Abu-Hanna, A, Arbous, MS, Dongelmans, DA, Elbers, PWG, et al. Can we reliably automate clinical prognostic modelling? A retrospective cohort study for ICU triage prediction of in-hospital mortality of COVID-19 patients in the Netherlands. Int J Med Inform. (2022) 160:104688. doi: 10.1016/j.ijmedinf.2022.104688
30. Puhr-Westerheide, D, Reich, J, Sabel, BO, Kunz, WG, Fabritius, MP, Reidler, P, et al. Sequential organ failure assessment outperforms quantitative chest CT imaging parameters for mortality prediction in COVID-19 ARDS. Diagnostics. (2021) 12:10. doi: 10.3390/diagnostics12010010
31. Munera, N, Garcia-Gallo, E, Gonzalez, Á, Zea, J, Fuentes, YV, Serrano, C, et al. A novel model to predict severe COVID-19 and mortality using an artificial intelligence algorithm to interpret chest radiographs and clinical variables. ERJ Open Res. (2022) 8:00010-2022. doi: 10.1183/23120541.00010-2022
32. Klén, R, Purohit, D, Gómez-Huelgas, R, Casas-Rojo, JM, Antón-Santos, JM, Núñez-Cortés, JM, et al. Development and evaluation of a machine learning-based in-hospital COVID-19 disease outcome predictor (CODOP): a multicontinental retrospective study. eLife. (2022) 11:e75985. doi: 10.7554/eLife.75985
33. Elghamrawy, SM, Hassanien, AE, and Vasilakos, AV. Genetic-based adaptive momentum estimation for predicting mortality risk factors for COVID-19 patients using deep learning. Int J Imaging Syst Technol. (2022) 32:614–28. doi: 10.1002/ima.22644
34. Di Napoli, A, Tagliente, E, Pasquini, L, Cipriano, E, Pietrantonio, F, Ortis, P, et al. 3D CT-inclusive deep-learning model to predict mortality, ICU admittance, and intubation in COVID-19 patients. J Digit Imaging. (2023) 36:603–16. doi: 10.1007/s10278-022-00734-4
35. Chrzan, R, Wojciechowska, W, Terlecki, M, Klocek, M, Rajzer, M, and Popiela, T. The role of artificial intelligence technology analysis of high-resolution computed tomography images in predicting the severity of COVID-19 pneumonia. Pol. Arch Intern Med. (2022) 132:16332. doi: 10.20452/pamw.16332
36. Cheng, J, Sollee, J, Hsieh, C, Yue, H, Vandal, N, Shanahan, J, et al. COVID-19 mortality prediction in the intensive care unit with deep learning based on longitudinal chest X-rays and clinical data. Eur Radiol. (2022) 32:4446–56. doi: 10.1007/s00330-022-08588-8
37. Chamberlin, JH, Aquino, G, Schoepf, UJ, Nance, S, Godoy, F, Carson, L, et al. An interpretable chest CT deep learning algorithm for quantification of COVID-19 lung disease and prediction of inpatient morbidity and mortality. Acad Radiol. (2022) 29:1178–88. doi: 10.1016/j.acra.2022.03.023
38. Calvillo-Batllés, P, Cerdá-Alberich, L, Fonfría-Esparcia, C, Carreres-Ortega, A, Muñoz-Núñez, CF, Trilles-Olaso, L, et al. Development of severity and mortality prediction models for covid-19 patients at emergency department including the chest x-ray. Radiologia. (2022) 64:214–27. doi: 10.1016/j.rxeng.2021.09.004
39. Wanyan, T, Vaid, A, de Freitas, JK, Somani, S, Miotto, R, Nadkarni, GN, et al. Relational learning improves prediction of mortality in COVID-19 in the intensive care unit. IEEE Trans Big Data. (2021) 7:38–44. doi: 10.1109/TBDATA.2020.3048644
40. Pezoulas, VC, Kourou, KD, Papaloukas, C, Triantafyllia, V, Lampropoulou, V, Siouti, E, et al. A multimodal approach for the risk prediction of intensive care and mortality in patients with COVID-19. Diagnostics. (2021) 12:56. doi: 10.3390/diagnostics12010056
41. Khan, IU, Aslam, N, Aljabri, M, Aljameel, SS, Kamaleldin, MMA, Alshamrani, FM, et al. Computational intelligence-based model for mortality rate prediction in COVID-19 patients. Int J Environ Res Public Health. (2021) 18:6429. doi: 10.3390/ijerph18126429
42. Jamshidi, E, Asgary, A, Tavakoli, N, Zali, A, Setareh, S, Esmaily, H, et al. Using machine learning to predict mortality for COVID-19 patients on day 0 in the ICU. Front Digit Health. (2021) 3:681608. doi: 10.3389/fdgth.2021.681608
43. Hou, W, Zhao, Z, Chen, A, Li, H, and Duong, TQ. Machining learning predicts the need for escalated care and mortality in COVID-19 patients from clinical variables. Int J Med Sci. (2021) 18:1739–45. doi: 10.7150/ijms.51235
44. Chassagnon, G, Vakalopoulou, M, Battistella, E, Christodoulidis, S, Hoang-Thi, TN, Dangeard, S, et al. AI-driven quantification, staging and outcome prediction of COVID-19 pneumonia. Med Image Anal. (2021) 67:101860. doi: 10.1016/j.media.2020.101860
45. Zhu, N, Zhang, D, Wang, W, Li, X, Yang, B, Song, J, et al. A novel coronavirus from patients with pneumonia in China, 2019. N Engl J Med. (2020) 382:727–33. doi: 10.1056/NEJMoa2001017
46. Karunasagar, I, and Karunasagar, I. Ongoing COVID-19 global crisis and scientific challenges. J Health Allied Sci NU. (2020) 10:1–2. doi: 10.1055/s-0040-1712785
47. Wu, N, Joyal-Desmarais, K, Ribeiro, PAB, Vieira, AM, Stojanovic, J, Sanuade, C, et al. Long-term effectiveness of COVID-19 vaccines against infections, hospitalisations, and mortality in adults: findings from a rapid living systematic evidence synthesis and meta-analysis up to December, 2022. Lancet Respir Med. (2023) 11:439–52. doi: 10.1016/S2213-2600(23)00015-2
48. Wu, N, Joyal-Desmarais, K, Vieira, AM, Sanuade, C, Jagwani, M, Paquet, L, et al. COVID-19 boosters versus primary series: update to a living review. Lancet Respir Med. (2023) 11:e87–8. doi: 10.1016/S2213-2600(23)00265-5
49. Feikin, DR, Higdon, MM, Abu-Raddad, LJ, Andrews, N, Araos, R, Goldberg, Y, et al. Duration of effectiveness of vaccines against SARS-CoV-2 infection and COVID-19 disease: results of a systematic review and meta-regression. Lancet. (2022) 399:924–44. doi: 10.1016/S0140-6736(22)00152-0
50. Menegale, F, Manica, M, Zardini, A, Guzzetta, G, Marziano, V, d'Andrea, V, et al. Evaluation of waning of SARS-CoV-2 vaccine-induced immunity: a systematic review and meta-analysis. JAMA Netw Open. (2023) 6:e2310650. doi: 10.1001/jamanetworkopen.2023.10650
51. Nations, U. WHO chief declares end to COVID-19 as a global health emergency. Health (2023). Available at: https://news.un.org/zh/story/2023/05/1117647
52. PHOSP-COVID Collaborative Group. Clinical characteristics with inflammation profiling of long COVID and association with 1-year recovery following hospitalisation in the UK: a prospective observational study. Lancet. Respir Med. (2022) 10:761–75. doi: 10.1016/S2213-2600(22)00127-8
53. Office for National Statistics. Prevalence of ongoing symptoms following coronavirus (COVID-19) infection in the UK: 30 March 2023. London: Office for National Statistics (2023).
54. Berlin, DA, Gulick, RM, and Martinez, FJ. Severe COVID-19. N Engl J Med. (2020) 383:2451–60. doi: 10.1056/NEJMcp2009575
55. Aktar, S, Talukder, A, Ahamad, MM, Kamal, AHM, Khan, JR, Protikuzzaman, M, et al. Machine learning approaches to identify patient comorbidities and symptoms that increased risk of mortality in COVID-19. Diagnostics. (2021) 11:1383. doi: 10.3390/diagnostics11081383
56. Hunter, DJ, and Holmes, C. Where medical statistics meets artificial intelligence. N Engl J Med. (2023) 389:1211–9. doi: 10.1056/NEJMra2212850
57. Sahni, NR, and Carrus, B. Artificial intelligence in U.S. health care delivery. N Engl J Med. (2023) 389:348–58. doi: 10.1056/NEJMra2204673
58. Whited, JD, Datta, SK, Aiello, LM, Aiello, LP, Cavallerano, JD, Conlin, PR, et al. A modeled economic analysis of a digital tele-ophthalmology system as used by three federal health care agencies for detecting proliferative diabetic retinopathy. Telemed J E Health. (2005) 11:641–51. doi: 10.1089/tmj.2005.11.641
59. Bates, DW, Saria, S, Ohno-Machado, L, Shah, A, and Escobar, G. Big data in health care: using analytics to identify and manage high-risk and high-cost patients. Health Aff. (2014) 33:1123–31. doi: 10.1377/hlthaff.2014.0041
60. Collins, FS, and Varmus, H. A new initiative on precision medicine. N Engl J Med. (2015) 372:793–5. doi: 10.1056/NEJMp1500523
Keywords: artificial intelligence, COVID-19, mortality, systematic reviews, meta-analyses
Citation: Qin C, Ma H, Hu M, Xu X and Ji C (2024) Performance of artificial intelligence in predicting the prognossis of severe COVID-19: a systematic review and meta-analysis. Front. Public Health. 12:1371852. doi: 10.3389/fpubh.2024.1371852
Edited by:
Hong Qin, University of Tennessee at Chattanooga, United StatesCopyright © 2024 Qin, Ma, Hu, Xu and Ji. This is an open-access article distributed under the terms of the Creative Commons Attribution License (CC BY). The use, distribution or reproduction in other forums is permitted, provided the original author(s) and the copyright owner(s) are credited and that the original publication in this journal is cited, in accordance with accepted academic practice. No use, distribution or reproduction is permitted which does not comply with these terms.
*Correspondence: Xiujuan Xu, emp0ZHh4akAxNjMuY29t; Conghua Ji, amNoaTIwMDVAMTI2LmNvbQ==
†These authors have contributed equally to this work and share first authorship
Disclaimer: All claims expressed in this article are solely those of the authors and do not necessarily represent those of their affiliated organizations, or those of the publisher, the editors and the reviewers. Any product that may be evaluated in this article or claim that may be made by its manufacturer is not guaranteed or endorsed by the publisher.
Research integrity at Frontiers
Learn more about the work of our research integrity team to safeguard the quality of each article we publish.