 Tianming Zhao1Philip K. Hopke1,2
 Mark J. Utell3,4
 Daniel P. Croft3Sally W. Thurston4,5
 Shao Lin6Frederick S. Ling7Yunle Chen1Catherine S. Yount1
 David Q. Rich1,3,4*
- 1Department of Public Health Sciences, University of Rochester Medical Center, Rochester, NY, United States
- 2Center for Air and Aquatic Resources Engineering and Sciences, Clarkson University, Potsdam, NY, United States
- 3Division of Pulmonary and Critical Care, Department of Medicine, University of Rochester Medical Center, Rochester, NY, United States
- 4Department of Environmental Medicine, University of Rochester Medical Center, Rochester, NY, United States
- 5Department of Biostatistics and Computational Biology, University of Rochester Medical Center, Rochester, NY, United States
- 6Department of Environmental Health, University at Albany School of Public Health, State University of New York, Rensselaer, NY, United States
- 7Division of Cardiology, Department of Medicine, University of Rochester Medical Center, Rochester, NY, United States
Background: Previous work reported increased rates of cardiovascular hospitalizations associated with increased source-specific PM2.5 concentrations in New York State, despite decreased PM2.5 concentrations. We also found increased rates of ST elevation myocardial infarction (STEMI) associated with short-term increases in concentrations of ultrafine particles and other traffic-related pollutants in the 2014–2016 period, but not during 2017–2019 in Rochester. Changes in PM2.5 composition and sources resulting from air quality policies (e.g., Tier 3 light-duty vehicles) may explain the differences. Thus, this study aimed to estimate whether rates of STEMI were associated with organic carbon and source-specific PM2.5 concentrations.
Methods: Using STEMI patients treated at the University of Rochester Medical Center, compositional and source-apportioned PM2.5 concentrations measured in Rochester, a time-stratified case-crossover design, and conditional logistic regression models, we estimated the rate of STEMI associated with increases in mean primary organic carbon (POC), secondary organic carbon (SOC), and source-specific PM2.5 concentrations on lag days 0, 0–3, and 0–6 during 2014–2019.
Results: The associations of an increased rate of STEMI with interquartile range (IQR) increases in spark-ignition emissions (GAS) and diesel (DIE) concentrations in the previous few days were not found from 2014 to 2019. However, IQR increases in GAS concentrations were associated with an increased rate of STEMI on the same day in the 2014–2016 period (Rate ratio [RR] = 1.69; 95% CI = 0.98, 2.94; 1.73 μg/m3). In addition, each IQR increase in mean SOC concentration in the previous 6 days was associated with an increased rate of STEMI, despite imprecision (RR = 1.14; 95% CI = 0.89, 1.45; 0.42 μg/m3).
Conclusion: Increased SOC concentrations may be associated with increased rates of STEMI, while there seems to be a declining trend in adverse effects of GAS on triggering of STEMI. These changes could be attributed to changes in PM2.5 composition and sources following the Tier 3 vehicle introduction.
Introduction
Ambient air pollution is a growing global public health concern (1), particularly fine particulate matter (<2.5 μm; PM2.5), which is the fifth-ranking global risk factor for mortality (2). Previous studies have demonstrated that elevations in PM2.5 concentrations increase the risk of cardiovascular events, partially attributable to the development of cardiometabolic risk factors (3–5). Further, some reported associations between increased ambient PM2.5 concentrations over the previous hours and days and the onset of myocardial infarctions (6–9). Our group and others have reported triggering of ST-elevation myocardial infarction (STEMI) by ambient pollutant concentrations (including PM2.5) in the previous few hours and days in some analyses (7, 8, 10–12), but not others (13, 14), suggesting work is needed to know what components or sources of PM may be driving any associations with STEMI.
PM2.5 is a complex mixture that includes organic compounds, elemental carbon, ions, and metal oxides, indicating PM2.5 components from various sources with different physicochemical characteristics and toxicological effects (15). Rich et al. observed larger odds of myocardial infarction associated with increased mass fractions of sulfate, nitrate, and ammonium and a lower elemental carbon mass fraction (16). Some reported an increased risk of cardiovascular admissions and mortality associated with short-term increases in elemental carbon and organic carbon concentrations (17–19), especially ischemic heart disease admissions (18). Our prior studies (13, 14) revealed increased STEMI rates associated with increases in ultrafine particles and black carbon concentrations in the previous hour. Thus, short-term changes in the concentration of specific PM components may trigger cardiovascular events including STEMI.
Organic carbon is classified as either primary organic carbon (POC) or secondary organic carbon (SOC), based on whether the constituent organic matter is generated from other compounds released into the atmosphere. POC is produced mostly from combustion processes, whereas SOC is formed through the oxidation of volatile organic compounds (VOCs) (20) and contains reactive oxygen species (10, 21, 22) that may induce oxidative stress and systemic inflammation, contributing to acute cardiovascular events (23, 24). To our knowledge, this work is the first epidemiological study to examine triggering of STEMI by short-term increases in SOC and POC concentrations.
PM2.5 sources emit particles with specific chemical characteristics that allow the identification and apportionment of PM to these sources. Previously, we employed source apportionment analyses to examine whether individual PM2.5 sources were associated with acute cardiovascular hospitalizations (25) and hospitalizations and emergency department (ED) visits for respiratory infections (26) and diseases (27) in adults across New York State from 2005 to 2016. Positive matrix factorization (PMF) was used to estimate the mass concentrations of particles corresponding to specific pollution sources at six urban sites (Buffalo, Rochester, Albany, Bronx, Manhattan, and Queens) in New York (28). There were 12 PM2.5 sources identified, including secondary sulfate (SS), secondary nitrate (SN), biomass burning (BB), diesel (DIE), spark-ignition emissions (GAS), pyrolyzed organic rich (OP), road dust (RD), aged sea salt (AGS), fresh sea salt (FSS), residual oil (RO), road salt (RS), and industrial (IND). Rich et al. reported that interquartile range (IQR) increases in GAS concentrations were associated with increased rates of hospitalization for cardiac arrhythmia and ischemic stroke on the same day, while IQR elevations in DIE concentrations were associated with elevated rates of hospitalization due to congestive heart failure and ischemic heart disease on the same day (25). Increased acute cardiovascular hospitalization rates were also associated with increased concentrations of RD, RO, and SN over the previous 1, 4, and 7 days.
Over the last decade, air quality in New York State has changed resulting from the reduction in sulfur concentrations in fuels, the closure of upwind coal-fired power plants, the energy transition from coal to natural gas, emissions controls on heavy-duty diesel vehicles, the Cross-State Air Pollution Rule, and the phase-out of residual oil for space heating in New York City. Furthermore, economic factors including the 2008 recession and the shift in the cost of natural gas relative to coal and oil, drove changes in electricity-generating unit technologies as well as air quality (29, 30). These changes resulted in substantial decreases in PM2.5 concentrations across New York State from 2005 to 2019 (29, 30), but compositional particle changes also occurred. We found that SS and SN concentrations decreased across New York State during 2005–2019, while GAS concentrations increased over this period (31, 32). We also observed decreased POC concentrations between 2005 and 2016, and an increase in SOC concentrations during 2014–2016 after a decline in the early years of the 2005–2013 period (28). In 2017, new regulations for Tier 3 light-duty vehicles began in New York State to improve emissions, and specifically to have lower SOC formation. These Tier 3 emission controls were only included in vehicles starting in 2017 and are not mandated for all vehicles until 2025. Any resulting reduction in emissions from these vehicles provided an opportunity to explore if the associations between the rates of STEMI and PM2.5 components and sources changed after their introduction in 2017 (i.e., early implementation period).
Using a dataset of patients whose STEMI was treated at the University of Rochester Medical Center (URMC) and ambient air pollutant concentrations from the monitoring station in Rochester from 2014 to 2019, we hypothesized that increases in concentrations of PM2.5 from motor vehicle and diesel sources (i.e., GAS and DIE) as well as SOC would be associated with an increased rate of STEMI. We also explored whether the introduction of Tier 3 light-duty vehicles from 2017 to 2019 (early Tier 3 implementation period) would lead to a reduced rate of STEMI associated with these specific PM2.5 sources/components, compared to the 2014–2016 period.
Methods
Study Population and Outcome Assessment: This study included STEMI patients treated at the Cardiac Catheterization Laboratory (Cath Lab) at URMC in Rochester, New York from January 1, 2014 to December 31, 2019, who lived within 15 miles of the pollution monitoring site in Rochester. According to the American College of Cardiology (ACC)/American Heart Association (AHA) guidelines, a STEMI was defined as a myocardial infarction with an ST-segment elevation of >1 mm in two or more contiguous precordial leads, two or more adjacent limb leads, or a new or presumed new left bundle branch block in the presence of angina or angina equivalent on the presenting electrocardiogram (33). All STEMI events were diagnosed at the time of admission, with symptom onset date and time self-reported by each patient. If patients were unable to communicate, we obtained the information from their relatives. In terms of patients who experienced multiple STEMIs during the study period, if the subsequent STEMI event occurred ≥72 h after the previous one, it was counted as an additional event. In addition, demographic and clinical characteristics of patients were obtained from medical history and chart review. This study was approved by the University of Rochester Medical Center Research Subjects Review Board.
Air Pollution and Meteorology Measurements: PM2.5 compositional data was obtained from the U.S. Environmental Protection Agency (EPA) Chemical Speciation Network.1 Daily samples were collected and analyzed every third day in Rochester, and organic carbon, including primary organic carbon (POC) and secondary organic carbon (SOC), was measured using thermo-optical analysis. More details of the sampling methods, analytical protocols, and quality assurance and control were described previously (34). PM2.5 sources were identified using EPA positive matrix factorization (PMF) version 5, with further information on these analyses provided previously (28, 32). Eight PM2.5 sources identified in Rochester were used in this study, including secondary sulfate (SS), secondary nitrate (SN), spark-ignition emissions (GAS), diesel (DIE), road dust (RD), biomass burning (BB), pyrolyzed organic rich (OP), and road salt (RS). Daily ambient temperature and relative humidity in Rochester were measured at the Rochester International Airport and obtained from the National Weather Service (National Climate Data Center).2
Study Design and Statistical Analyses: We used a modified time-stratified case-crossover study design to estimate the rate of STEMI associated with each interquartile range increase in SOC, POC, and source-specific PM2.5 concentration in the previous 1, 3, and 6 days. For each STEMI, the standard time-stratified design (35, 36) would include the day of STEMI symptom onset as the case day (e.g., Wednesday July 12, 2023), and then use all of the same weekdays in the same calendar month (i.e., Wednesdays July 5, 19, and 26, 2023) as control days. All case and control days would be 7 days apart, and air pollutant concentrations (e.g., PM2.5 available for every day of the study period) would then be matched to each case and control day in the dataset for analysis. This time-stratified case-crossover design controls for non-time-varying potential confounders such as underlying medical conditions, long-term time trends, season, and weekday by design. Thus, we would not need to control for weekday in our conditional logistic regression models since each case and control day have the same value of weekday.
However, for our SOC, POC, and source-specific PM2.5 data (32) which were only available every 3rd day, there would be very few complete sets of case and control days for analysis using this standard time-stratified design (where case and referent days are 7 days apart). Therefore, we used a modified time-stratified design, where the day of STEMI symptom onset was again the case day (e.g., Wednesday July 12, 2023), but control days were now all the 6 days intervals before and after the case day within the same calendar month (e.g., Thursday July 6, 2023; Tuesday July 18, 2023; Monday July 24, 2023; Sunday July 30, 2023). Non-time varying potential confounders, such as underlying medical conditions, long-term time trends, and season, are still controlled by design. However, weekday is not, since case and referent days are no longer the same weekday. Further, air pollutant concentrations vary by weekday (28), and weekday has been included in acute health effect studies of air pollution and cardiorespiratory health events as a potential confounder (37–39). Therefore, using a conditional logistic regression model, stratified by each case–control set, we regressed case–control status (i.e., case = 1; control = 0) against the mean SOC concentration on lag day 0, adjusting for the mean residual PM2.5 concentration (i.e., residual PM2.5 = PM2.5–SOC; to control for potential confounding by non-SOC PM2.5), weekday, holidays, temperature (natural spline with 4 degrees of freed(39)om [df]), and relative humidity (linear term) on the same case and control days. We also separately re-ran this set of models for the mean SOC concentration on lag days 0–3 and 0–6. We then re-ran this set of model analyses for POC (including residual PM2.5 = PM2.5–POC) and each PM2.5 source in the same manner (residual PM2.5 = PM2.5–source-specific PM2.5 concentration [e.g., PM2.5–GAS]). For each model, we estimated the rate of STEMI associated with each interquartile range (IQR) increase in the specific pollutant concentration, and its 95% confidence interval (CI).
Next, we examined whether the rates of STEMI associated with each IQR increase in POC, SOC, and each PM2.5 source concentration differed between the 2014–2016 and 2017–2019 periods by adding an interaction term (e.g., SOC * 2017–2019_Period) to the model. Since we examined three lag times for each pollutant, statistical significance was defined as p < 0.017 (0.05/3). All data management and analyses were performed using SAS version 9.4 (©SAS Institute Inc., Cary, NC) and R version 4.2.3.
Results
The demographic characteristics of the 186 patients with 188 STEMI events during the study period are provided in Table 1. The majority of these subjects were male (72.3%), white (83.4%), and non-Hispanic (94.7%) with a mean age of 62.8 years (standard deviation [SD]: 10.8 years). Compared to the 2014–2016 period, STEMI patients in the 2017–2019 period were older (64.4 ± 13.0 vs. 60.6 ± 10.8 years) and more likely to be smokers (45.0% vs. 35.5%). They were also less likely to be male (69.6% vs. 76.3%). More subjects had Medicare (28.2% vs. 4.3%) and Medicaid (10.9% vs. 4.3%) in the 2017–2019 period than those in the 2014–2016 period. Furthermore, a prior history of myocardial infarction and hypertension was more prevalent, and diabetes and dyslipidemia were less common among the participants in the 2017–2019 period relative to the 2014–2016 period. Participants in the 2017–2019 period stayed in the hospital for 4.2 days on average (SD = 4.3 days), shorter than the 2014–2016 period (Mean ± SD: 5.2 ± 12.5 days).
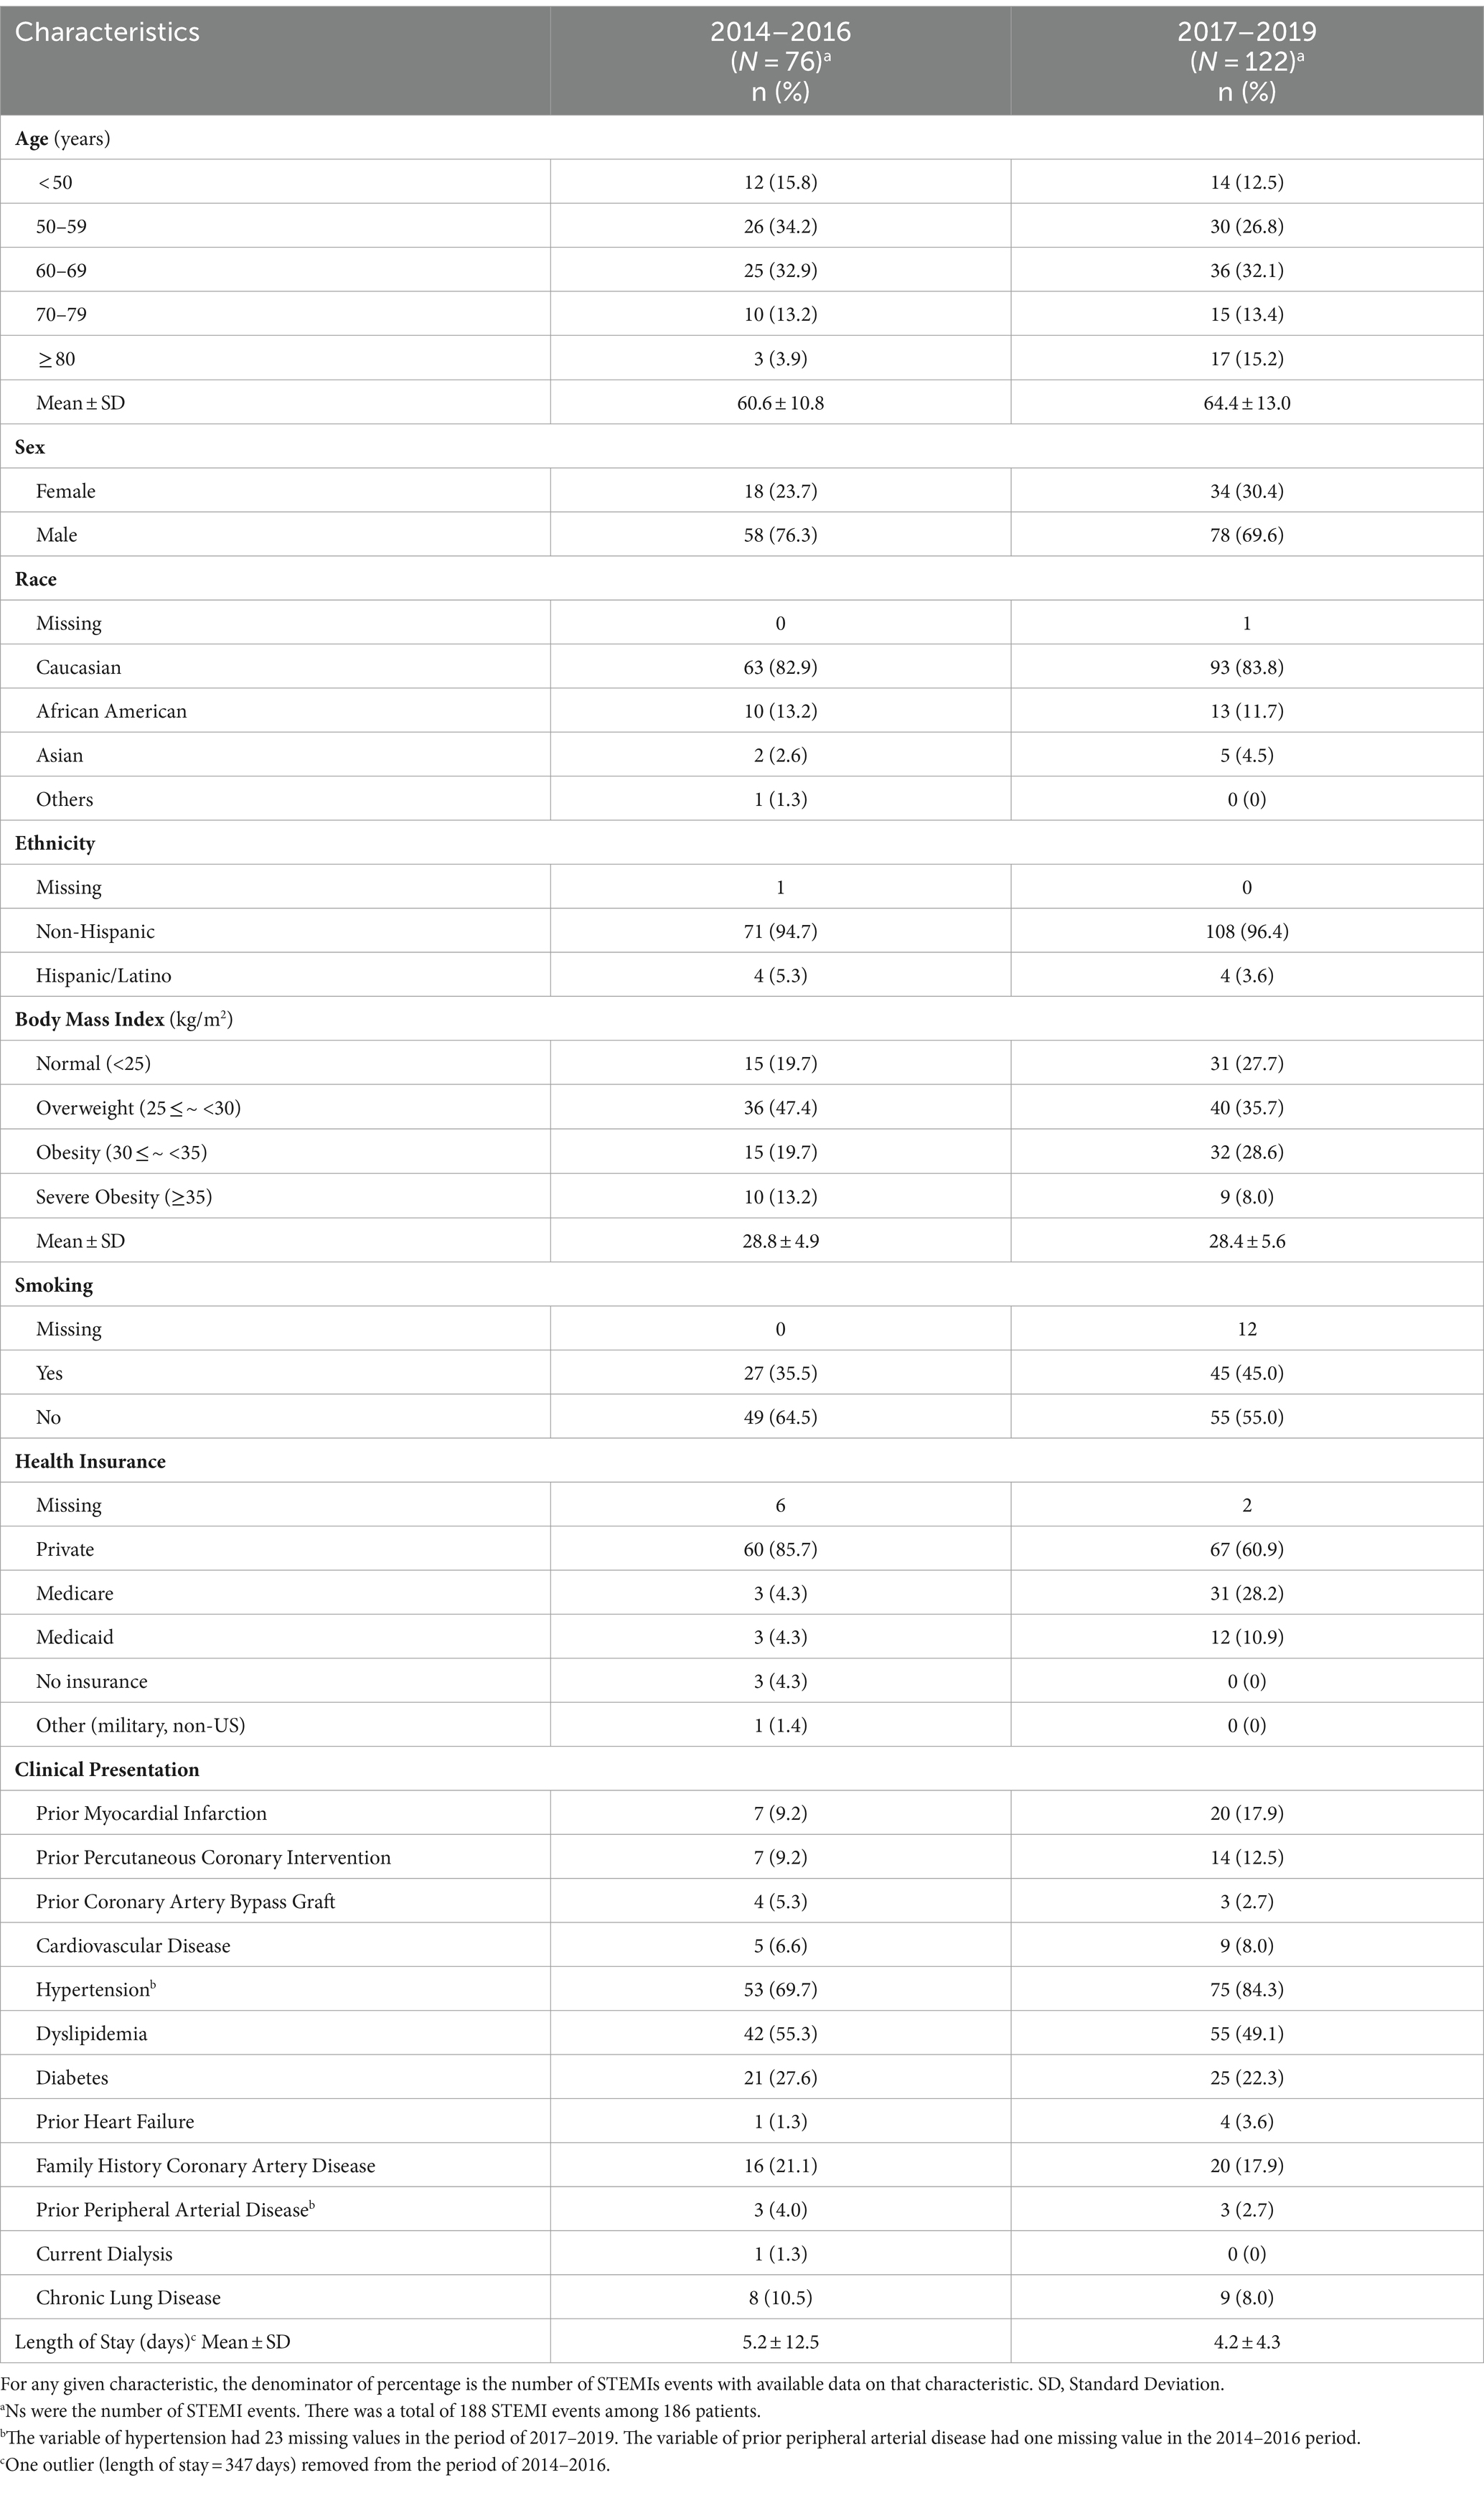
Table 1. Characteristics of STEMI patients by period.
Daily concentrations of POC, SOC, and PM2.5 sources are summarized in Table 2. From the 2014–2016 period to the 2017–2019 period, the median concentration of POC and SOC increased by 34.4% (2014–2016: 0.32 μg/m3; 2017–2019: 0.43 μg/m3) and 41.8% (2014–2016: 0.55 μg/m3; 2017–2019: 0.78 μg/m3), respectively. In terms of PM2.5 sources, there were substantial increases in median concentrations of SN (100%; 2014–2016: 0.15 μg/m3; 2017–2019: 0.30 μg/m3), GAS (125%; 2014–2016: 0.96 μg/m3; 2017–2019: 2.16 μg/m3), and OP (71.4%; 2014–2016: 0.21 μg/m3; 2017–2019: 0.36 μg/m3). There were large decreases in median concentrations of SS (48%; 2014–2016: 1.13 μg/m3; 2017–2019: 0.59 μg/m3) and BB (59%; 2014–2016: 0.44 μg/m3; 2017–2019: 0.18 μg/m3), but little to no change in PM2.5, DIE, RD, and RS concentrations. SOC was moderately correlated with PM2.5 (r = 0.53) and POC (r = 0.51; Table 3), while SS was moderately correlated with PM2.5 (r = 0.64) and OP (r = 0.58). SN was negatively correlated with temperature (r = −0.55). DIE was positively correlated with RD (r = 0.14) and OP (r = 0.03), but negatively correlated with other PM2.5 sources (SS: r = −0.14; SN: r = −0.06; GAS: r = −0.12; BB: r = −0.23; RS: −0.14), although these correlations were weak.
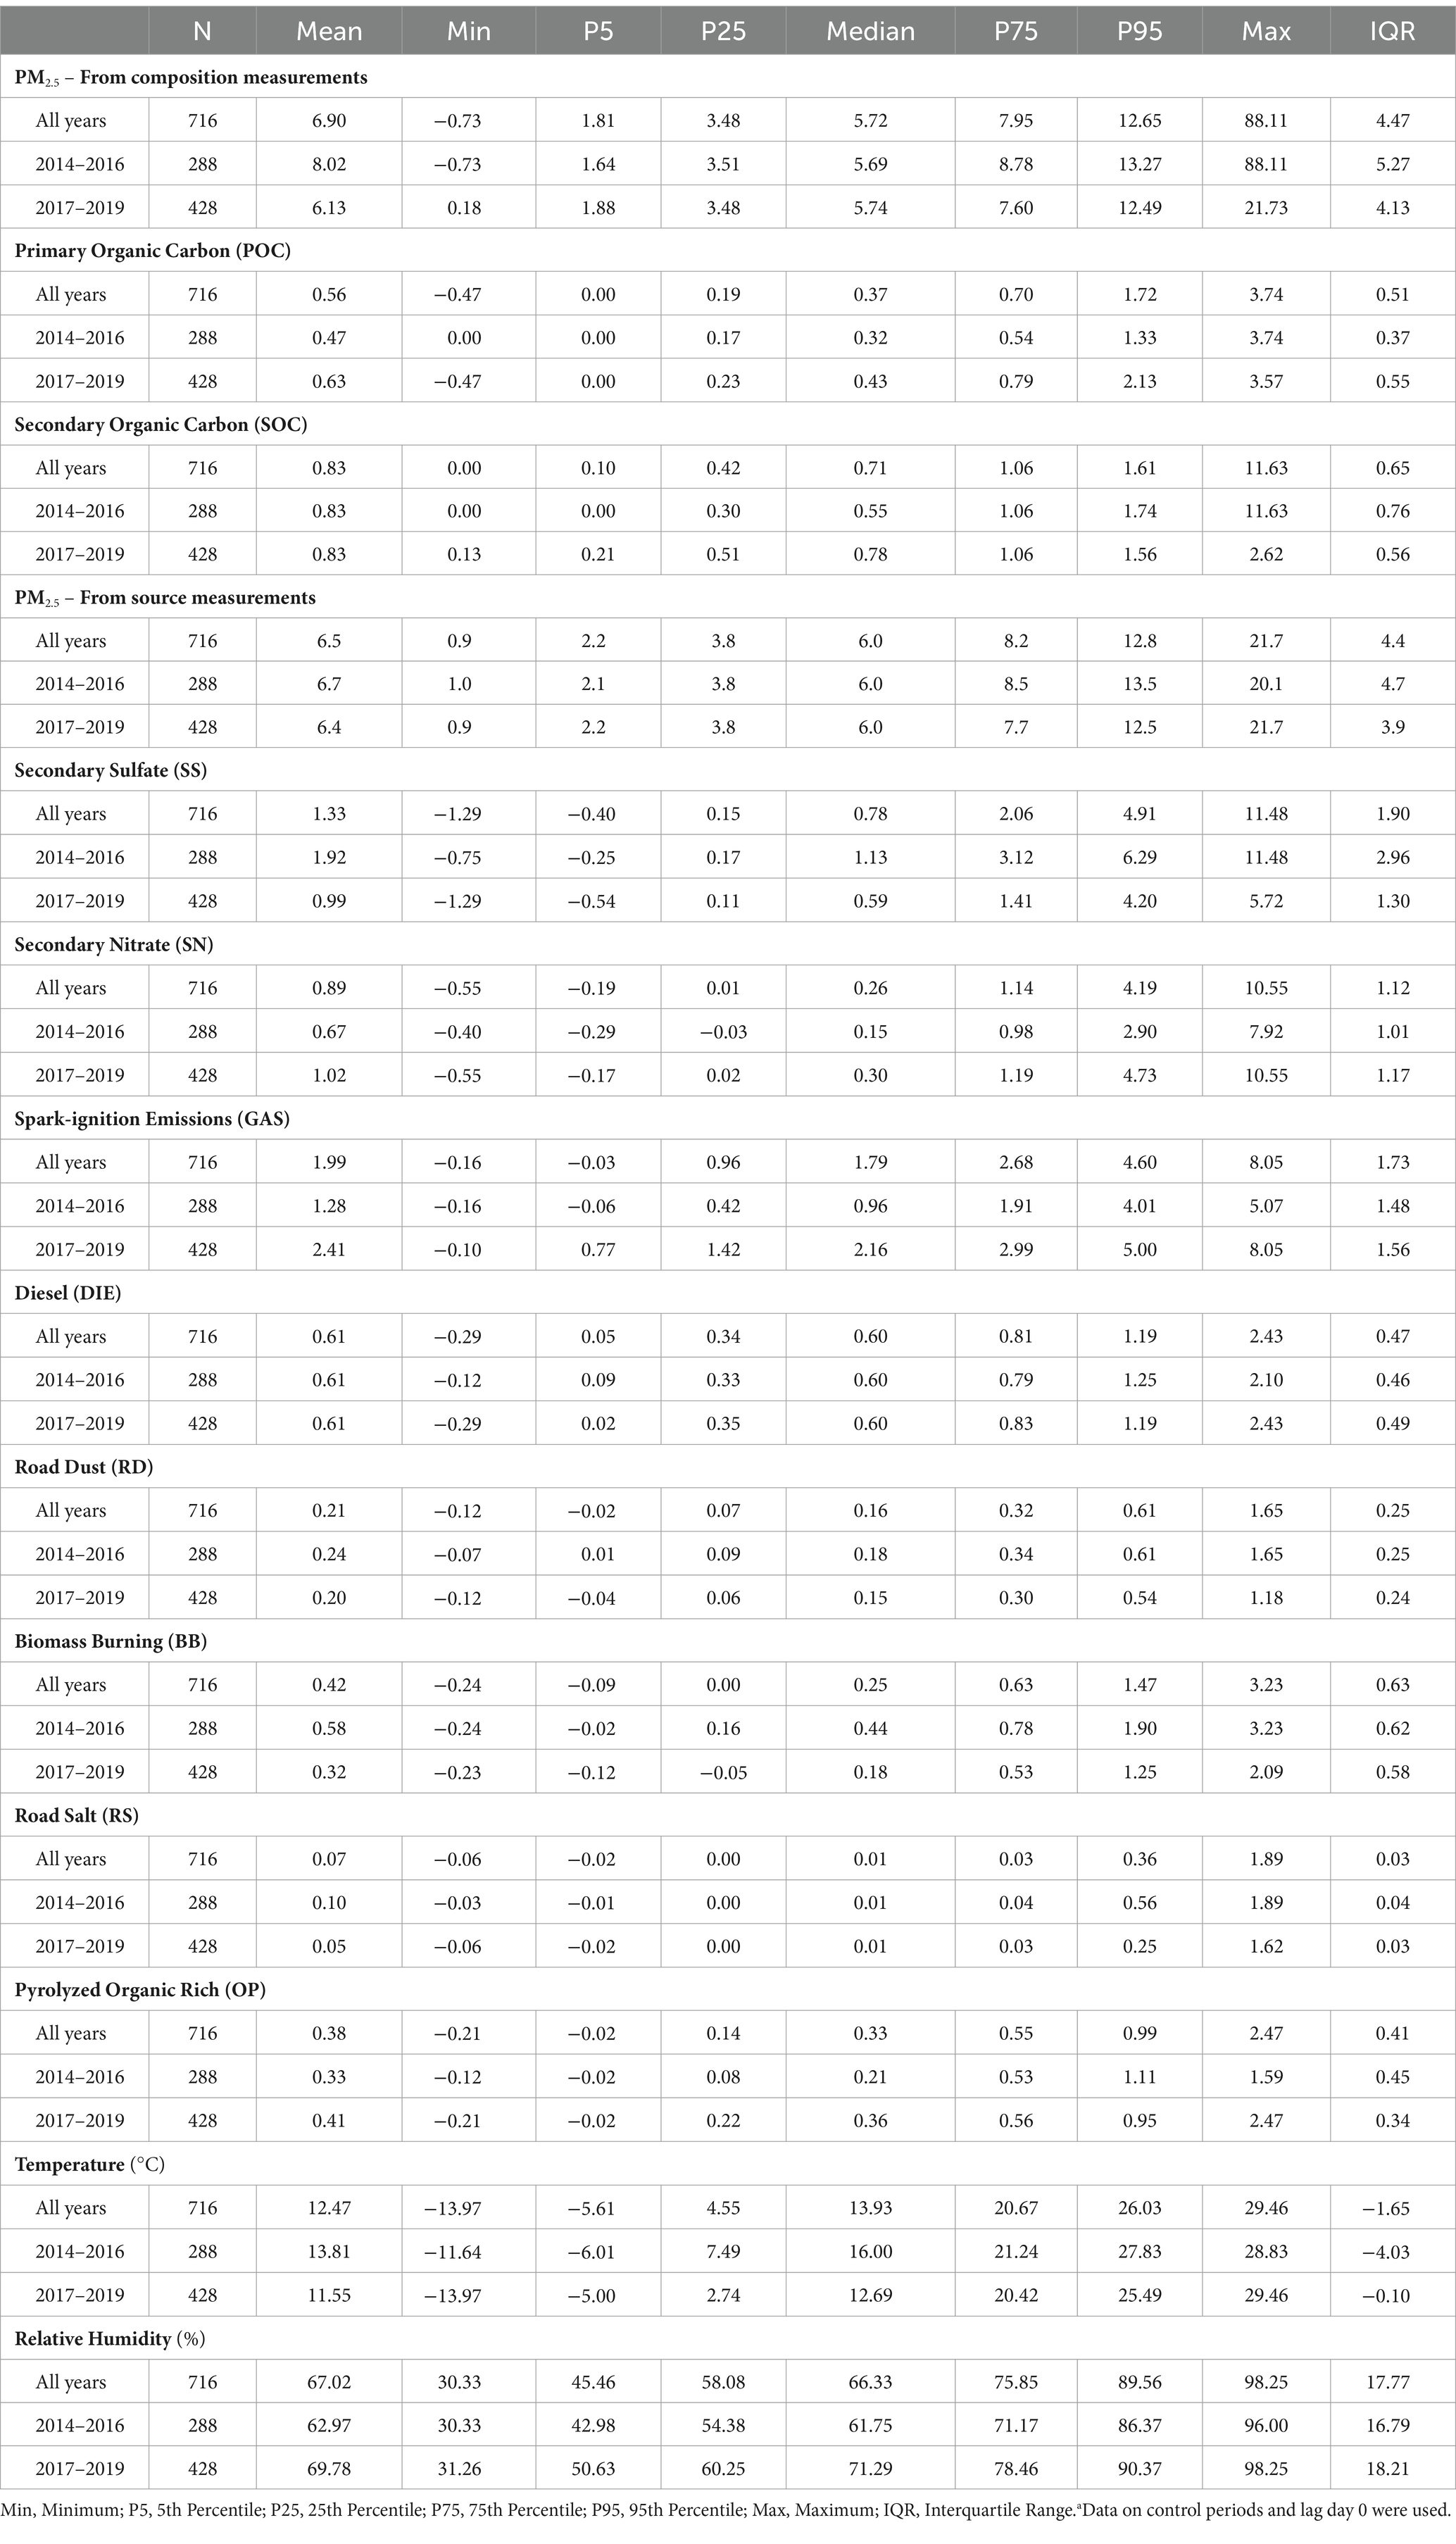
Table 2. Distribution of daily concentrations (μg/m3) of organic carbon and PM2.5 sources and weather characteristics by perioda.
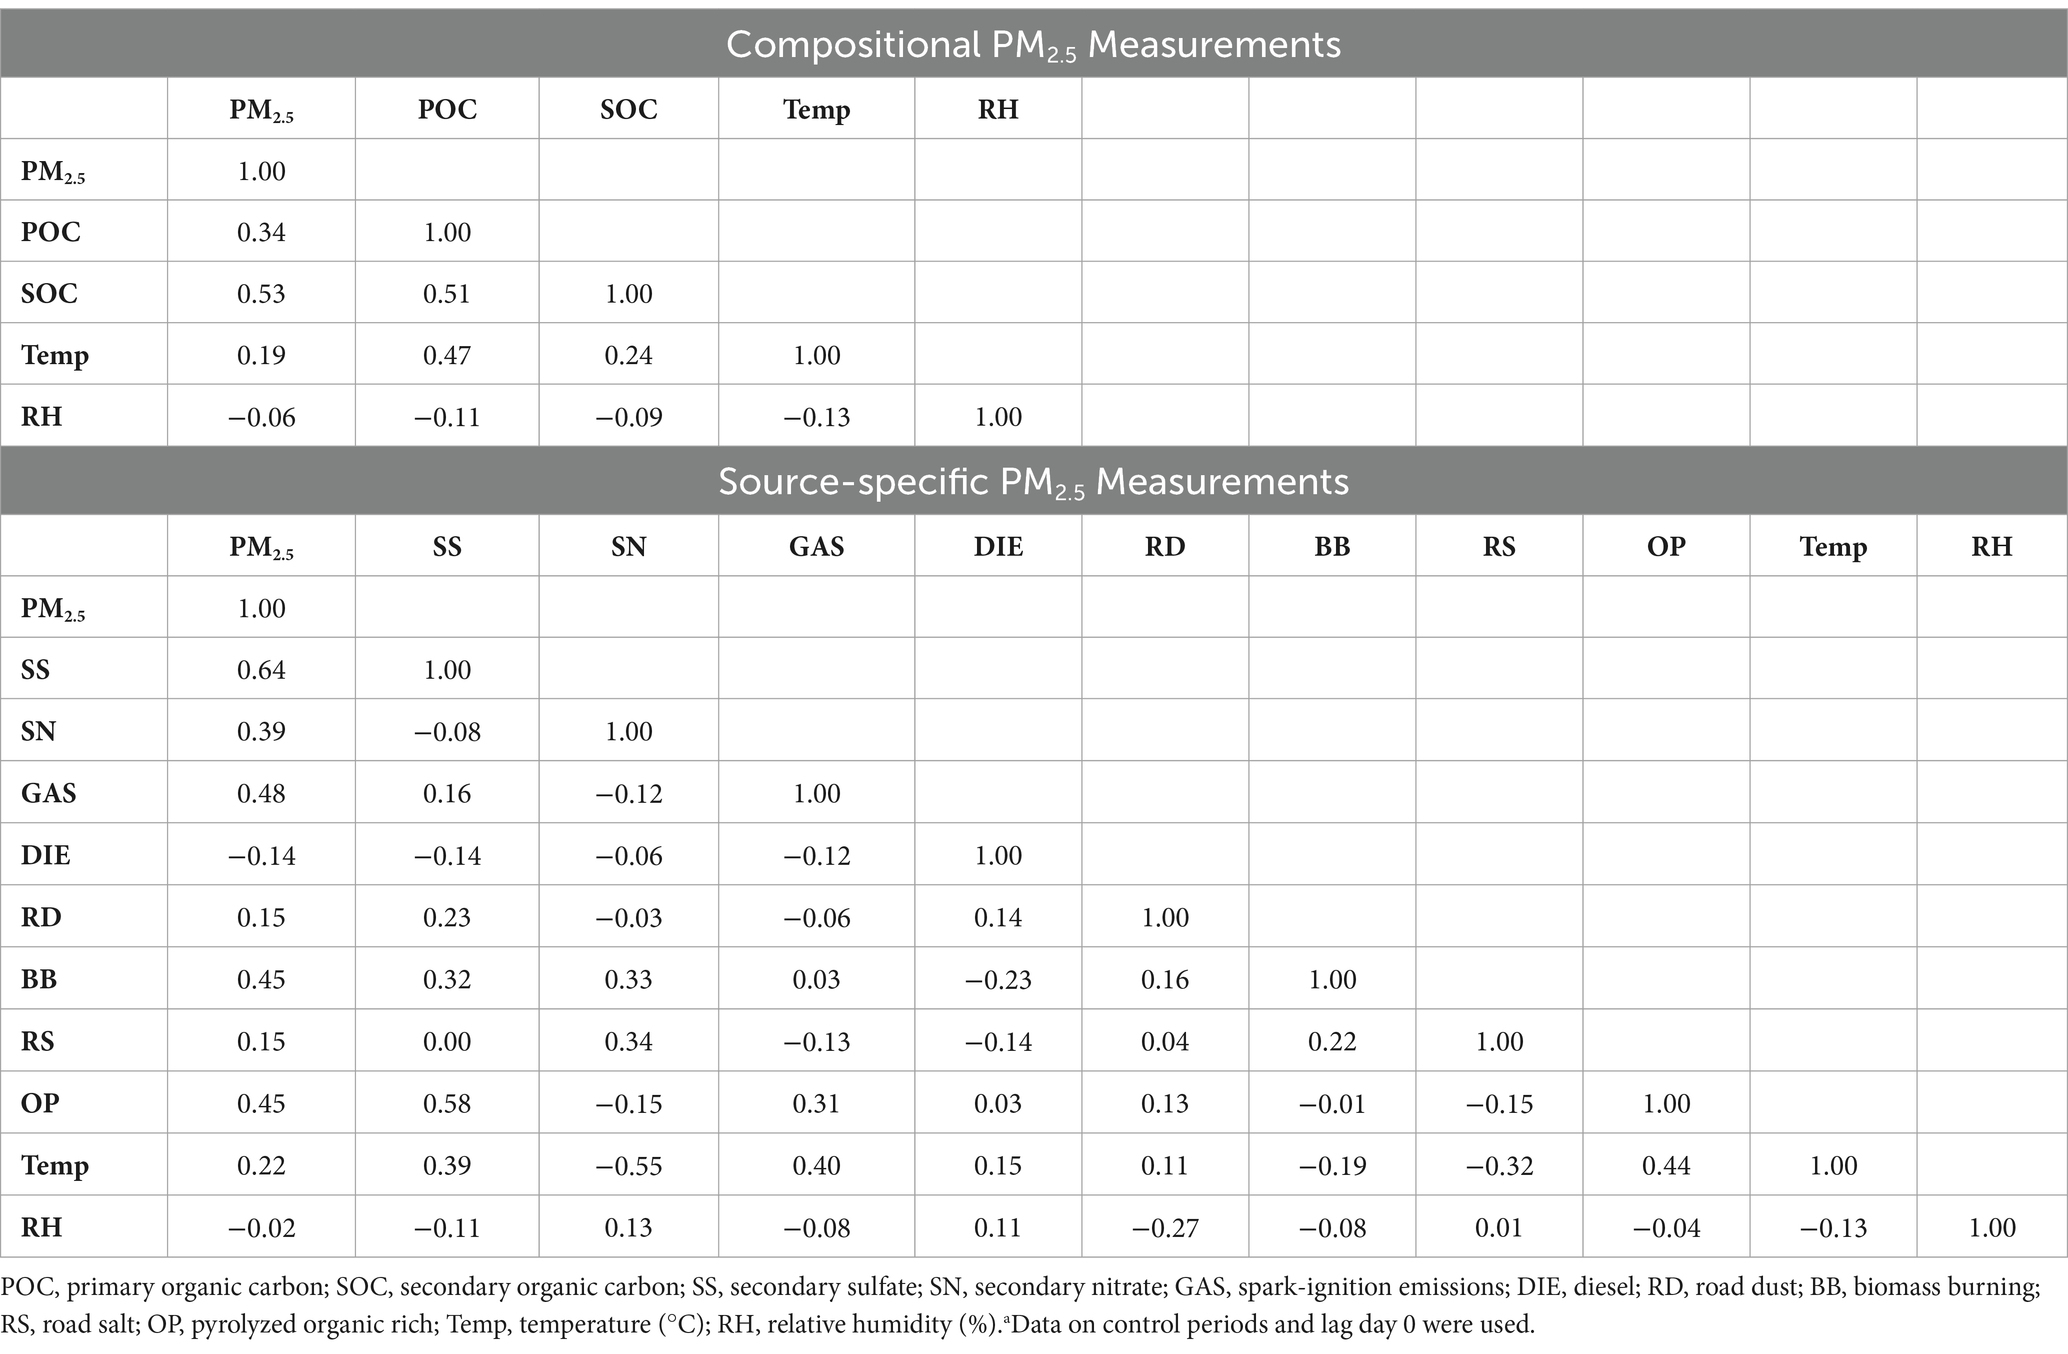
Table 3. Pearson correlation coefficients between daily pollutant concentrations (μg/m3) and weather measurements during 2014–2019a.
Inconsistent with our a priori hypothesis, interquartile range (IQR) increases in mean SOC concentrations on the same day, and previous 3 and 6 days, were not associated with increased rates of STEMI (Table 4). However, each IQR increase in mean SOC concentration in the previous 6 days was associated with an imprecise, but suggestive 14% increased rate of STEMI (Rate ratio [RR] = 1.14; 95% CI = 0.89, 1.45). Similarly, inconsistent with our a priori hypotheses, IQR increases in GAS and DIE on the same day, and previous 3 and 6 days, were not associated with increased rates of STEMI. There were no increased rates of STEMI associated with POC or any other source specific PM2.5 concentration at any lag time (Table 4).
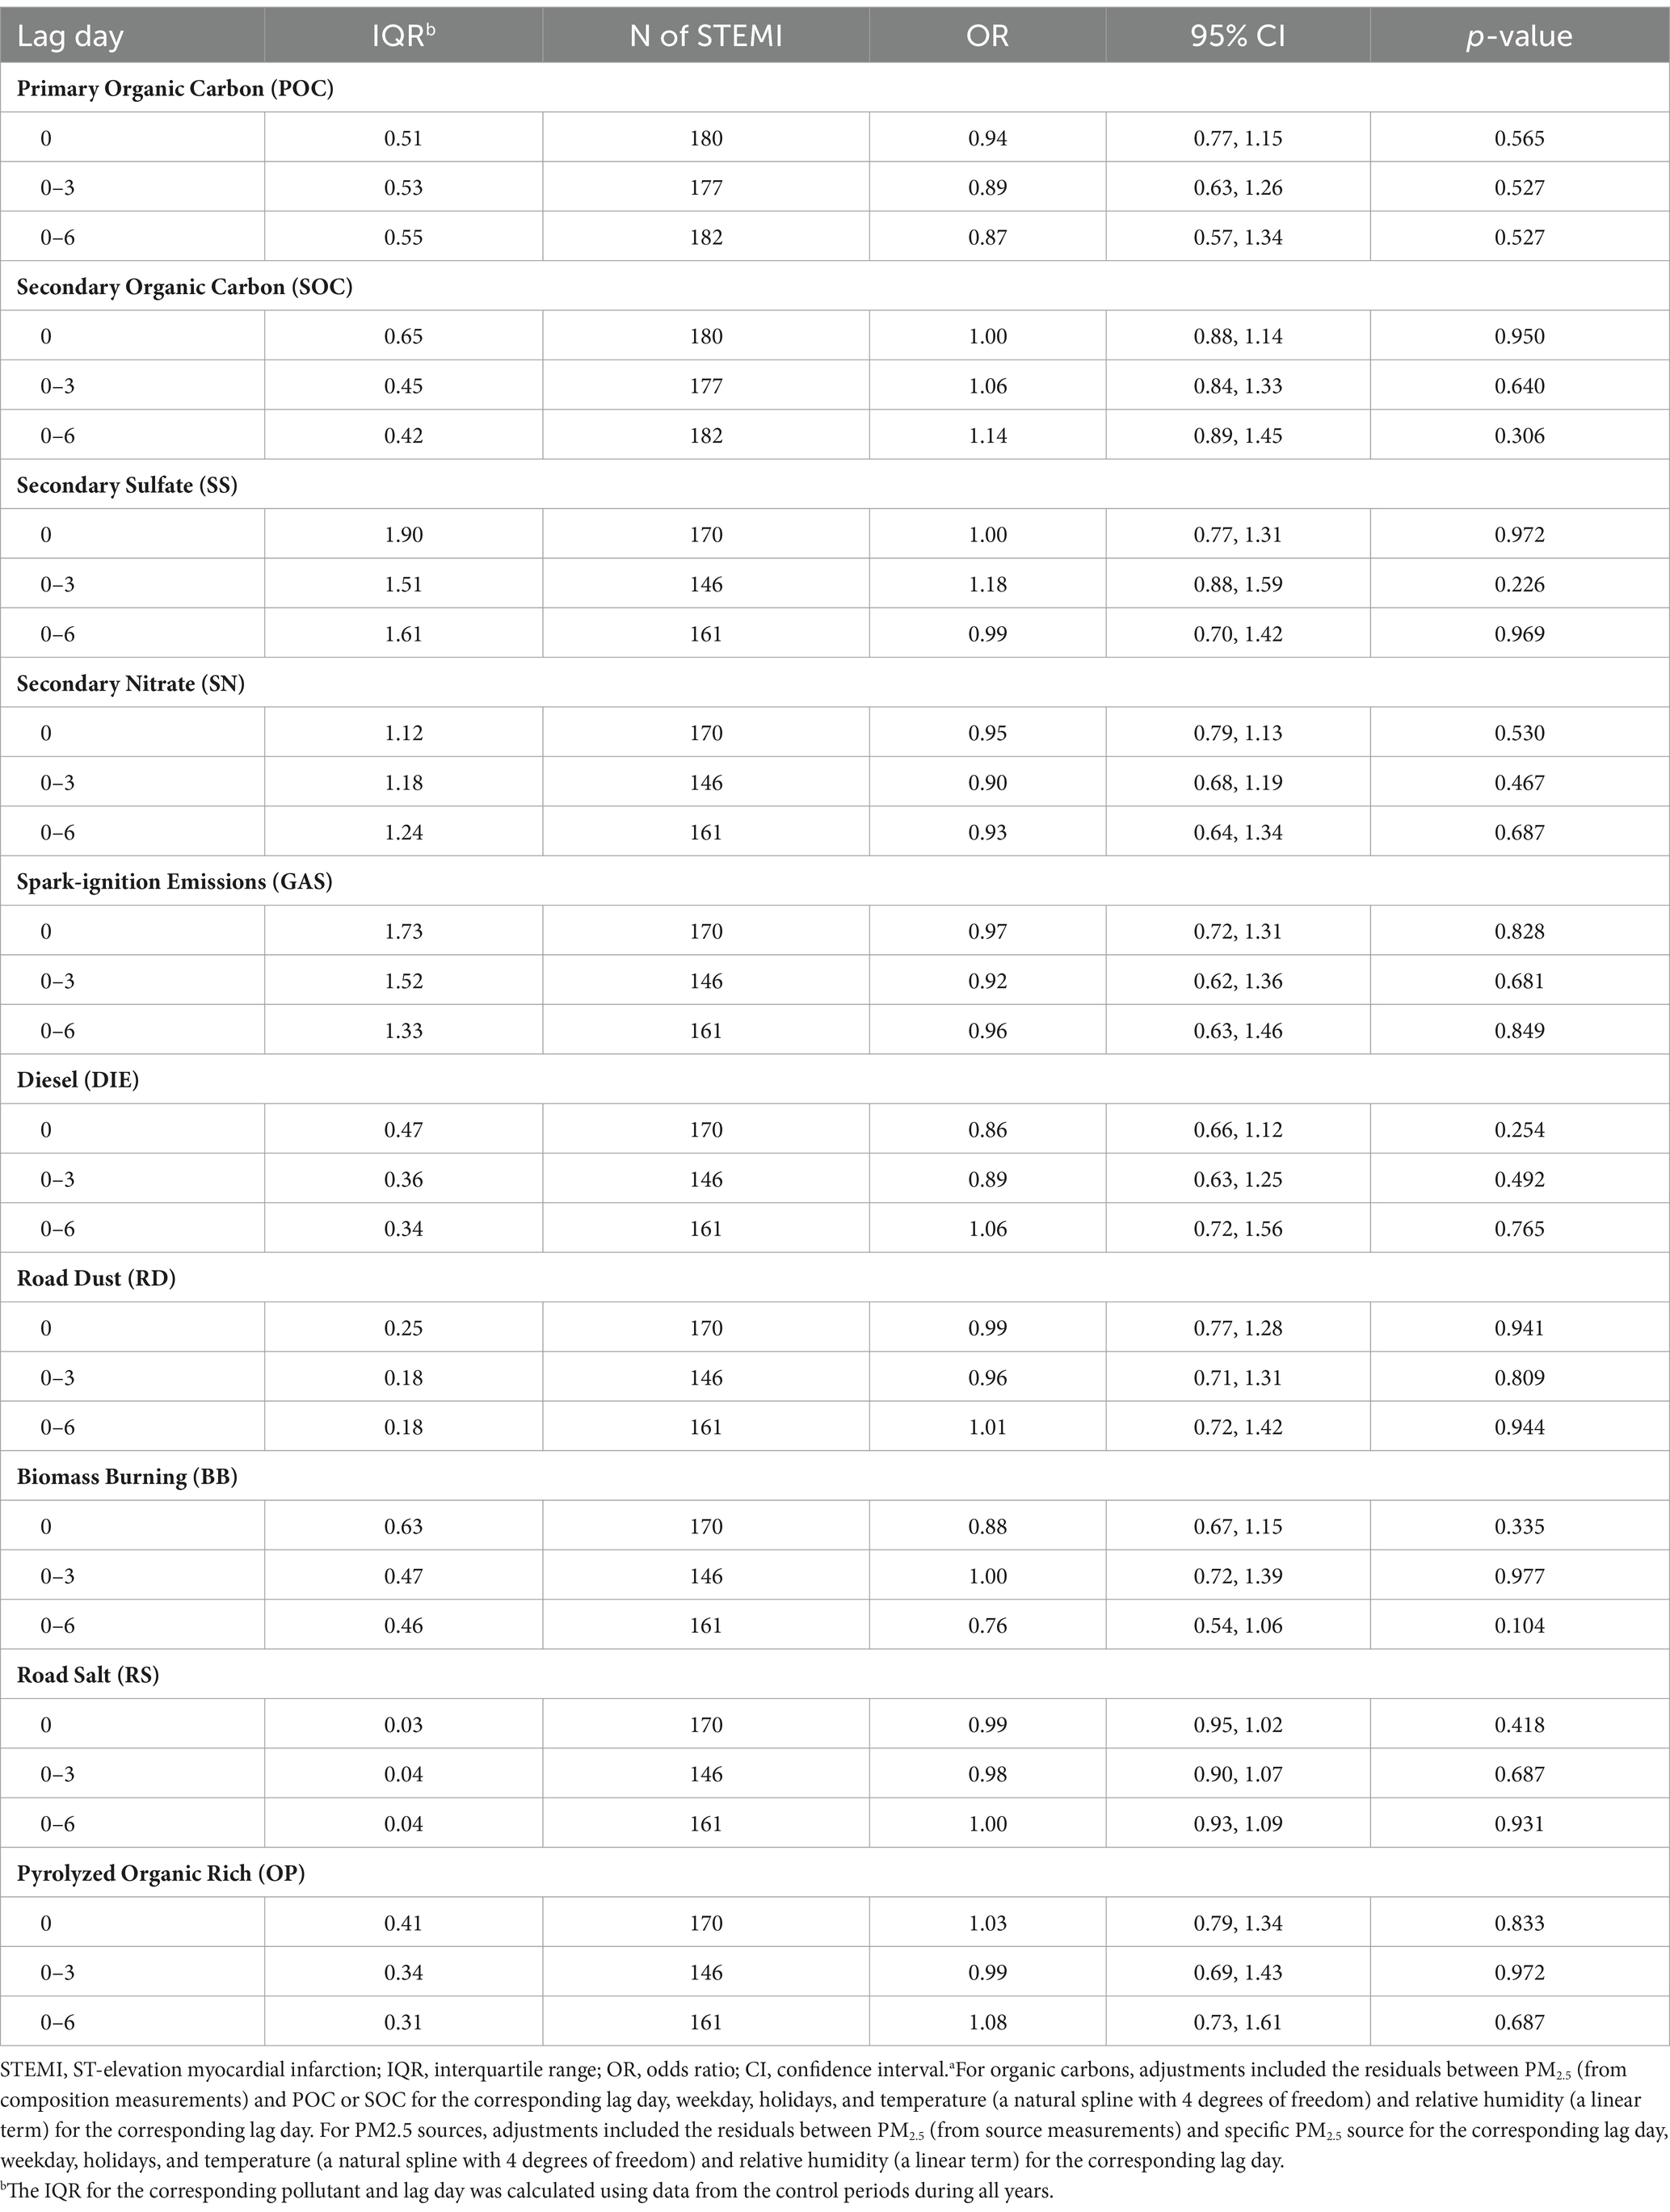
Table 4. Rates of STEMI associated with each interquartile range increase in concentrations (μg/m3) of organic carbon and PM2.5 sources in a multivariable modela.
We also explored whether rates of STEMI were separately associated with increased SOC, POC, and source-specific PM2.5 concentrations in 2014–2016 and 2017–2019 and whether these period-specific rate ratios were different (Table 5). Although increased SOC, POC, and source-specific PM2.5 concentrations were not associated with increased rates of STEMI during either period at any lag time, each IQR increase in SS on lag day 0 was associated with a decreased rate of STEMI (RR = 0.63; 95% CI = 0.40, 0.98) during 2017–2019. Further, although imprecise, rate ratios were substantially greater than 1.0 for POC, SOC, SS, and GAS for most lag times in 2014–2016.
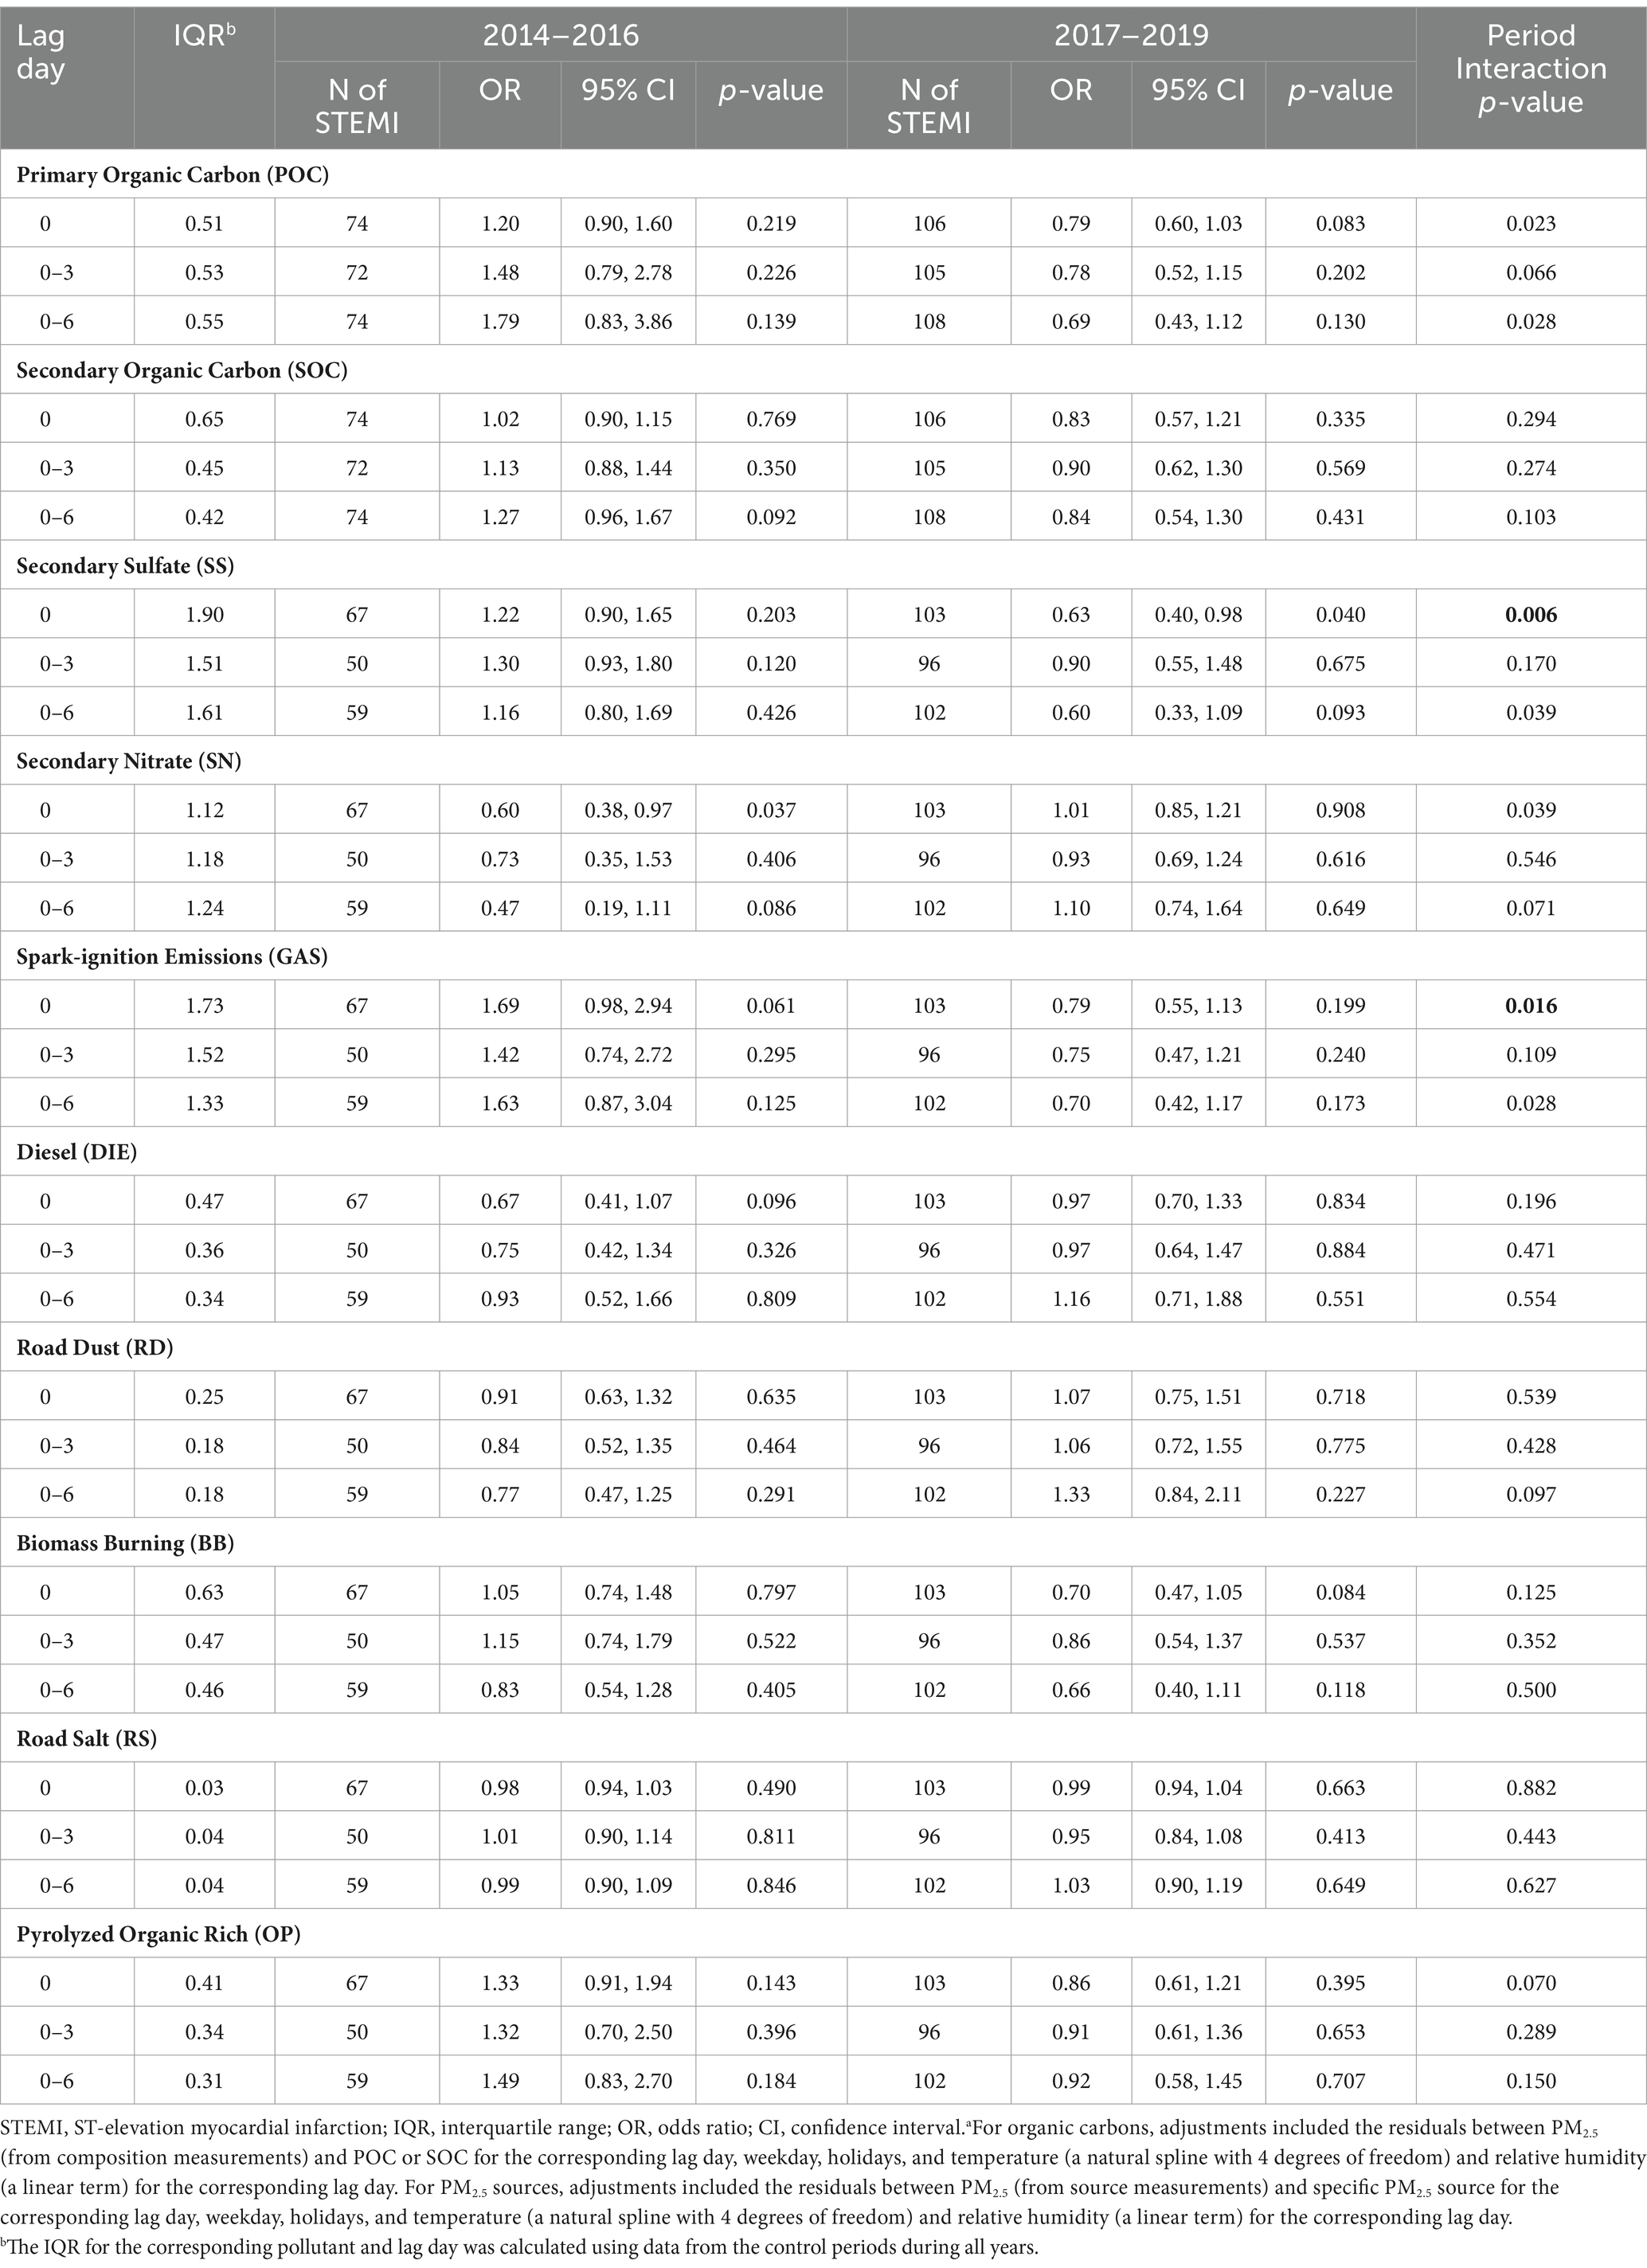
Table 5. Rates of STEMI associated with each interquartile range in concentrations (μg/m3) of organic carbon and PM2.5 sources by period, from a model including the interaction between pollutant concentrations and perioda.
Next, there were significant differences (p < 0.017) in period specific rate ratios for SS on lag day 0 (2014–2016: RR = 1.22, 95% CI = 0.90, 1.65; 2017–2019: RR = 0.63, 95% CI = 0.40, 0.98) and GAS on lag day 0 (2014–2016: RR = 1.69, 95% CI = 0.98, 2.94; 2017–2019: RR = 0.79, 95% CI = 0.55, 1.13; Table 5). Although not statistically significant, there were substantial differences in rate ratios for POC on lag day 0 (2014–2016: RR = 1.20, 95% CI = 0.90, 1.60; 2017–2019: RR = 0.79, 95% CI = 0.60, 1.03) and lag day 6 (2014–2016: RR = 1.79, 95% CI = 0.83, 3.86; 2017–2019: RR = 0.69, 95% CI = 0.43, 1.12), and GAS on lag day 6 (2014–2016: RR = 1.63, 95% CI = 0.87, 3.04; 2017–2019: RR = 0.70, 95% CI = 0.42, 1.17).
Discussion
Inconsistent with our a priori hypothesis, we did not observe an increase in rates of STEMI associated with increased PM2.5 concentrations from GAS and DIE sources (i.e., markers of traffic pollution) in Rochester, New York, from 2014 to 2019. However, an increase in GAS concentrations was associated with the increased rate of STEMI on the same day in the 2014–2016 period, but not in the 2017–2019 period. In addition, each IQR increase in mean SOC concentration in the previous 6 days was associated with an increased rate of STEMI in 2014–2016, despite the lack of precision. Similarly, we generally did not find increased rates of STEMI associated with increased POC or any other source-specific PM2.5 concentrations. In the exploratory analysis by period, we found a negative association between SS concentration on the same day and the rate of STEMI during 2017–2019 (i.e., after Tier 3 vehicle introduction). In addition, even in this early Tier 3 implementation period (2017–2019), there were significant differences in the rates of STEMI associated with SS and GAS on lag day 0 between the 2014–2016 and 2017–2019 periods. Further work will be needed to examine full implementation of Tier 3 through 2025.
This finding of a decreased rate of STEMI associated with increased SS concentrations in 2017–2019 may be spurious, and just a result of an examining effect modification of an overall null association in secondary analyses. In this case, the overall effect across the 2014–2019 period is null (i.e., RR = 1.0) and we find an increased rate ratio in 2014–2016, so there must be a decreased rate ratio in 2017–2019. Two prior studies, also using STEMI data from the Cath Lab, air pollution data from the Rochester monitoring station, and the same analysis methods, found no associations between the rate of STEMI and PM2.5 concentration in the previous few hours and days in Rochester during the 2005–2016 (13) and 2014–2019 periods (14). Our null findings with PM2.5 sources and components over 2014–2019 are consistent with these analyses.
However, there were also studies suggesting positive associations using earlier data from the same sources and the same analysis methods (7, 8). After rescaling effects with the same IQR (4.47 μg/m3) for PM2.5 used in our analysis, Evans et al. reported a 10% increase in the rate of STEMI associated with each 4.47 μg/m3 increase in PM2.5 concentration in the previous hour (RR = 1.10, 95% CI = 0.99, 1.23) during 2007–2012 (8). A similar result (IQR = 4.47 μg/m3, RR = 1.11, 95% CI = 1.01, 1.22) was also found by Gardner et al. using data from 2007 to 2010 (7). Some, but not all, other case-crossover studies also reported that increased PM2.5 concentrations were associated with an increased risk of STEMI. For example, each 4.47 μg/m3 increase in PM2.5 concentration was associated with estimated RRs of 1.06 (95% CI = 1.01, 1.12) in Utah, United States, between 1993 and 2014 (10), 1.02 (95% CI = 1.00, 1.05) in Beijing in 2014 (12), and 1.72 (95% CI = 1.00, 2.19) in Suzhou, China, from 2013 to 2016 (11). The discrepancy in these results is likely due to different study locations and changes in PM composition over time. However, it could also be due to differences in STEMI patient characteristics over time and differences in lag patterns of associations.
Although this study did not find associations between GAS and DIE sources and the rates of STEMI during the entire period (2014–2019), each 1.73 μg/m3 increase in PM2.5 concentration from the GAS source was associated with an increased rate of STEMI on lag day 0 in the 2014–2016 period (RR = 1.69; 95% CI = 0.98, 2.94), but not in the 2017–2019 period (RR = 0.79; 95% CI = 0.55, 1.13). This can perhaps be explained, in part, by our recent study (32). We found that although the monotonic trend in GAS over the period of 2010 to 2019 was positive and significant, the piecewise analysis found a breakpoint occurring around the middle of 2017 and a small downward trend to the end of 2019 suggesting changing GAS emissions during this period (Figure 1) (32). Alternatively, DIE remained constant according to the monotonic trend, but was decreasing slowly from the middle of 2012 according to the breakpoint analysis. Consistent with our study, Rich et al. reported an increased excess rate of hospitalizations for myocardial infarction (MI) associated with increased concentrations of PM2.5 from the GAS source on lag day 0 in New York State from 2005 and 2016 (2.3%; 95% CI = 0.1, 4.5%; IQR = 2.56 μg/m3), but not from the DIE source (0.4%; 95% CI = −0.5, 1.2%; IQR = 0.53 μg/m3) (25). They also found increased GAS concentrations associated with increased hospitalizations for ischemic stroke (excess rate = 3.5%; 95% CI = 1.0, 6.0%; IQR = 2.56 μg/m3) and an increase in DIE source (IQR = 0.53 μg/m3) associated with increased excess rates of congestive heart failure (0.7%; 95% CI = 0.2, 1.3%) and ischemic heart disease (0.6%; 95% CI = 0.1, 1.1%) hospitalizations on lag day 0. In addition, Sarnat et al. observed that cardiovascular emergency department (ED) visits were positively associated with same-day PM2.5 concentrations from mobile sources (RR range, 1.018–1.025) in Atlanta from 1998 to 2002 (40). In contrast, another Atlanta study (41) accounting for the uncertainty of source apportionment methods, reported no associations between mobile source PM2.5 (diesel- and gasoline-fueled vehicles) and ED visits for ischemic heart disease during 1998–2010. A possible mechanism for traffic PM2.5 sources associated with an increased risk of cardiovascular events is that traffic-related particles could contribute to both exogenous and endogenous reactive oxygen species (ROS).
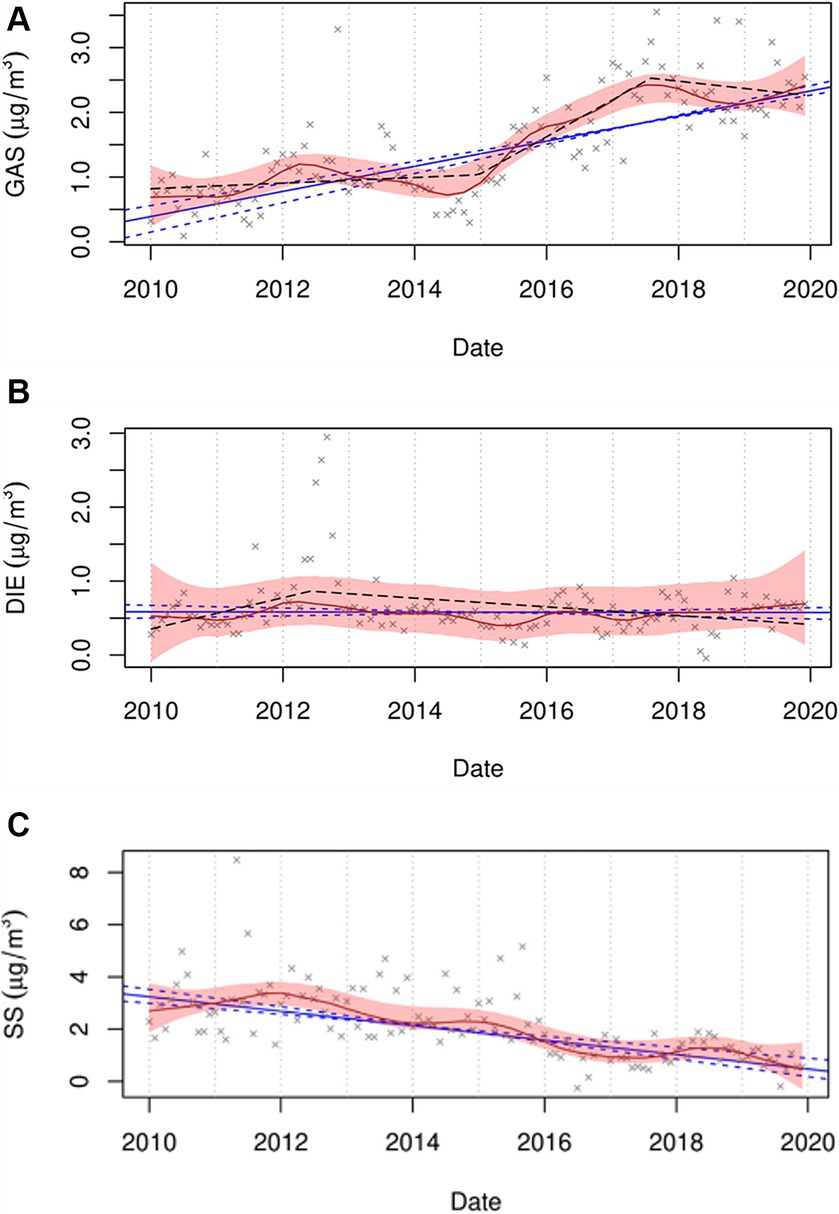
Figure 1. Trend plots for GAS (A), DIE (B), and SS (C) for the period of 2010 to 2019. The red line represents the seasonal by loess trends (STL), with 95% confidence bound as a shaded area. The blue line represents the Thiel-Sen monotonic trend, with a 95% confidence interval as dashed lines. The black dashed line represents the piecewise trend. GAS, DIE, and SS represent spark-ignition emissions, diesel, and secondary sulfate, respectively. (Figures from the supplemental material of Chen et al. (32)).
Multiple prior studies have examined associations between organic carbon (OC) and adverse cardiovascular outcomes, with both positive (19, 42, 43) and negative (44–46) results reported. In addition, the long-term associations between SOC and cardiovascular events have been explored and their results were inconsistent (47, 48). However, current evidence about the short-term association is limited. Pennington et al. found each 1 μg/m3 increase in SOC concentrations was associated with ED visits for ischemic heart disease on lag day 0 (RR = 1.003; 95% CI = 0.997, 1.009) in Atlanta from 1998 to 2010 (41). Similarly, despite imprecision, our finding indicated a suggestive increased rate of STEMI associated with an increase in SOC concentration on lag day 0–6 (RR = 1.14; 95% CI = 0.89, 1.45; IQR = 0.42 μg/m3). The possible mechanism for the association between SOC and STEMI is likely related to the formation of secondary PM species including SOC, alongside the identification of increased PM2.5 toxicity, resulting in an increased risk of cardiovascular events (16, 49). SOC formation can result in concurrent oxidant species, and the related oxidative stress and inflammation could be potential drivers of adverse cardiovascular outcomes (22, 25). The imprecision in this study could be attributable to the limited sample size of the present study. Another possible factor to be considered is that the same pollutant values from one monitoring site were assigned for each subject on a specific day, regardless of how far they lived from the monitoring site, which likely cause underestimated effects.
Rather than single components being considered as causal, the combined effects of multiple constituents that possibly interact with environmental factors or combine with socioeconomic and biological characteristics may have substantial impacts on cardiac health (3). Secondary organic aerosol (SOA), derived from volatile organic compounds, is one such component. Fresh SOA is considered to contain peroxy radicals and peroxides and be strongly oxidizing (21, 22, 25, 50). Further, traffic PM sources may not only contribute to increased SOC concentrations (25, 26, 31, 49) but are also an important source of SOA and its precursors (3, 25, 51, 52).
A recent study (53) examined the association between SOA concentrations and cardiorespiratory disease mortality in the United States in 2016. It demonstrated that annual average SOA concentrations were strongly associated with county-level cardiorespiratory death rates, with a larger association per unit mass (β = 8.9 additional deaths per 100,000; 95% CI = 6.0, 12.0) than total PM2.5 (β = 1.4 additional deaths per 100,000; 95% CI = 0.5, 2.3). They considered that prior inconsistent results about associations of OC with adverse health outcomes could be, in part, explained by total OC lacking the distinction between primary organic aerosol (POA) and SOA (53). Although ambient PM2.5 concentrations are expected to decline in the future with strict air quality policies, SOA levels may relatively increase, resulting in increased health consequences per unit mass (49). Thus, future research should focus on the health effects of different PM components, including SOA and its constituents.
We did not observe increased rates of STEMI associated with SS, SN, RD, BB, OP, and RS. Similarly, Rich et al. reported no obvious associations of MI hospitalizations with SS, RD, BB, OP, and RS, while they found an association with SN (excess rate = 1.7%; 95% CI = 0.4, 3.0%; IQR = 1.53 μg/m3) on lag day 0–3 (25). Another study reported no clear associations between MI mortality and SS, SN, and BB (54). SS and SN, being unreactive particles, would not provide oxidative potential or the resulting reactive oxygen species and oxidative stress (25, 26). OP is thought to represent more aged SOA that has been transported into the area with little associated ROS (25, 55–57). As a result, the absence of OP association might reflect its low ROS concentration. Our null findings about RD and BB may be related to their heterogeneities. RD, representing non-exhaust traffic emissions, contains deposited soil and road surface material. Its effects on STEMI may differ by deposition rates, variability in reactivity, and environmental factors. Likewise, BB could have different PM compositional patterns due to various biofuels. RS does not generally include strongly oxidizing constituents.
Interestingly, although the difference in the association between SOC and the rate of STEMI between the two periods was not found, we observed that SS and GAS concentrations on lag day 0 associated with the rates of STEMI were different between the 2014–2016 and 2017–2019 periods, and their adverse effects on the triggering of STEMI might have a declining trend. Concentrations of sulfur-containing pollutants have been decreasing (58, 59) due to the implementation of air quality policies in New York State, such as particle traps required on heavy-duty diesel trucks and reductions in the sulfur content of diesel and home heating fuels. Also in Figure 1, SS shows a steady monotonic downward trend with only minor deviations showing the impacts of coal-fired power plant closures and reduced fuel sulfur concentrations. Consistent with our finding, Yount et al. (14) found that increased rates of STEMI were associated with increases in SO2 concentrations in previous 120 h (RR = 1.26; 95% CI = 1.03, 1.55; IQR = 0.59 ppb) during 2014–2016, but not in the 2017–2019 period (RR = 1.21; 95% CI = 0.87, 1.68). Our finding regarding GAS is also similar to our previous study (14), which showed an increased rate of STEMI associated with an increase in concentrations of black carbon, a marker of traffic pollution, in the previous hour (RR = 1.16; 95% CI = 0.99, 1.34; IQR = 0.30 μg/m3) in the 2014–2016 period instead of the 2017–2019 period (RR = 0.85; 95% CI = 0.72, 1.01). The reduction in the impact of GAS may be due to changes in PM components and/or PM mixtures resulting from air pollution regulations, including the introduction of Tier 3 light-duty vehicles. Inconsistent with our exception, we did not observe changes in the rate of STEMI associated with SOC after the Tier 3 regulation was implemented. It is estimated that only 36% of vehicles registered in New York State were Tier 3 in 2020 (14). Thus, the null finding of SOC is possibly attributed to the limited penetration of Tier 3 vehicles in the early Tier 3 implementation period (2017–2019). Consequently, the magnitude of the association between SOC and STEMI is not strong enough to be observed. In addition, when accounting for these results, some other possible reasons should be considered, such as healthcare improvements, public awareness and behavioral changes, and differences in study populations, as well as greater access to health care and medical insurance over the study period.
This study has several strengths, including the use of a well-defined STEMI study population treated at the Cath Lab in Rochester and the use of a case-crossover study design to control for non-time-varying factors and interactions between them, thereby reducing confounding by these factors. However, there are several limitations to be considered when interpreting our results. First, since PM2.5 sources and components were only measured every 3rd or 6th day, the number of subjects for whom exposure data were available largely decreased, thus reducing statistical power and precision. Second, all cases were assigned the same values of PM2.5 sources and components for a specific day from a single monitoring site without considering individual-specific differences, such as the distance from the emission source and/or the monitoring site, outdoor exposure duration, and protective measures. This assumption likely led to non-differential exposure misclassification and underestimated effects. Third, it is difficult for case-crossover designs combined with conditional logistic regression to fully adjust for possible overdispersion (60), which may cause larger confidence intervals than reported. Last, the 2014–2016 and 2017–2019 periods were selected based on the implementation timing of the new policy for Tier 3 light-duty vehicles. However, given that 2017–2019 is the early Tier 3 implementation period and the interventions generally phase in and take time to be effective, there are actually no well-defined time windows for the policies and emission changes. Therefore, the actual impact of this new policy should be further evaluated after the full implementation of Tier 3 through 2025.
Conclusion
We used data on STEMI events treated at the University of Rochester Medical Center from 2014 to 2019, as well as the concentrations of PM2.5 sources and organic carbon measured in Rochester, NY. Inconsistent with our a priori hypothesis, increased rates of STEMI were not associated with increased GAS and DIE concentrations in the previous few days. However, in the 2014–2016 period, increased PM2.5 concentrations from the GAS source were associated with an increased rate of STEMI on the same day, which was not observed in the 2017–2019 period. Despite imprecision, our finding suggested that a short-term increase in SOC concentration might be associated with an increased rate of STEMI. We also found no association between rates of STEMI and POC or any other source-specific PM2.5 concentration. These negative results may be due to the potential changes in traffic emissions as well as the reduced statistical power and precision resulting from our limited sample size and potential exposure misclassification and effect underestimation. Furthermore, we observed significant differences in period-specific rate ratios for SS and GAS on the same day between the 2014–2016 and 2017–2019 periods, with a declining trend regarding adverse effects on the triggering of STEMI. This finding may be related to the changes in PM components and/or PM mixtures. Future work will be needed to further examine the effects of PM components and sources on triggering MI using a large sample after the Tier 3 light-duty vehicle policy is fully implemented in New York State.
Data availability statement
The datasets presented in this article are not readily available because they contain protected health information and the authors are thus not permitted to release the data.
Ethics statement
The studies involving humans were approved by University of Rochester Research Subjects Review Board. The studies were conducted in accordance with the local legislation and institutional requirements. The ethics committee/institutional review board waived the requirement of written informed consent for participation from the participants or the participants’ legal guardians/next of kin because the research involved no more than minimal risk to study subjects, the research could not be carried out without the waiver, and the waiver was judged not to adversely affect the rights and welfare of the subjects.
Author contributions
TZ: Formal analysis, Writing – original draft. PH: Funding acquisition, Project administration, Conceptualization, Data curation, Formal analysis, Methodology, Supervision, Writing – review & editing. MU: Conceptualization, Funding acquisition, Writing – review & editing. DC: Funding acquisition, Conceptualization, Investigation, Writing – review & editing. ST: Funding acquisition, Conceptualization, Methodology, Writing – review & editing. SL: Funding acquisition, Project administration, Conceptualization, Methodology, Writing – review & editing. FL: Conceptualization, Data curation, Writing – review & editing. YC: Data curation, Formal analysis, Writing – review & editing. CY: Formal analysis, Writing – review & editing. DR: Conceptualization, Data curation, Formal analysis, Funding acquisition, Methodology, Project administration, Supervision, Writing – review & editing.
Funding
The author(s) declare that financial support was received for the research, authorship, and/or publication of this article. This work was supported by the New York State Energy Research and Development Authority (Contract #’s 125993 and 156226) and the National Institute of Environmental Health Sciences (Grant # P30ES001247).
Conflict of interest
The authors declare that the research was conducted in the absence of any commercial or financial relationships that could be construed as a potential conflict of interest.
The author(s) declared that they were an editorial board member of Frontiers, at the time of submission. This had no impact on the peer review process and the final decision.
Publisher’s note
All claims expressed in this article are solely those of the authors and do not necessarily represent those of their affiliated organizations, or those of the publisher, the editors and the reviewers. Any product that may be evaluated in this article, or claim that may be made by its manufacturer, is not guaranteed or endorsed by the publisher.
Footnotes
References
1. Fuller, R, Landrigan, PJ, Balakrishnan, K, Bathan, G, Bose-O'Reilly, S, Brauer, M, et al. Pollution and health: a progress update. Lancet Planet Health. (2022) 6:e535–47. doi: 10.1016/S2542-5196(22)00090-0
2. Cohen, AJ, Brauer, M, Burnett, R, Anderson, HR, Frostad, J, Estep, K, et al. Estimates and 25-year trends of the global burden of disease attributable to ambient air pollution: an analysis of data from the global burden of diseases study 2015. Lancet. (2017) 389:1907–18. doi: 10.1016/S0140-6736(17)30505-6
3. Al-Kindi, SG, Brook, RD, Biswal, S, and Rajagopalan, S. Environmental determinants of cardiovascular disease: lessons learned from air pollution. Nat Rev Cardiol. (2020) 17:656–72. doi: 10.1038/s41569-020-0371-2
4. Brauer, M, Casadei, B, Harrington, RA, Kovacs, R, and Sliwa, K. Taking a stand against air pollution-the impact on cardiovascular disease: a joint opinion from the world heart federation, American College of Cardiology, American Heart Association, and the European Society of Cardiology. Circulation. (2021) 143:e800–4. doi: 10.1161/CIRCULATIONAHA.120.052666
5. Rajagopalan, S, Al-Kindi, SG, and Brook, RD. Air pollution and cardiovascular disease: JACC state-of-the-art review. J Am Coll Cardiol. (2018) 72:2054–70. doi: 10.1016/j.jacc.2018.07.099
6. Mustafic, H, Jabre, P, Caussin, C, Murad, MH, Escolano, S, Tafflet, M, et al. Main air pollutants and myocardial infarction: a systematic review and meta-analysis. JAMA. (2012) 307:713–21. doi: 10.1001/jama.2012.126
7. Gardner, B, Ling, F, Hopke, PK, Frampton, MW, Utell, MJ, Zareba, W, et al. Ambient fine particulate air pollution triggers ST-elevation myocardial infarction, but not non-ST elevation myocardial infarction: a case-crossover study. Part Fibre Toxicol. (2014) 11:1. doi: 10.1186/1743-8977-11-1
8. Evans, KA, Hopke, PK, Utell, MJ, Kane, C, Thurston, SW, Ling, FS, et al. Triggering of ST-elevation myocardial infarction by ambient wood smoke and other particulate and gaseous pollutants. J Expo Sci Environ Epidemiol. (2017) 27:198–206. doi: 10.1038/jes.2016.15
9. Cheng, J, Tong, S, Su, H, and Xu, Z. Hourly air pollution exposure and emergency department visit for acute myocardial infarction: vulnerable populations and susceptible time window. Environ Pollut. (2021) 288:117806. doi: 10.1016/j.envpol.2021.117806
10. Pope, CA III, Muhlestein, JB, Anderson, JL, Cannon, JB, Hales, NM, Meredith, KG, et al. Short-term exposure to fine particulate matter air pollution is preferentially associated with the risk of ST-segment elevation acute coronary events. J Am Heart Assoc. (2015) 4:e002506. doi: 10.1161/JAHA.115.002506
11. Sun, Q, Cao, B, Jiang, Y, Zhuang, J, Zhang, C, and Jiang, B. Association between ambient particulate matter (PM2. 5/PM10) and first incident ST-elevation myocardial infarction in Suzhou, China. Environ Sci Pollut Res. (2022) 29:62690–7. doi: 10.1007/s11356-022-20150-z
12. Zhang, Q, Qi, W, Yao, W, Wang, M, Chen, Y, and Zhou, Y. Ambient particulate matter (PM2. 5/PM10) exposure and emergency department visits for acute myocardial infarction in Chaoyang District, Beijing, China during 2014: a case-crossover study. J Epidemiol. (2016) 26:538–45. doi: 10.2188/jea.JE20150209
13. Wang, M, Hopke, PK, Masiol, M, Thurston, SW, Cameron, S, Ling, F, et al. Changes in triggering of ST-elevation myocardial infarction by particulate air pollution in Monroe County, New York over time: a case-crossover study. Environ Health. (2019) 18:82. doi: 10.1186/s12940-019-0521-3
14. Yount, CS, Utell, MJ, Hopke, PK, Thurston, SW, Lin, S, Ling, FS, et al. Triggering of ST-elevation myocardial infarction by ultrafine particles in New York: changes following tier 3 vehicle introduction. Environ Res. (2023) 216:114445. doi: 10.1016/j.envres.2022.114445
15. Nassan, FL, Wang, C, Kelly, RS, Lasky-Su, JA, Vokonas, PS, Koutrakis, P, et al. Ambient PM(2.5) species and ultrafine particle exposure and their differential metabolomic signatures. Environ Int. (2021) 151:106447. doi: 10.1016/j.envint.2021.106447
16. Rich, DQ, Ozkaynak, H, Crooks, J, Baxter, L, Burke, J, Ohman-Strickland, P, et al. The triggering of myocardial infarction by fine particles is enhanced when particles are enriched in secondary species. Environ Sci Technol. (2013) 47:9414–23. doi: 10.1021/es4027248
17. Peng, RD, Bell, ML, Geyh, AS, McDermott, A, Zeger, SL, Samet, JM, et al. Emergency admissions for cardiovascular and respiratory diseases and the chemical composition of fine particle air pollution. Environ Health Perspect. (2009) 117:957–63. doi: 10.1289/ehp.0800185
18. Kim, SY, Peel, JL, Hannigan, MP, Dutton, SJ, Sheppard, L, Clark, ML, et al. The temporal lag structure of short-term associations of fine particulate matter chemical constituents and cardiovascular and respiratory hospitalizations. Environ Health Perspect. (2012) 120:1094–9. doi: 10.1289/ehp.1104721
19. Ito, K, Mathes, R, Ross, Z, Nádas, A, Thurston, G, and Matte, T. Fine particulate matter constituents associated with cardiovascular hospitalizations and mortality in new York City. Environ Health Perspect. (2011) 119:467–73. doi: 10.1289/ehp.1002667
20. Ziemann, PJ, and Atkinson, R. Kinetics, products, and mechanisms of secondary organic aerosol formation. Chem Soc Rev. (2012) 41:6582–605. doi: 10.1039/c2cs35122f
21. Docherty, KS, Wu, W, Lim, YB, and Ziemann, PJ. Contributions of organic peroxides to secondary aerosol formed from reactions of monoterpenes with O3. Environ Sci Technol. (2005) 39:4049–59. doi: 10.1021/es050228s
22. Chen, X, Hopke, PK, and Carter, WP. Secondary organic aerosol from ozonolysis of biogenic volatile organic compounds: chamber studies of particle and reactive oxygen species formation. Environ Sci Technol. (2011) 45:276–82. doi: 10.1021/es102166c
23. Münzel, T, Sørensen, M, Gori, T, Schmidt, FP, Rao, X, Brook, FR, et al. Environmental stressors and cardio-metabolic disease: part II-mechanistic insights. Eur Heart J. (2017) 38:557–64. doi: 10.1093/eurheartj/ehw294
24. Marchini, T. Redox and inflammatory mechanisms linking air pollution particulate matter with cardiometabolic derangements. Free Radic Biol Med. (2023) 209:320–41. doi: 10.1016/j.freeradbiomed.2023.10.396
25. Rich, DQ, Zhang, W, Lin, S, Squizzato, S, Thurston, SW, van Wijngaarden, E, et al. Triggering of cardiovascular hospital admissions by source specific fine particle concentrations in urban centers of New York state. Environ Int. (2019) 126:387–94. doi: 10.1016/j.envint.2019.02.018
26. Croft, DP, Zhang, W, Lin, S, Thurston, SW, Hopke, PK, van Wijngaarden, E, et al. Associations between source-specific particulate matter and respiratory infections in New York state adults. Environ Sci Technol. (2020) 54:975–84. doi: 10.1021/acs.est.9b04295
27. Hopke, PK, Croft, DP, Zhang, W, Lin, S, Masiol, M, Squizzato, S, et al. Changes in the hospitalization and ED visit rates for respiratory diseases associated with source-specific PM(2.5) in New York state from 2005 to 2016. Environ Res. (2020) 181:108912. doi: 10.1016/j.envres.2019.108912
28. Squizzato, S, Masiol, M, Rich, DQ, and Hopke, PK. A long-term source apportionment of PM2. 5 in New York state during 2005–2016. Atmos Environ. (2018) 192:35–47. doi: 10.1016/j.atmosenv.2018.08.044
29. Squizzato, S, Masiol, M, Rich, DQ, and Hopke, PK. PM2.5 and gaseous pollutants in New York state during 2005–2016: spatial variability, temporal trends, and economic influences. Atmos Environ. (2018) 183:209–24. doi: 10.1016/j.atmosenv.2018.03.045
30. Chen, Y, Rich, DQ, Masiol, M, and Hopke, PK. Changes in ambient air pollutants in New York state from 2005 to 2019: effects of policy implementations and economic and technological changes. Atmos Environ. (2023) 311:119996. doi: 10.1016/j.atmosenv.2023.119996
31. Masiol, M, Squizzato, S, Rich, DQ, and Hopke, PK. Long-term trends (2005–2016) of source apportioned PM2. 5 across New York state. Atmos Environ. (2019) 201:110–20. doi: 10.1016/j.atmosenv.2018.12.038
32. Chen, Y, Rich, DQ, Masiol, M, and Hopke, PK. Changes in source specific PM2.5 from 2010 to 2019 in New York and New Jersey identified by dispersion normalized PMF. Atmos Res. (2024) 304:107353. doi: 10.1016/j.atmosres.2024.107353
33. O'Gara, PT, Kushner, FG, Ascheim, DD, Casey, DE Jr, Chung, MK, de Lemos, JA, et al. 2013 ACCF/AHA guideline for the management of ST-elevation myocardial infarction: a report of the American College of Cardiology Foundation/American Heart Association task force on practice guidelines. Circulation. (2013) 127:e362–425. doi: 10.1161/CIR.0b013e3182742cf6
34. Solomon, PA, Crumpler, D, Flanagan, JB, Jayanty, R, Rickman, EE, and McDade, CE. US national PM2. 5 chemical speciation monitoring networks—CSN and IMPROVE: description of networks. J Air Waste Manage Assoc. (2014) 64:1410–38. doi: 10.1080/10962247.2014.956904
35. Maclure, M. The case-crossover design: a method for studying transient effects on the risk of acute events. Am J Epidemiol. (1991) 133:144–53. doi: 10.1093/oxfordjournals.aje.a115853
36. Levy, D, Lumley, T, Sheppard, L, Kaufman, J, and Checkoway, H. Referent selection in case-crossover analyses of acute health effects of air pollution. Epidemiology. (2001) 12:186–92. doi: 10.1097/00001648-200103000-00010
37. Byrne, CP, Bennett, KE, Hickey, A, Kavanagh, P, Broderick, B, O'Mahony, M, et al. Short-term air pollution as a risk for stroke admission: a time-series analysis. Cerebrovasc Dis. (2020) 49:404–11. doi: 10.1159/000510080
38. Chen, H, Cheng, Z, Li, M, Luo, P, Duan, Y, Fan, J, et al. Ambient air pollution and hospitalizations for ischemic stroke: a time series analysis using a distributed lag nonlinear model in Chongqing. China Front Public Health. (2021) 9:762597. doi: 10.3389/fpubh.2021.762597
39. Liu, C, Chen, R, Sera, F, Vicedo-Cabrera, AM, Guo, Y, Tong, S, et al. Ambient particulate air pollution and daily mortality in 652 cities. N Engl J Med. (2019) 381:705–15. doi: 10.1056/NEJMoa1817364
40. Sarnat, JA, Marmur, A, Klein, M, Kim, E, Russell, AG, Sarnat, SE, et al. Fine particle sources and cardiorespiratory morbidity: an application of chemical mass balance and factor analytical source-apportionment methods. Environ Health Perspect. (2008) 116:459–66. doi: 10.1289/ehp.10873
41. Pennington, AF, Strickland, MJ, Gass, K, Klein, M, Sarnat, SE, Tolbert, PE, et al. Source-apportioned PM2.5 and cardiorespiratory emergency department visits: accounting for source contribution uncertainty. Epidemiology. (2019) 30:789–98. doi: 10.1097/EDE.0000000000001089
42. Lin, H, Tao, J, Du, Y, Liu, T, Qian, Z, Tian, L, et al. Particle size and chemical constituents of ambient particulate pollution associated with cardiovascular mortality in Guangzhou. China Environ Pollution. (2016) 208:758–66. doi: 10.1016/j.envpol.2015.10.056
43. Atkinson, RW, Mills, IC, Walton, HA, and Anderson, HR. Fine particle components and health—a systematic review and meta-analysis of epidemiological time series studies of daily mortality and hospital admissions. J Expo Sci Environ Epidemiol. (2015) 25:208–14. doi: 10.1038/jes.2014.63
44. Son, J-Y, Lee, J-T, Kim, K-H, Jung, K, and Bell, ML. Characterization of fine particulate matter and associations between particulate chemical constituents and mortality in Seoul. Korea Environ Health Perspect. (2012) 120:872–8. doi: 10.1289/ehp.1104316
45. Chen, C, Xu, D, He, MZ, Wang, Y, Du, Z, Du, Y, et al. Fine particle constituents and mortality: a time-series study in Beijing. China Environ Sci Technol. (2018) 52:11378–86. doi: 10.1021/acs.est.8b00424
46. Bell, ML, Ebisu, K, Peng, RD, Samet, JM, and Dominici, F. Hospital admissions and chemical composition of fine particle air pollution. Am J Respir Crit Care Med. (2009) 179:1115–20. doi: 10.1164/rccm.200808-1240OC
47. Walsh, A, Russell, AG, Weaver, AM, Moyer, J, Wyatt, L, and Ward-Caviness, CK. Associations between source-apportioned PM2. 5 and 30-day readmissions in heart failure patients. Environ Res. (2023) 228:115839. doi: 10.1016/j.envres.2023.115839
48. Slawsky, E, Ward-Caviness, CK, Neas, L, Devlin, RB, Cascio, WE, Russell, AG, et al. Evaluation of PM(2.5) air pollution sources and cardiovascular health. Environ Epidemiol. (2021) 5:e157. doi: 10.1097/EE9.0000000000000157
49. Zhang, W, Lin, S, Hopke, PK, Thurston, SW, van Wijngaarden, E, Croft, D, et al. Triggering of cardiovascular hospital admissions by fine particle concentrations in New York state: before, during, and after implementation of multiple environmental policies and a recession. Environ Pollut. (2018) 242:1404–16. doi: 10.1016/j.envpol.2018.08.030
50. Hopke, PK. Reactive ambient particles In: SS Nadadur and JW Hollingsworth, editors. Air pollution and health effects. London: Springer (2015). 1–24.
51. Zhao, Y, Nguyen, NT, Presto, AA, Hennigan, CJ, May, AA, and Robinson, AL. Intermediate volatility organic compound emissions from on-road gasoline vehicles and small off-road gasoline engines. Environ Sci Technol. (2016) 50:4554–63. doi: 10.1021/acs.est.5b06247
52. Zhao, Y, Lambe, AT, Saleh, R, Saliba, G, and Robinson, AL. Secondary organic aerosol production from gasoline vehicle exhaust: effects of engine technology, cold start, and emission certification standard. Environ Sci Technol. (2018) 52:1253–61. doi: 10.1021/acs.est.7b05045
53. Pye, HOT, Ward-Caviness, CK, Murphy, BN, Appel, KW, and Seltzer, KM. Secondary organic aerosol association with cardiorespiratory disease mortality in the United States. Nat Commun. (2021) 12:7215. doi: 10.1038/s41467-021-27484-1
54. Berger, K, Malig, BJ, Hasheminassab, S, Pearson, DL, Sioutas, C, Ostro, B, et al. Associations of source-apportioned fine particles with cause-specific mortality in California. Epidemiology. (2018) 29:639–48. doi: 10.1097/EDE.0000000000000873
55. Kim, E, and Hopke, PK. Source apportionment of fine particles in Washington, DC, utilizing temperature-resolved carbon fractions. J Air Waste Manage Assoc. (2004) 54:773–85. doi: 10.1080/10473289.2004.10470948
56. Kim, E, Hopke, PK, and Edgerton, ES. Improving source identification of Atlanta aerosol using temperature resolved carbon fractions in positive matrix factorization. Atmos Environ. (2004) 38:3349–62. doi: 10.1016/j.atmosenv.2004.03.012
57. Kim, E, and Hopke, PK. Improving source identification of fine particles in a rural northeastern US area utilizing temperature-resolved carbon fractions. J Geophys Res Atmos. (2004) 109:D09204. doi: 10.1029/2003JD004199
58. Emami, F, Masiol, M, and Hopke, PK. Air pollution at Rochester, NY: long-term trends and multivariate analysis of upwind SO2 source impacts. Sci Total Environ. (2018) 612:1506–15. doi: 10.1016/j.scitotenv.2017.09.026
59. Rattigan, OV, Civerolo, KL, Felton, HD, Schwab, JJ, and Demerjian, KL. Long term trends in New York: PM2. 5 mass and particle components. Aerosol and air quality. Demogr Res. (2016) 16:1191–205. doi: 10.4209/aaqr.2015.05.0319
Keywords: myocardial infarction, air pollution, PM2.5, source apportionment, organic carbon, case-crossover
Citation: Zhao T, Hopke PK, Utell MJ, Croft DP, Thurston SW, Lin S, Ling FS, Chen Y, Yount CS and Rich DQ (2024) A case-crossover study of ST-elevation myocardial infarction and organic carbon and source-specific PM2.5 concentrations in Monroe County, New York. Front. Public Health. 12:1369698. doi: 10.3389/fpubh.2024.1369698
Edited by:
Catherine Bulka, University of South Florida, United StatesReviewed by:
Suzana M. Blesic, University of Belgrade, SerbiaTimoteo Marchini, University Heart Center Freiburg, Germany
Copyright © 2024 Zhao, Hopke, Utell, Croft, Thurston, Lin, Ling, Chen, Yount and Rich. This is an open-access article distributed under the terms of the Creative Commons Attribution License (CC BY). The use, distribution or reproduction in other forums is permitted, provided the original author(s) and the copyright owner(s) are credited and that the original publication in this journal is cited, in accordance with accepted academic practice. No use, distribution or reproduction is permitted which does not comply with these terms.
*Correspondence: David Q. Rich, ZGF2aWRfcmljaEB1cm1jLnJvY2hlc3Rlci5lZHU=