 Jiaming Guo1
 Yuxin Luo1
 Yifei Ma1
 Shujun Xu1
 Jiantao Li2
 Tong Wang1
 Lijian Lei1
 Lu He1
 Hongmei Yu1,3,4*
 Jun Xie4,5,6*
- 1School of Public Health, Shanxi Medical University, Taiyuan, China
- 2School of Management, Shanxi Medical University, Taiyuan, China
- 3Shanxi Provincial Key Laboratory of Major Diseases Risk Assessment, Shanxi Medical University, Taiyuan, China
- 4MOE Key Laboratory of Coal Environmental Pathogenicity and Prevention, Shanxi Medical University, Taiyuan, China
- 5Department of Biochemistry and Molecular Biology, Shanxi Medical University, Taiyuan, China
- 6Shanxi Key Laboratory of Birth Defect and Cell Regeneration, Shanxi Medical University, Taiyuan, China
Introduction: Amidst an emerging infectious disease outbreak, the rational allocation of vaccines and medical resources is crucial for controlling the epidemic’s progression.
Method: Analysing COVID-19 data in Taiyuan City from December 2022 to January 2023, this study constructed a
Results: Vaccination significantly reduces infection rates, hospitalisations, and severe cases, while also curtailing strain on medical resources by reducing congestion periods. An early and sufficient reserve of medical resources can delay the onset of medical congestion, and with increased maximum capacity of medical resources, the congestion’s end can be accelerated. Stronger resource allocation capabilities lead to earlier congestion resolution within a fixed total resource pool.
Discussion: Integrating vaccination and medical resource allocation can effectively reduce medical congestion duration and alleviate the epidemic’s strain on medical resource capacity (CCMR).
1 Introduction
“Emerging infectious diseases” typically denote highly contagious and lethal outbreaks that occur within a short timeframe in specific regions (1, 2). The widespread transmission of such diseases poses significant challenges to epidemic control, strains healthcare systems, and triggers public panic, leading to social unrest and crises that threaten national and regional stability and security (3). The COVID-19 outbreak that emerged at the end of 2019 led to numerous infections and hospitalisations (4, 5), severely impacting healthcare systems worldwide. For instance, Bhaskaran et al. (4) discovered that COVID-19 hospital admissions carried significantly higher risks of rehospitalization and death compared to the general population. Additionally, Timothy et al. (5) predicted a peak in COVID-19 hospitalizations from November to April of the following year, which poses challenges for the healthcare system. Therefore, identifying effective prevention and control measures and enhancing the carrying capacity of medical resources (CCMR) during an outbreak are crucial for controlling the spread of COVID-19 (6).
The CCMR is a key indicator for preventive implementation and epidemic response readiness, encompassing two main aspects (7): First, the production and allocation capacity of medical resources, which includes the ability to produce and distribute beds, medications, medical equipment, and related supplies required for patient treatment, reflecting a region’s ability to promptly supplement medical resources and its efficiency during an outbreak. Second, the maximum number of available medical resources, which is based on the production and allocation capacity of medical resources and their limited nature indicates the maximum amount of resources that medical institutions can provide promptly. For instance, following the COVID-19 outbreak in Taiyuan City, hospital admissions surged, and departments other than respiratory medicine were repurposed to accommodate COVID-19 patients, maxing out bed capacity across all departments. During the pandemic, as the number of COVID-19 patients increased, the shortage of medical resources and resulting congestion posed significant public health issues in various locations. In a study from Germany, early in the epidemic, to increase the capacity for COVID-19 patients, a reduction of bed and operating room occupancy of 50.8 ± 19.3% and 54.2 ± 19.1% was reported (8). The World Health Organization also highlighted that the severe shortage of nursing staff globally could threaten the safety of COVID-19 patients (9). Therefore, during an outbreak, assessing the carrying capacity of the medical resources, preventing the occurrence of medical congestion, shortening the duration of congestion, and developing corresponding prevention strategies are essential.
Vaccination is a pivotal strategy in controlling the spread of infectious diseases. Amidst the COVID-19 pandemic, nations worldwide have prioritised vaccine development and administration (10, 11). In China, governmental and professional institutions such as the Centres for Disease Control and Prevention, have recommended that the public expedite their vaccination process, particularly the administration of the booster doses (12). Studies indicate that completing a three-dose regimen, significantly reduces infection rates (13–17), thereby decreasing the demand for medical resources. Although the efficacy of vaccines in reducing infections has been widely confirmed (18), research on the relationship between vaccination and the CCMR remains insufficient. During the pandemic, quantifying the impact of vaccination on CCMR is paramount for improving local epidemic prevention and control measures.
Infectious disease dynamics modelling is an essential tool for analysing the mechanisms of disease transmission, predicting trends, and identifying influencing factors. Existing research encompasses three main areas. First, the use of infectious dynamic models to analyse the spread of COVID-19 within populations. For instance, Mandal et al. (19) established the SPFEIDR model to predict short-term trends in several severely affected regions in India, identifying that reducing interpersonal contact is key to controlling disease spread. Zhao et al. (20) developed a SUQC model to characterise the COVID-19 dynamics. By fitting it with actual daily incidence data, analysed the outbreak in Wuhan and four first-tier cities in China, predicting the pandemic’s end time and the final scale of infection numbers. Second, the assessment of vaccination effects, such as Ali et al.’s (21) SEIIAVR model which mathematically demonstrated that increasing the vaccination rate to over 50% can effectively reduce the infection rate. Paulo and colleagues (22) suggest that to maximise the number of individuals with partial COVID-19 protection, an optimisation model based on SEIR dynamics recommends the optimal delay for the second vaccine dose, considering crucial factors such as the efficacy of a single dose, the anticipated vaccine supply pipeline, and the potential emergence of more virulent COVID-19 variants, which could significantly reduce ICU admissions. Third, the evaluation of the CCMR in different regions. Wang et al. (7) assessed the CCMR of multiple countries post-outbreak using the SEIARSqTH1H2 model, finding that enhancing medical capabilities and testing in tandem can alleviate the epidemic and prevent excessive pressure on CCMR. Overall, current studies focus on the dynamics of transmission, vaccination rates, and the factors affecting CCMR, while there is a lack of discussion on the impact of different vaccination strategies on epidemic trends and CCMR.
As the capital city of Shanxi Province, Taiyuan boasts convenient transportation and abundant medical resources. Data from sentinel hospitals between December 6, 2022, and January 13, 2023, revealed a COVID-19 mortality rate in Taiyuan below 1/10,000, signifying notable success in pandemic control efforts. This study, taking Taiyuan as a case example, collected vaccination status and incidence data from residents through surveys. Utilising medical resources and patient information provided by sentinel hospitals, an model simulated vaccination scenarios and epidemic trends during the COVID-19 period. The model assessed changes in hospital bed occupancy, reflecting the impact of different vaccination levels on infection rates, hospitalisations, severe cases, and trends, along with CCMR. This provides a scientific basis for optimising vaccination strategies and medical resource allocation in Taiyuan.
This study categorised the vaccinated population into four groups: those susceptible without vaccination (), those who have received one dose (), those who have received two doses (), and those who have received three doses (). We use the number of available hospital beds as a quantitative indicator of CCMR. When the number of beds hits zero, the CCMR is deemed to have reached its limit, leading to a medical congestion. The onset, duration, and end time of this congestion serve as metrics for assessing the CCMR. The primary assumptions of the study include:
(H1) Excludes transmission from asymptomatic infections and those in the incubation period in the model. It is because following the easing of control measures and the discontinuation of nucleic acid testing, it is widely accepted that the propagation of the novel coronavirus is primarily due to individuals exhibiting symptoms of the virus.
(H2) Individuals exhibiting symptoms of COVID-19 will either be quarantined at home or receive treatment in a hospital.
(H3) Individuals who have been infected will not contract the infection again within a short span of time.
(H4) No contagiousness during home quarantine period: Patients are considered not to be infectious during the period of home isolation, given that they are unlikely to trigger community transmission while in home isolation.
(H5) Provided that there are enough beds, there will also be ample healthcare staff and medical equipment. Even in times of healthcare stress, although there may be difficulties in housing all patients, those admitted to the hospital receive appropriate care.
(H6) The capacity, contact rate, and severity conversion rate of medical resources will change with the development of the epidemic. Following the initial stage of an epidemic in a region, the rate of infection gradually peaks. A rapid increase in demand for hospital care corresponds to an increase in the demand for medical resources. This signifies the point at which the epidemic reaches its highest level. During this time, social interactions typically decrease as individuals minimise their contact with others. Simultaneously, hospitals see a marked increase in the number of severe and critical cases brought on by the novel coronavirus, compared with earlier levels. Therefore, we propose that the methods used to calculate medical resource capacity, contact rates, and severity conversion rates all change simultaneously.
(H7) Given that most individuals did not undergo nucleic acid testing following the lifting of restrictions, we consider individuals presenting symptoms similar to those of COVID-19, such as fever or cough, as new cases.
2 Data and method
2.1 Data sources
Taiyuan, the capital city of Shanxi Province, encompasses 10 administrative districts. Each district contains multiple streets, further divided into several communities, typically comprising 1,000 to 3,000 households (23). This study employed a multi-stage random sampling method, selecting two streets randomly from each district and two communities from each street. Finally, 1,200 residents were randomly chosen from each community for a questionnaire survey. The questionnaires were distributed electronically, and the selected residents completed them online. In total, 48,000 questionnaires were distributed, yielding 39,899 valid responses. The analysis provided daily new case numbers and infection rates from December 6, 2022, to January 13, 2023. According to Zhang et al. (24), Taiyuan had a total population of 5,420,957 at the end of 2022. The infection rates obtained from the survey were extrapolated to the entire population of Taiyuan to estimate the daily number of infections citywide. Data on hospitalisations and severe cases were provided by the Shanxi Provincial Health Commission through the sentinel hospital monitoring system.
2.2 Model
To highlight important differences in the separate or combined use of various control strategies within the constraints of limited healthcare resources, we constructed an model, as shown in Figure 1. We categorised the initial population into susceptible populations (), populations who had received one dose of the vaccine (), populations who had received two doses of the vaccine (), and populations who had received three or more doses of the vaccine ().In the model, and represent exposed and infected individuals, respectively, represents individuals who are under home quarantine, represents individuals who are hospitalised and confirmed, and represent the number of patients with severe and critical conditions caused by COVID-19, and the number of deaths among hospitalised patients, respectively, and represents individuals who have recovered. The detailed definitions of other parameters are given in Table 1. represents the whole population.
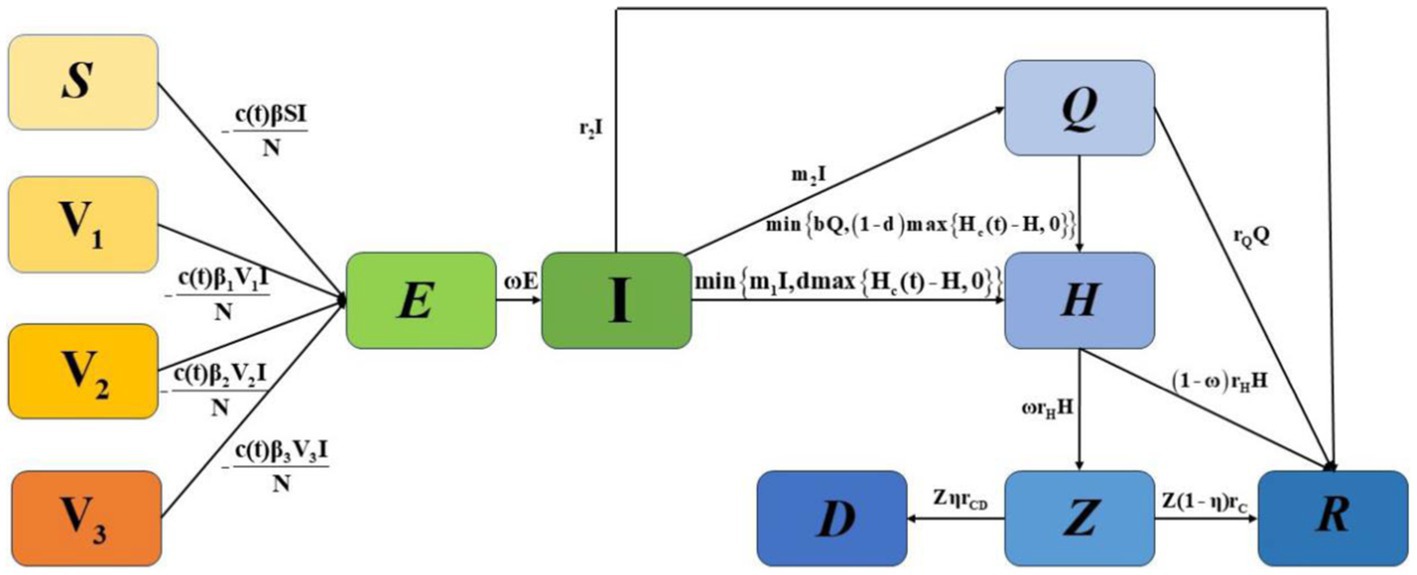
Figure 1. Transmission diagram of Omicron.
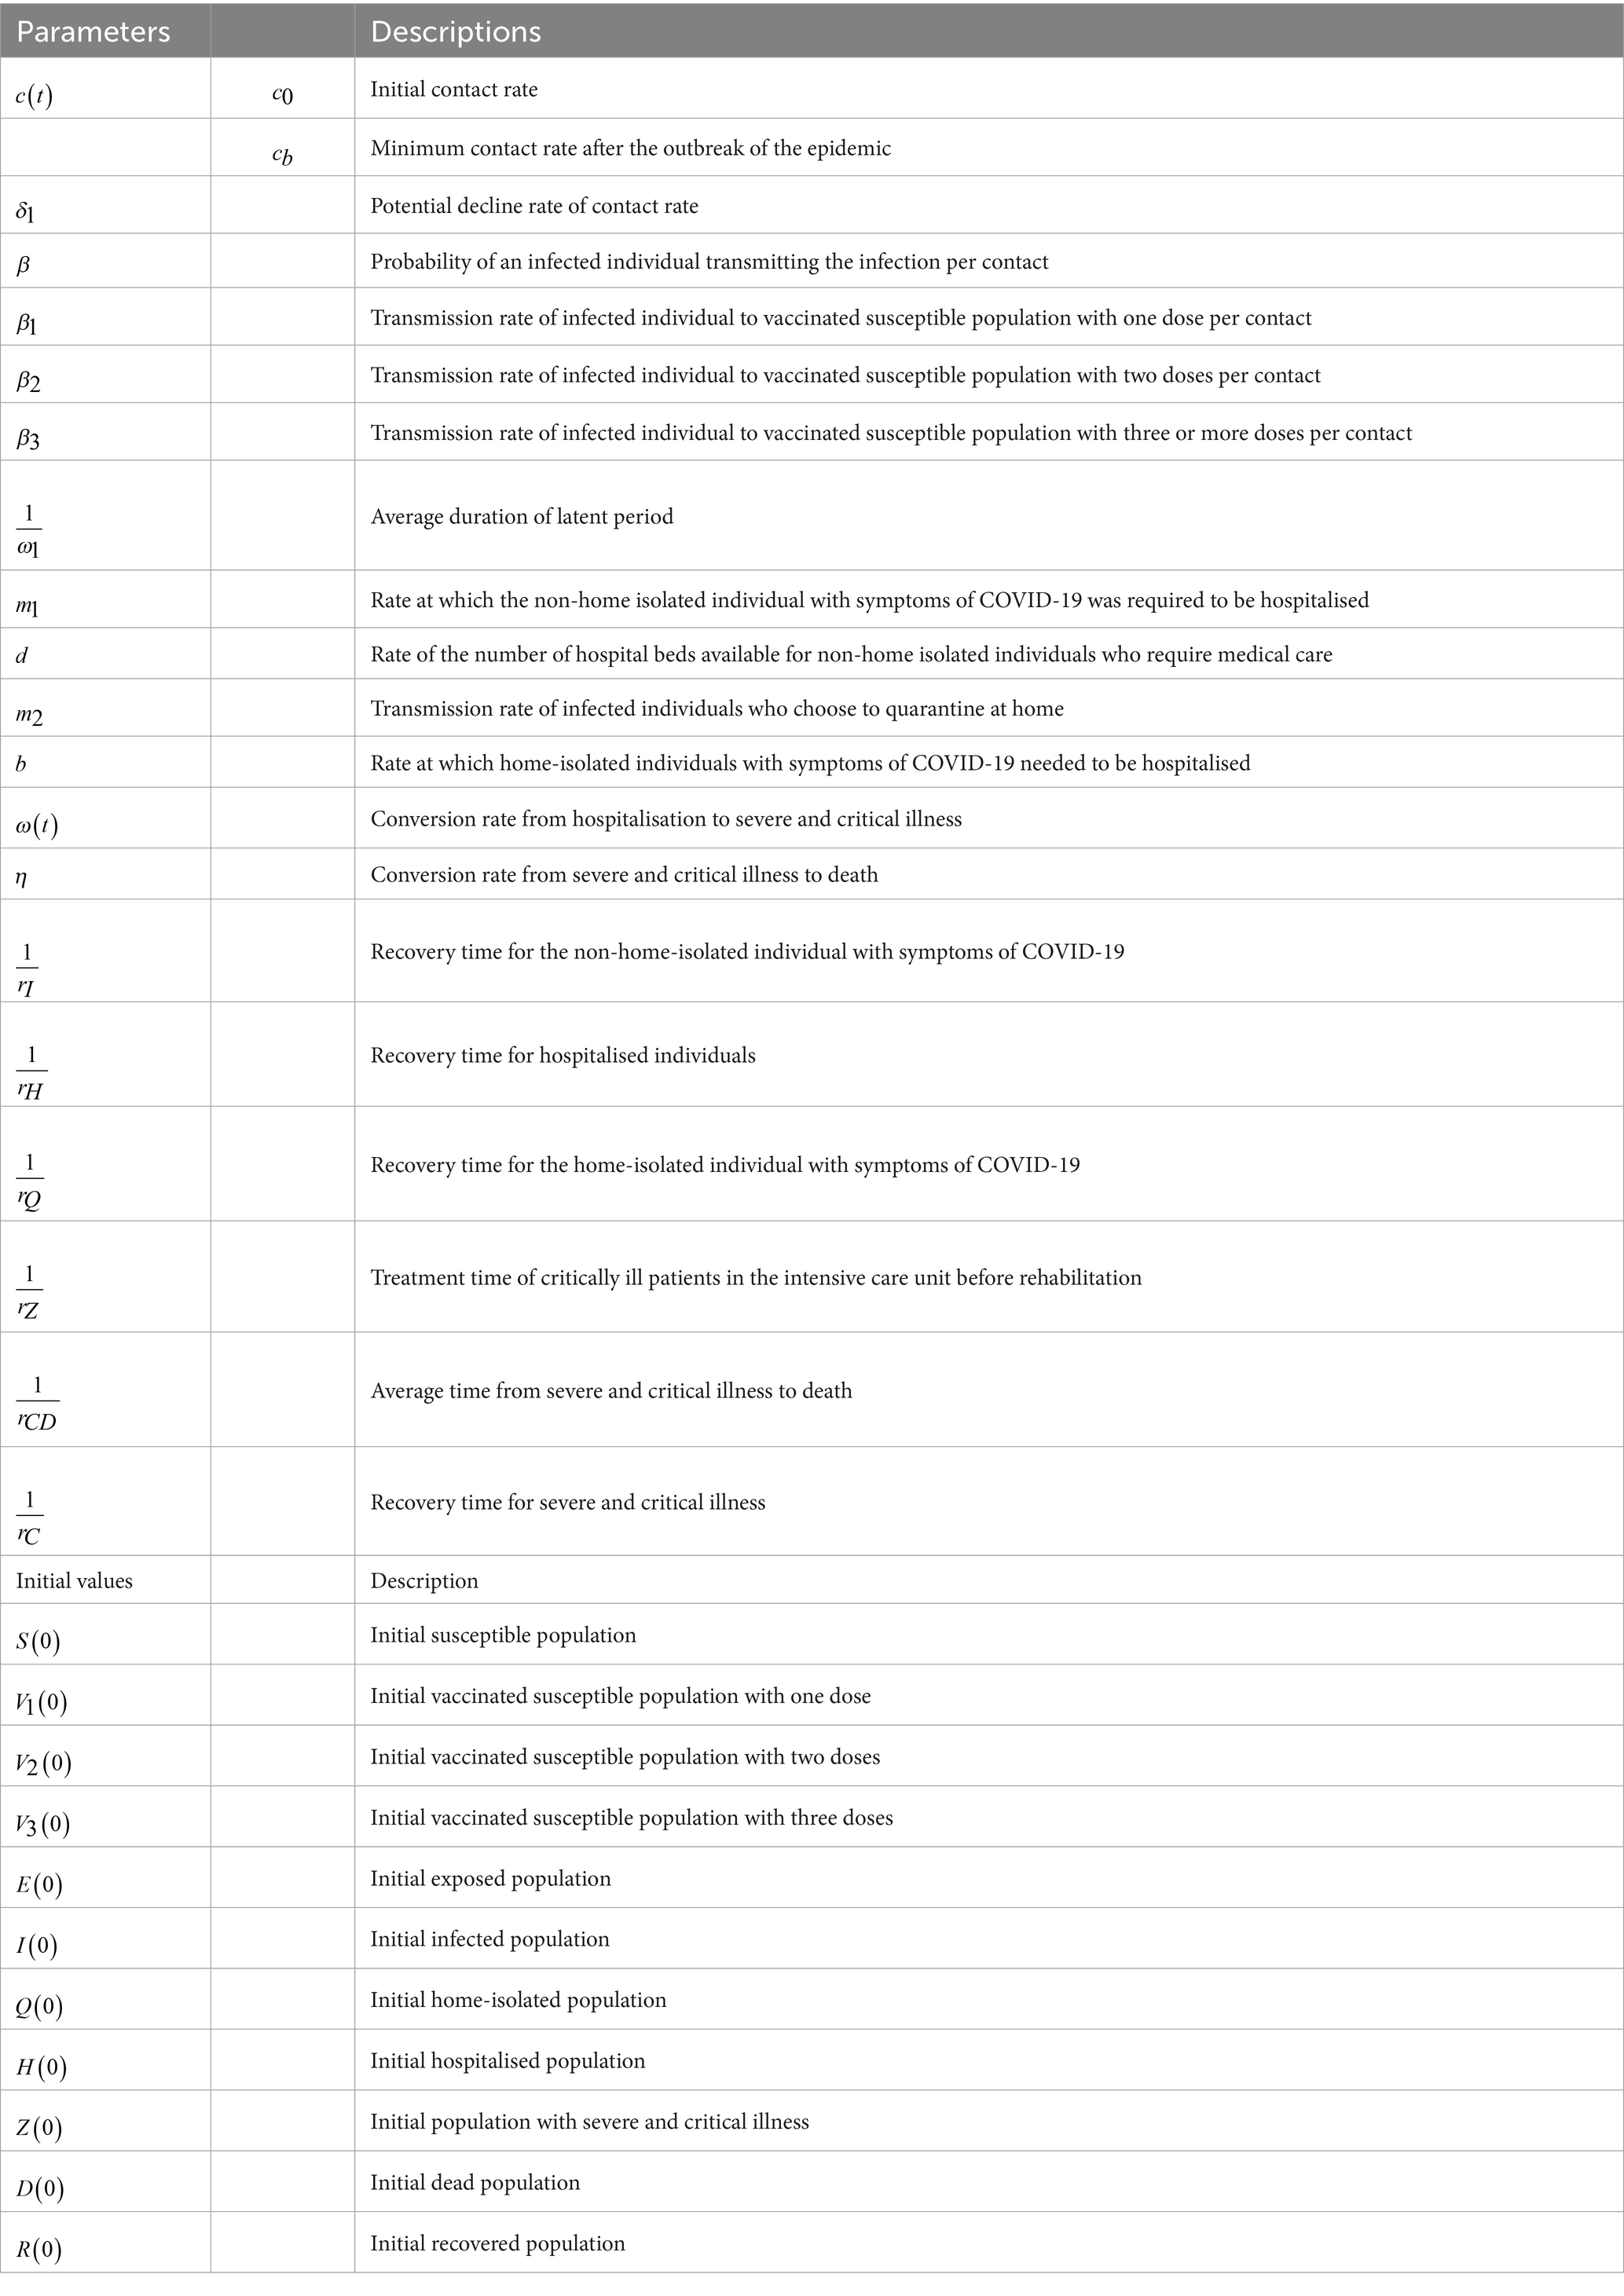
Table 1. Parameter definitions.
In Model 1, individuals in compartments , , , and are infected by at rates of , , , and , respectively, and then enter the incubation period . transitions to after days. may recover at a rate of , choose home isolation at a rate of , or be hospitalised at a rate of . Here, represents the number of people who need to be hospitalised, and is the number of hospital beds that can be allocated to them. For , a proportion of recovers, and a proportion of is hospitalised, where represents hospitalisation demand, and is the number of hospital beds that can be allocated to them. For , some of become severely ill , and a proportion of recovers. For , a proportion of dies, and a proportion of recovers. The parameters are defined in Table 1.
Government policies may change in response to the progression of the epidemic, leading to dynamic fluctuations in hospital medical resources, particularly the number of beds. Following (7), we have developed a model to analyse these changes in bed numbers using the logistic growth model:
where presents the production and allocation capacity of medical resources, and indicates the maximum number of beds available during the epidemic. Hence, these two factors indicate how well equipped the city is to respond to an outbreak of an epidemic. Reference (7) used this formula to simulate the dynamic changes in the number of beds in the study area. In the early stages of an outbreak, the count of hospital beds tends to remain relatively stable. This could be because of a lower demand for hospitalisation or a lack of clear comprehension of the need for hospital beds. Therefore, by solving the previously mentioned logistic equation, we can calculate the daily bed count using the following piecewise function (7).
where represents the initial bed capacity available for COVID-19 patients at the onset of the outbreak, and represents the pivotal moment at which the city begins to escalate its medical resources, including hospital beds. Therefore, based on actual data, we set for Taiyuan city. Thus, the daily potential number of empty beds was calculated as =max.
When the new policies related to the COVID-19 pandemic were first put into effect on 6 December, restrictions on people’s activities were lifted, leading to a marked rise in the rate of contact between individuals. This, in turn, facilitated the swift spread of the COVID-19 pandemic. Subsequently, most individuals started to isolate at home or receive treatment in hospitals, which gradually lowered the contact rates. Hence, we propose that the contact rate is a function that diminishes over time t, as suggested by Wang et al. (7).
where represents the contact rate at the initial time. Hence, =. represents the lowest contact rate given the current control strategies, and with . represents how to achieve a reduction in the rate of contact through exponential decline. Wang et al. (7) used this formula to simulate and predict the dynamic changes in the number of infected individuals in the study area.
Considering the progression of the epidemic, it is expected that the number of severe patients will rise in the later stages of the outbreak. Consequently, we use an exponential growth function to represent the conversion rate of hospitalised patients into severe cases:
where is the initial conversion rate of hospitalisation with , denotes how an exponential increase in the conversion rate of hospitalisation is achieved, and is the maximum conversion rate of hospitalisation under the current situation with .
2.3 Analysis method
This study employs the Latin hypercube sampling and Markov chain Monte Carlo (MCMC) simulations to estimate the unknown parameters and fit the reported daily new cases, hospitalisations, and severe patient numbers in Taiyuan from December 6, 2022, to January 13, 2023, with Equation 1. This approach is similar to the methods used in previous studies, such as those by Ma et al; Gamerman and Lopes; Haario et al (25–27). Utilising the ode45 function in MATLAB software, Equations 1, 2 are used to calculate the daily number of available hospital beds and conduct the sensitivity analysis.
3 Result
3.1 Parameter estimation
3.1.1 Estimation of initial value
By the end of 2022, Taiyuan’s resident population stood at 5,420,957 (24). The data gathered from the questionnaire survey suggest that the rate of individuals who received one, two, and three doses of vaccines in Taiyuan City are 1.8, 38.39, and 56.02%, respectively. Therefore, we assume , , and , respectively. Because there were 16,250 new cases on 6 December, we assume .
The incubation period of COVID-19 is 1.52 days, about one and a half days. Therefore, we assume , and thus,. Due to the relatively low number of hospitalisations, and severe and critically ill patients, as well as recoveries on 6 December, we assume .
The current research indicates that hospitalisations primarily occur in secondary and tertiary hospitals. Statistical data reveal that Taiyuan City has a total of 64 secondary and tertiary hospitals (24). As per the China Health Statistics Yearbook (2022), Taiyuan City’s medical institutions collectively have 81,400 beds spread across 164 hospitals. Therefore, we estimate that the total number of beds in 64 hospitals in Taiyuan City is . According to the Introduction to the First Hospital of Shanxi Medical University (28, 29), the number of respiratory beds is no more than .
3.1.2 Data fitting
Using the parameters and initial conditions provided above and combing with Equations 1, 4, 5, we apply Latin hypercube sampling and Markov chain Monte Carlo (MCMC) simulations to estimate the unknown parameters and fit the data. This approach is similar to the methods used in previous studies, such as those by Ma et al; Gamerman and Lopes; Haario et al (25–27). The results of our analysis are shown in Figures 2, 3 and Table 2.
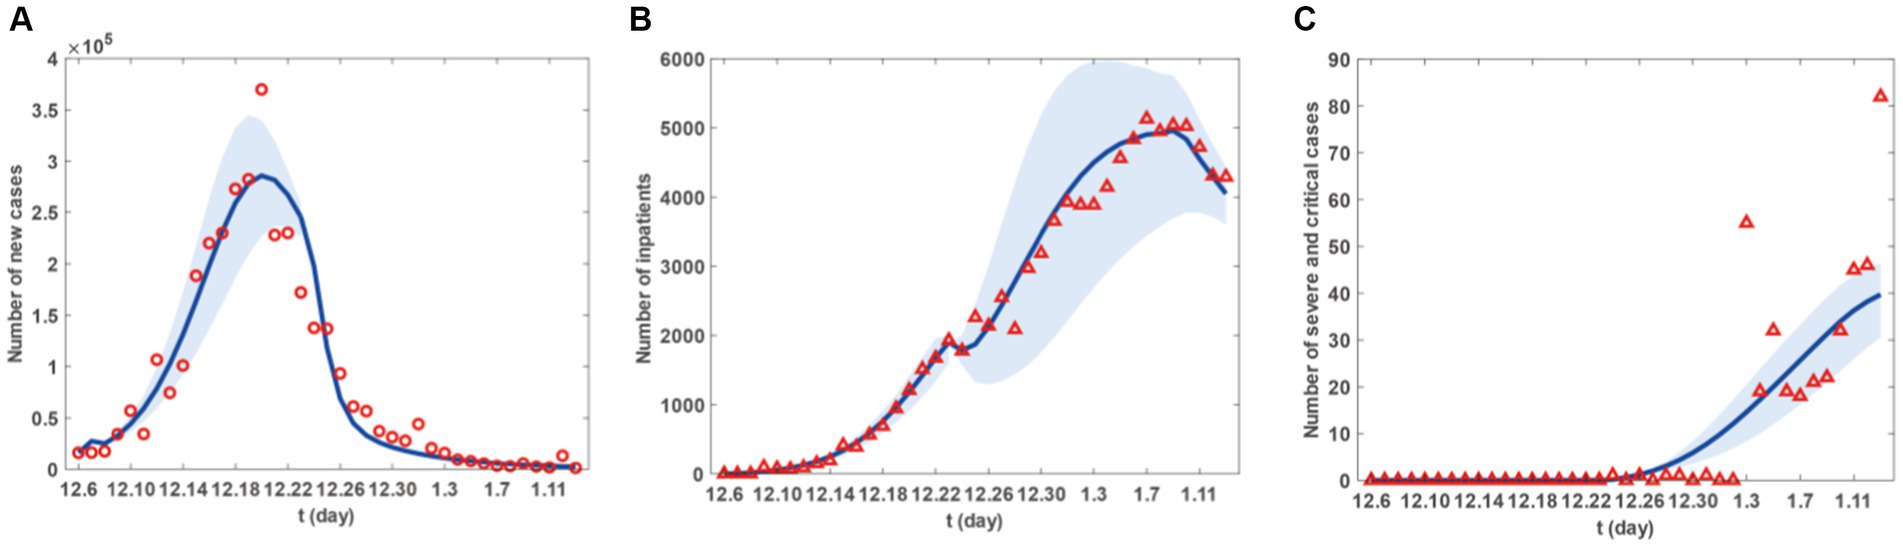
Figure 2. Fitting results of new cases, inpatients and sever and critical cases from 6 December 2022 to 13 January 2023 in Taiyuan City. (A) The red circles are the number of new cases. (B) The red triangle are the number of new inpatients. (C) The red triangles are the number of new sever and critical cases. The blue curve in (A-C) represents the corresponding estimated new cases, inpatients and sever and critical cases with the shadow areas as the corresponding 95% confidence band.
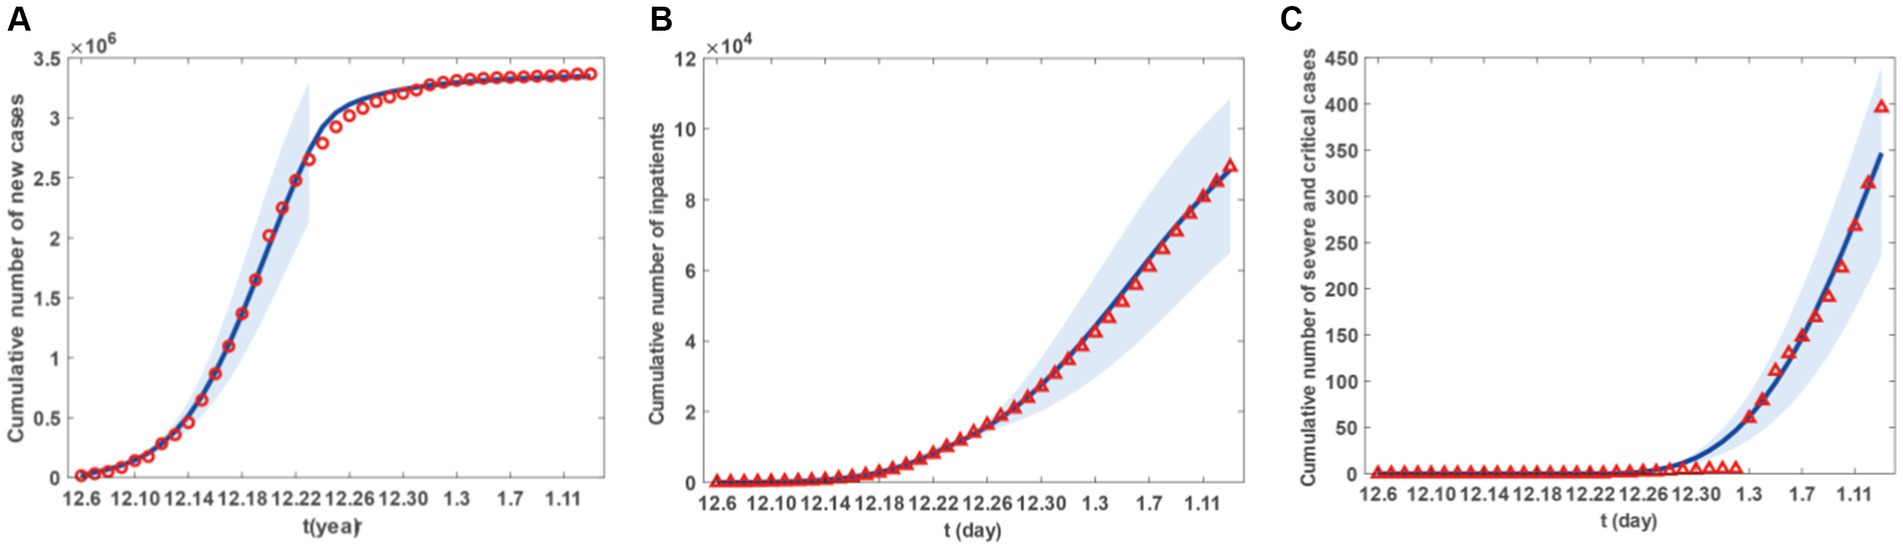
Figure 3. Fitting results of cumulative newly cases, inpatients and sever and critical cases from 6 December 2022 to 13 January 2023 in Taiyuan City. (A) The red circles are the number of cumulative newly cases. (B) The red triangles are the number of cumulative newly inpatients. (C) The red triangle are the number of cumulative newly sever and critical cases. The blue curve in (A-C) represents the corresponding estimated cumulative newly cases, inpatients and sever and critical cases with the shadow areas as the corresponding 95% confidence band.
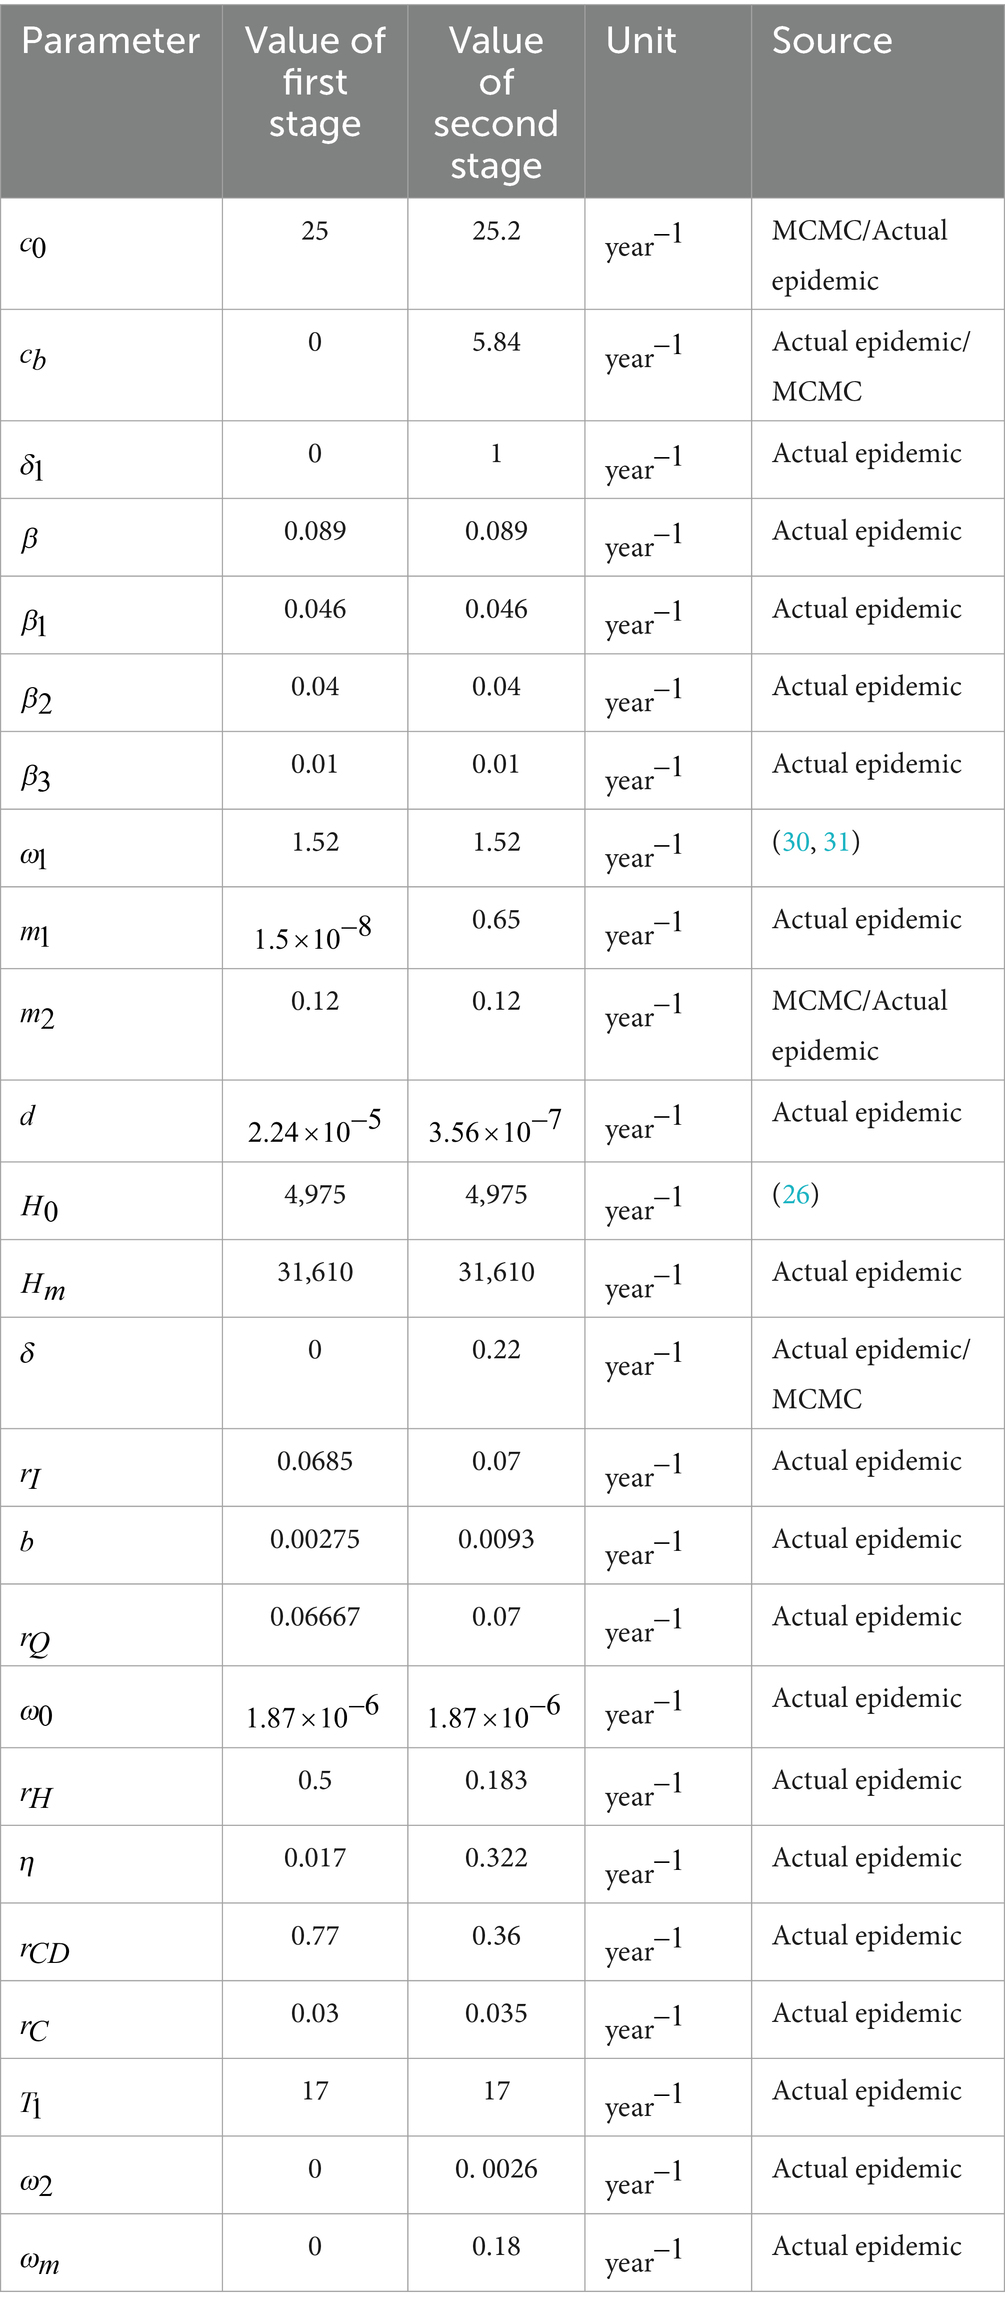
Table 2. Values of parameters.
Figure 2 presents the fitting results for the number of new cases, with Figures 2A–C representing the number of new patients, the number of new hospital admissions, and the number of new severe and critical patients, respectively. Similarly, Figure 3 displays the fitting results for the cumulative number of new cases, with Figures 3A–C representing the cumulative number of new patients, the cumulative number of new hospital admissions, and the cumulative number of new severe and critical patients, respectively. According to the fitting results, illustrated in Figures 2A, 3A, the number of new cases in Taiyuan City began to rise on December 6th, peaked around December 20th, and then gradually declined until January 13th. Figures 2B, 3B show that the number of hospitalised patients started to increase from December 6th, reached a small peak on December 23rd followed by a slight decline, but rose again from December 24th and continued until a decrease began on January 9th, lasting until January 13th. The data in Figures 2C, 3C indicate that the number of severe and critically ill patients remained at zero from December 6th to December 23rd, but began to increase from December 23rd and had not peaked by January 13th.
The decrease in the number of hospitalised patients after the small peak on December 23rd, as shown in Figure 2B, was due to the start of resource allocation on that day, as the hypothesis H6 and parameter T1, where the daily number of new patients requiring hospitalisation exceeded the number of beds available in hospitals. On December 24th, due to limited resource allocation capabilities, the number of available beds was less than the previous day, resulting in a temporary decline. Subsequently, as the number of newly allocated beds increased daily, more patients had the opportunity to be hospitalised, leading to a rise in the number of hospitalised patients until January 9th. The decline starting from January 9th was because, by that time, Taiyuan City had reached the maximum number of beds that could be allocated in the short term. Although a large number of patients still required hospitalisation, no further increase in bed numbers was possible, and new hospital admissions were mainly due to beds vacated by discharged patients.
However, as their condition deteriorates, patients may decide to seek medical help. This situation could trigger a rise in hospital admissions, compelling the government to modify its epidemic prevention strategies, such as augmenting the number of hospital beds and other medical resources to ensure that more patients receive prompt hospital care. It is important to highlight that the peak in hospital admissions did not coincide with the peak in infections but was delayed until early January. This could be because patients might only exhibit severe symptoms that necessitate hospital care some time after being infected. Therefore, there is a certain time gap between the peak of infections and the peak of hospital admissions. Moreover, the transition from hospitalised patients to severe or critical cases also takes a certain amount of time, represented by the parameter in the model. This could cause the peak of severe or critical cases to lag behind the peak of hospital admissions.
3.1.3 Calculation of the daily number of available hospital beds
Upon inserting the parameter values from Table 2 into Equation 3 and utilising the plot function in MATLAB software, we generated Figure 4. This figure illustrates a continuous decline in the daily potential number of vacant hospital beds in Taiyuan City from December 6th to December 20th. From December 20th, 2022, to January 24th, 2023, the daily potential number of vacant beds dropped to zero, indicating a possible shortage or overcrowding of medical resources. However, starting from January 24th, 2023, the number of available beds began to increase, suggesting that medical resources are gradually becoming sufficient to meet the demands of epidemic prevention and control. Figure 4 allows us to conclude that the need for hospital beds remained high until 16 January 2023. To manage the surge in hospitalisations, most hospitals in Taiyuan City reassigned beds from other departments to accommodate patients with COVID-19. While this action somewhat mitigated the bed shortage issue, the number of available beds remained at zero, owing to the high demand for hospitalisation from a large number of patients with COVID-19.
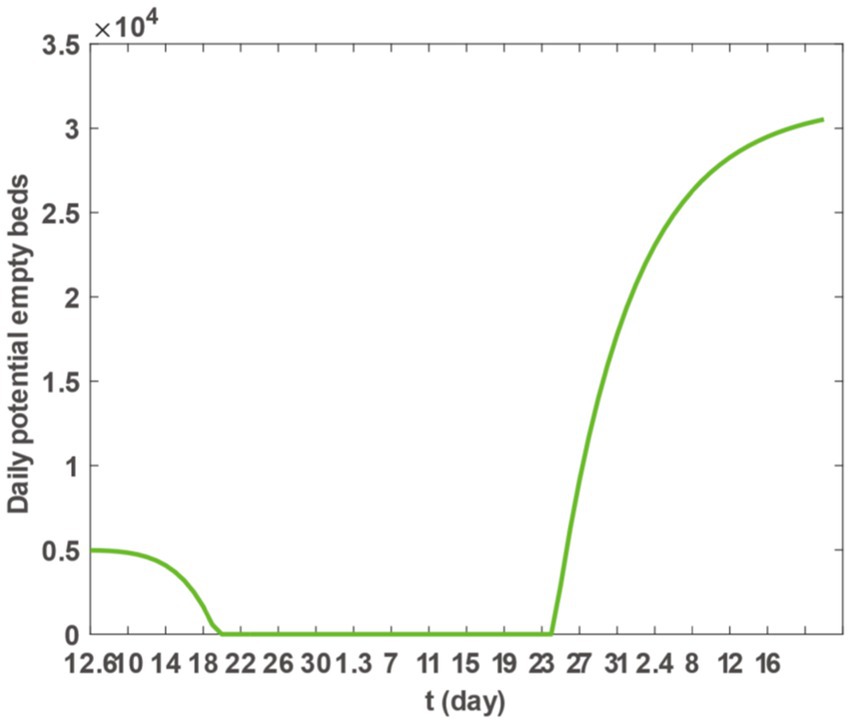
Figure 4. Theoretically, the number of daily potential empty beds.
3.2 Sensitivity analysis
3.2.1 The impact of different vaccine strategies on the final scale of infections, hospitalisations, and severe cases
First, we analyse the daily cumulative changes in new infections, hospitalised patients, severe cases, and critically ill patients in various scenarios. To highlight the effect of different vaccine doses on the final extent of disease prevalence, we constructed the following three scenarios:
(S1) The first dose of the vaccine is given to individuals who have not yet been vaccinated with the aim of ensuring that all populations have received at least one dose of the vaccine.
(S2) Individuals who are vulnerable or have only been administered one dose of the vaccine are provided with two doses of the vaccine, ensuring that all populations have received a minimum of two doses of the vaccine.
(S3) Individuals who are vulnerable or have only been administered one or two doses of the vaccine are considered fully vaccinated after receiving three doses of the vaccine. This ensures that all populations have received a minimum of three doses of the vaccine.
Based on Model 1, and incorporating the parameter values from Tables 2, 3, as well as the scenarios described previously, we utilised the ode45 function within Matlab software to generate (Figure 5). The simulation results are outlined in Figure 5 and Table 3. Increasing the count of individuals receiving one or two vaccine doses can marginally decrease the ultimate scope of infections, hospitalisations, and severe cases. However, only in S3 can the ultimate scope be effectively diminished, thus restraining the epidemic’s spread. Consequently, for Taiyuan City’s inhabitants, merely augmenting the first and second vaccine doses is insufficient to effectively mitigate the epidemic, and the coverage of the third vaccine dose must be expanded.
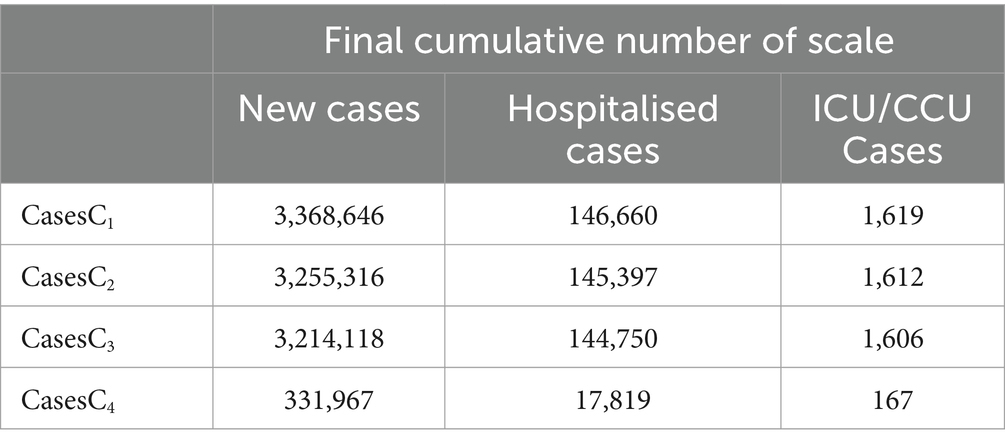
Table 3. Final cumulative numbers of new, hospitalised, and critical cases under different scenarios.
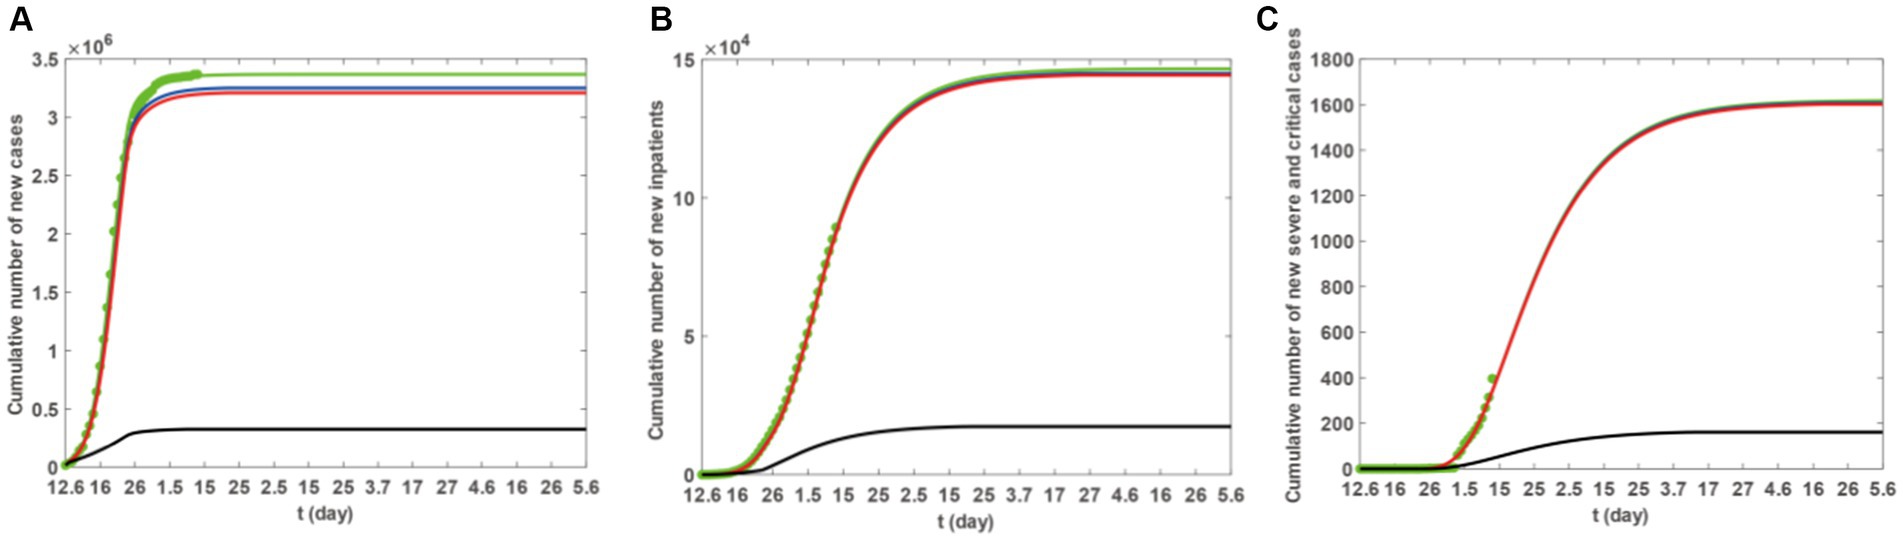
Figure 5. The blue, red, and black solid lines represent the cumulative number of new cases under scenarios S1–S3. The green solid line represents the actual fitted situation, and the green dots represent reported case numbers. (A) The trend in the cumulative number of new cases. (B) The trend in the cumulative number of hospitalisations. (C) The trend in the cumulative number of severe cases.
3.2.2 The impact of different vaccination scenarios on the duration of medical crowding
The data from Figure 5 and Table 3 indicate that ensuring that individuals in Taiyuan City who have received one vaccine dose as well as those who have not been vaccinated update their vaccination status to two doses results in a decrease in the final count of infections, hospitalisations, and severe cases. However, this reduction is relatively minor, and the difference is not significant. In contrast, ensuring that all residents of Taiyuan City receive three doses of the vaccine will significantly lower the number of infections, hospitalisations, and severe cases. Consequently, we further analyse the availability of empty beds in Taiyuan City under various three-dose vaccination strategies, taking into account the actual conditions in Taiyuan City. The specific strategies are as follows:
() Prior to 6 December, both the unvaccinated individuals and those who have only received one dose of the vaccine have now completed two doses of vaccination. (All subsequent scenarios are based on this situation).
() Prior to 6 December, an extra 500,000 individuals who had previously received only two doses of the vaccine have now completed a course of three doses.
() Prior to 6 December, an extra 1 million individuals who had previously received only two doses of the vaccine had completed a third dose of vaccination.
() Prior to 6 December, an extra 1.5 million individuals, who had previously only received two doses of the vaccine, had completed a course of three doses.
() Prior to 6 December, all individuals who had previously received only two doses of the vaccine had completed a third dose.
Based on Model 1, and incorporating the parameter values from Tables 2, 3, as well as the scenarios described previously, we utilised the ode45 function within Matlab software to generate (Figure 6). The findings presented in Figure 6 indicate that augmenting the third dose of vaccination can effectively postpone the onset of medical resource strain and reduce its duration. This strategy is beneficial in promptly resolving the scarcity of medical resources.
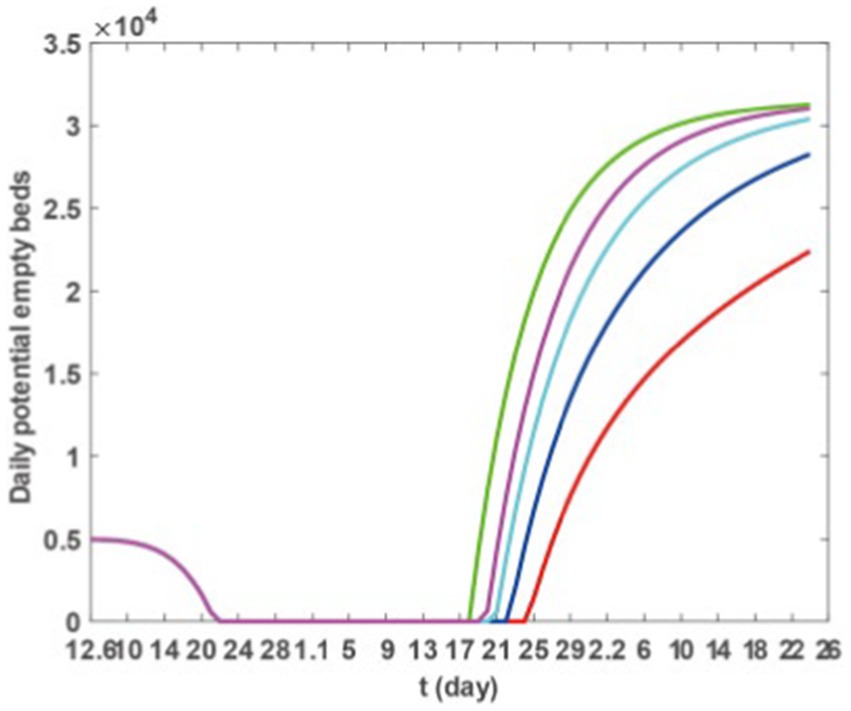
Figure 6. Theoretically, the number of empty beds. Green, blue, black, red, and yellow solid lines represent SS1–SS5, respectively.
3.2.3 The impact of medical resource related factors on the time of medical crowding
Based on Model 1 and the parameter values listed in Tables 2, 3, we utilise the ode45 function in Matlab software to explore how the maximum number of available beds, the initial number of beds, and the capacity for medical resource allocation affect the timing of medical congestion. The results are presented in Figures 7A–C. Figure 7A demonstrates that by increasing the maximum number of available beds (), the duration of medical crowding can be reduced. However, this does not postpone the onset of medical resource shortages. Furthermore, after the epidemic has passed, there may be some wastage associated with the increased resources. Figure 7B shows that increasing the number of beds at the initial moment can delay the onset of medical resource shortages when the epidemic begins. However, once medical resource shortages occur, it may not bring an earlier end to the shortages. Figure 7C reveals that if the medical resource allocation capacity of Taiyuan City decreases, medical resource shortages will persist for a longer duration. Therefore, the current allocation capacity may be the most cost-effective state.
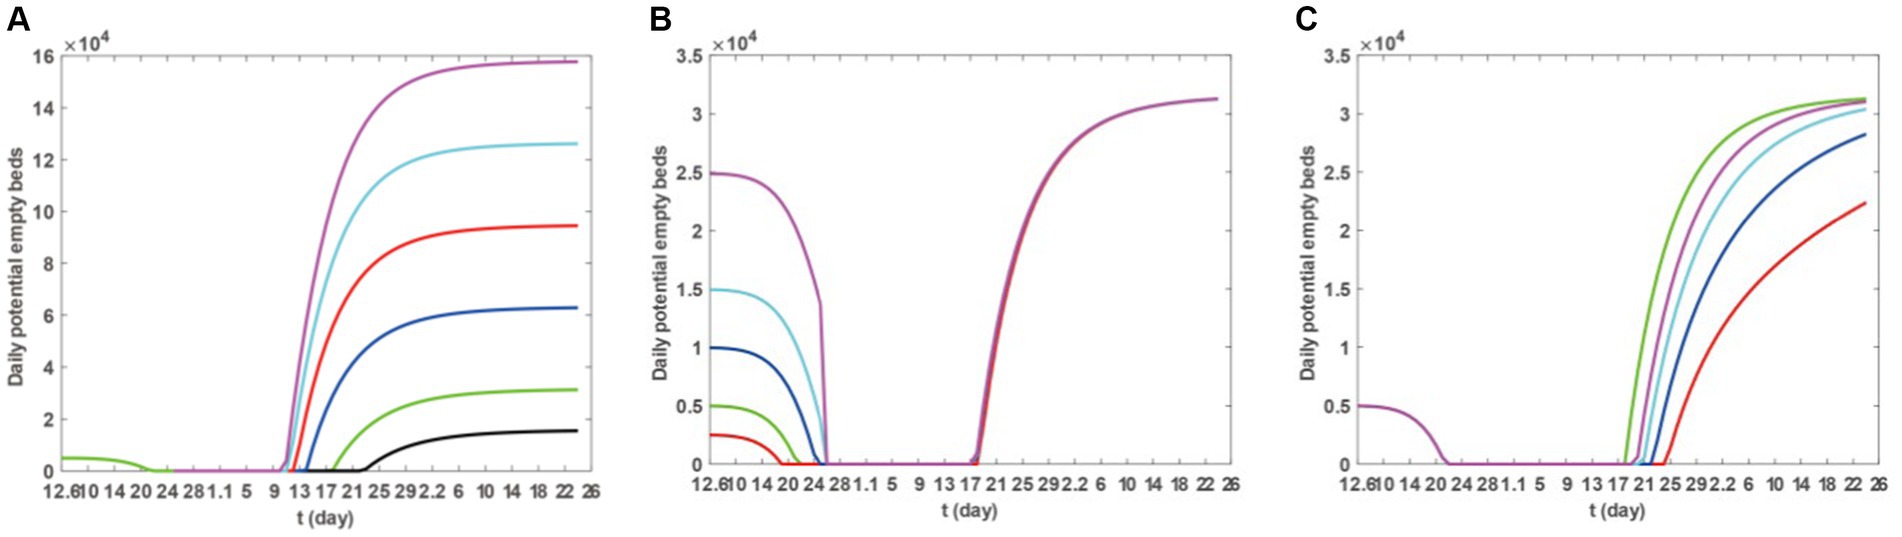
Figure 7. Sensitivity of the number of daily potential empty beds to the maximum bed capacity that can be provided, the initial number of respiratory department beds at the beginning and the production capability of medical resources. For (A), the purple, cyan, red, blue, black, and green colours, respectively, represent the number of available beds under the scenarios of 5*Hm, 4*Hm, 3*Hm, 2*Hm, 1.5*Hm, 0.5*Hm, and Hm. For (B), the magenta, cyan, blue, red, and green curves, respectively, represent the scenarios of 5*H0, 3*H0, 2*H0, 0.5*H0, and H0. For (C), the cyan, black, red, blue and green curves, respectively, represent the number of available beds under the scenarios of 0.5*δ, 0.4*δ, 0.3*δ, 0.2*δ, and δ.
4 Discussion and conclusion
During widespread outbreaks of acute infectious disease, the strain on medical resources is a common phenomenon and has garnered extensive attention and research from numerous scholars (3, 7, 19, 20, 32–36, 39). Taking COVID-19 as a case study, we investigate the impact of vaccination and resource allocation on the epidemic trends and CCMR during such outbreaks. Based on survey data on COVID-19 transmission in Taiyuan, we constructed a dynamic model to fit the daily reported new cases, hospitalised patients, and severe cases (as shown in Figures 2, 3), and estimated parameters (as shown in Table 2), predicting the ultimate scale of the epidemic (indicated by the solid green line in Figure 5). By calculating the trend of remaining bed numbers, we can determine the occurrence and duration of medical congestion. As shown in Figure 2, the peak times for new cases, hospitalizations, and severe cases typically lag in succession. Some existing research (37, 38) can fully support our conclusion. For instance, research by Wang et al. (37) reported that during the COVID-19 outbreak in Wuhan, the median time from the onset of initial symptoms to hospital admission for 260 patients was approximately 8 days; C Dananché and colleagues (38) noted that younger COVID-19 patients tended to have a longer interval between the onset of symptoms and hospitalization. Figure 4 indicates that until January 16, 2023, the demand for hospital beds remained high. To address the sharp increase in hospital admissions, most hospitals in Taiyuan City reallocated beds from other departments to accommodate COVID-19 patients, alleviating the bed shortage, but the continuous high demand for hospitalisation by COVID-19 patients temporarily reduced the number of available beds to zero.
In the sensitivity analysis, we first examined the impact of different vaccination scenarios on the numbers of infections, hospitalisations, and severe cases, as well as the change in the number of availible beds in an ideal vaccination scenario, reflecting the influence of vaccination on medical congestion. We further analysed the specific impact of vaccination on the CCMR. The data from Figures 5 and Table 3 suggests that vaccination can diminish the scope of infections and hospitalisations and reduce severe cases. Figure 6 further illustrates that a vaccination regimen of increasing three doses of vaccine can notably shorten the duration of medical congestion, and enhance the capacity of medical resources. Subsequently, we explored the influence of medical resource-related factors on the duration of medical congestion, as detailed in Figure 7. Figure 7A demonstrates that increasing the maximum number of available beds can end medical congestion earlier. Figure 7B reveals that increasing the number of maximum capacity of hospital beds at the onset of the epidemic can delay medical resource shortages but does not end the shortage earlier. Figure 7C indicates that under a fixed total amount of medical resources, higher efficiency in resource allocation can end medical congestion earlier. In other words, before the outbreak of an epidemic, preparation should begin in advance by increasing the number of beds, equipping medical professionals, and increasing medical supplies. During the outbreak, efforts should be made to accelerate the production and distribution of medical supplies and the deployment of medical professionals.
The capability, quantity, and timing of resource allocation significantly influence the occurrence, development, and closing time of CCMR overload. Thus, a thorough consideration of vaccination and medical resource allocation becomes imperative. In contrast to Wang et al. (7), our research delineates diverse vaccination scenarios and analyses their impact on the CCMR. In contrast to Mandal (19) and Zhao (20), we not only predicted the trend of COVID-19 transmission in Taiyuan but also anticipated potential medical congestion and its duration. Compared to Ali et al. (21), we used the model to validate the effectiveness of vaccination and explore the impact of different dosing regimens on medical congestion. Our study used the number of beds as a quantitative indicator of medical resource capacity. However, the CCMR is affected by multiple factors such as medical staff, ventilators, and patient’s hospital preference, which will be addressed in future research. Additionally, our study only considered symptomatic individuals as transmission sources. Future investigations should delve into transmission from asymptomatic and incubation period infections. Therefore, future research may need to consider these factors to improve the accuracy and applicability of the model. Current research focuses primarily on prevention and control strategies for COVID-19 (3, 7, 32–36). Given the constraint of limited medical resources, future research should concentrate on how to combine vaccination and the enhancement of CCMR to alleviate medical congestion and improve local medical resource capacity.
Data availability statement
The original contributions presented in the study are included in the article/supplementary material, further inquiries can be directed to the corresponding authors.
Author contributions
JG: Conceptualization, Investigation, Methodology, Software, Visualization, Writing – original draft. YL: Data curation, Formal analysis, Investigation, Project administration, Validation, Writing – review & editing. YM: Writing – review & editing. SX: Validation, Writing – review & editing. JL: Validation, Writing – review & editing. TW: Writing – review & editing. LL: Writing – review & editing. LH: Writing – review & editing. HY: Formal analysis, Project administration, Writing – review & editing. JX: Data curation, Formal analysis, Funding acquisition, Investigation, Methodology, Project administration, Resources, Software, Supervision, Validation, Writing – review & editing.
Funding
The author(s) declare that financial support was received for the research, authorship, and/or publication of this article. This work was supported by the National Key Research and Development Program of China (2021YFC2301603), the Major Science and Technology Project of Shanxi Province (202102130501003 and 202005D121008), the Special Foundation on COVID-19 of the Shanxi Health Commission (16), the Key Laboratory of Coal Environmental Pathogenicity and Prevention (Shanxi Medical University), the Ministry of Education of China, the Graduate Education Innovation Project of Shanxi Province (2023KY363), and the Key Laboratory of Shanxi Province for Prevention, Control, and Treatment of Major Infectious Diseases - Novel Coronavirus Infection Scientific Research Projects after the implementation of the ‘Class B infectious disease Class B management’ policy.
Acknowledgments
We thank all of the residents of Shanxi Province who took their valuable time to fill out the questionnaire.
Conflict of interest
The authors declare that the research was conducted in the absence of any commercial or financial relationships that could be construed as a potential conflict of interest.
Publisher’s note
All claims expressed in this article are solely those of the authors and do not necessarily represent those of their affiliated organizations, or those of the publisher, the editors and the reviewers. Any product that may be evaluated in this article, or claim that may be made by its manufacturer, is not guaranteed or endorsed by the publisher.
References
1. Andronico, A, Menudier, L, Salje, H, Vincent, M, Paireau, J, de Valk, H, et al. Comparing the performance of three models incorporating weather data to forecast dengue epidemics in Reunion Island, 2018–2019. J Infect Dis. (2023) 229:10–8. doi: 10.1093/infdis/jiad468
2. Peeri, NC, Shrestha, N, Rahman, MS, Zaki, R, Tan, Z, Bibi, S, et al. The SARS, MERS and novel coronavirus (COVID-19) epidemics, the newest and biggest global health threats: what lessons have we learned? Int J Epidemiol. (2020) 49:717–26. doi: 10.1093/ije/dyaa033
3. Ma, X, Luo, XF, Li, L, Li, Y, and Sun, GQ. The influence of mask use on the spread of COVID-19 during pandemic in New York City. Results Phys. (2022) 34:105224. doi: 10.1016/j.rinp.2022.105224
4. Bhaskaran, K, Rentsch, CT, Hickman, G, Hulme, WJ, Schultze, A, Curtis, HJ, et al. Overall and cause-specific hospitalisation and death after COVID-19 hospitalisation in England: a cohort study using linked primary care, secondary care, and death registration data in the OpenSAFELY platform. PLoS Med. (2022) 19:e1003871. doi: 10.1371/journal.pmed.1003871
5. Wiemken, TL, Khan, F, Puzniak, L, Yang, W, Simmering, J, Polgreen, P, et al. Seasonal trends in COVID-19 cases, hospitalizations, and mortality in the United States and Europe. Sci Rep. (2023) 13:3886. doi: 10.1038/s41598-023-31057-1
6. Cheyne, A, Muchamore, I, Tulunay, H, Rojek, A, Peto, L, and Horby, P. Community involvement in an outbreak–one year on for MPOX. Clin Infect Dis. (2023) 79:278–80. doi: 10.1093/cid/ciad745
7. Wang, X, Li, Q, Sun, X, He, S, Xia, F, Song, P, et al. Effects of medical resource capacities and intensities of public mitigation measures on outcomes of COVID-19 outbreaks. BMC Public Health. (2021) 21:605. doi: 10.1186/s12889-021-10657-4
8. Stöß, C, Steffani, M, Kohlhaw, K, Rudroff, C, Staib, L, Hartmann, D, et al. The COVID-19 pandemic: impact on surgical departments of non-university hospitals. BMC Surg. (2020) 20:313–9. doi: 10.1186/s12893-020-00970-x
9. Schlein, L. (2020). WHO Warns of Severe Global Shortage of Nurses | Voice of America – English. Available at: https://www.voanews.com/a/science-health_coronavirus-outbreak_who-warns-severe-global-shortagenurses/6187104.html (Accessed June 10, 2022).
10. Thomas, SJ, Moreira ED Jr,, Kitchin, N, Absalon, J, Gurtman, A, Lockhart, S, et al. Safety and efficacy of the BNT162b2 mRNA COVID-19 vaccine through 6 months. N Engl J Med. (2021) 385:1761–73. doi: 10.1056/NEJMoa2110345
11. Lipsitch, M, and Dean, NE. Understanding COVID-19 vaccine efficacy. Science. (2020) 370:763–5. doi: 10.1126/science.abe5938
12. Gaoshibei Town People's Government (2021). The latest release of Qianjiang Disease Control and Prevention: the proposal on the enhanced dose (the third dose) of COVID-19 vaccine. Website of Gaoshibei Town People's Government. 2021/31/10. Available at: https://www.hbqj.gov.cn/gsbz/zfxxgk/fdzdgknr/gysyjs_34501/wsjk/202111/t20211103_3842510.html (Accessed March 21, 2023)
13. Chen, B, Zhao, Y, Jin, Z, He, D, and Li, H. Twice evasions of Omicron variants explain the temporal patterns in six Asian and oceanic countries. BMC Infect Dis. (2023) 23:25. doi: 10.1186/s12879-023-07984-9
14. Oh, J, Apio, C, and Park, T. Mathematical modeling of the impact of Omicron variant on the COVID-19 situation in South Korea. Genom Inform. (2022) 20:e22. doi: 10.5808/gi.22025
15. Wang, J, Chan, YC, Niu, R, Wong, EWM, and van Wyk, MA. Modeling the impact of vaccination on COVID-19 and its delta and Omicron variants. Viruses. (2022) 14:1482. doi: 10.3390/v14071482
16. Fiest, KM, Krewulak, KD, Plotnikoff, KM, Kemp, LG, Parhar, KKS, Niven, DJ, et al. Allocation of intensive care resources during an infectious disease outbreak: a rapid review to inform practice. BMC Med. (2020) 18:404. doi: 10.1186/s12916-020-01871-9
17. Yadav, T, Kumar, S, Mishra, G, and Saxena, SK. Tracking the COVID-19 vaccines: the global landscape. Hum Vaccin Immunother. (2023) 19:2191577. doi: 10.1080/21645515.2023.2191577
18. Patalon, T, Saciuk, Y, Peretz, A, Perez, G, Lurie, Y, Maor, Y, et al. Waning effectiveness of the third dose of the BNT162b2 mRNA COVID-19 vaccine. Nat Commun. (2022) 13:3203. doi: 10.1038/s41467-022-30884-6
19. Mandal, M, Jana, S, Nandi, SK, Khatua, A, Adak, S, and Kar, TK. A model-based study on the dynamics of COVID-19: prediction and control. Chaos, Solitons Fractals. (2020) 136:109889. doi: 10.1016/j.chaos.2020.109889
20. Zhao, S, and Chen, H. Modeling the epidemic dynamics and control of COVID-19 outbreak in China. Quant Biol. (2020) 8:11–9. doi: 10.1007/s40484-020-0199-0
21. Ali, A, Ullah, S, and Khan, MA. The impact of vaccination on the modeling of COVID-19 dynamics: a fractional order model. Nonlinear Dynam. (2022) 110:3921–40. doi: 10.1007/s11071-022-07798-5
22. Silva, PJS, Sagastizábal, C, Nonato, LG, Struchiner, CJ, and Pereira, T. Optimized delay of the second COVID-19 vaccine dose reduces ICU admissions. Proc Natl Acad Sci. (2021) 118:e2104640118. doi: 10.1073/pnas.2104640118
23. Beijing Municipal Development and Reform Commission (2007). Community Construction Plan for the 15th Five Year Plan Period in Beijing. Official website of Beijing Municipal Development and Reform Commission. 2007/5/11. Available at: https://fgw.beijing.gov.cn/fzggzl/sswgh2016/ghhg/201912/t20191227_1523449.html (Accessed March 23, 2023)
24. Zhang, X, Zhang, J, Cao, L, Wei, Y, Qin, J, Liu, W, et al. Shanxi statistical yearbook. Beijing: China Statistics Press (2022).
25. Ma, Y, Xu, S, Luo, Y, Qin, Y, Li, J, Lei, L, et al. Epidemiological characteristics and transmission dynamics of the COVID-19 outbreak in Hohhot, China: a time-varying SQEIAHR model analysis. Front Public Health. (2023) 11:1175869. doi: 10.3389/fpubh.2023.1175869
26. Gamerman, D, and Lopes, HF. Markov chain Monte Carlo: Stochastic simulation for Bayesian inference. New York: CRC press (2006).
27. Haario, H, Laine, M, Mira, A, and Saksman, E. DRAM: efficient adaptive MCMC. Stat Comput. (2006) 16:339–54. doi: 10.1007/s11222-006-9438-0
28. Department of Respiratory and Critical Care Medicine at the First Hospital of Shanxi Medical University. Available at: https://www.sydyy.com/info/1239/10105.htm
29. National Health and Family Planning Commission of the Ministry of Agriculture of China. Available at: http://dkxy.shzu.edu.cn/2016/1122/c3182a85716/page.htm
30. Cai, J, Deng, X, Yang, J, Sun, K, Liu, H, Chen, Z, et al. Modeling transmission of SARS-CoV-2 Omicron in China. Nat Med. (2022) 28:1468–75. doi: 10.1038/s41591-022-01855-7
31. Sun, GQ, Ma, X, Zhang, Z, Liu, QH, and Li, BL. What is the role of aerosol transmission in SARS-CoV-2 Omicron spread in Shanghai? BMC Infect Dis. (2022) 22:880. doi: 10.1186/s12879-022-07876-4
32. Nuzzo, JB, Meyer, D, Snyder, M, Ravi, SJ, Lapascu, A, Souleles, J, et al. What makes health systems resilient against infectious disease outbreaks and natural hazards? Results from a scoping review. BMC Public Health. (2019) 19:1310. doi: 10.1186/s12889-019-7707-z
33. Pei, Z, Yuan, Y, Yu, T, and Li, N. Dynamic allocation of medical resources during the outbreak of epidemics. IEEE Trans Autom Sci Eng. (2021) 19:663–76. doi: 10.1109/TASE.2021.3102491
34. Ma, Y, Xu, S, An, Q, Qin, M, Li, S, Lu, K, et al. Coronavirus disease 2019 epidemic prediction in Shanghai under the dynamic zero-COVID policy using time-dependent SEAIQR model. J Biosaf Biosecur. (2022) 4:105–13. doi: 10.1016/j.jobb.2022.06.002
35. Ma, Y, Xu, S, Luo, Y, Li, J, Lei, L, He, L, et al. Model-based analysis of the incidence trends and transmission dynamics of COVID-19 associated with the Omicron variant in representative cities in China. BMC Public Health. (2023) 23:2400. doi: 10.1186/s12889-023-17327-7
36. Marino, S, Hogue, IB, Ray, CJ, and Kirschner, DE. A methodology for performing global uncertainty and sensitivity analysis in systems biology. J Theor Biol. (2008) 254:178–96. doi: 10.1016/j.jtbi.2008.04.011
37. Wang, J, Zheng, X, and Chen, J. Clinical progression and outcomes of 260 patients with severe COVID-19: an observational study. Sci Rep. (2021) 11:3166. doi: 10.1038/s41598-021-82943-5
38. Dananché, C, Elias, C, Hénaff, L, Amour, S, Kuczewski, E, Gustin, M-P, et al. Baseline clinical features of COVID-19 patients, delay of hospital admission and clinical outcome: a complex relationship. PLoS One. (2022) 17:e0261428. doi: 10.1371/journal.pone.0261428
Keywords: COVID-19, carrying capacity of medical resource, vaccination, medical resource allocation, infectious disease outbreak management, China
Citation: Guo J, Luo Y, Ma Y, Xu S, Li J, Wang T, Lei L, He L, Yu H and Xie J Assessing the impact of vaccination and medical resource allocation on infectious disease outbreak management: a case study of COVID-19 in Taiyuan City. Front. Public Health. 12:1368876. doi: 10.3389/fpubh.2024.1368876
Edited by:
Ozgur Karcioglu, University of Health Sciences (Turkey), TürkiyeReviewed by:
Alexandre Morais Nunes, University of Lisbon, PortugalLaura Panattoni, PRECISIONheor, United States
*Correspondence: Jun Xie, anVueGllc3htdUAxNjMuY29t; Hongmei Yu, eXVAc3htdS5lZHUuY24=