 Leyuan Meng1
 Ping Zhu
 Kaijian Xia
- 1Department of Respiratory and Critical Care Medicine, Affiliated Hospital of Nantong University, Medical School of Nantong University, Jiangsu, Nantong, China
- 2Department of Scientific Research, The Changshu Affiliated Hospital of Soochow University, Jiangsu, Suzhou, China
- 3Changshu Key Laboratory of Medical Artificial Intelligence and Big Data, Jiangsu, Suzhou, China
Background and objective: Accurately predicting the extent of lung tumor infiltration is crucial for improving patient survival and cure rates. This study aims to evaluate the application value of an improved CT index combined with serum biomarkers, obtained through an artificial intelligence recognition system analyzing CT features of pulmonary nodules, in early prediction of lung cancer infiltration using machine learning models.
Patients and methods: A retrospective analysis was conducted on clinical data of 803 patients hospitalized for lung cancer treatment from January 2020 to December 2023 at two hospitals: Hospital 1 (Affiliated Changshu Hospital of Soochow University) and Hospital 2 (Nantong Eighth People’s Hospital). Data from Hospital 1 were used for internal training, while data from Hospital 2 were used for external validation. Five algorithms, including traditional logistic regression (LR) and machine learning techniques (generalized linear models [GLM], random forest [RF], gradient boosting machine [GBM], deep neural network [DL], and naive Bayes [NB]), were employed to construct models predicting early lung cancer infiltration and were analyzed. The models were comprehensively evaluated through receiver operating characteristic curve (AUC) analysis based on LR, calibration curves, decision curve analysis (DCA), as well as global and individual interpretative analyses using variable feature importance and SHapley additive explanations (SHAP) plots.
Results: A total of 560 patients were used for model development in the training dataset, while a dataset comprising 243 patients was used for external validation. The GBM model exhibited the best performance among the five algorithms, with AUCs of 0.931 and 0.99 in the validation and test sets, respectively, and accuracies of 0.857 and 0.955 in the validation and test groups, respectively, outperforming other models. Additionally, the study found that nodule diameter and average CT value were the most significant features for predicting lung cancer infiltration using machine learning models.
Conclusion: The GBM model established in this study can effectively predict the risk of infiltration in early-stage lung cancer patients, thereby improving the accuracy of lung cancer screening and facilitating timely intervention for infiltrative lung cancer patients by clinicians, leading to early diagnosis and treatment of lung cancer, and ultimately reducing lung cancer-related mortality.
1 Introduction
Lung cancer is globally recognized as one of the malignancies with the highest incidence and mortality rates. According to the 2022 global cancer statistics survey, an average of approximately 350 individuals die from lung cancer every day, surpassing the combined total of breast, prostate, and pancreatic cancers. In China, lung cancer deaths account for 23.8% of the total cancer-related deaths, with the incidence and mortality rates ranking highest globally (1). Due to factors such as existing medical conditions and awareness of check-ups, many patients are diagnosed with late-stage lung cancer during their initial medical visits. Effective treatment options for late-stage lung cancer are limited, with a 5-year cumulative survival rate of only 19% (2). Early screening significantly improves the prognosis and survival of lung cancer patients (3), so early screening and diagnosis is the key to reduce lung cancer mortality and improve survival rate.
Currently, there is a lack of effective early screening methods, with emphasis placed on low-dose spiral computed tomography (LDCT) scans, biological tumor markers, and tumor autoantibody screening (4). However, these methods suffer from drawbacks such as high false positive rates, inadequate sensitivity, and suboptimal accuracy. Therefore, we attempt to accurately predict tumor malignancy and infiltration depth using an improved CT index obtained through artificial intelligence recognition technology combined with serum biomarkers consisting of lung cancer autoantibodies and tumor markers. This approach aims to assist clinicians in making more informed treatment decisions and improving patient survival benefits.
Machine learning, as a subset of artificial intelligence, has shown remarkable prospects in various fields such as economics, finance, business management, and bioinformatics. In the healthcare sector, it demonstrates outstanding applications in analyzing disease-related factors, predicting risks, and computer-aided diagnosis (5–7). Automated machine learning (AutoML) automates the application of machine learning to data by iteratively transforming data, selecting machine learning algorithms, and optimizing hyperparameters to choose the best model.
The aim of this study is to evaluate the predictive value of an improved CT index combined with serum biomarkers using a GBM model for early diagnosis of lung cancer. Clinical data from lung cancer patients from two hospitals were collected, and training, validation, and testing were conducted using the H2OAutoML platform. The performance of the GBM model was compared with traditional logistic regression (LR) to assess its efficacy.
2 Materials and methods
2.1 Inclusion and exclusion criteria
We retrospectively collected and analyzed data from patients who underwent lung cancer surgery at the Affiliated Changshu Hospital of Soochow University and Nantong Eighth People’s Hospital from January 2020 to December 2023. Patients collected from January 2020 to December 2023 at the Affiliated Changshu Hospital of Soochow University were used as the training set, while patients collected from October 2022 to December 2023 at Nantong Eighth People’s Hospital were used as the testing set.
The diagnostic criteria for lung cancer were referenced from the 2021 Fifth Edition of the WHO Classification of Thoracic Tumors (8). Diagnosis of lung cancer required meeting the following criteria: (1) Confirmation of lung nodules by chest CT without any clinical or drug intervention; (2) Definitive pathological results confirming benign or malignant nodules after chest CT; (3) Age ≥ 18 years; (4) Preoperative testing for 7 lung cancer autoantibodies and tumor markers; (5) Absence of significant dysfunction in other major organs; (6) Absence of other primary malignant tumors; and (7) Lung nodule diameter ≤ 3 cm. Exclusion criteria included: absence of pathological examination despite confirmed lung nodules on chest CT; failure to undergo testing for the 7 lung cancer autoantibodies and tumor markers; clinical or drug intervention prior to blood sampling; presence of rheumatic immunological diseases; lung metastasis from other tumors; lung nodule diameter > 3 cm. This study was approved by the hospital ethics committee.
2.2 Data collection
Demographic features, clinical information, and comorbidities were extracted from electronic medical records. Chest plain scans were performed using a 64-slice spiral CT scanner to obtain conventional CT imaging features, including air bronchogram sign, spiculated sign, lobulation sign, vascular penetration, pleural retraction, bronchial inflation sign, nodule diameter, and solid proportion. And the patient’s CT data were imported into the DeepRay medical image AI recognition system, which extracted quantitative features from medical images in high throughput and combined with convolutional neural networks to train deep learning on the data of the nodule’s size, density, and the proportion of solidity to get the improved CT indexes: the pulmonary nodule’s malignancy probability value and average CT value. Serum biomarkers primarily included 7 tumor-associated autoantibodies (TAABs) and commonly used tumor markers recommended by the American Clinical Biochemistry Committee and the European Tumor Marker Expert Group. TAABs detection involved extracting fasting peripheral venous blood (9–12) from patients preoperatively or before surgery. After centrifugation to separate serum, the levels of 7 lung cancer autoantibodies were measured using enzyme-linked immunosorbent assay (ELISA) (13), including tumor suppressor gene P53 (normal reference range: P53 < 13.09 U/mL), protein gene product PGP 9.5 (normal reference range: PGP9.5 < 11.1 U/mL), SRY-box containing gene 2 (normal reference range: SOX2 < 10.26 U/mL), G antigen 7 (GAGE7) (normal reference range: GAGE7 < 14.36 U/mL), RNA helicase autoantibody 4–5 (GBU4-5) (normal reference range: GBU4-5 < 6.99 U/mL), melanoma antigen A1 (MAGEA1) (normal reference range: MAGEA1 < 11.92 U/mL), and tumor-associated gene CAGE (normal reference range: CAGE <7.23 U/mL). TAABs detection results were considered positive if any of the indicators exceeded the normal reference range. Tumor markers were collected from blood tests and included primary lung cancer markers such as vascular endothelial growth factor (VEGF), carcinoembryonic antigen (CEA), neuron-specific enolase (NSE), cytokeratin fragment 19 (CYFRA21-1), pro-gastrin-releasing peptide (ProGRP), and squamous cell carcinoma antigen (SCC) (14).
2.3 Automated machine learning
Through the AI platform1, the H2O package is installed in the R language to implement AutoML analysis. Autonomy and automation are achieved through three aspects: feature selection, model construction, and hyperparameter optimization. The integrated algorithms include Generalized Linear Models (GLM), Random Forests (RF), Gradient Boosting Machines (GBM), Deep Neural Networks (DL), and Naive Bayes (NB), among others. The training set is split into development and validation sets in a 6:4 ratio, and blind verification is conducted with the testing set to evaluate the average accuracy and stability of the models. A confusion matrix consisting of true positives (TP), true negatives (TN), false positives (FP), and false negatives (FN) is established (15). Performance metrics including sensitivity, specificity, positive predictive value (PPV), negative predictive value (NPV), positive likelihood ratio (LR+), negative likelihood ratio (LR-), accuracy, area under the receiver operating characteristic curve (AUC), and the F1-Measure are calculated. Formulas for calculation are as follows: Accuracy = (TP + TN)/(TP + FP + FN + TN); PPV = TP/(TP + NP); NPV = TN/(TN + FN); LR + =Sensitivity/(1−Specificity); LR− = (1−Sensitivity)/Specificity; F1-Measure = (2*precisionrecall)/(precision+recall). Through SHAP analysis (Shapley Additive Explanations), an additive explanatory model is constructed to determine significant factors influencing model predictions and their contributions to model performance.
2.4 Statistical analysis
For continuous data, the Shapiro–Wilk test and homogeneity of variance test (Homogeneity of variance test) were first performed. For normally distributed and homoscedastic continuous data, independent samples t-tests were employed, and results were presented as mean ± standard deviation. For non-normally distributed and heteroscedastic continuous data, the Wilcoxon rank-sum test was used, and results were presented as median (M25, M75). Categorical data were expressed as frequencies and percentages, and inter-group differences were assessed using the chi-square test or Fisher’s exact test. To prevent multicollinearity among variables, feature selection was conducted using the Least Absolute Shrinkage and Selection Operator (LASSO) regression model. Based on the selected variables, a binary logistic regression model was fitted. The predictive performance of the obtained model was evaluated using the area under the receiver operating characteristic curve (AUC), calibration curve, and decision curve analysis (DCA), and a Nomogram was constructed. The statistical significance level was set at p < 0.05. All statistical analyses were performed using R 4.3.3 software.
3 Results
3.1 Baseline characteristics
A total of 803 lung cancer patients were included in this study, with 376 cases (47.0%) exhibiting infiltrative lesions. The study protocol is detailed in Figure 1. Among them, 560 patients from the Affiliated Changshu Hospital of Soochow University (Hospital 1) were included in the training set. Nantong Eighth People’s Hospital (Hospital 2) contributed 243 patients as the testing set. In the training set, 64.3% (360/560) were male and 35.7% (200/560) were female, with a median age of 55 years. In the testing set, females were more common in the infiltrative group, and the age range of 40–60 years was the peak incidence, consistent with previous reports (16). There were no statistically significant differences between the two groups in terms of age, CY211, NSE, and Leafing (p > 0.05). Details are shown in Table 1.
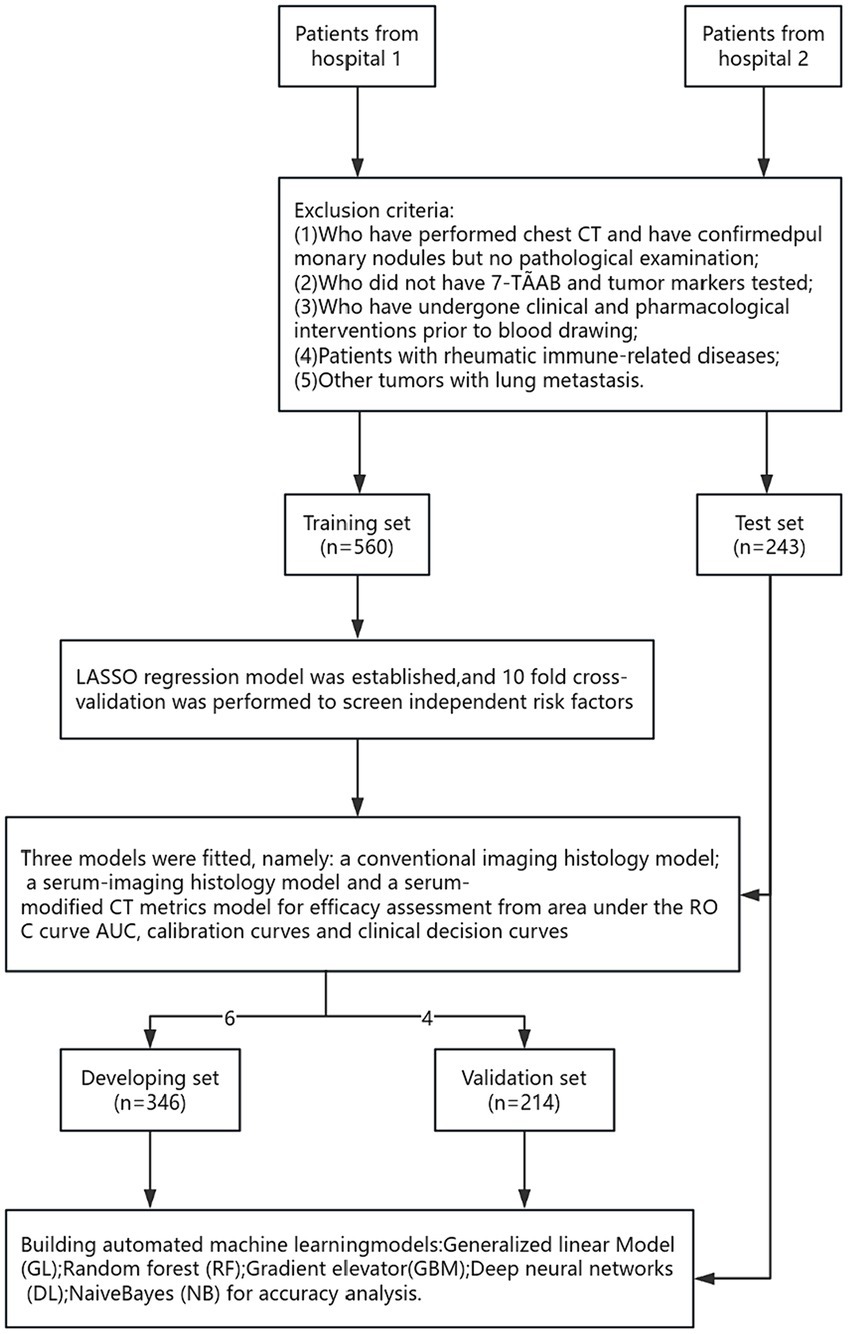
Figure 1. Roadmap for the research program.
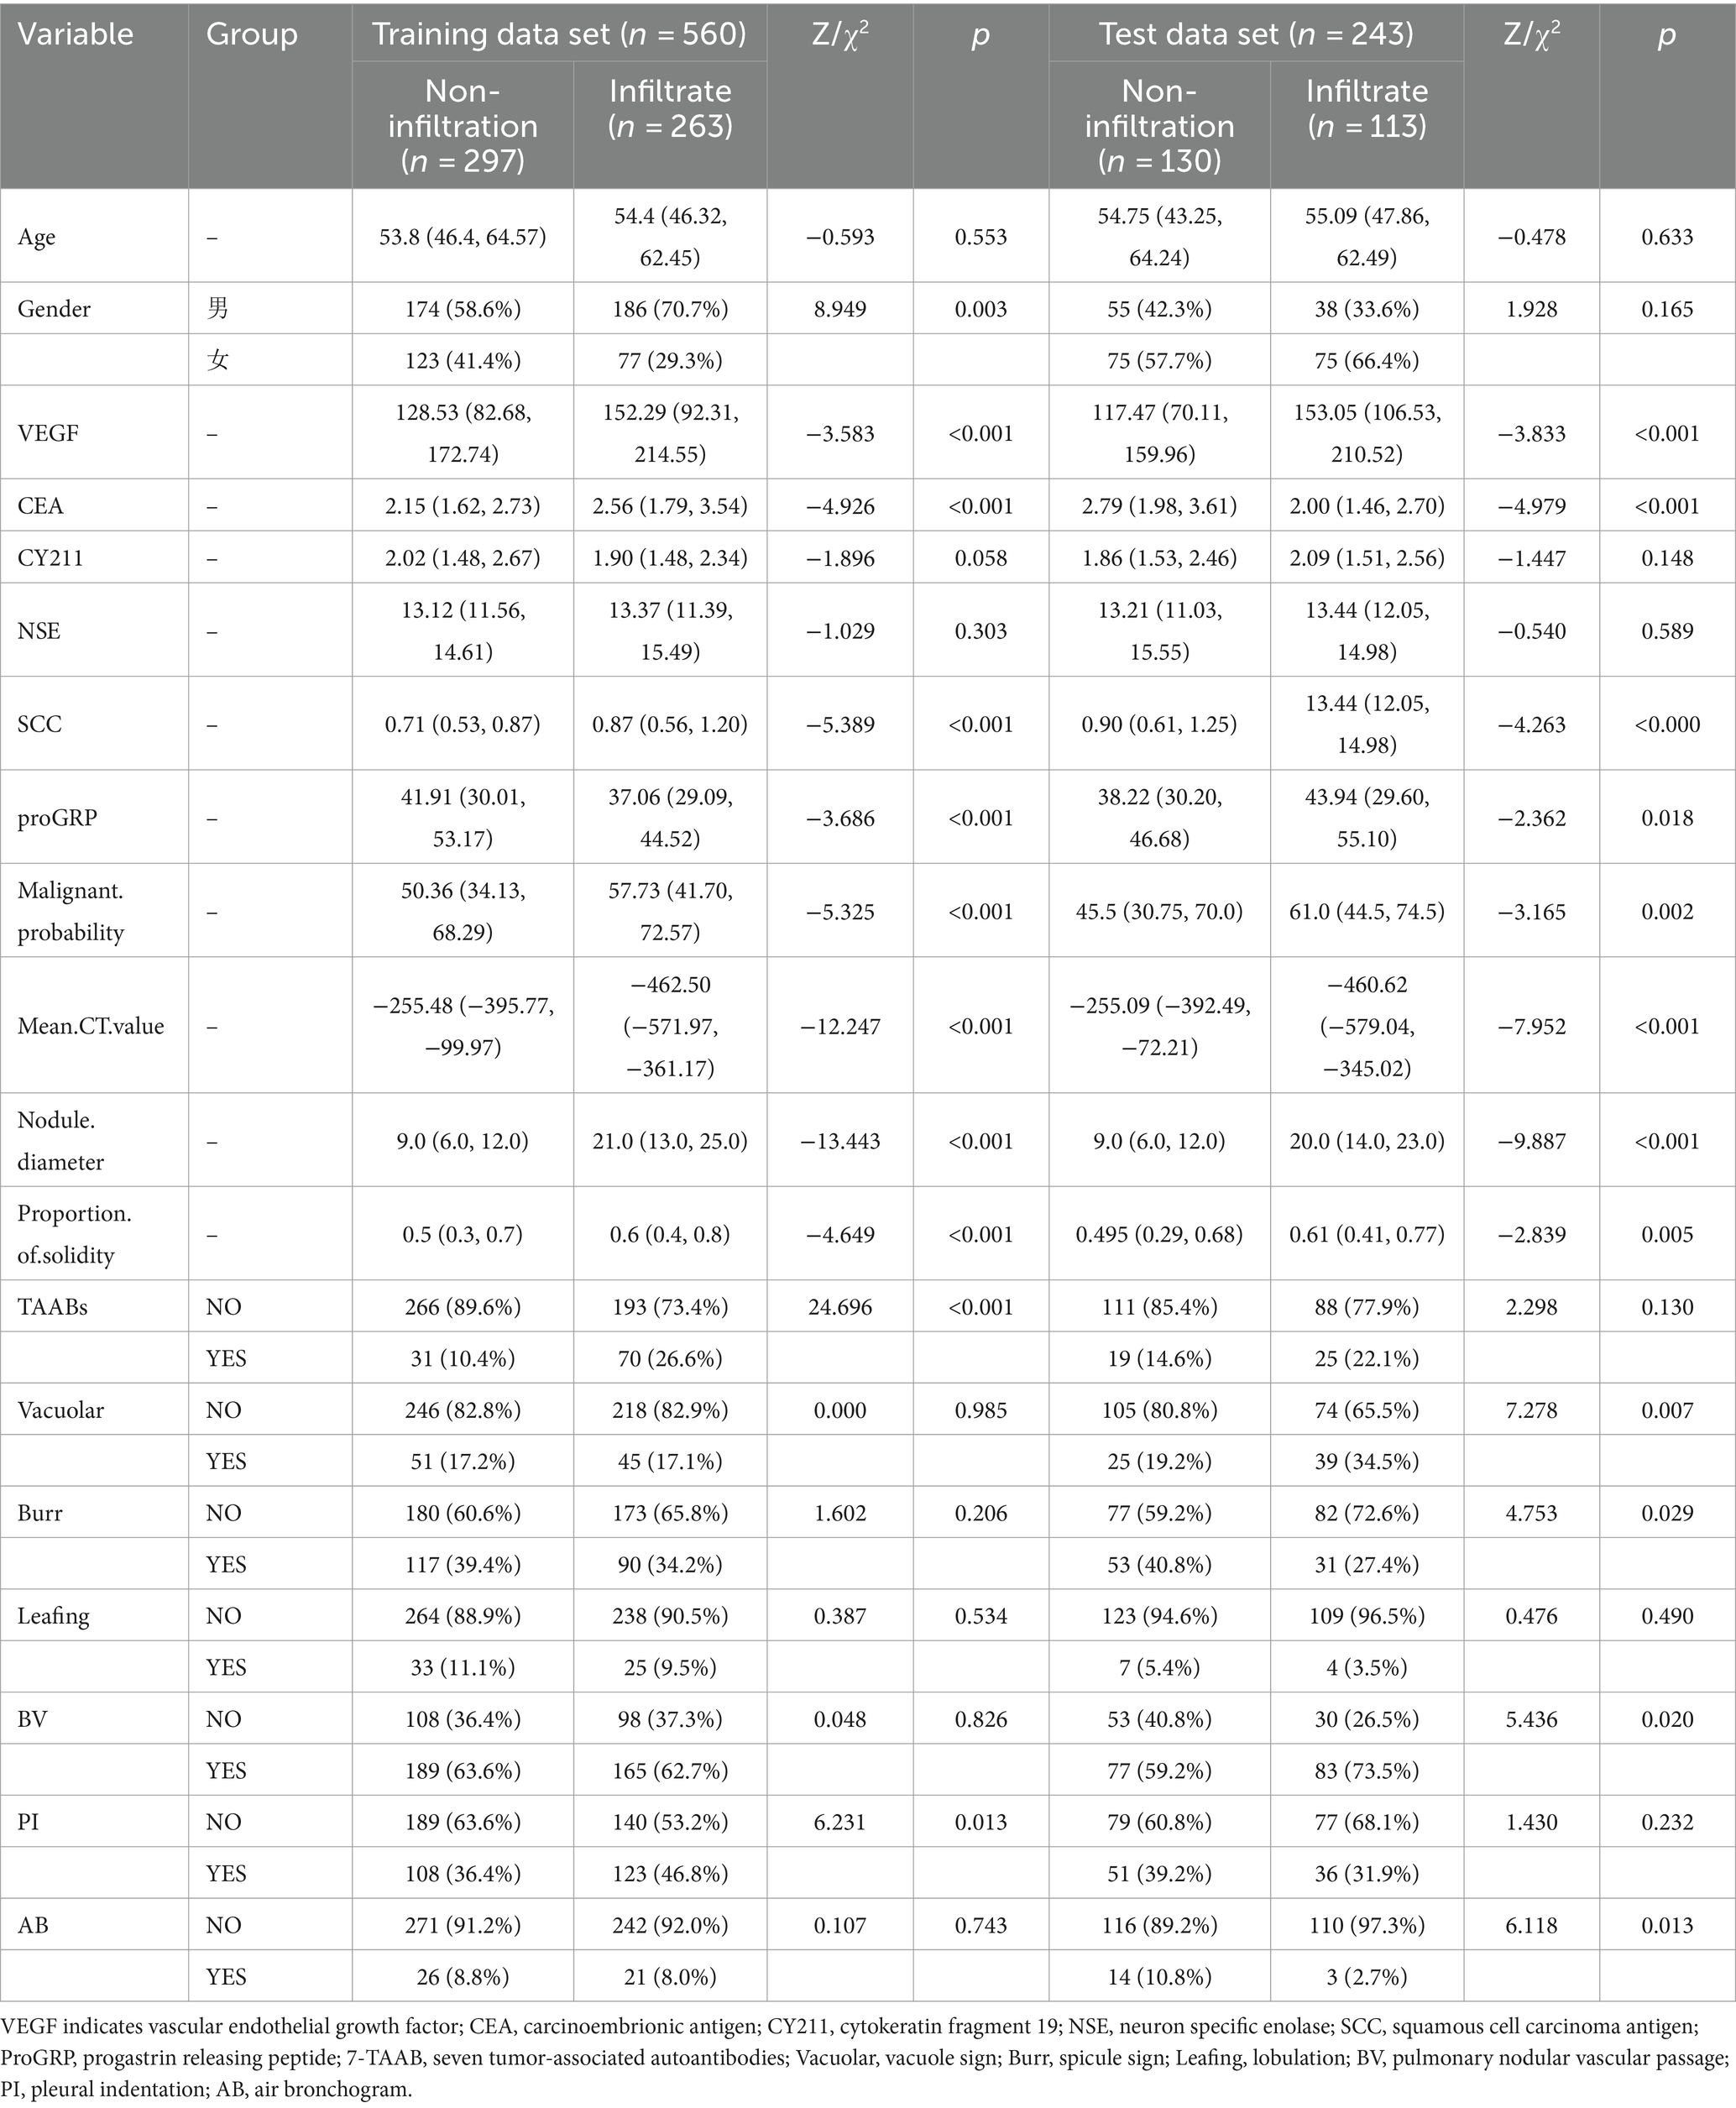
Table 1. Baseline characteristics of patients in training and test groups.
3.2 Model construction and predictive performance comparison
3.2.1 LASSO regression feature screening and LR model construction
Considering the potential issue of multicollinearity among variables, we employed the LASSO regression model with the introduction of the L1 regularization coefficient. Through 10-fold cross-validation, we obtained the minimum standard lambda and selected 8 variables as independent risk factors from 19 variables. These variables included VEGF, TAABs, malignancy probability, average CT value, nodule diameter, solid proportion, gender, and pleural retraction, as shown in Figure 2.
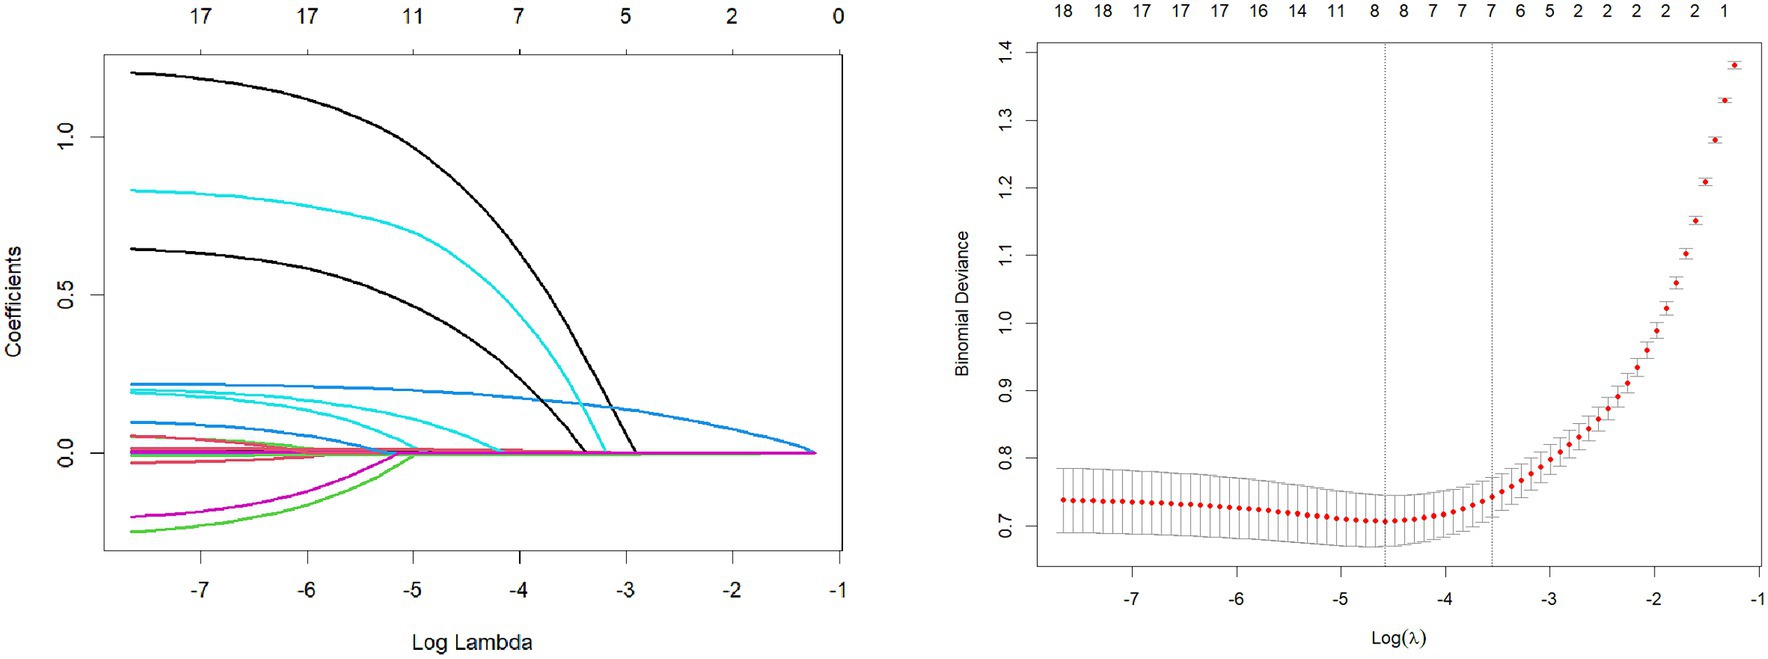
Figure 2. Lasso regression variable screening.
The selected features were fitted to construct a serum-modified CT index model, and a Nomogram plot was generated to score the features (see Figure 3). The total score obtained by summing the scores of each feature allows estimation of the probability of developing infiltrative lesions in lung cancer. The study showed that when the total score of the Nomogram for lung cancer infiltrative lesions exceeds 180, the risk of lesions is over 90%.
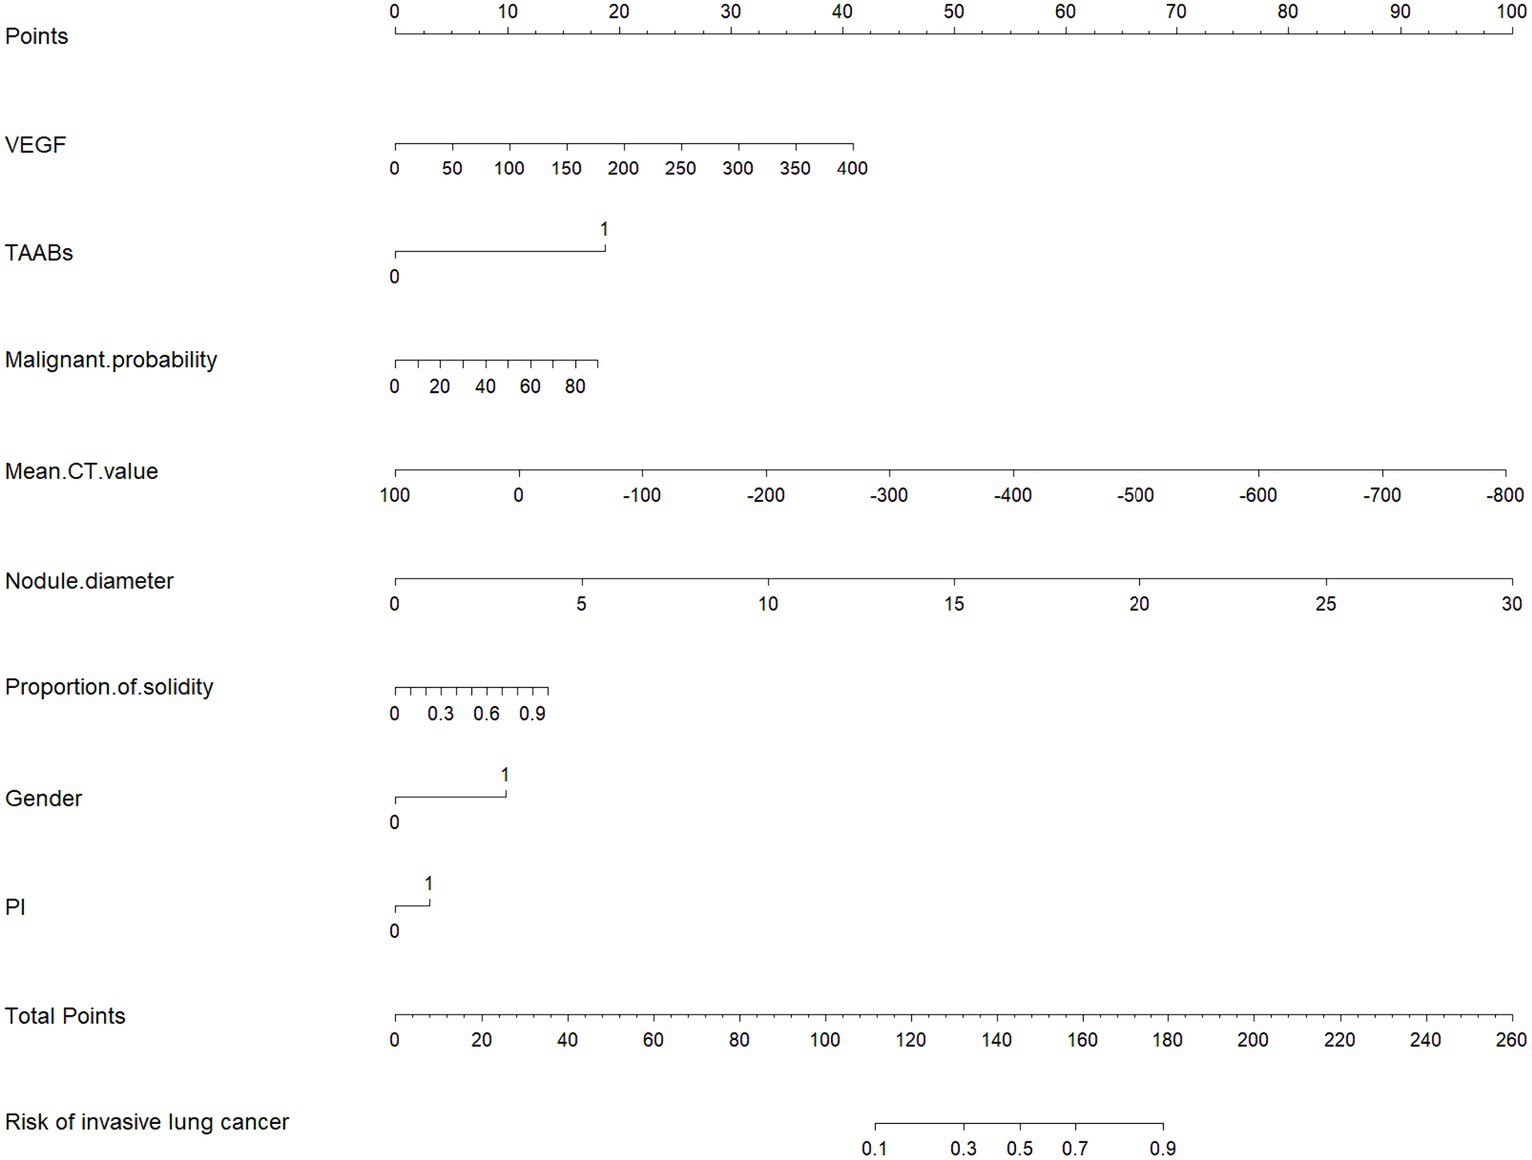
Figure 3. Nomogram (column line graph).
To further analyze the stability and clinical utility of the serum-modified CT index model, we compared the serum-modified CT index model with conventional imaging omics models and serum-imaging omics models in both the training and testing sets using ROC curve analysis, clinical calibration curve, and clinical decision curve analysis (DCA). The conventional imaging omics model consisted of nodule diameter, solid proportion, gender, and pleural retraction. The serum-imaging omics model included VEGF, TAABs, nodule diameter, solid proportion, gender, and pleural retraction. The serum-modified CT index model comprised VEGF, TAABs, malignancy probability, average CT value, nodule diameter, solid proportion, gender, and pleural retraction. In the training set, the ROC curve analysis revealed that the areas under the curve (AUC) for the conventional imaging omics model, serum-imaging omics model, and serum-modified CT index model were 0.861, 0.87, and 0.930, respectively (see Figure 4A). In the testing set, the AUC values were 0.901, 0.91, and 0.942 for the conventional imaging omics model, serum-imaging omics model, and serum-modified CT index model, respectively (see Figure 4B). The calibration curves for the training and testing sets (see Figures 5A,B) demonstrated that the estimated risks of the serum-modified CT index model were very close to the actual risks, indicating high reliability. The clinical decision curve analysis (DCA) showed that, across most threshold ranges, the net benefit of the serum-imaging omics model was greater than that of the conventional imaging omics model and serum-imaging omics model in both the training and testing sets, with the serum-imaging omics model outperforming the conventional imaging omics model (see Figures 6A,B).
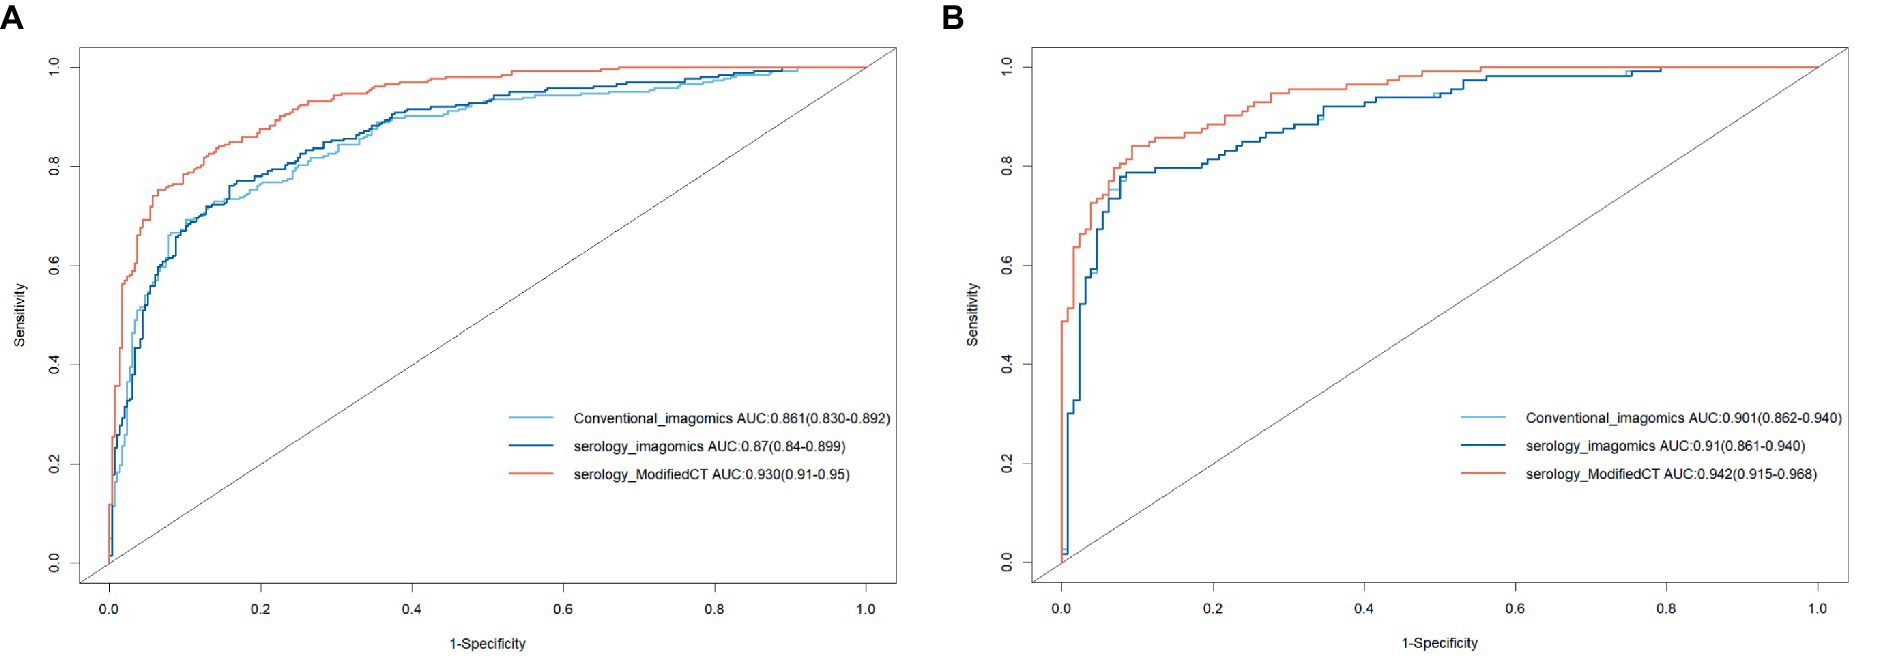
Figure 4. Three model ROCs; (A) Training set; (B) Testing set.
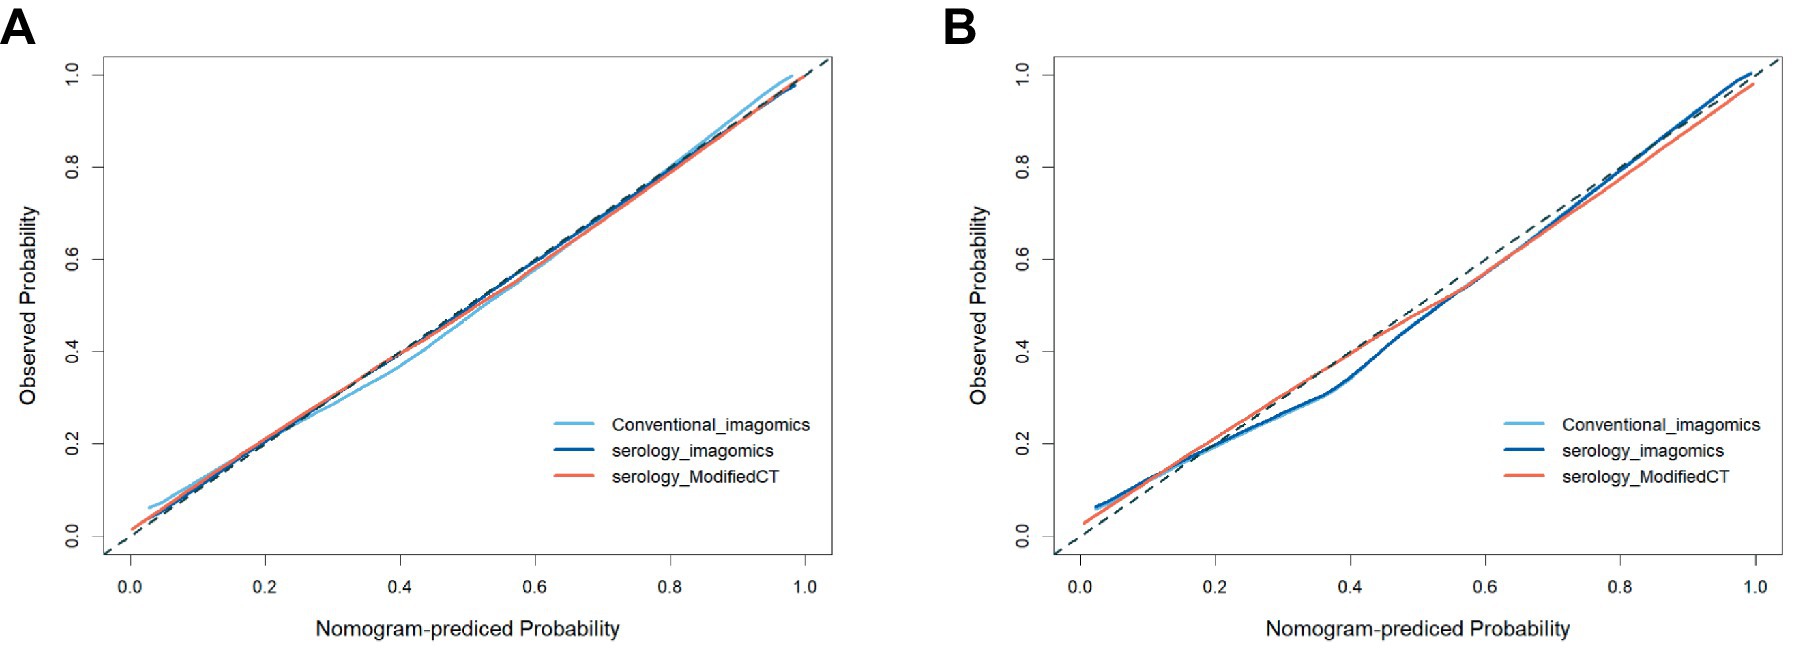
Figure 5. Three model calibration curves; (A) Training set; (B) Test set.
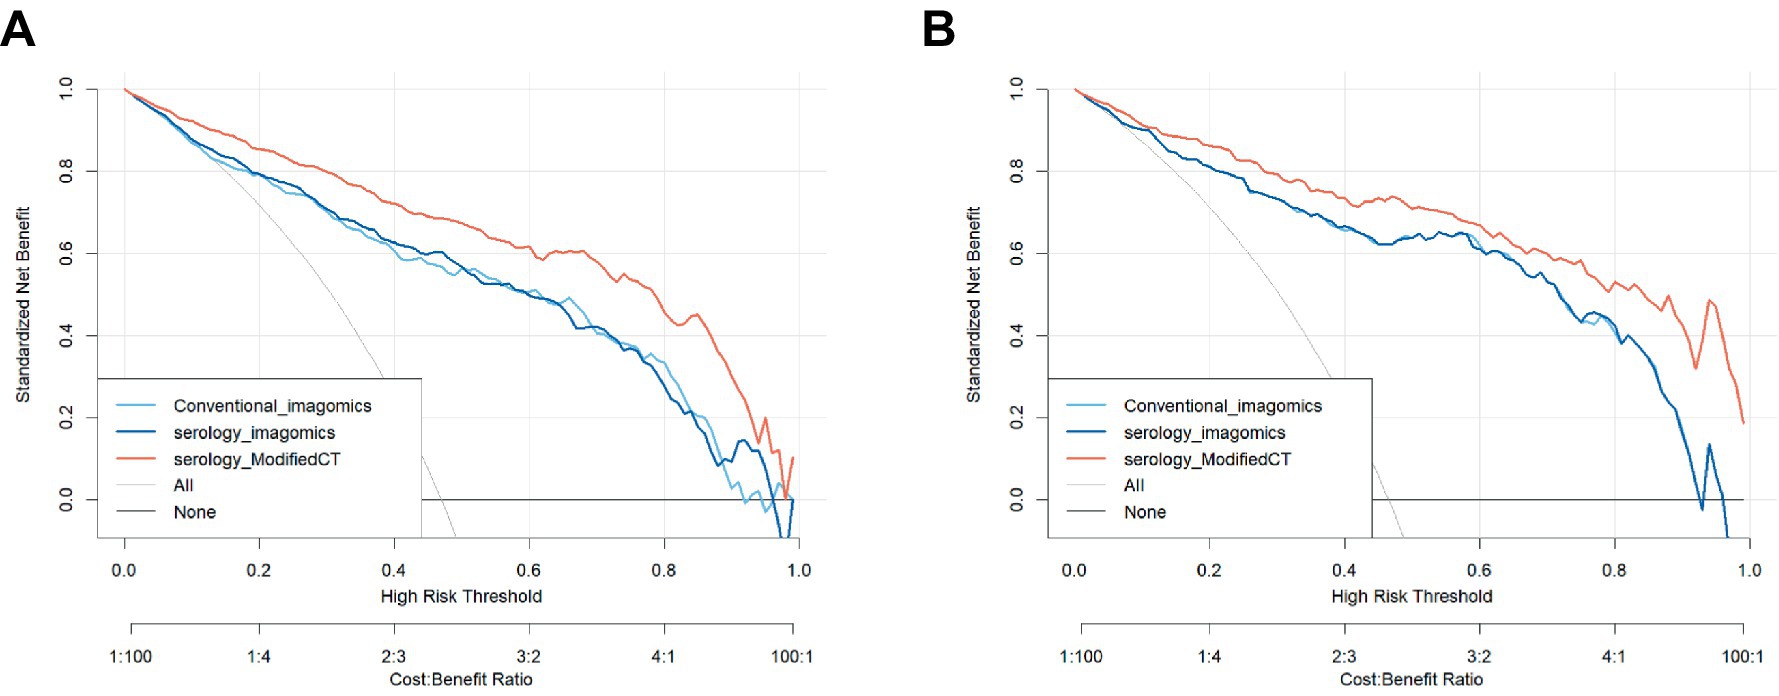
Figure 6. DCA curves for the three models; (A) Training set; (B) Test set.
3.2.2 Machine learning model construction and performance comparison
Using the H2OAutoML platform, automatic training and adjustment of models were conducted within a 5 min time limit, resulting in the construction of 75 models. However, due to limited interpretability and the presence of stacked ensemble models, these models were simplified, and the main algorithms involved were extracted, including Generalized Linear Model (GLM), Random Forest (RF), Gradient Boosting Machine (GBM), Deep Neural Network (DL), and Naive Bayes (NB). Among these models, the GBM model outperformed others, achieving the highest values for AUC, accuracy, and F1-Measure on both validation and testing sets, and hence was considered the optimal model. As shown in Table 2, on the validation and testing sets, the AUC values obtained by the GBM algorithm were higher than those obtained by GLM, RF, DL, and NB algorithms, with values of (0.931, 0.99) compared to (0.917, 0.942), (0.918, 0.986), (0.901, 0.948), and (0.908, 0.944), respectively. Furthermore, compared to GLM, RF, DL, and NB algorithms, the GBM algorithm also achieved the highest accuracy, with values of (0.857, 0.955), (0.854, 0.864), (0.838, 0.947), (0.819, 0.877, 0.844, 0.889), respectively. Among these models, the RF model exhibited the highest sensitivity in both the validation and testing sets, with values of 0.914 and 0.991, respectively. Both RF and GLM models demonstrated good performance in terms of AUC, sensitivity, specificity, and accuracy.
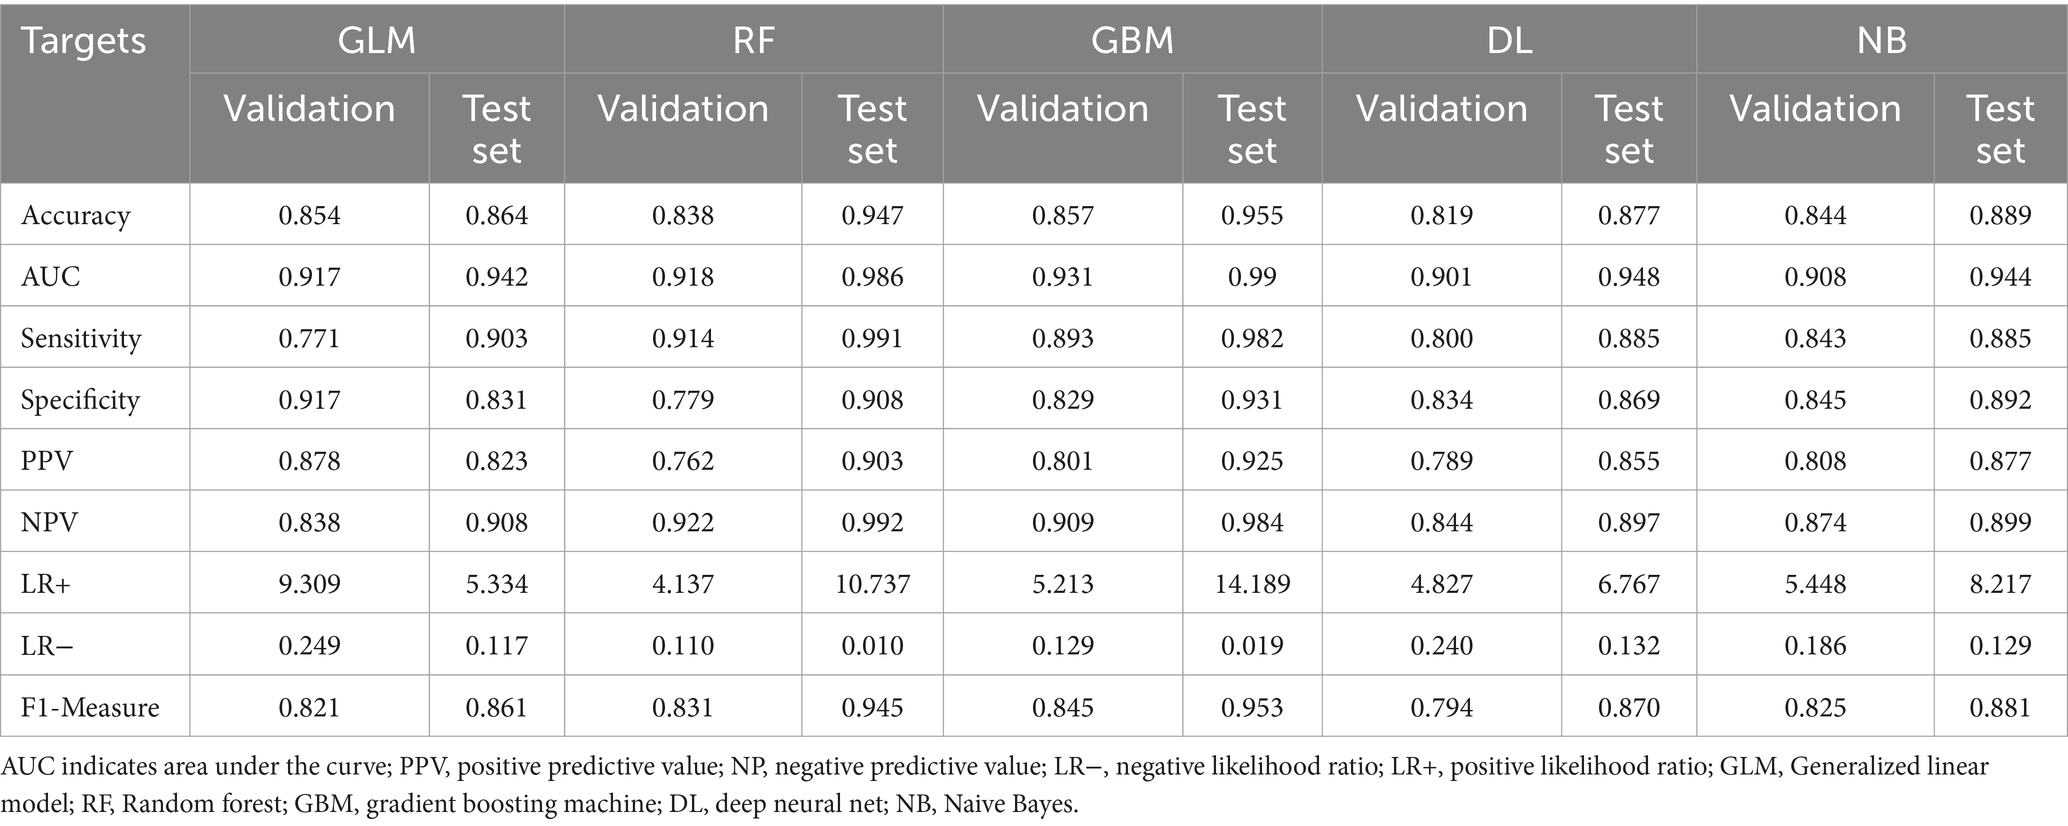
Table 2. Comparison of AutoML model performance in predicting lung cancer infiltration in the test cohort.
3.3 Overall feature interpretability analysis
Figure 7 shows that nodule diameter size is the most important feature, followed by average CT value, solid proportion, NSE, VEGF, CYFRA21-1, SCC, malignancy probability, CEA, and proGRP. Additionally, nodule diameter size, average CT value, malignancy probability, solid proportion, and VEGF were identified as important feature variables shared by both the GBM and logistic regression models.
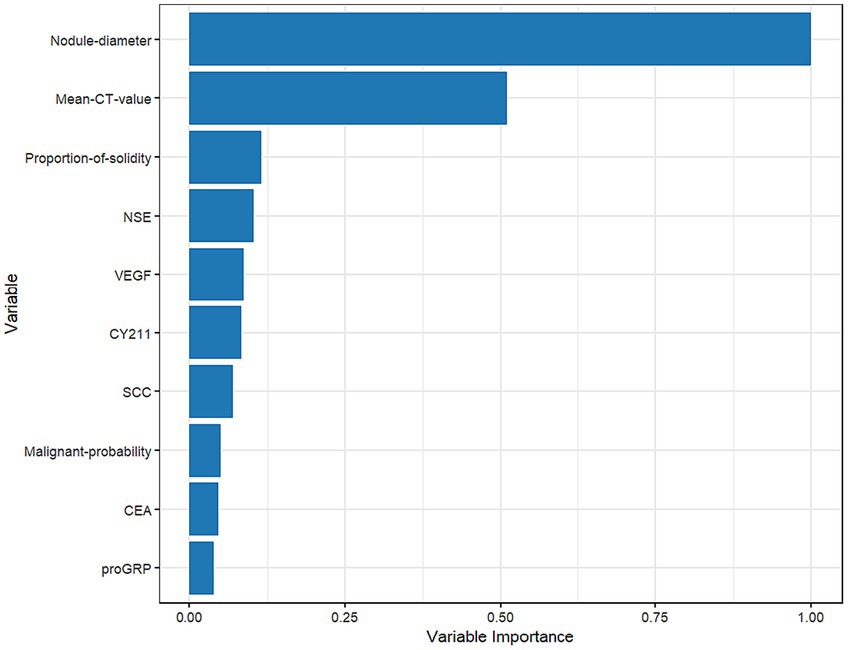
Figure 7. Plot of the importance ranking of the GBM model variables in the test set.
Figure 8, the SHAP summary plot, displays the impact of all features on the predictive performance of the GBM model in the testing set. The x-axis represents the SHAP values, indicating the contribution of features to the overall prediction. A SHAP value greater than 0 indicates a positive contribution, meaning that as the variable’s value approaches 1, the likelihood of infiltration in patients increases. For example, on the SHAP plot corresponding to nodule diameter, red points are mainly located to the right of the zero axis, while blue points are more on the left, suggesting that as the nodule diameter increases, the likelihood of infiltrative lesions in lung nodules also increases.
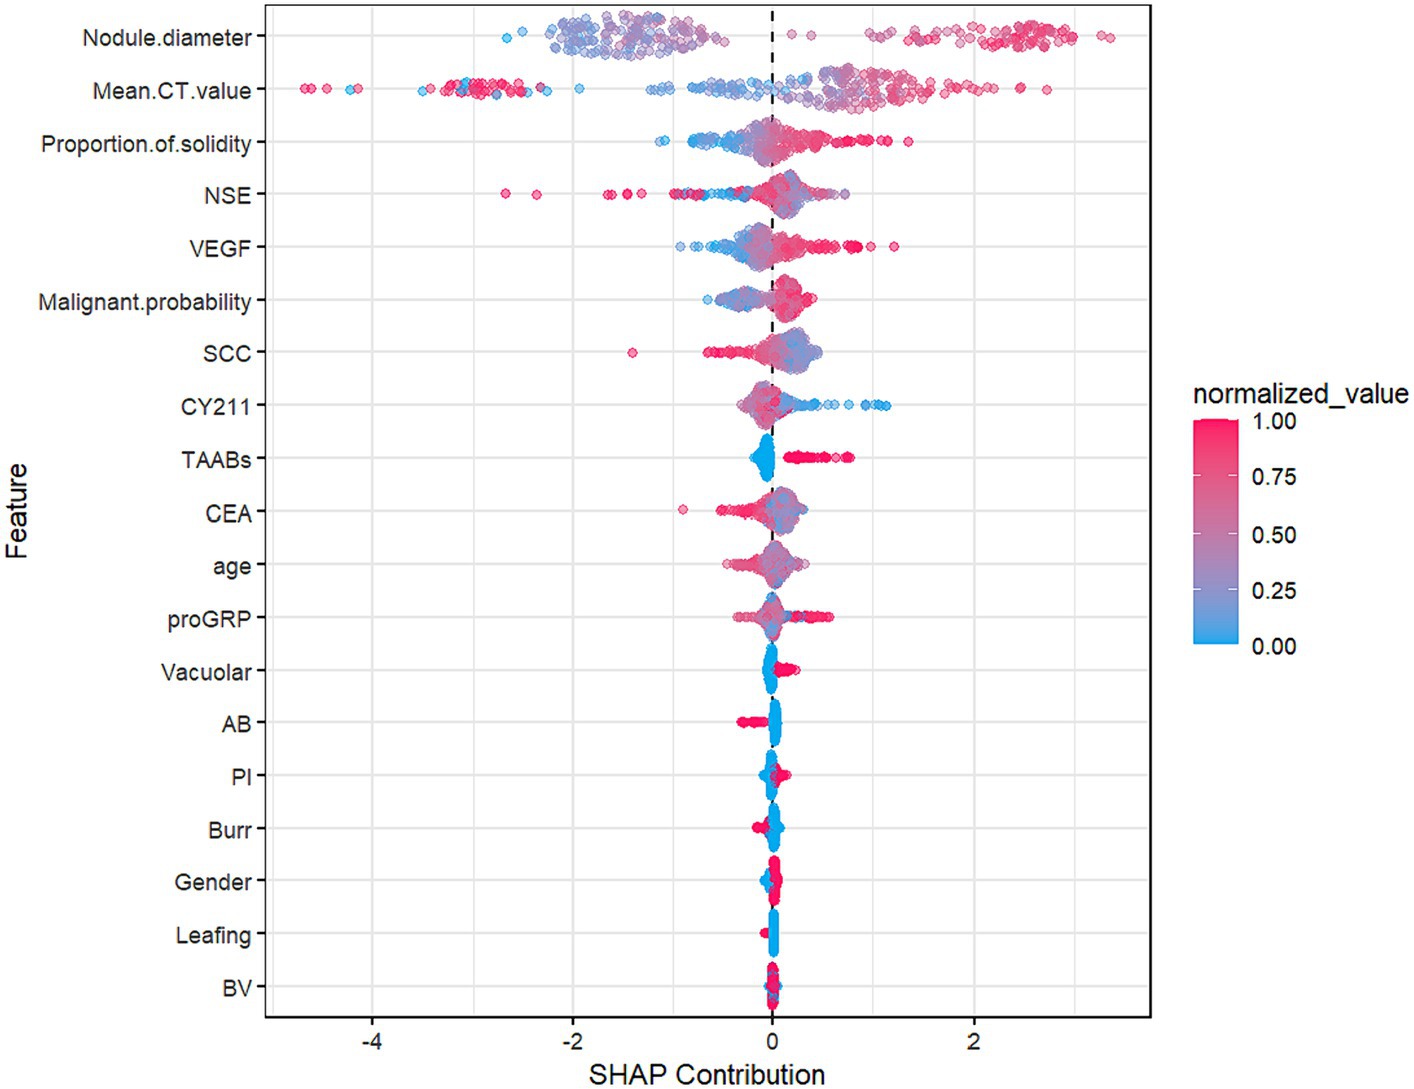
Figure 8. Summary plot of GBM model SHAP in the test set.
3.4 Individual feature interpretability analysis
As shown in Figure 9, partial dependence plots illustrate the impact of individual features on the final discrimination of the GBM model and their distribution in the dataset. Nodule diameter size, malignancy probability, and VEGF are positively correlated with the likelihood of infiltrative lesions. Nodule diameter is mainly distributed below 15 mm, but for lung cancer patients falling between 15 and 18 mm, there is a higher likelihood of infiltrative lesions, necessitating regular follow-up. As the average CT value gradually increases, it tends to indicate non-invasive lung cancer, particularly in patients with values above −200, essentially ruling out the possibility of infiltrative lung cancer.
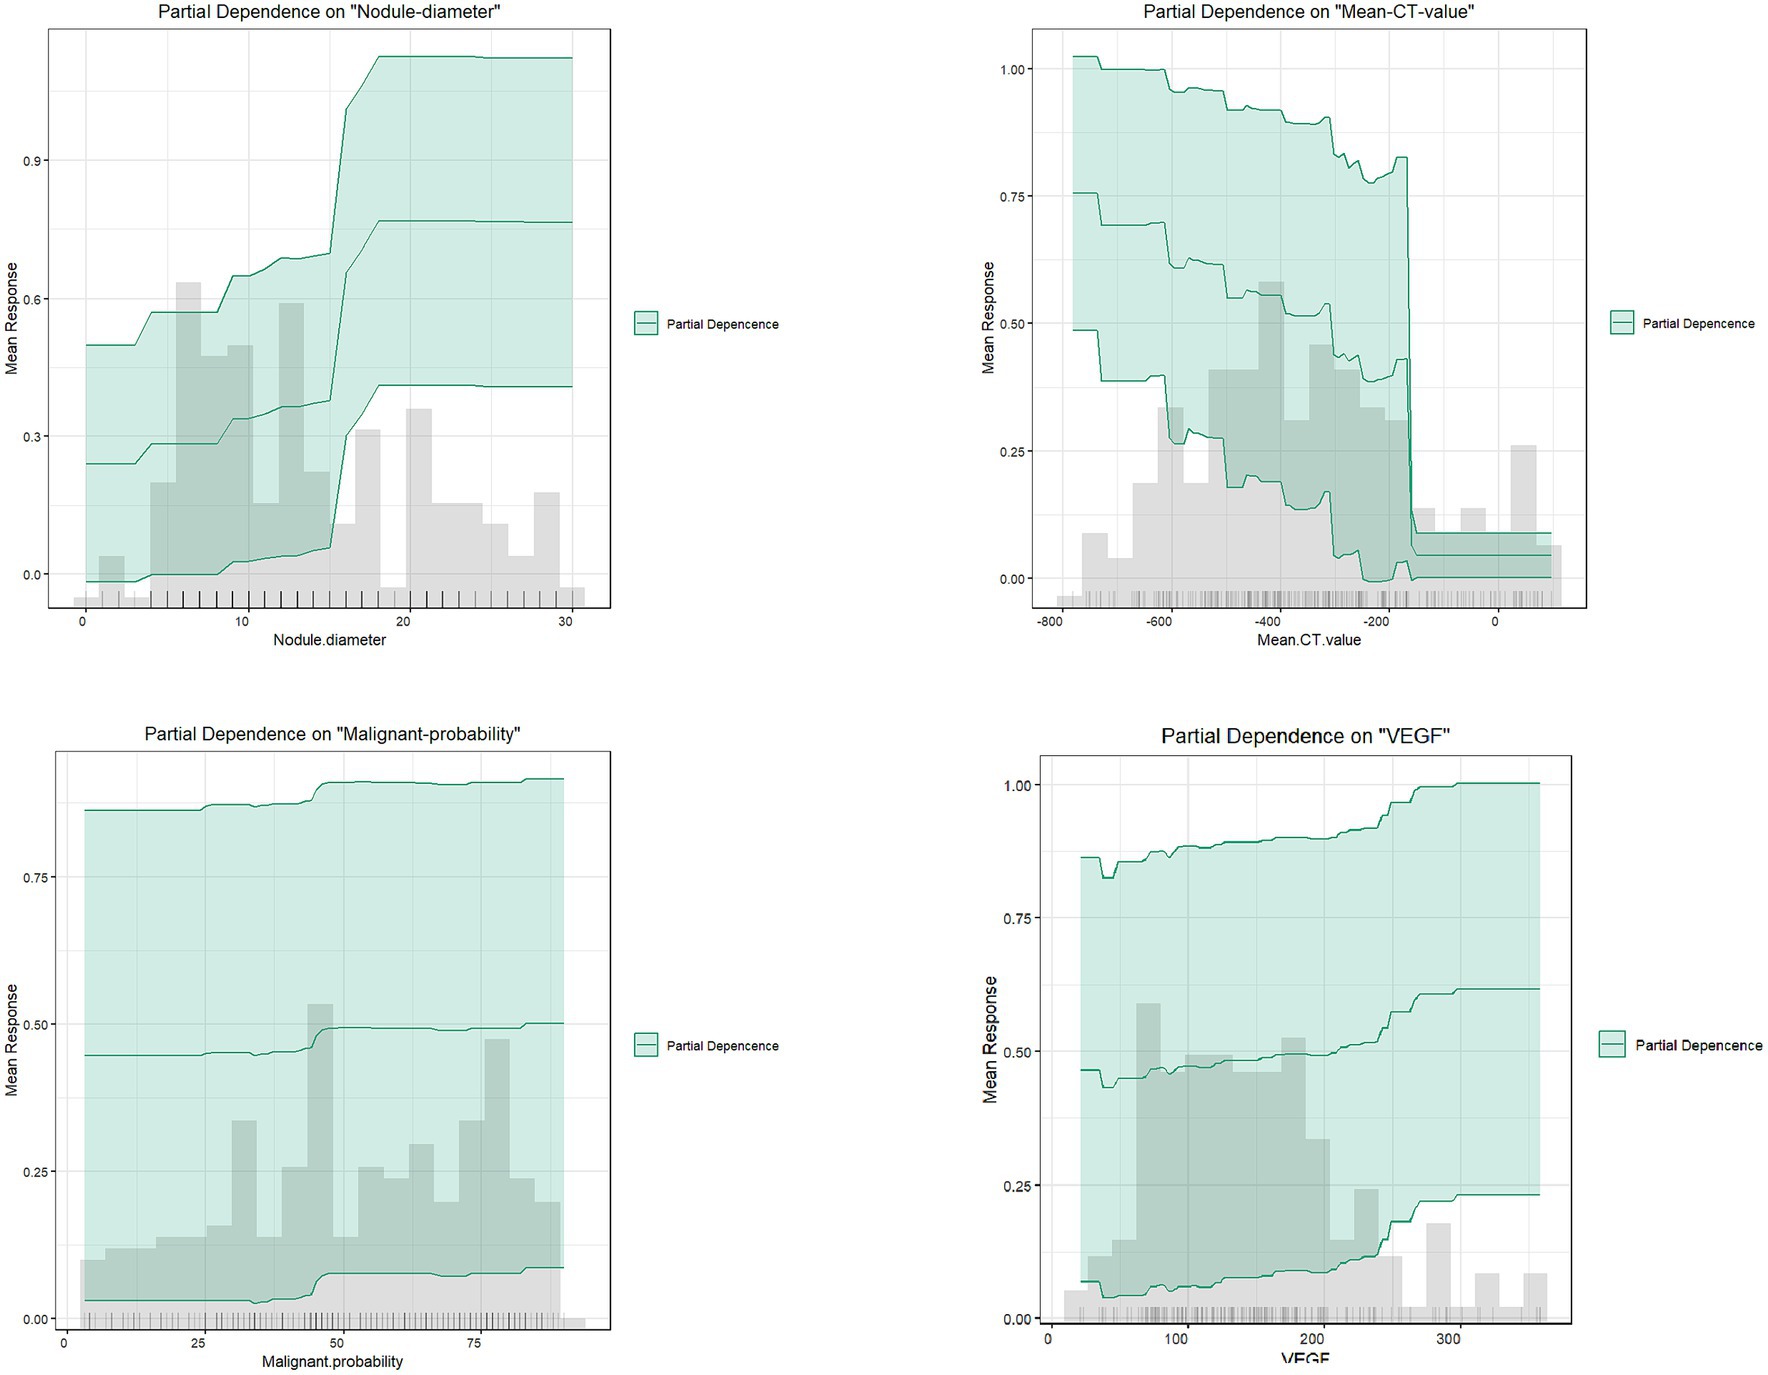
Figure 9. Partial dependence plots.
The SHAP explanation illustrates the feature contributions for specific instances. As depicted in Figure 10, for instance 72, with a nodule diameter of 22 mm, average CT value of -525HU, and malignancy probability of 86%, these factors significantly contribute to the model’s final determination of infiltrative lung cancer. Conversely, in instance 98, although the nodule diameter is below 15 mm, predictions of infiltrative lung cancer are made based on factors such as average CT value, NSE value, and malignancy probability.
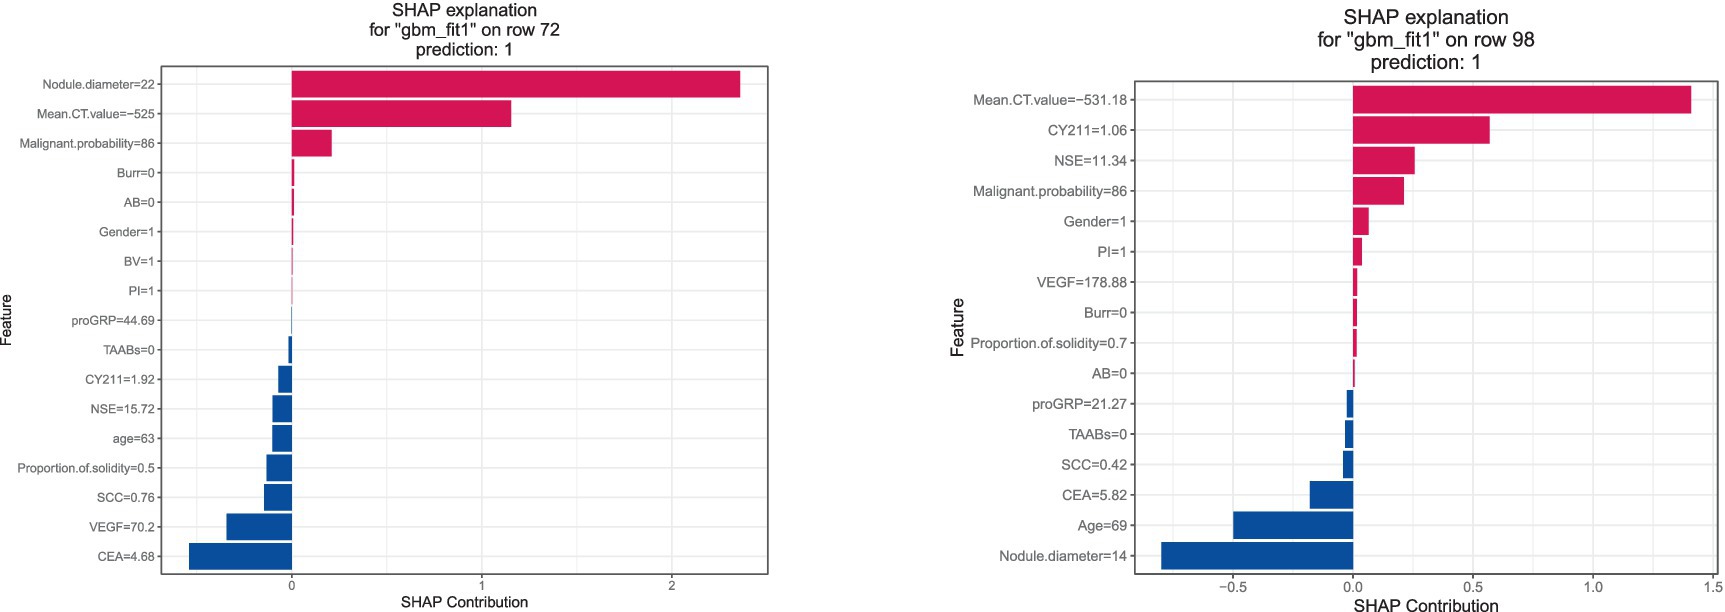
Figure 10. SHAP interpretation diagram.
4 Discussion
Lung cancer ranks among the most prevalent and fatal malignancies globally, with adenocarcinoma being the most common histological subtype. Accurate differentiation between non-invasive and invasive lung cancer significantly impacts patient prognosis and survival. Therefore, constructing early lung cancer infiltration risk prediction models is crucial. In recent years, many researchers have built clinical risk prediction models for early lung cancer patients using multivariable logistic regression and selected feature variables such as low-dose CT (LDCT), seven autoantibodies, and other biomarkers (17–21). Unlike many previous studies, this research incorporates AI-improved malignancy probability and average CT value into the category of risk factors and compares models constructed by traditional LR regression with those built by AutoML algorithms to assess their efficacy and accuracy.
Feature interpretability analysis results show that the most crucial feature of the GBM model is nodule diameter size, consistent with the results of the logistic regression model in this study and the risk factors for lung nodule benignity/malignancy reported in related studies (22, 23). Other researchers have pointed out that as nodule diameter increases, the likelihood of malignancy also increases. For instance, nodules below 5 mm have a malignancy rate of only 1%, while those between 5 and 10 mm have a malignancy rate of 25% (24). In this study, we found that nodules larger than 15 mm have a higher malignancy probability, particularly between 15 and 18 mm, where infiltration is more likely to occur. Therefore, patients should have shorter follow-up intervals, and clinicians should pay close attention to patients with nodules larger than 15 mm, increasing the frequency of follow-up visits. This finding is consistent with other research (25, 26).
With the development and application of artificial intelligence technology, AI-based medical imaging has been widely used in clinical diagnosis and treatment, particularly in lung cancer early screening, significantly improving lung nodule detection rates and reducing the rate of missed small lesions. This study demonstrates that AI-enhanced CT indices significantly contribute to the discrimination of infiltrative lung cancer, enhancing lesion identification accuracy. However, there are limitations. According to previous studies, although CT AI has higher positive predictive values and sensitivity, its specificity is not ideal, ranging from 70 to 80% (27–30). Therefore, relying solely on radiological imaging to differentiate between benign and malignant lung nodules is too one-sided. This study established a predictive model combining AI with other laboratory indicators to improve the specificity and accuracy of lung nodule detection.
In recent years, laboratory indicators for lung cancer have mainly focused on primary lung cancer biomarkers and seven lung cancer autoantibodies. In contrast to artificial intelligence CT, these indicators have high specificity but low sensitivity when used alone. Therefore, they are typically used in combination for early lung cancer screening. Vascular endothelial growth factor (VEGF) levels serve as an independent risk factor for lung cancer infiltration, as evidenced by significant expression in both LR and GBM models. Studies have shown that VEGF can increase vascular permeability (31–33), thereby promoting tumor metastasis, and its overexpression indicates poor prognosis in lung cancer. Therefore, patients with abnormal VEGF levels should be closely monitored, and further diagnostic and clinical intervention measures should be implemented. Detection of serum lung cancer autoantibodies has a certain clinical decision-making value for lung cancer diagnosis (34–36), although in this study there was a statistically significant difference between the non-infiltrating group and the infiltrating group in the training set, but showed no statistically significant difference between the non-infiltrating group and the infiltrating group in the test set, which indicates that the 7-item serum lung cancer autoantibody test is not suitable to be applied alone in discriminating non-infiltrating versus infiltrating early stage lung cancer, and that it needs to be combined with other indicators for prediction.
In addition, we used five different ML algorithms to construct a high-precision prediction model. The GBM model showed optimal prediction efficacy on both the test and validation sets and achieved higher AUC and accuracy than the LDCT+7-TABBs model constructed by Zhong et al. (37), which fully demonstrated that the CT metrics modified by AI are more accurate, and can provide more comprehensive and high-quality information for clinically assisted diagnosis and treatment. By accurately predicting the invasiveness of early lung nodules, this study can help patients receive earlier treatment, thereby improving survival rates and prognosis. The blind validation using a validation set and external dataset with larger sample sizes and higher external validity mitigated potential biases arising from unique circumstances at a single research center. However, our study also has some limitations. Firstly, it only studied benign and infiltrative lung cancer categories, necessitating the expansion of case numbers to further classify lung cancer. Additionally, this study is retrospective, which introduces selection bias, highlighting the need for more prospective studies for external validation.
5 Conclusion
A predictive early-stage lung cancer infiltrative machine learning model was constructed and compared by combining improved CT indices with serological markers, using SHAP to elucidate the clinical significance of each risk factor in predicting infiltrative lesions in early-stage lung cancer patients. The CT indices improved by artificial intelligence are closely associated with lung cancer infiltrative features, holding significant application value in future clinical research. This combination can assist clinicians in implementing early clinical interventions, providing more comprehensive information for self-screening and disease management of early-stage lung cancer patients, thereby preventing and reducing the risk of infiltration.
Data availability statement
The raw data supporting the conclusions of this article will be made available by the authors, without undue reservation.
Ethics statement
The studies involving humans were approved by Ethics Management Committee of Changshu No.1 People’s Hospital. The studies were conducted in accordance with the local legislation and institutional requirements. Written informed consent for participation was not required from the participants or the participants’ legal guardians/next of kin in accordance with the national legislation and institutional requirements.
Author contributions
LM: Writing – original draft. PZ: Data curation, Visualization, Writing – review & editing. KX: Methodology, Writing – review & editing.
Funding
The author(s) declare that financial support was received for the research, authorship, and/or publication of this article. This work was supported in part by the Suzhou Key Supporting Subjects [Health Informatics (No. SZFCXK202147)], in part by the Changshu Science and Technology Program [No. CS202015 and CS202246], in part by Changshu Key Laboratory of Medical Artificial Intelligence and Big Data [No. CYZ202301 and CS202314], and in part by the “333 High Level Personnel Training Project of Jiangsu Province.”
Conflict of interest
The authors declare that the research was conducted in the absence of any commercial or financial relationships that could be construed as a potential conflict of interest.
Publisher’s note
All claims expressed in this article are solely those of the authors and do not necessarily represent those of their affiliated organizations, or those of the publisher, the editors and the reviewers. Any product that may be evaluated in this article, or claim that may be made by its manufacturer, is not guaranteed or endorsed by the publisher.
Footnotes
1. ^ www.h2o.ai
References
1. Xia, C, Dong, X, Li, H, Cao, M, Sun, D, He, S, et al. Cancer statistics in China and United States, 2022: profiles, trends, and determinants. Chin Med J (Engl). (2022) 135:584–90. doi: 10.1097/CM9.0000000000002108
2. Siegel, RL, Miller, KD, Fuchs, HE, and Jemal, A. Cancer statistics, 2022. CA Cancer J Clin. (2022) 72:7–33. doi: 10.3322/caac.21708
3. Bassiri, A, Badrinathan, A, Alvarado, CE, Kwak, M, Sinopoli, J, Tapias Vargas, L, et al. Evaluating the Optimal Time Between Diagnosis and Surgical Intervention for Early-Stage Lung Cancer. J Surg Res. (2023) 292:297–306. doi: 10.1016/j.jss.2023.08.003
4. Kong, L, Zhang, X, Li, X, and Su, Y. Low-dose Spiral Computed Tomography in Lung Cancer Screening. Zhongguo Fei Ai Za Zhi. (2022) 25:678–683. Chinese. doi: 10.3779/j.issn.1009-3419.2022.101.40
5. Albahra, S, Gorbett, T, Robertson, S, D’Aleo, G, Kumar, SVS, Ockunzzi, S, et al. Artificial intelligence and machine learning overview in pathology & laboratory medicine: A general review of data preprocessing and basic supervised concepts. Semin Diagn Pathol. (2023) 40:71–87. doi: 10.1053/j.semdp.2023.02.002
6. MacEachern, SJ, and Forkert, ND. Machine learning for precision medicine. Genome. (2021) 64:416–25. doi: 10.1139/gen-2020-0131
7. Rauschert, S, Raubenheimer, K, Melton, PE, and Huang, RC. Machine learning and clinical epigenetics: a review of challenges for diagnosis and classification. Clin Epigenetics. (2020) 12:51. doi: 10.1186/s13148-020-00842-4
8. Hou, LK, Zhang, LP, Huang, Y, Dong, ZW, Xie, HK, Zhang, W, et al. Application of the WHO Classification of Thoracic Tumors (2021) grading system in invasive pulmonary adenocarcinoma and its correlation with the targeted genes’ variations. Zhonghua Bing Li Xue Za Zhi. (2023) 52:129–135. Chinese. doi: 10.3760/cma.j.cn112151-20220927-00814
9. Šutić, M, Vukić, A, Baranašić, J, Försti, A, Džubur, F, Samaržija, M, et al. Diagnostic, Predictive, and Prognostic Biomarkers in Non-Small Cell Lung Cancer (NSCLC) Management. J Pers Med. (2021) 11:1102. doi: 10.3390/jpm11111102
10. Rastel, D, Ramaioli, A, Cornillie, F, and Thirion, B. CYFRA 21-1, a sensitive and specific new tumour marker for squamous cell lung cancer. Report of the first European multicentre evaluation. CYFRA 21-1 Multicentre Study Group. Eur J Cancer. (1994) 30A:601–6. doi: 10.1016/0959-8049(94)90528-2
11. Chen, F, Wang, XY, Han, XH, Wang, H, and Qi, J. Diagnostic value of Cyfra21-1, SCC and CEA for differentiation of early-stage NSCLC from benign lung disease. Int J Clin Exp Med. (2015) 8:11295–300.
12. Doseeva, V, Colpitts, T, Gao, G, Woodcock, J, and Knezevic, V. Performance of a multiplexed dual analyte immunoassay for the early detection of non-small cell lung cancer. J Transl Med. (2015) 13:55. doi: 10.1186/s12967-015-0419-y
13. He, T, Wu, Z, Xia, P, Wang, W, Sun, H, Yu, L, et al. The combination of a seven-autoantibody panel with computed tomography scanning can enhance the diagnostic efficiency of non-small cell lung cancer. Front Oncol. (2022) 12:1047019. doi: 10.3389/fonc.2022.1047019
14. Vickers, AJ, Van Calster, B, and Steyerberg, EW. Net benefit approaches to the evaluation of prediction models, molecular markers, and diagnostic tests. BMJ. (2016) 352:i6. doi: 10.1136/bmj.i6
15. Bang, CS, Ahn, JY, Kim, JH, Kim, YI, Choi, IJ, and Shin, WG. Establishing Machine Learning Models to Predict Curative Resection in Early Gastric Cancer with Undifferentiated Histology: Development and Usability Study. J Med Internet Res. (2021) 23:e25053. doi: 10.2196/25053
16. Lin, Y, Chen, L, Li, R, Liu, X, Li, Q, Cai, J, et al. Survival analysis of patients with advanced non-small cell lung cancer receiving EGFR-TKI treatment of Yunnan in southwestern China: a real-world study. Front Oncol. (2023) 13:1156647. doi: 10.3389/fonc.2023.1156647
17. Team, NLSTR, Aberle, DR, Adams, AM, Berg, CD, Black, WC, Clapp, JD, et al. Reduced lung-cancer mortality with low-dose computed tomographic screening. N Engl J Med. (2011) 365:395–409. doi: 10.1056/NEJMoa1102873
18. Li, N, Tan, F, Chen, W, Dai, M, Wang, F, Shen, S, et al. National Lung Cancer Screening programme group. One-off low-dose CT for lung cancer screening in China: a multicentre, population-based, prospective cohort study. Lancet. Respir Med. (2022) 10:378–91. doi: 10.1016/S2213-2600(21)00560-9
19. Sullivan, FM, Mair, FS, Anderson, W, Armory, P, Briggs, A, Chew, C, et al. Early Diagnosis of Lung Cancer Scotland (ECLS) Team. Earlier diagnosis of lung cancer in a randomised trial of an autoantibody blood test followed by imaging. Eur Respir J. (2021) 57:2000670. doi: 10.1183/13993003.00670-2020
20. Sexauer, D, Gray, E, and Zaenker, P. Tumour- associated autoantibodies as prognostic cancer biomarkers- a review. Autoimmun Rev. (2022r) 21:103041. doi: 10.1016/j.autrev.2022.103041
21. Bi, H, Yin, L, Fang, W, Song, S, Wu, S, and Shen, J. Association of CEA, NSE, CYFRA 21-1, SCC-Ag, and ProGRP with Clinicopathological Characteristics and Chemotherapeutic Outcomes of Lung Cancer. Lab Med. (2023) 54:372–9. doi: 10.1093/labmed/lmac122
22. Jin, T, He, Z, Li, Z, Tang, J, Xu, J, Wu, W, et al. [Risk Factors and Sampling Range Evaluation of Lymph node Metastasis for Non-small Cell Lung Cancer with Diameter ≤2 cm]. Zhongguo Fei Ai Za Zhi. (2023): 26:507–514. Chinese. doi: 10.3779/j.issn.1009-3419.2023.102.26
23. Gugulothu, V, and Balaji, S. An early prediction and classification of lung nodule diagnosis on CT images based on hybrid deep learning techniques[J]. Multimedia Tools and Applications. (2022):1–21. doi: 10.1007/s11042-023-15802-2
24. Mazzone, PJ, and Lam, L. Evaluating the Patient With a Pulmonary Nodule: A Review. JAMA. (2022) 327:264–73. doi: 10.1001/jama.2021.24287
25. Gould, MK, Donington, J, Lynch, WR, Mazzone, PJ, Midthun, DE, Naidich, DP, et al. Evaluation of individuals with pulmonary nodules: when is it lung cancer? Diagnosis and management of lung cancer, 3rd ed: American College of Chest Physicians evidence-based clinical practice guidelines. Chest. (2013) 143:e93S–e120S. doi: 10.1378/chest.12-2351
26. Kazerooni, EA, Armstrong, MR, Amorosa, JK, Hernandez, D, Liebscher, LA, Nath, H, et al. ACR CT Accreditation Program and the Lung Cancer Screening Program Designation. J Am Coll Radiol. (2016) 13:R30–4. doi: 10.1016/j.jacr.2015.12.010
27. Lambin, P, Rios-Velazquez, E, Leijenaar, R, Carvalho, S, van Stiphout, RG, Granton, P, et al. Radiomics: extracting more information from medical images using advanced feature analysis. Eur J Cancer. (2012) 48:441–6. doi: 10.1016/j.ejca.2011.11.036
28. Onishi, Y, Teramoto, A, Tsujimoto, M, Tsukamoto, T, Saito, K, Toyama, H, et al. Multiplanar analysis for pulmonary nodule classification in CT images using deep convolutional neural network and generative adversarial networks. Int J Comput Assist Radiol Surg. (2020) 15:173–8. doi: 10.1007/s11548-019-02092-z
29. Gao, N, Tian, S, Li, X, Huang, J, Wang, J, Chen, S, et al. Three-Dimensional Texture Feature Analysis of Pulmonary Nodules in CT Images: Lung Cancer Predictive Models Based on Support Vector Machine Classifier. J Digit Imaging. (2020) 33:414–22. doi: 10.1007/s10278-019-00238-8
30. Hua, KL, Hsu, CH, Hidayati, SC, Cheng, WH, and Chen, YJ. Computer-aided classification of lung nodules on computed tomography images via deep learning technique. Onco Targets Ther. (2015) 8:2015–22. doi: 10.2147/OTT.S80733
31. Wang, Q, Zeng, A, Zhu, M, and Song, L. Dual inhibition of EGFRVEGF: An effective approach to the treatment of advanced nonsmall cell lung cancer with EGFR mutation (Review). Int J Oncol. (2023) 62:26. doi: 10.3892/ijo.2023.5474
32. Zhao, Y, Guo, S, Deng, J, Shen, J, Du, F, Wu, X, et al. VEGF/VEGFR-Targeted Therapy and Immunotherapy in Non-small Cell Lung Cancer: Targeting the Tumor Microenvironment. Int J Biol Sci. (2022) 18:3845–58. doi: 10.7150/ijbs.70958
33. He, X, and Wang, M. Application Value of Serum TK1 and PCDGF, CYFRA21-1, NSE, and CEA plus Enhanced CT Scan in the Diagnosis of Nonsmall Cell Lung Cancer and Chemotherapy Monitoring[J]. Journal of oncology. (2022) 2022:8800787. doi: 10.1155/2022/8800787
34. Ren, S, Zhang, S, Jiang, T, He, Y, Ma, Z, Cai, H, et al. Early detection of lung cancer by using an autoantibody panel in Chinese population. Oncoimmunology. (2017) 7:e1384108. doi: 10.1080/2162402X.2017.1384108
35. Luo, B, Mao, G, Ma, H, and Chen, S. The role of seven autoantibodies in lung cancer diagnosis. J Thorac Dis. (2021) 13:3660–8. doi: 10.21037/jtd-21-835
36. Xu, L, Chang, N, Yang, T, Lang, Y, Zhang, Y, Che, Y, et al. Development of Diagnosis Model for Early Lung Nodules Based on a Seven Autoantibodies Panel and Imaging Features. Front Oncol. (2022) 12:883543. doi: 10.3389/fonc.2022.883543
Keywords: automated machine learning, predictive models, infiltrative lung cancer, medical image artificial intelligence recognition system (MIARS), 7-TAABs
Citation: Meng L, Zhu P and Xia K (2024) Application value of the automated machine learning model based on modified CT index combined with serological indices in the early prediction of lung cancer. Front. Public Health. 12:1368217. doi: 10.3389/fpubh.2024.1368217
Edited by:
Yi Zhu, Yangzhou University, ChinaReviewed by:
Rao L. Divi, National Institutes of Health (NIH), United StatesXiangmin Meng, Zhejiang Wanli University, China
Copyright © 2024 Meng, Zhu and Xia. This is an open-access article distributed under the terms of the Creative Commons Attribution License (CC BY). The use, distribution or reproduction in other forums is permitted, provided the original author(s) and the copyright owner(s) are credited and that the original publication in this journal is cited, in accordance with accepted academic practice. No use, distribution or reproduction is permitted which does not comply with these terms.
*Correspondence: Ping Zhu, emh1cGluZzUyNjJAMTYzLmNvbQ==; Kaijian Xia, a2p4aWFAc3VkYS5lZHUuY24=