 Tian qiang Wu
 Xinyu Han
 Chun yan Liu2
94% of researchers rate our articles as excellent or good
Learn more about the work of our research integrity team to safeguard the quality of each article we publish.
Find out more
ORIGINAL RESEARCH article
Front. Public Health, 14 June 2024
Sec. Environmental Health and Exposome
Volume 12 - 2024 | https://doi.org/10.3389/fpubh.2024.1366838
Background: In recent years, the prevalence of obesity has continued to increase as a global health concern. Numerous epidemiological studies have confirmed the long-term effects of exposure to ambient air pollutant particulate matter 2.5 (PM2.5) on obesity, but their relationship remains ambiguous.
Methods: Utilizing large-scale publicly available genome-wide association studies (GWAS), we conducted univariate and multivariate Mendelian randomization (MR) analyses to assess the causal effect of PM2.5 exposure on obesity and its related indicators. The primary outcome given for both univariate MR (UVMR) and multivariate MR (MVMR) is the estimation utilizing the inverse variance weighted (IVW) method. The weighted median, MR-Egger, and maximum likelihood techniques were employed for UVMR, while the MVMR-Lasso method was applied for MVMR in the supplementary analyses. In addition, we conducted a series of thorough sensitivity studies to determine the accuracy of our MR findings.
Results: The UVMR analysis demonstrated a significant association between PM2.5 exposure and an increased risk of obesity, as indicated by the IVW model (odds ratio [OR]: 6.427; 95% confidence interval [CI]: 1.881–21.968; PFDR = 0.005). Additionally, PM2.5 concentrations were positively associated with fat distribution metrics, including visceral adipose tissue (VAT) (OR: 1.861; 95% CI: 1.244–2.776; PFDR = 0.004), particularly pancreatic fat (OR: 3.499; 95% CI: 2.092–5.855; PFDR =1.28E-05), and abdominal subcutaneous adipose tissue (ASAT) volume (OR: 1.773; 95% CI: 1.106–2.841; PFDR = 0.019). Furthermore, PM2.5 exposure correlated positively with markers of glucose and lipid metabolism, specifically triglycerides (TG) (OR: 19.959; 95% CI: 1.269–3.022; PFDR = 0.004) and glycated hemoglobin (HbA1c) (OR: 2.462; 95% CI: 1.34–4.649; PFDR = 0.007). Finally, a significant negative association was observed between PM2.5 concentrations and levels of the novel obesity-related biomarker fibroblast growth factor 21 (FGF-21) (OR: 0.148; 95% CI: 0.025–0.89; PFDR = 0.037). After adjusting for confounding factors, including external smoke exposure, physical activity, educational attainment (EA), participation in sports clubs or gym leisure activities, and Townsend deprivation index at recruitment (TDI), the MVMR analysis revealed that PM2.5 levels maintained significant associations with pancreatic fat, HbA1c, and FGF-21.
Conclusion: Our MR study demonstrates conclusively that higher PM2.5 concentrations are associated with an increased risk of obesity-related indicators such as pancreatic fat content, HbA1c, and FGF-21. The potential mechanisms require additional investigation.
Obesity is a common chronic metabolic disease that is primarily characterized by excessive total fat content or local increase and abnormal distribution. It can be complicated by type 2 diabetes, hyperlipidemia, nonalcoholic fatty liver, depression, osteoarthritis, asthma, and other multisystem diseases, which have severe effects on quality of life and life expectancy (1). Since 1975, the number of obese patients in the globe has nearly doubled, according to a report published by the Globe Health Organization in 2021. In 2016, more than 39 percent of adults aged 18 and older were overweight, 13 percent of them were obese, and the number of obese children and adolescents reached an alarming 124 million 1(2), rendering obesity a severe global public health problem. For the diagnosis of obesity, body mass index (BMI) is the critical marker, and fat distribution such as visceral adipose tissue (VAT), abdominal subcutaneous adipose tissue (ASAT), pancreas fat, glycolipid metabolism indicators like glycated hemoglobin (HbA1c), triglycerides (TG), and biomarker fibroblast growth factor 21 (FGF-21) is vital in the early screening and evaluation of obesity and obesity-related diseases. VAT is the visceral adipose tissue surrounding the abdominal organs, which is the body’s primary site for energy storage. Its excessive accumulation is linked to a number of metabolic disorders, including insulin resistance and inflammatory response (3).
ASAT is the main subcutaneous adipose reservoir. Although it has fewer adverse effects on metabolic health than VAT, it has a stronger connection with the physical characteristics of obesity (4). Pancreas fat refers to the fat content of pancreatic tissue, and its abnormal aggregation can disrupt the function of the islets of Langerhans β Cells, resulting in a disorder of blood glucose regulation (5). HbA1c is a product of the combination of hemoglobin and glucose, which can reflect the average blood sugar level over the past 2–3 months. In obese patients, an increase in HbA1c may indicate a decrease in insulin sensitivity and impaired glucose metabolism (6). TG is the predominant form of lipid in plasma, which is generally synthesized in the liver and stored in adipocytes. TG abnormalities are frequently associated with obesity and metabolic syndrome (7). FGF defines a family of proteins essential for cell proliferation, differentiation, migration, and survival. It is strongly connected to the proliferation and differentiation of adipocytes, and its abnormal expression can contribute to the development of obesity and its related complications (8). The etiology and pathogenesis of obesity are still unclear, and current research has attributed it to dietary habits, behavior, genetics, and socioeconomic and environmental factors (9–11).
With the acceleration of urbanization on a global scale, emissions of pollutants from industrial production and transportation continue to rise, and the impact of air pollution on obesity is becoming increasingly significant. Particulate matter, the primary component of air pollution, alludes to the suspended and dispersed solid or liquid particles. According to the aerodynamic diameter, it can be divided into PM2.5, PM10, and PM0.1 (12). PM2.5 is defined as particles in the atmosphere with a diameter of 2.5 microns or less, which have a small particle size, a large surface area, and a high level of activity. They are prone to transporting toxic substances and can linger in the atmosphere for a long time. After inhalation, they can further deposit in the alveoli, as well as penetrate the capillaries and systemic circulation (13). Thus, PM2.5 has a more significant negative impact on environmental quality and human health.
In recent years, mounting evidence has demonstrated that PM2.5 is a significant contributor to overweight, obesity, and endocrine and metabolic disorders tied to obesity. A large longitudinal cohort study involving over 3.9 million US veterans over an 8-year follow-up period revealed a 10-g/m3 higher average annual PM2.5 concentration was positively correlated with clinical risk of obesity (hazard ratio (HR) = 1.08, 95% confidence interval (CI): 1.06–1.11) and the risk of a 10-pounds (4.54 kg) weight gain (HR = 1.07, 95% CI: 1.06–1.08) (14). Another large-scale cross-sectional study involving 47,204 adults in 13 provinces of China (15) indicated that every 10 μg/m3 increase in PM2.5 is related to a higher incidence of obesity (OR = 1.12, 95% CI: 1.09–1.14) as well as abdominal adiposity (OR = 1.10, 95% CI =1.07–1.13). In addition, longitudinal cohort research from Taiwan (16) demonstrated that an increase of 10 μg/m3 in the annual average concentration of PM2.5 is linked to an increase in TG (adjusted hazard ratio (aHR) =1.17, 95% CI: 1.11–1.23) and a rise in fasting blood glucose (aHR = 1.15, 95% CI: 1.10–1.20) suggesting a relationship between PM2.5 and impaired glucose and lipid metabolism. A few cross-sectional studies, however, have shown that exposure to environmental pollutants such as PM2.5 does not substantially contribute to obesity and related lipid metabolism indicators (17, 18). The inconsistency in the results of observational research can be due to sample size bias and residual confounding factors. At present, the causality between PM2.5 and obesity and its related indicators is still ambiguous, and further proof is required for confirmation.
MR is an epidemiological technique designed to overcome the limitations of observational investigations, and it has been extensively utilized in a variety of studies. The central concept of MR is to infer the causal relationship between exposure and outcome employing genetic variation as Instrumental variables (IVs). Given the fact that genetic variation is assigned randomly by parents to offspring at conception and is relatively independent of factors such as social environment and personal lifestyle, it is possible to avoid the influence of remaining confounding factors or reverse causal relationships in observational studies and obtain more reliable findings (19, 20). MVMR is an emerging technology that can integrate the genetic variation of multiple risk factors into a single model and simultaneously evaluate the corresponding exposure in order to minimize the impact of mixed variables (21). This study implemented univariate and multivariate MR analyses to investigate the causal association between PM2.5 and obesity and the accompanying indicators.
Utilizing publicly available data, we conducted a two-sample MR analysis to assess the causal relationship between PM2.5 and obesity and its related indicators. The methodology of this MR investigation is illustrated in Figure 1. The IVs chosen for causal estimation must satisfy three fundamental assumptions (22): Assumption 1, The IVs should be strongly related to PM2.5 (p < 5 × 10⁻⁸); Assumption 2: The correlation between IVs of PM2.5 and obesity or related indicators is unaffected by the presence of confounding factors; Assumption 3: The IVs only influences the risk of obesity and related indicators via PM2.5, rather than other channels. Prior observational clinical trials and MR studies have demonstrated that exposure to tobacco smoke, physical activity, EA, participation in sports clubs or gym leisure activities, and TDI are risk factors for the onset of obesity and impaired glucose and lipid metabolism (23–28). Consequently, we adjusted the genetic susceptibility of these five variables further using MVMR. Since our data is derived from publicly accessible GWAS aggregated statistical data, no ethical approval is required.
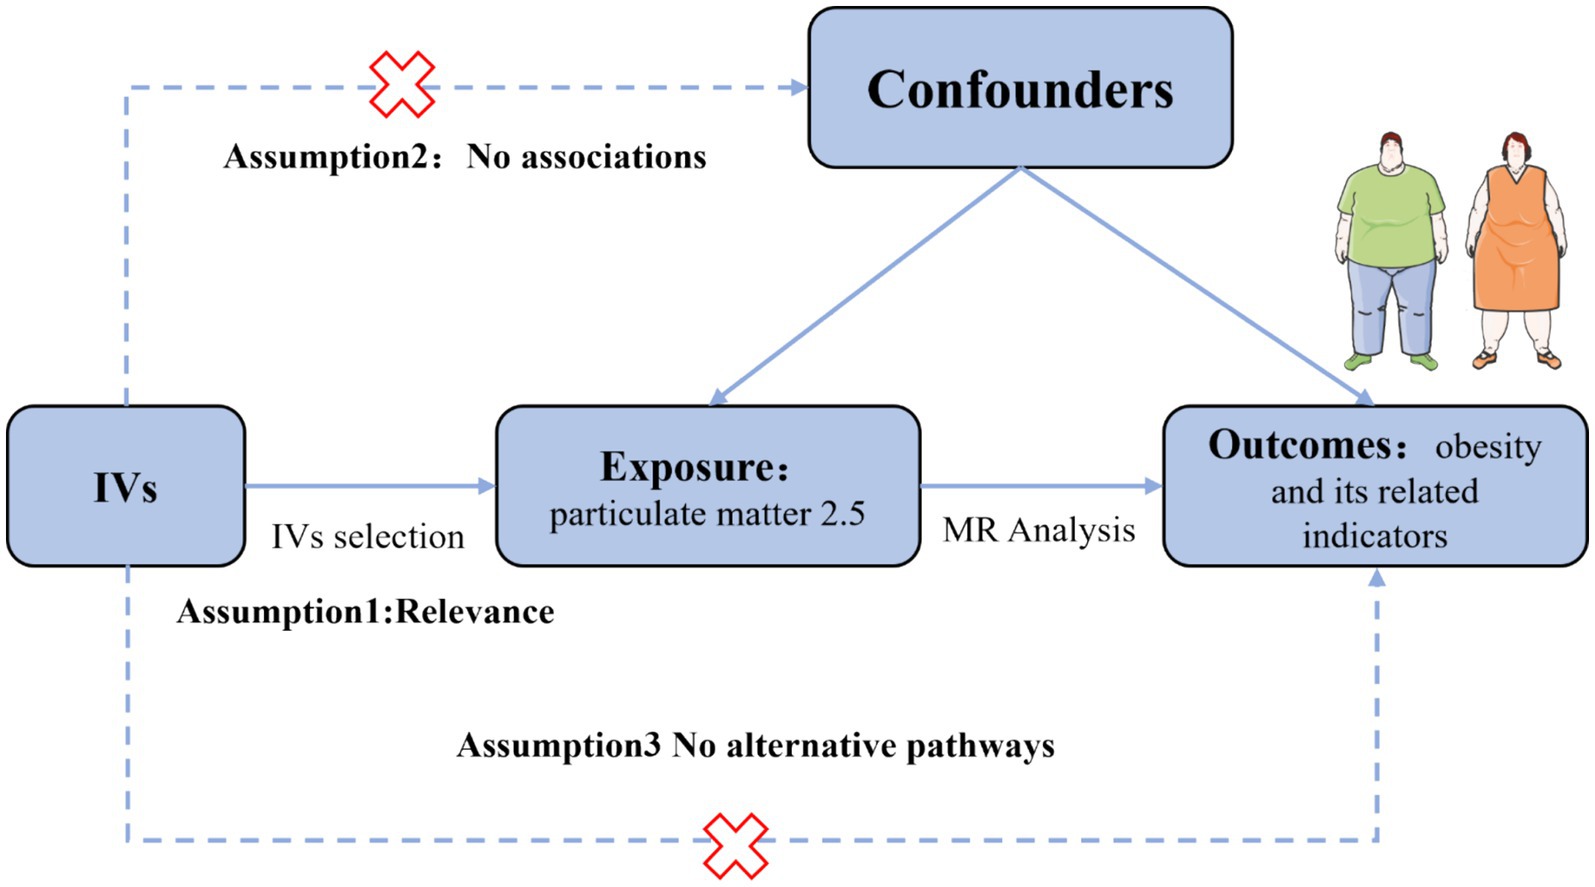
Figure 1. Assumption of the Mendelian randomization (MR) analysis for PM2.5 and obesity and its related indicators.
The summary statistical data for PM2.5 originates from the MRC-IEU alliance (dataset ID: ieu-b-4879), which includes 423,796 participants of European ancestry. The Land Use Regression (LUR) model was utilized to assess the PM2.5 concentration near the participant’s residences (29). Obesity and its associated indicators (including VAT, ASAT, Pancreatic fat, Hba1c, TG, and FGF21) were chosen as outcomes. The GWAS summary data for obesity (8,908 cases and 209,827 controls) are available from the FinnGen consortium. This large public-private collaboration research project combines estimated genotype data derived from newly collected and legacy samples from the Finnish Biobank with digital record data from the Finnish Health Registry (30). The combined level data for VAT, ASAT, and pancreas fat were obtained from the study on deep learning algorithms conducted by Liu Y. et al. in 2021, which utilized abdominal magnetic resonance imaging (MRI) to determine the genetic structure of body composition (31). The dataset pertaining to HbA1c and TG originated from a GWAS study undertaken by Howe LJ et al., involving 182,416 and 69,360 European males and females, respectively. The IVs with regard to FGF21 were extracted from a GWAS study conducted by Gilly et al. (32), which identified 18,160,173 single nucleotide polymorphisms (SNPs) among 1,298 samples. In addition, aggregate data regarding external smoke exposure, physical activity, EA, participation in sports clubs or gym leisure activities, and TDI were obtained from the Neale Lab or MRC-IEU consortium. All participants in this study are of European descent. Table 1 provides a summary of all datasets included in this investigation.
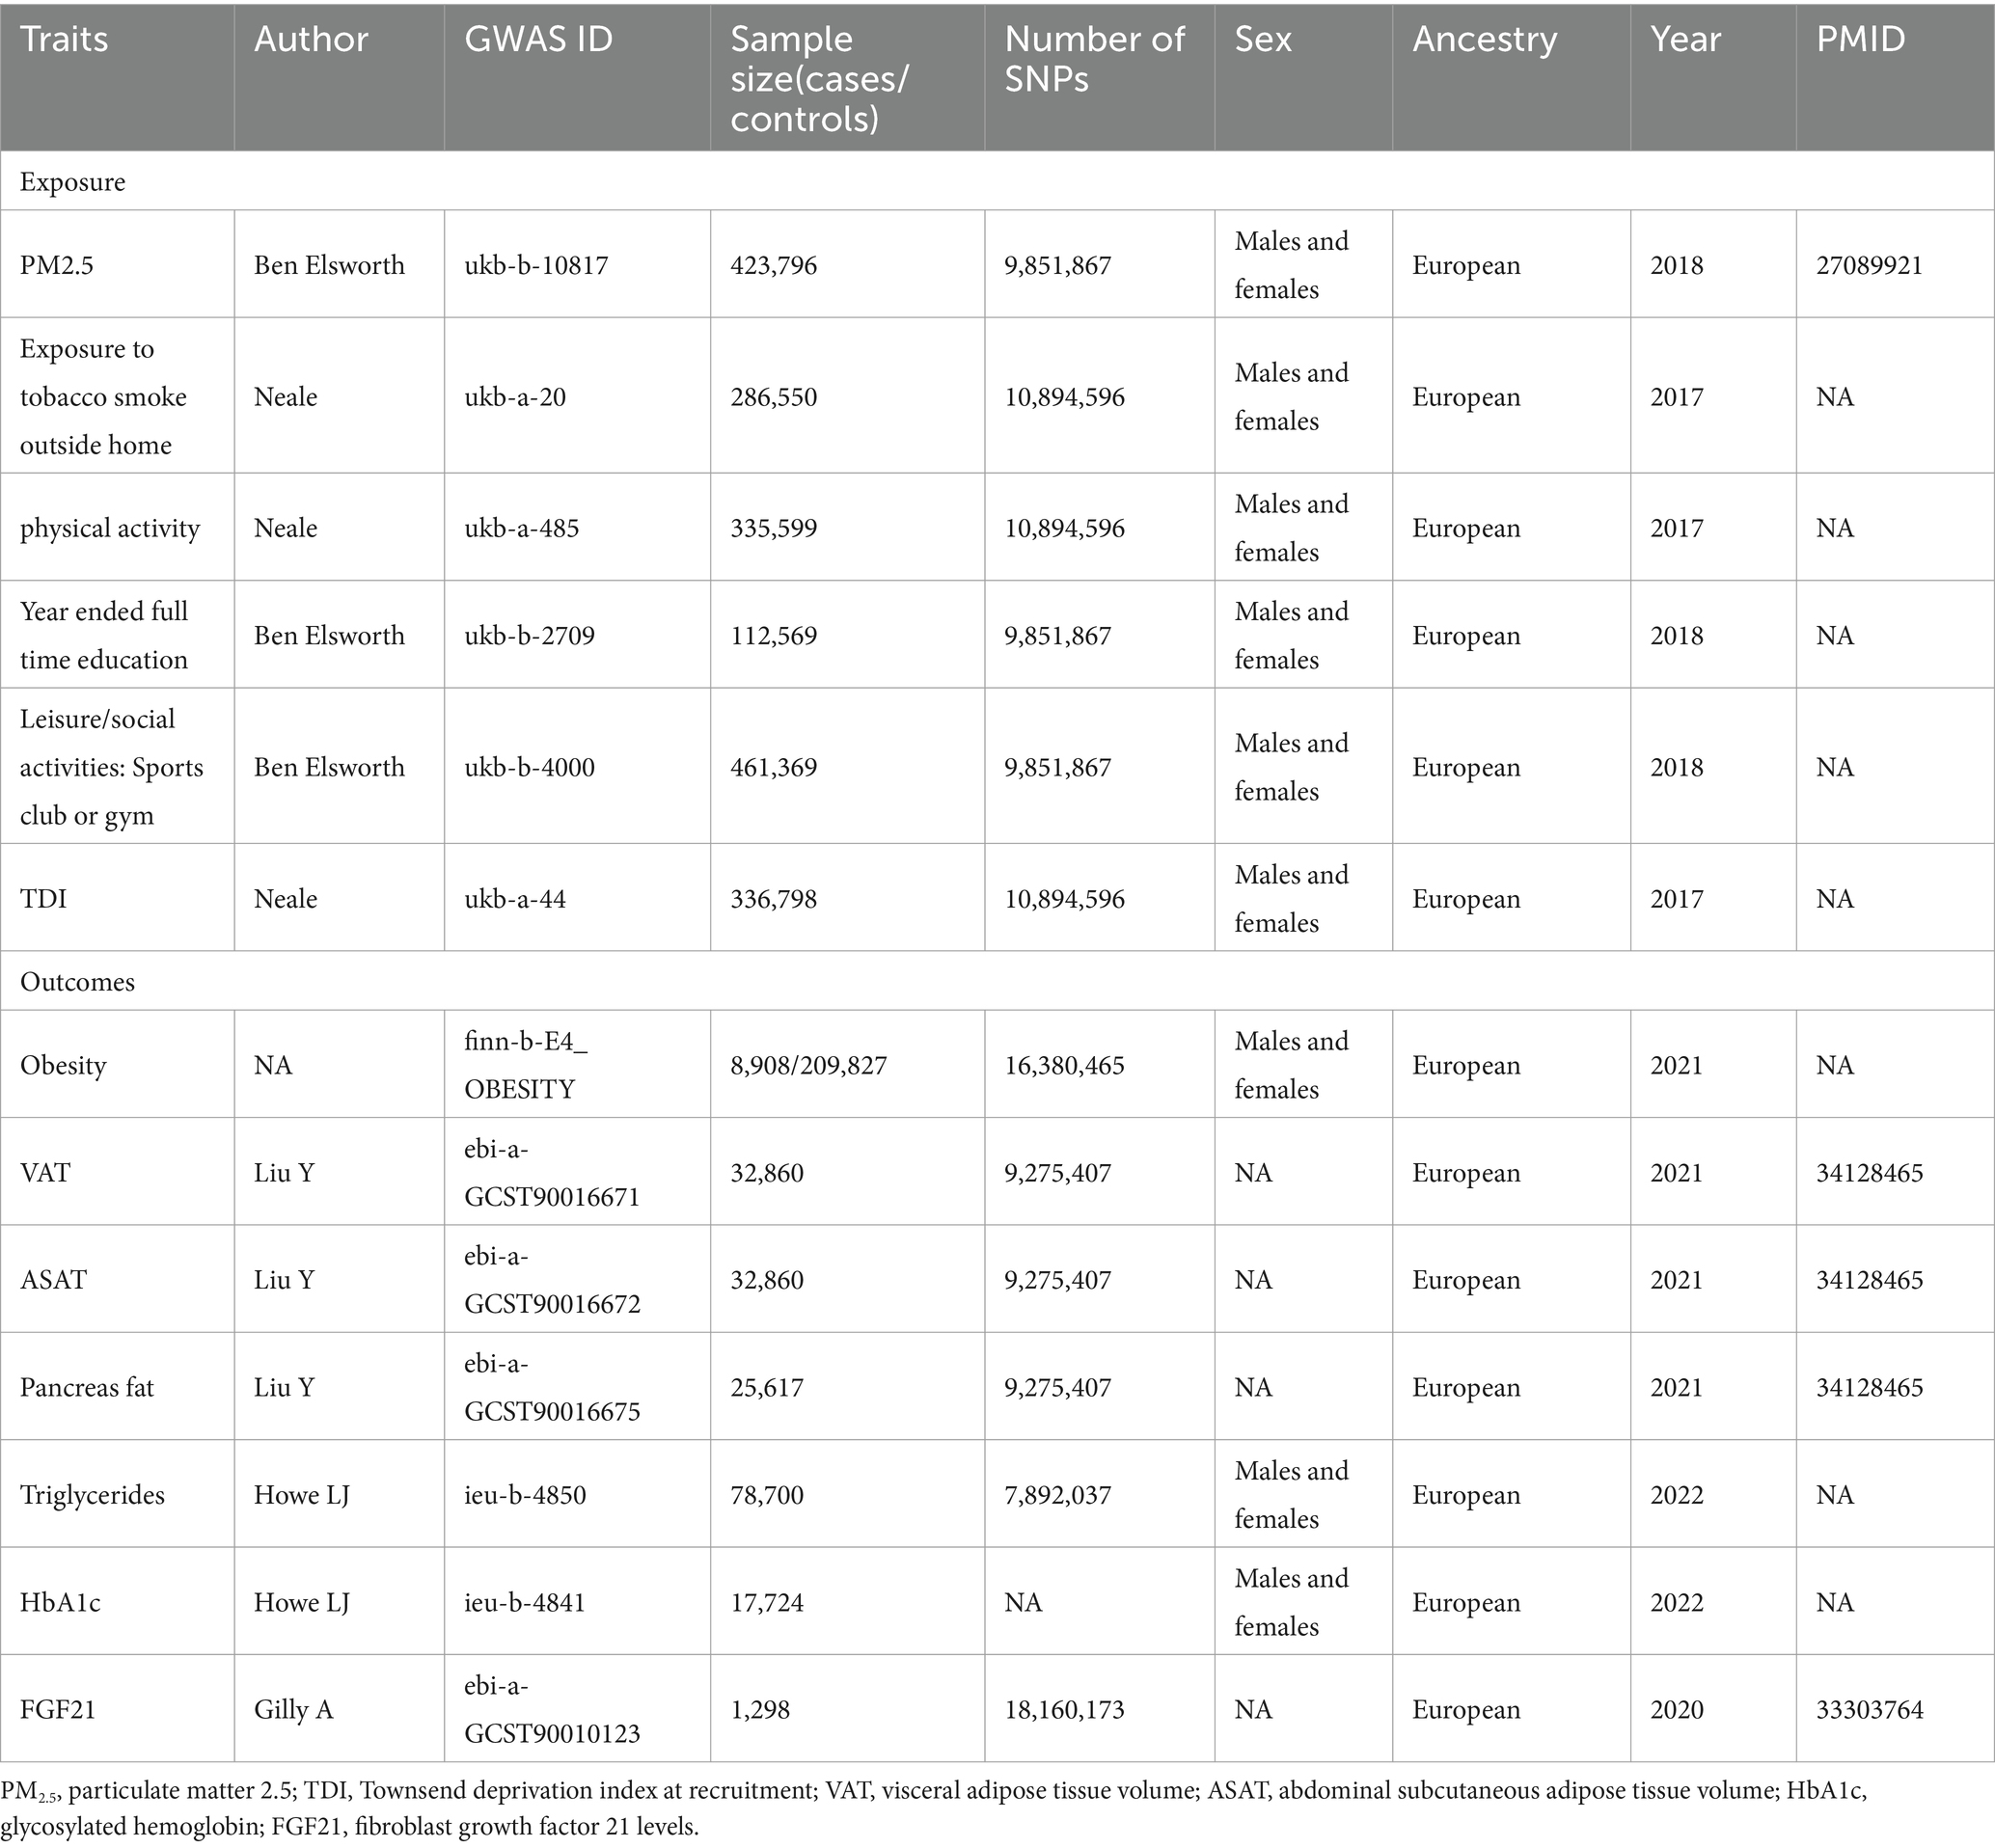
Table 1. Details of studies included in Mendelian randomization (MR) analyses.
We implemented a specific procedure for selecting the IVs to fulfill the three critical assumptions of MR analysis. Firstly, genetic variations must be strongly associated with the exposure to satisfy the first hypothesis. We extracted SNPs strongly related to PM2.5 at the significance level of p < 5 × 10⁻⁸. To fulfill the requirements of hypothesis 2 in the MR framework, we established a stringent criterion (r2 < 0.001 and a clumping distance of 10,000 kb), ensuring that the selected IVs were conditionally independent. Only SNPs with the lowest p-values were retained to mitigate the impact of linkage disequilibrium (LD) among the SNPs (33). Furthermore, the potential pleiotropic effects were controlled by extracting the secondary phenotype of each SNP from PhenoScan V2 (34).2 It is widely recognized that parameters such as body mass index, waist circumference, and waist-to-hip ratio are strongly correlated with obesity, fat distribution, and glucose and lipid metabolism (35–38). Consequently, we eliminated any independent variables associated with these parameters or directly linked to outcome measures. This approach helps ensure that the IVs used in our MR study are specific to the exposure of interest and not influenced by other pathways that could bias the results. Ultimately, we extracted exposure IVs from the outcome data and conducted data harmonization to exclude SNPs with inconsistent exposure and outcome data alleles.
Variance (R2) and the F-statistic were utilized to evaluate the robustness of IVs in order to prevent bias from a weak tool. The F-statistic for each SNP is determined by the following formula: F = R2/(1-R2) [(N-K-1)/K], where N is the sample size, K is the total number of SNPs chosen for MR analysis, and R2 is the overall proportion of phenotypic variations explained by all SNPs in our MR model (39). R2 was estimated for all SNP through the given formula: R2 = Σ [2 × (1 – MAF) × MAF × β2/ (SE2 × N)]. MAF is the minor allele frequency for each SNP, and SE and β are the standard error and effect size coefficient, respectively. An F-statistic greater than 10 was regarded as adequate for the relationship between IVs and exposure to avoid weak tool bias from influencing the results of MR analyses (22).
The IVW method was utilized as the primary analysis. In addition, weighted median, MR Egger, and maximum likelihood were used to assess robustness effects. The IVW method is an expansion of the Wald ratio estimator based on meta-analytic principles, which can offer precise estimates in the absence of horizontal or balanced pleiotropy (40). With at least 50 percent of the weight of the analysis originating from valid IVs, the weighted median method is able to draw a trustworthy conclusion (41). Despite its low statistical power, the MR Egger method can detect potential pleiotropy and present estimates after controlling for multiple effects (42). The maximum likelihood method is analogous to the IVW method, where the results are unbiased, and the standard error is less than that of the IVW method under the assumption of no heterogeneity and horizontal pleiotropy (43). On the basis of prior research (23–28), we adjusted for external smoke exposure, physical activity, EA, participation in sports clubs or gym leisure activities, and TDI in MVMR to illustrate a causal relationship between PM2.5 and obesity and its related indicators. IVW and MR-Lasso (44) were included in the approaches we employed to execute MVMR.
In this investigation, numerous sensitivity analyses were performed to assure the stability and dependability of the MR results. First, Cochran’s Q test was applied to evaluate the heterogeneity between SNPs, where a p-value greater than 0.05 indicated no heterogeneity. Secondly, the MR-Egger intercept was utilized to quantify the horizontal pleiotropy of IVs. Thirdly, we performed the leave-one-out analysis to check whether any single SNP drove the MR results. Finally, we conducted the MR-PRESSO to detect potential outlier SNPs (45). A two-sided p-value less than 0.05 was regarded as statistically significant. In order to account for multiple hypothesis testing, we calculated the adjusted p values (q values) for the false discovery rate (FDR) in the significant IVW MR analyses. We used the sequential p-value approach suggested by Benjamini and Hochberg (46). A q value less than or equal to 5% was deemed significant. The R packages TwoSampleMR (version 0.5.6) and MVMR (version 0.3) served as tools to undertake MR analyses. All data analyses were conducted utilizing version 4.3.1 of R.
In the present research, 6, 6, 6, 6, 4, 6, and 7 SNPs were ultimately identified as the IVs for PM2.5 to assess the associations between PM2.5 and Obesity, VAT, ASAT, pancreas fat, TG, HbA1c and FGF21, respectively (Supplementary Tables S1–S7). The F statistic for each of these genetic variants was greater than 10, indicating a low probability of mild instrumental bias.
The UVMR analysis demonstrated a significant association between PM2.5 exposure and an increased risk of obesity, as indicated by the IVW model (OR: 6.427; 95% CI: 1.881–21.968; PFDR = 0.005). Additionally, PM2.5 concentrations were positively associated with fat distribution metrics, including VAT (OR: 1.861; 95% CI: 1.244–2.776; PFDR = 0.004), particularly pancreatic fat (OR: 3.499; 95% CI: 2.092–5.855; PFDR =1.28E-05), and ASAT volume (OR: 1.773; 95% CI: 1.106–2.841; PFDR = 0.019). Furthermore, PM2.5 exposure correlated positively with markers of glucose and lipid metabolism, specifically TG (OR: 19.959; 95% CI: 1.269–3.022; PFDR = 0.004) and HbA1c (OR: 2.462; 95% CI: 1.34–4.649; PFDR = 0.007). Finally, a significant negative association was observed between PM2.5 concentrations and levels of the novel obesity-related biomarker FGF-21 (OR: 0.148; 95% CI: 0.025–0.89; PFDR = 0.037). Figure 2 depicts the causal associations between genetically predicted PM2.5 and the risk of obesity and its related indicators. The scatter plots of the association between PM2.5 and obesity and its related indicators are shown in Figures 3, 4.
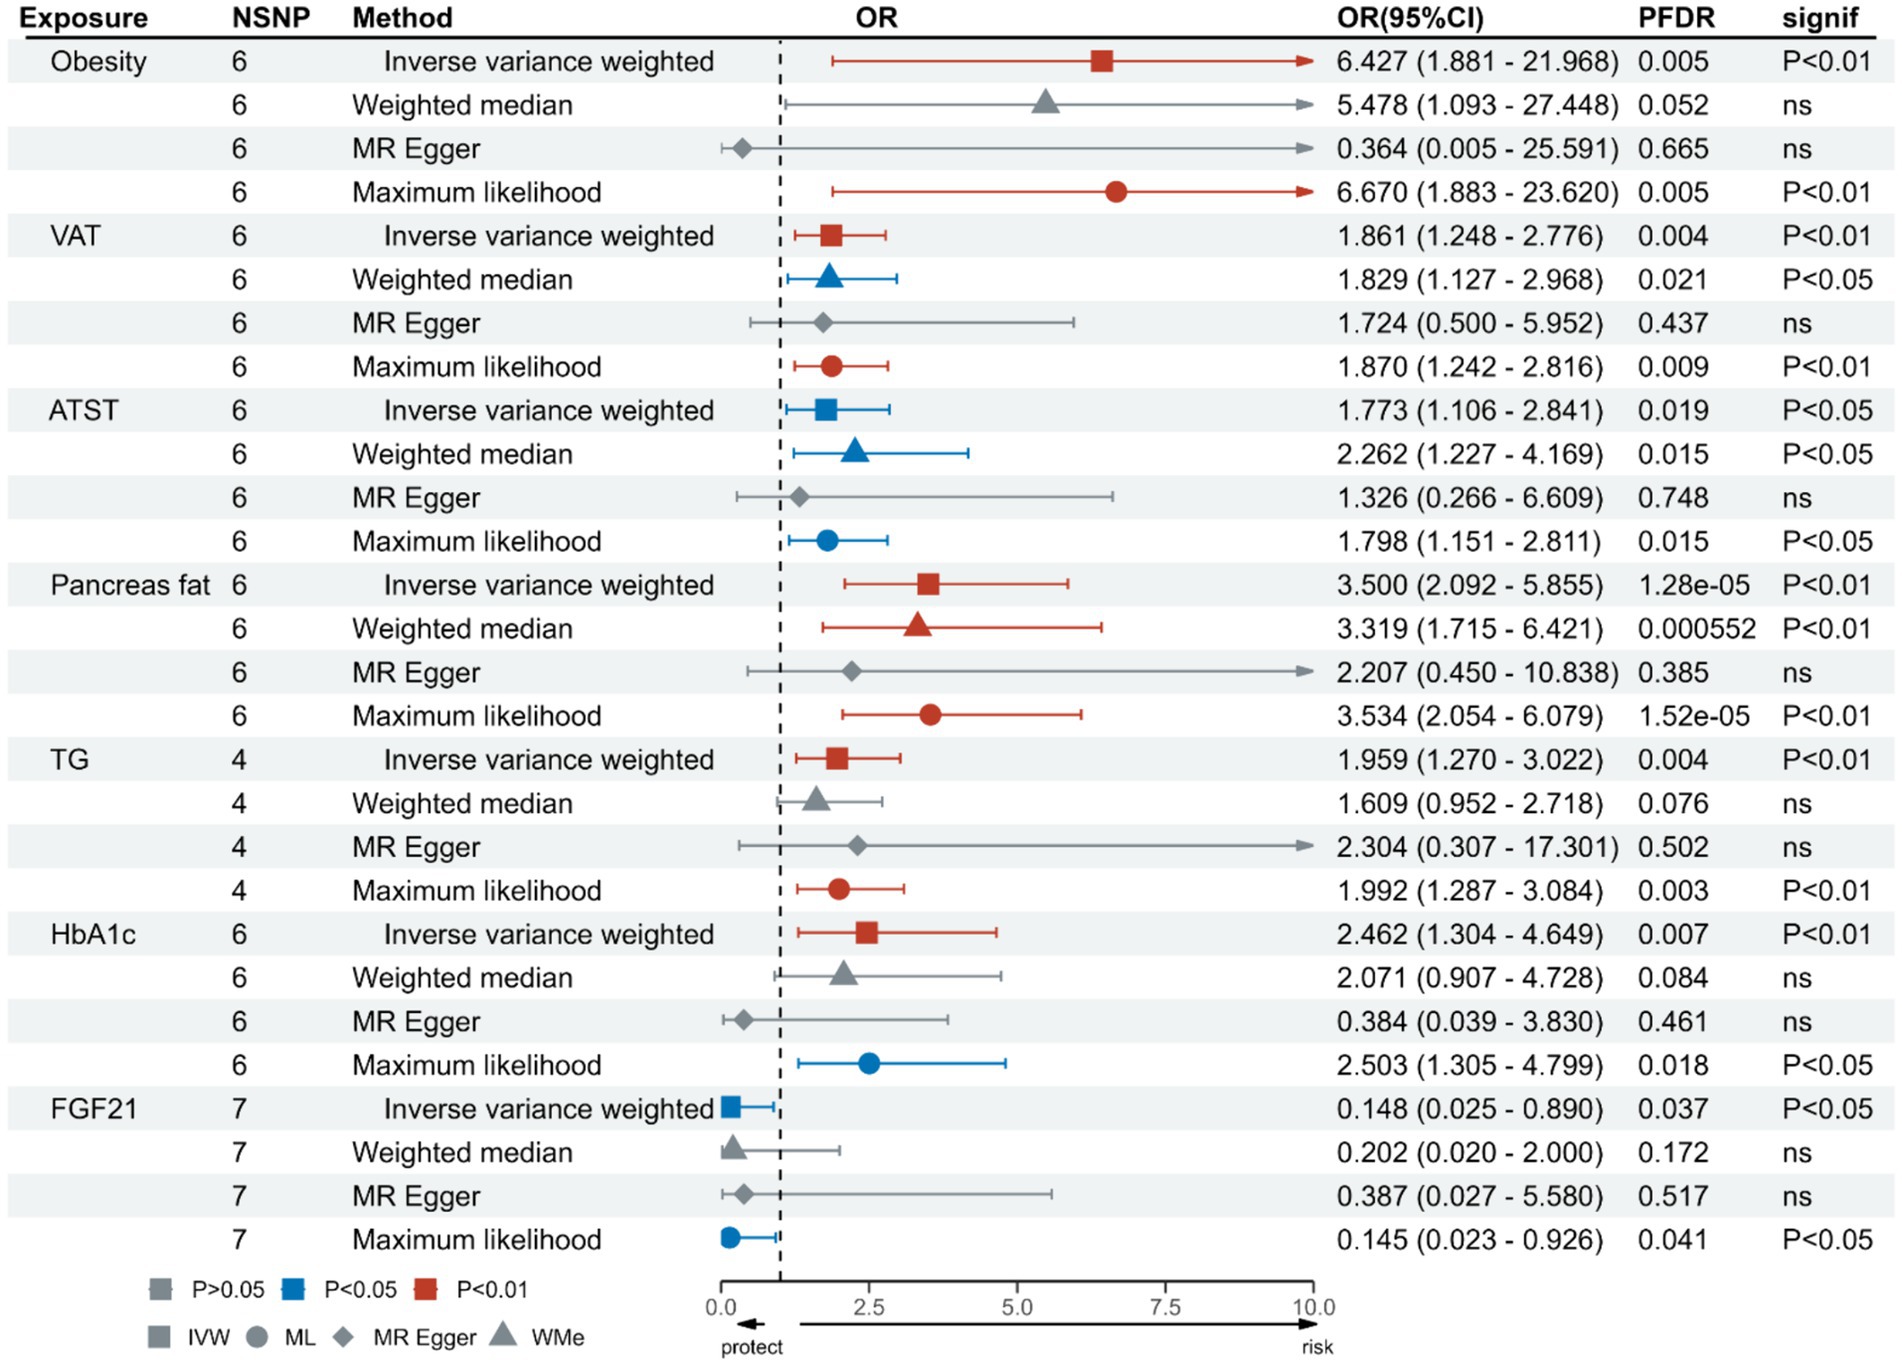
Figure 2. Association of genetically predicted PM2.5 and obesity and its related indicators.
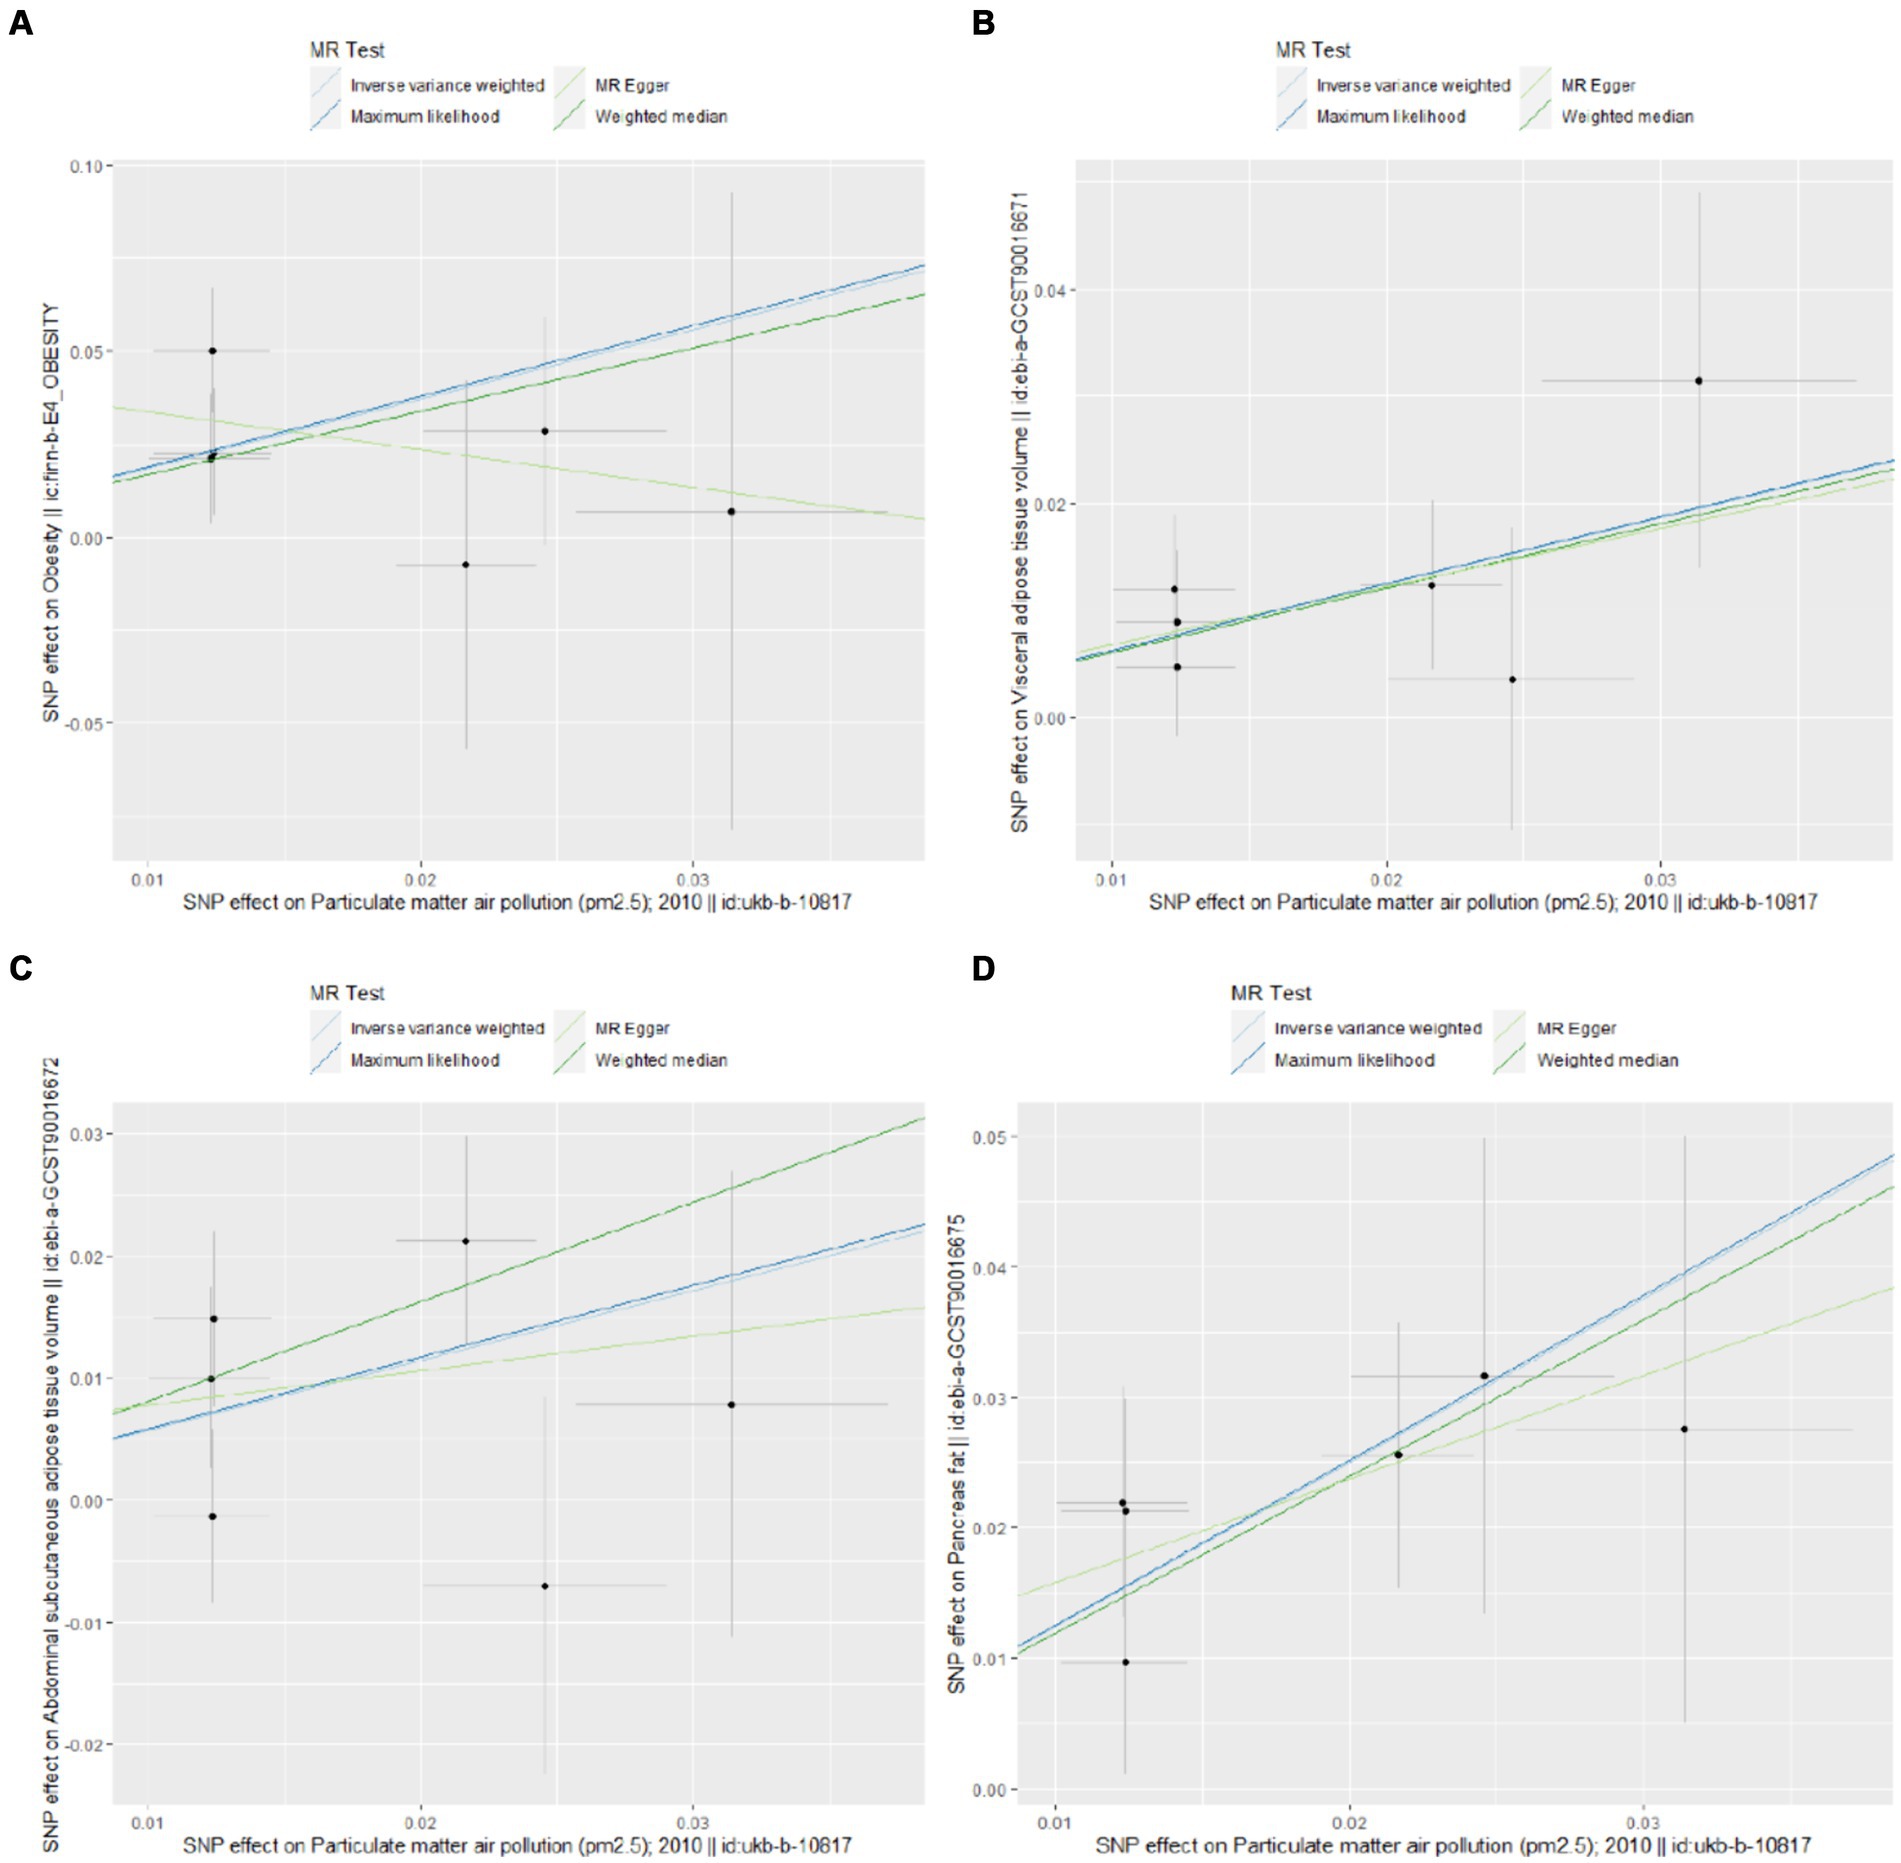
Figure 3. Scatter plots for Mendelian randomization (MR) analyses of the correlation between PM2.5 and obesity and its related indicators. (A) Obesity; (B) VAT; (C) ASAT; (D) pancreatic fat.
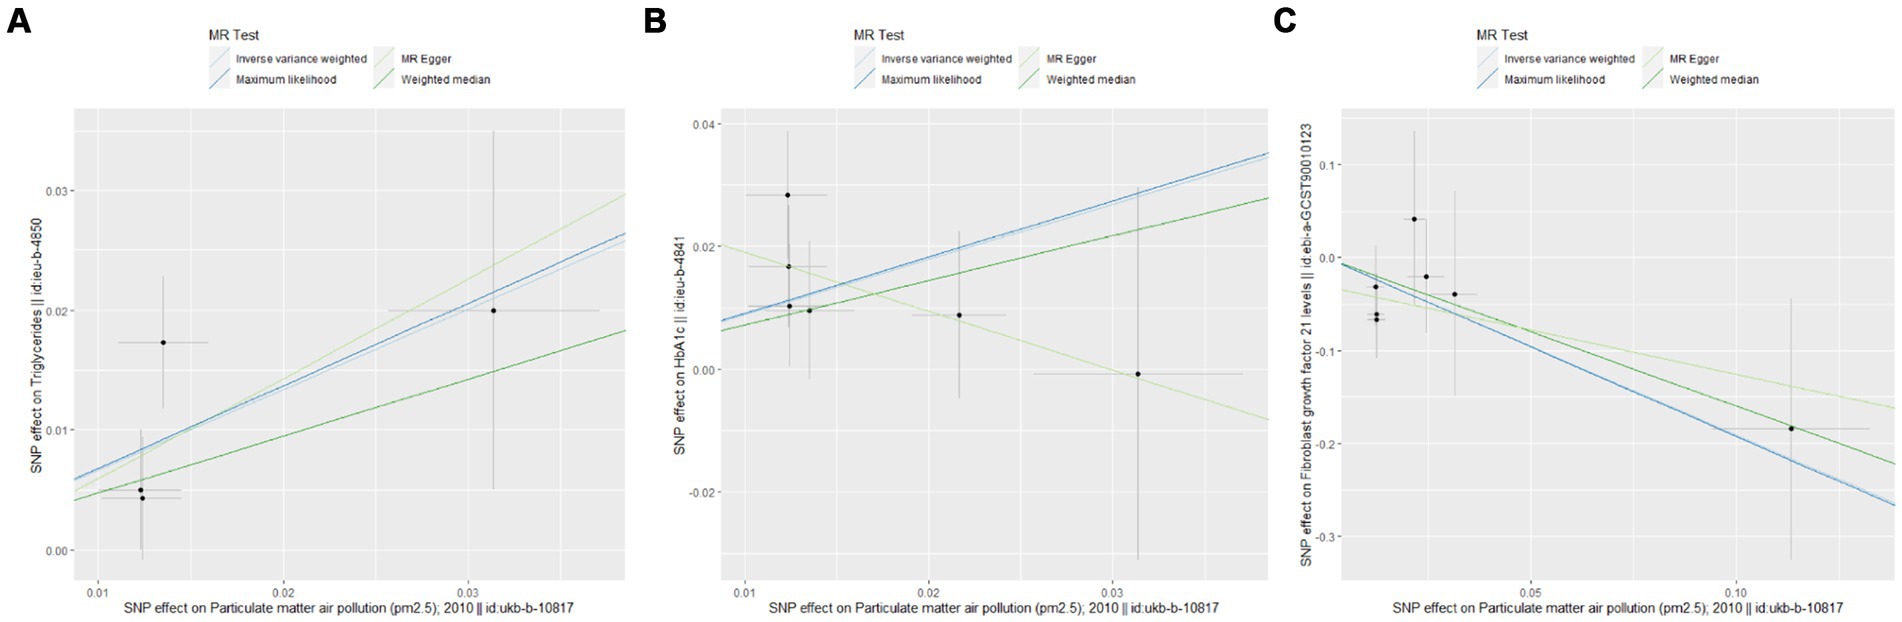
Figure 4. Scatter plots for Mendelian randomization (MR) analyses of the correlation between PM2.5 and obesity and its related indicators. (A) TG; (B) HbA1c; (C) FGF21.
In the MVMR-IVW analysis adjusting for external smoke exposure, physical activity, EA, participation in sports clubs or gym leisure activities, and TDI, the causal relationship between PM2.5 and pancreas fat (OR: 3.612; 95%CI: 1.893–6.892; p = 9.82E-05), HbA1c (OR: 5.429; 95%CI: 2.327–12.665; p = 9.00E-05) or FGF21 (OR: 0.162; 95%CI: 0.034–0.776; p = 0.023) remained significant. The MVMR-Lasso technique results additionally revealed that a causal link between PM2.5 and pancreas fat or HbA1c still exists (Supplementary Table S8). The association between PM2.5 and Obesity, VAT, ASAT, or TG did not persist, however, after adjusting for the five confounding factors mentioned above. Table 2 presents the MVMR-IVW results in detail.
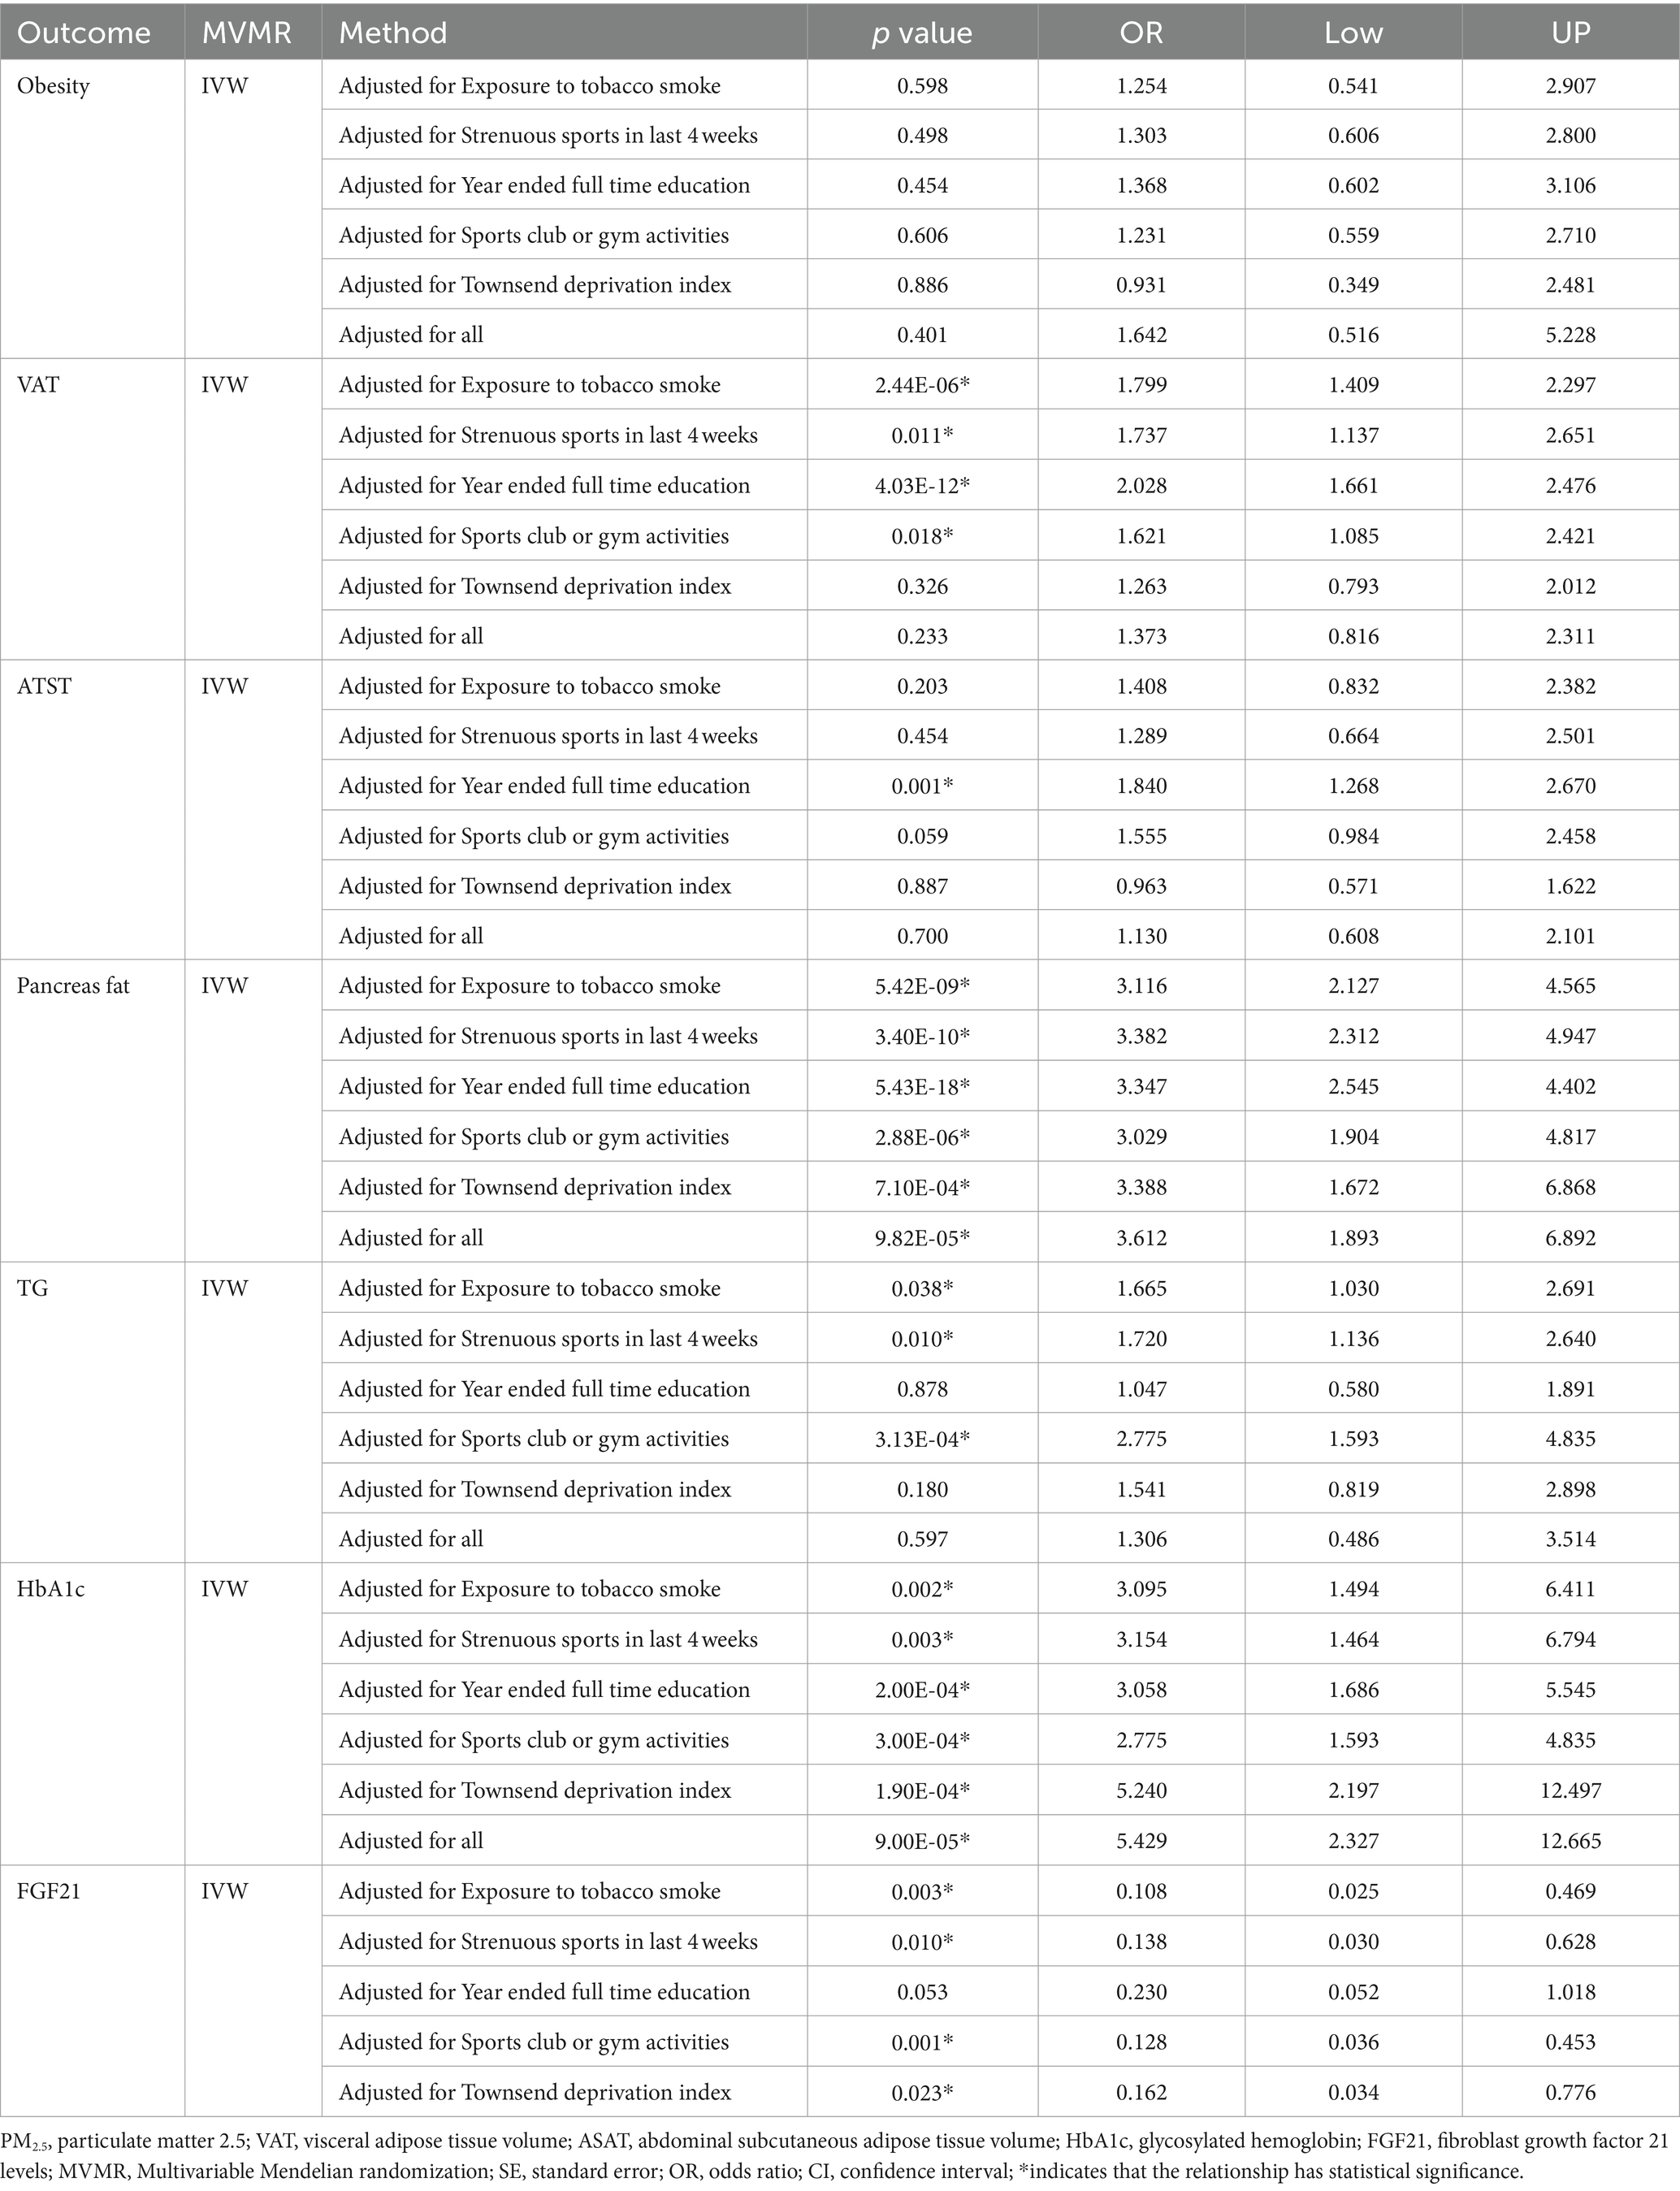
Table 2. Causal estimates of PM2.5 on obesity and its related indicators in MVMR-IVW.
The Cochran’s Q test revealed no evidence of heterogeneity, and the MR-Egger intercept test discovered no indication of horizontal pleiotropy in the MR analysis results. In addition, MR-PRESSO failed to detect any SNPs that were outliers. The results of the sensitivity analysis are presented in Table 3. The leave-one-out plots offer additional evidence for the robustness of our results and imply that the effects of a single SNP were unlikely to influence causal estimates (Supplementary Figures S1–S7).
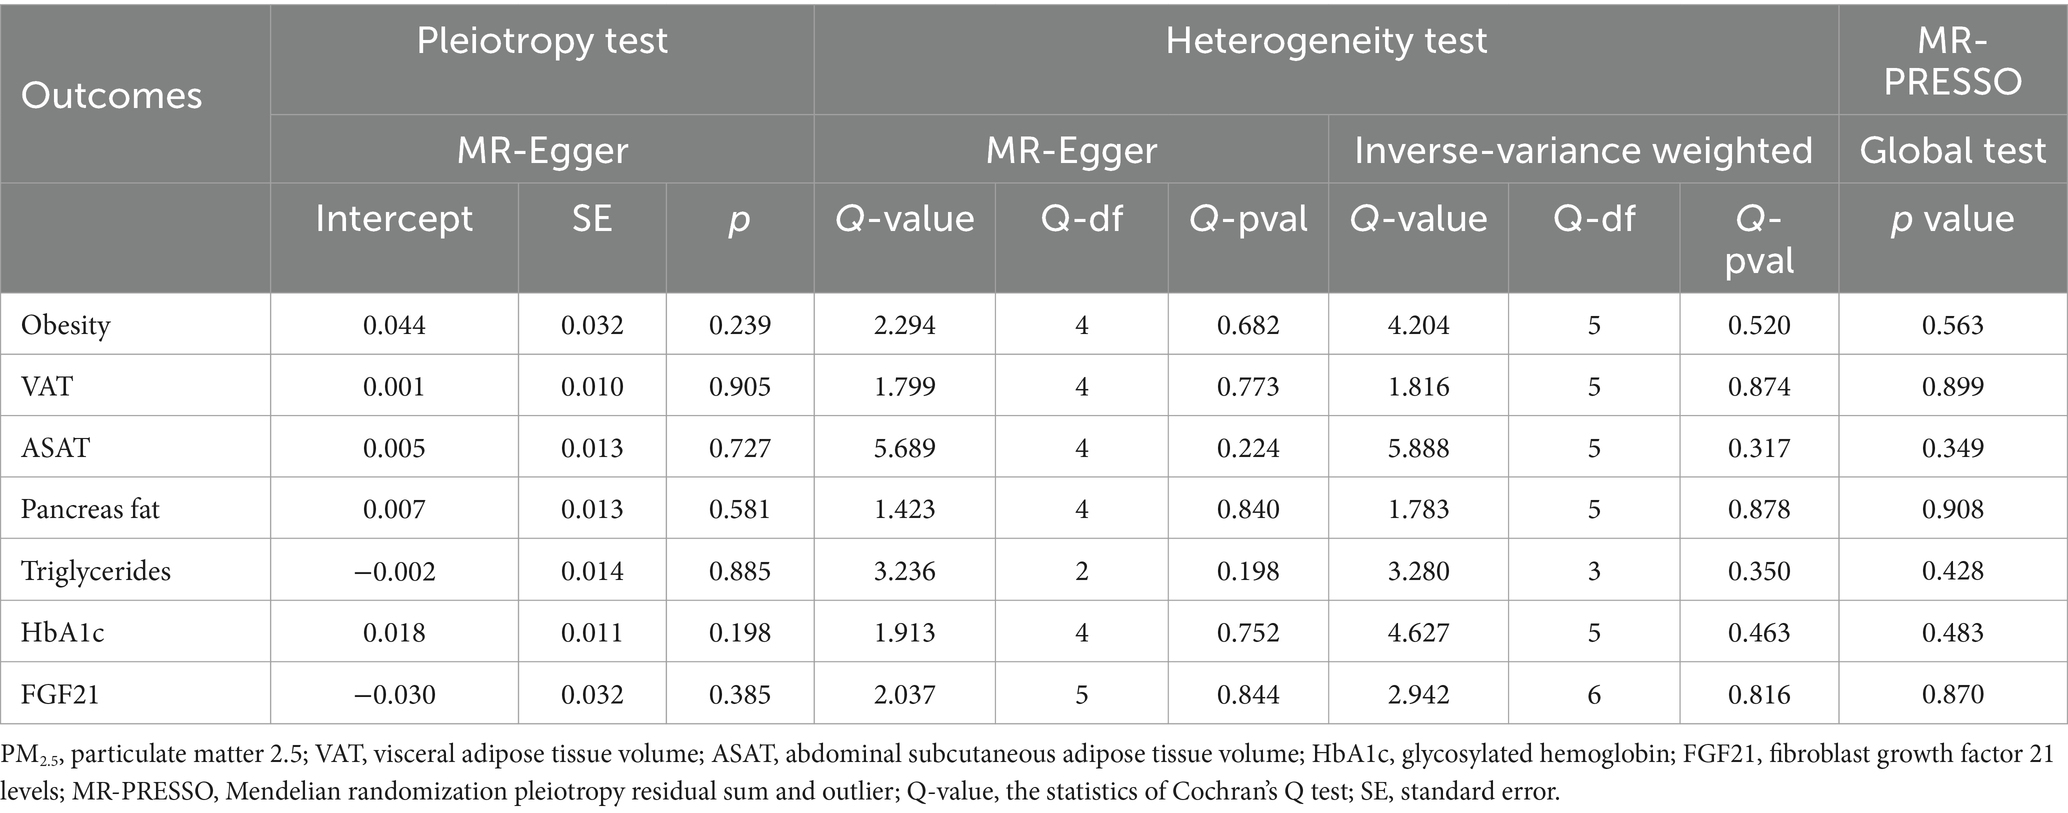
Table 3. Heterogeneity, horizontal pleiotropy, and MR-PRESSO tests of the associations between PM2.5 and obesity and its related indicators.
This study utilized MR technology to evaluate the causal relationship between the air pollutant PM2.5 and obesity, along with related indicators. After applying the FDR correction, the UVMR results indicate a significant causal relationship between exposure to PM2.5 and an increased susceptibility to obesity in the European population. Furthermore, supplementary MR analysis revealed a positive correlation between PM2.5 concentration and body fat distribution, including VAT, particularly pancreatic adipose tissue, and ASAT volume. Moreover, there is a direct link between exposure to PM2.5 and increased levels of TG and HbA1c. Conversely, a significant negative link was observed between PM2.5 concentration and the level of the novel obesity-related biomarker FGF-21. After adjusting for confounding factors such as external smoke exposure, physical activity, EA, participation in sports clubs or gym leisure activities, and TDI, MVMR analysis showed that PM2.5 levels maintained a significant association with pancreatic fat, HbA1c, and FGF-21.
Our UVMR research results offer genetic evidence for the causal relationship between PM2.5 exposure and the likelihood of obesity. In additional MR analyses of PM2.5 and fat distribution, we identified a positive correlation between PM2.5 concentrations and VAT, ASAT, or pancreatic fat. These findings are compatible with previous observational epidemiological studies.
A cross-sectional study conducted in Spain examined the relationship between PM2.5 levels and the prevalence of overweight in young people aged 2–14. It found that compared to areas with low PM2.5 levels, areas with moderate PM2.5 levels had a 23% higher risk of overweight, while areas with high PM2.5 levels had a 35% higher risk (47). An analysis of data from a study involving 11,766 participants found an intense connection between exposure to PM2.5 and visceral fat index (VFI) in middle-aged and older adult individuals. The highest quartile OR was 1.10 (95% CI, 1.07, 1.13) (48). A separate cohort study, consisting of 38,824 participants aged 18–79, also arrived at comparable conclusions. It observed that the VFI exhibited a rising pattern as the amount of PM2.5 increased (49).
An investigation carried out in Chongqing, China, discovered a distinct correlation between exposure to PM2.5 and childhood obesity, specifically centripetal obesity, as assessed by the waist-to-height ratio (WHtR). This study validates that environmental pollution has a cumulative effect on obesity, specifically the buildup of abdominal fat, in young persons from China (50). Additionally, a comprehensive nationwide longitudinal study conducted in China also showed a clear link between air pollution and the heightened susceptibility of older adult individuals to both general obesity and abdominal obesity. With each standard deviation increase in the Average Air Quality Index (AQI), the likelihood of becoming centripetal obesity increases by 2.8% (95%CI, 1.7, 3.9%), and the probability of developing abdominal obesity increases by 6.2% (95%CI, 4.4, 8.0%) (51).
Currently, the majority of studies focus on investigating the influence of PM2.5 on the overall amount of visceral fat. However, there is insufficient study on the correlation between PM2.5 levels and specific types of visceral fat, such as pancreatic fat. The excessive accumulation of lipids in the pancreas is accompanied by a decline in the cellular activity of pancreatic islets (52). Prior research has demonstrated a negative correlation (p < 0.03) between the average amount of fat in the pancreas, as measured by magnetic resonance imaging (MRI), and markers of insulin secretion based on oral glucose tolerance tests (OGTT). The results of the subsequent stepwise multiple regression analysis indicate that pancreatic fat is more closely linked with reduced insulin secretion function compared to other visceral lipids, such as liver fat (53). Animal studies have demonstrated that exposure to PM2.5 can reduce the expression of glucose transporter 2 (GLUT 2) in pancreatic tissue of rats with gestational diabetes (GDM), thereby increasing the likelihood of pancreatic lipid deposition, tissue damage and elevated blood sugar levels (49). The research above indirectly demonstrates the correlation between PM2.5 levels and the abnormal accumulation of fat in the pancreas. A cohort research (54) published in 2017 indicated that exposure to high amounts of PM2.5 had a deleterious impact on insulin sensitivity (SI) and β Cellular function in children and is not tied to obesity markers such as body fat percentage. In the MVMR model, after adjusting for external smoke exposure, physical exercise, education level, gym leisure activities, and TDI, a significant relationship between PM2.5 concentration and pancreatic fat remains. However, the relationships between PM2.5 concentration and obesity, VAT, and ASAT are no longer significant. The TDI, which reflects socio-economic status, is the main confounding factor, closely related to both PM2.5 exposure and obesity (55, 56). The discrepancies between MR analysis results and observational research can be attributed to the influence of confounding factors. Therefore, further research is needed to explore the relationship between PM2.5 concentration and obesity, VAT, and ASAT.
Previous studies have drawn contradictory conclusions about the relationship between PM2.5 and TG levels. A recent cohort study has shown a correlation between air pollution, including PM2.5, and a higher likelihood of blood lipid abnormalities (OR = 1.14, 95% CI: 1.10, 1.18). It found that for every 10% increase in PM2.5 concentration (measured in μg/m3), there was a corresponding 3.04% rise in TG levels (95% CI: 2.61, 3.47%) (57). Nevertheless, specific research has indicated that prolonged exposure to air pollution, specifically PM2.5, is solely linked to raised levels of total cholesterol (TC) and a higher incidence of hypercholesterolemia in children and adolescents. However, there is no clear association between air pollution and other lipid abnormalities, such as TG and low-density lipoprotein cholesterol (LDL-C) (58). This aligns with the findings of our research. In our UVMR results, there is a direct correlation between PM2.5 and elevated TG levels. However, this relationship becomes insignificant when considering external smoke exposure, physical exercise, education level, gym leisure, and TDI in the MVMR model. The difference between MR analysis and observational data may be attributed to confounding variables. Therefore, it is necessary further to investigate the relationship between PM2.5 concentration and TG.
Our investigation on MVMR revealed a significant correlation between PM2.5 levels and HbA1c after taking into consideration other influencing factors. A recent statewide cohort research conducted in China has indicated a positive correlation between increased exposure to PM2.5 and higher levels of HbA1c. In the primary model, a 10 μg/m3 increase in PM2.5 exposure concentration corresponded with a 0.016 mmol/L increase in HbA1c levels (59). Another study conducted in South Korea, a developed country, also found that an increase in PM2.5 levels by one quartile range (IQR) coincided with a 0.34% increase in HbA1c levels (95% CI: 0.04, 0.63) (60). Added to that, we discovered an inverse correlation that is nominally significant between the content of PM2.5 and FGF-21 in both the UVMR and MVMR models. FGF-21, belonging to the fibroblast growth factor family, exerts regulatory metabolic effects, including cholesterol reduction, blood sugar reduction, insulin resistance improvement, and weight reduction. It is frequently linked with the presence of chronic metabolic disorders related to obesity (61). Although empirical research exploring the correlation between PM2.5 levels and FGF-21 is currently lacking, our MR results suggest that improving air quality and reducing PM2.5 concentrations could have beneficial effects on mitigating obesity-related chronic metabolic disorders.
At present, the exact mechanism of the association between PM2.5 exposure and obesity or glucose and lipid metabolism disorders is not clear. However, existing research suggests that this correlation may be related to the following four potential mechanisms.
Firstly, PM2.5 can trigger systemic and local chronic inflammatory responses, which are vital factors that contribute to metabolic disorders and obesity (62, 63). An animal study has demonstrated that PM2.5 exposure can induce glucose and lipid metabolism disorders in both normal healthy and diabetic model mice. This metabolic damage is consistent with an increase in inflammatory responses in the respiratory system, circulatory system, and VAT, characterized by the release of interleukin (IL)-6 and tumor necrosis factor-alpha (TNF-α) in the lungs, serum, and VAT. Furthermore, the use of AMPK activators to inhibit the release of inflammatory cytokines has been shown to alleviate PM2.5-induced metabolic disorders (64). Another animal study confirmed that the activation of NLRP3 inflammasomes and the increase in levels of related inflammatory cytokines, including IL-18 and IL-1β, are the main mechanisms behind the aggravation of PM2.5-related metabolic disorders in diabetic model mice (65).
Secondly, the oxidative stress (OS) response plays an essential mediating role in metabolic disorders caused by PM2.5 exposure (66). PM2.5 contains various pro-oxidant molecules, and its toxicity is linked to its ability to produce reactive oxygen species (ROS). Exposure to PM2.5 can induce oxidative stress in different tissues and cell lines (67). Animal research data suggests that exposure to PM2.5 can reduce vascular insulin sensitivity by inducing oxidative stress in the lungs, leading to insulin resistance. Antioxidant treatment or overexpression of lung-specific extracellular superoxide dismutase (ecSOD) can alleviate insulin resistance in PM2.5-exposed mice (68). On top of that, a recently published study revealed that PM2.5 greatly enhances xanthine levels in both brown adipose tissue (BAT) and white adipose tissue (WAT) in male db/db mice, provoking OS in the adipose tissue (69). Higher levels of ROS can promote the accumulation of TG in WAT and hinder its breakdown, bringing about an increase in WAT content and a decrease in BAT content, consequently impacting energy metabolism, diminishing insulin sensitivity, and worsening blood glucose disorders (69). PM2.5 exposure can harm skeletal muscle function by impairing mitochondrial oxidative activity, resulting in adverse effects on energy expenditure, fat storage, and weight gain (70).
Thirdly, PM2.5 can penetrate the central nervous system by means of neurons in olfactory epithelium cells. This can disturb the control of hunger and energy expenditure by triggering inflammatory responses in the hypothalamus and causing resistance to leptin, ultimately resulting in obesity. An animal study has shown that short-term exposure to PM2.5 can significantly enhance inflammation markers such as Toll-like receptor 4 (Tlr4) and NF-κB kinase (Ikbke) in the hypothalamus of mice, leading to metabolic consequences similar to those induced by a high-fat diet (71). Long-term exposure to PM2.5 can lead to leptin resistance, insufficient levels of satiety markers, increased appetite, reduced energy expenditure, energy imbalance, and increased fat accumulation, resulting in obesity (71).
Ultimately, an imbalance in the gut microbiota could potentially act as a mediator in the relationship between PM2.5 and metabolic disorders. Animal and human studies provide evidence that the ingestion of air pollutants can result in changes in the diversity and relative abundance of gut microbiota, thereby reducing intestinal barrier integrity and increasing gastrointestinal inflammation (72). Multiple investigations have observed specific gut microbiota profiles in individuals with obesity and glucose and lipid metabolism disorders, suggesting that gut microbiota is involved in many physiological processes related to metabolism (73). Moreover, population-based epidemiological research evidence also confirms that the gut microbiota partially mediates the impact of PM2.5 on obesity and glucose and lipid metabolism disorders (74, 75).
As far as we know, this is the initial instance where an MR Framework has been employed to evaluate the genetic causality between PM2.5 concentrations and obesity, as well as related markers of glycolipid metabolism. This approach complements traditional observational studies and provides further evidence to assess the health hazards tied to environmental pollutants. This MR study possesses several remarkable benefits. Initially, we eliminated genetic variations commonly detected in epidemiological research that other causes could potentially influence and specifically chose those that are closely correlated with PM2.5-related SNPs. Furthermore, the substantial sample size utilized in our MR analysis significantly enhanced our statistical power and yielded robust evidence supporting the presence of correlations. Besides, we performed comprehensive sensitivity analyses to validate the dependability of these findings. All of the F-statistics exceed 10, suggesting a minimal likelihood of weak instrumental bias. In addition, the FDR correction method was employed to adjust for multiple tests, reducing the likelihood of Type I errors. This approach enables us to balance identifying genuine correlations and managing false positives. Given the need to compare seven groups in this investigation, the use of the Bonferroni correction is considered excessively cautious and stringent. While the Bonferroni method minimizes the incidence of Type I errors, it also decreases the power to detect genuine associations when handling a high number of comparisons, leading to an increased occurrence of false negatives. Ultimately, we employed MVMR to examine the immediate influence of PM2.5 on obesity and its associated indices after controlling for external smoke exposure, physical activity, EA, participation in sports clubs or gym leisure activities, and TDI.
Although there are advantages, there remain limitations. First, due to reliance on summary-level data from the GWAS database, evaluating the non-linear correlation between PM2.5 and obesity and related indicators was impossible. Secondly, although we have conducted multiple sensitivity analyses to detect potential pleiotropy rigorously, it must be acknowledged that no method can completely eliminate the possibility of pleiotropy, which is a limitation of MR analysis methods. Therefore, considering the potential for residual pleiotropy effects, we emphasize that our findings should be interpreted with caution. It is necessary to use additional datasets for further validation research in the future. Thirdly, our study used the IVW method as the primary statistical approach. When there is no heterogeneity and pleiotropy, the IVW method outperforms the MR Egger and weighted median methods, providing reliable conclusions. However, the differences in results between the IVW analysis and other alternative methods still deserve careful consideration. It is necessary to use larger datasets for further research in the future to verify these findings. Finally, it is worth noting that the participants in this study were all of European ancestry. While this choice minimizes potential stratification bias, it also limits the generalizability of our results to other racial groups. Due to the lack of available PM2.5 GWAS data from other ethnicities, we were unable to explore the association between PM2.5 and obesity, as well as related indicators, in other ethnic groups. We anticipate future updates of GWAS data to comprehensively investigate the impact of PM2.5 on obesity and metabolic disorders across diverse populations.
The conclusions of our MR study strongly support the existence of a significant positive association between genetically predicted PM2.5 concentration and pancreas fat, HbA1c, and FGF21 levels. However, the specific processes behind this link require more exploration. The results from the UVMR and MVMR analyses present limited evidence of causal links between the presence of PM2.5 and obesity, VAT, ASAT, or TG. This points out that other factors might have swayed past observational studies and need to be confirmed by additional investigations. Our research findings have the potential to impact public health by enhancing people’s understanding of the correlation between air quality and obesity, along with accompanying metabolic disorders. These discoveries have substantial ramifications for obesity prevention.
The original contributions presented in the study are included in the article/Supplementary material, further inquiries can be directed to the corresponding author.
TW: Conceptualization, Writing – original draft. XH: Formal analysis, Methodology, Writing – review & editing. CL: Methodology, Supervision, Writing – review & editing. NZ: Funding acquisition, Visualization, Writing – review & editing. JM: Funding acquisition, Supervision, Writing – review & editing.
The author(s) declare financial support was received for the research, authorship, and/or publication of this article. Postdoctoral Funding Project in Heilongjiang Province (LBH-Z23284).
We want to thank the researchers and study participants for their contributions.
The authors declare that the research was conducted in the absence of any commercial or financial relationships that could be construed as a potential conflict of interest.
All claims expressed in this article are solely those of the authors and do not necessarily represent those of their affiliated organizations, or those of the publisher, the editors and the reviewers. Any product that may be evaluated in this article, or claim that may be made by its manufacturer, is not guaranteed or endorsed by the publisher.
The Supplementary material for this article can be found online at: https://www.frontiersin.org/articles/10.3389/fpubh.2024.1366838/full#supplementary-material
1. ^https://www.who.int/news-room/fact-sheets/detail/obesity-and-overweight, accessed on 2 January 2024.
1. Cornier, M-A. A review of current guidelines for the treatment of obesity. Am J Manag Care. (2022) 28:S288–96. doi: 10.37765/ajmc.2022.89292
2. Ternák, G, Németh, M, Rozanovic, M, Márovics, G, and Bogár, L. “Growth-promoting effect” of antibiotic use could explain the global obesity pandemic: a European survey. Antibiotics. (2022) 11:1321. doi: 10.3390/antibiotics11101321
3. Portela, ND, Galván, C, Sanmarco, LM, Bergero, G, Aoki, MP, Cano, RC, et al. Omega-3-supplemented fat diet drives immune metabolic response in visceral adipose tissue by modulating gut microbiota in a mouse model of obesity. Nutrients. (2023) 15:1404. doi: 10.3390/nu15061404
4. Stinkens, R, Brouwers, B, Jocken, JW, Blaak, EE, Teunissen-Beekman, KF, Hesselink, MK, et al. Exercise training-induced effects on the abdominal subcutaneous adipose tissue phenotype in humans with obesity. J Appl Physiol. (2018) 125:1585–93. doi: 10.1152/japplphysiol.00496.2018
5. Yu, X, Huang, Y-H, Feng, Y-Z, Cheng, Z-Y, and Cai, X-R. Well-controlled versus poorly controlled diabetes in patients with obesity: differences in MRI-evaluated pancreatic fat content. Quant Imaging Med Surg. (2023) 13:3496–507. doi: 10.21037/qims-22-1083
6. Haganes, KL, Silva, CP, Eyjólfsdóttir, SK, Steen, S, Grindberg, M, Lydersen, S, et al. Time-restricted eating and exercise training improve HbA1c and body composition in women with overweight/obesity: a randomized controlled trial. Cell Metab. (2022) 34:1457–1471.e4. doi: 10.1016/j.cmet.2022.09.003
7. Bai, J, Yang, T, Zhou, Y, Xu, W, Han, S, Guo, T, et al. Octacosanol modifies obesity, expression profile and inflammation response of hepatic tissues in high-fat diet mice. Food Secur. (2022) 11:1606. doi: 10.3390/foods11111606
8. Jin, L, Yang, R, Geng, L, and Xu, A. Fibroblast growth factor-based pharmacotherapies for the treatment of obesity-related metabolic complications. Annu Rev Pharmacol Toxicol. (2023) 63:359–82. doi: 10.1146/annurev-pharmtox-032322-093904
9. Anekwe, CV, Jarrell, AR, Townsend, MJ, Gaudier, GI, Hiserodt, JM, and Stanford, FC. Socioeconomics of obesity. Curr Obes Rep. (2020) 9:272–9. doi: 10.1007/s13679-020-00398-7
10. Nicolaidis, S. Environment and obesity. Metabolism. (2019) 100:153942. doi: 10.1016/j.metabol.2019.07.006
11. Wright, SM, and Aronne, LJ. Causes of obesity. Abdom Imaging. (2012) 37:730–2. doi: 10.1007/s00261-012-9862-x
12. Pryor, JT, Cowley, LO, and Simonds, SE. The physiological effects of air pollution: particulate matter Physiology and Disease. Front Public Health. (2022) 10:882569. doi: 10.3389/fpubh.2022.882569
13. Li, D, Li, Y, Li, G, Zhang, Y, Li, J, and Chen, H. Fluorescent reconstitution on deposition of PM2.5 in lung and extrapulmonary organs. Proc Natl Acad Sci USA. (2019) 116:2488–93. doi: 10.1073/pnas.1818134116
14. Bowe, B, Gibson, AK, Xie, Y, Yan, Y, Van, DA, Martin, RV, et al. Ambient fine particulate matter air pollution and risk of weight gain and obesity in United States veterans: An observational cohort study. Environ Health Perspect. (2021) 129:47003. doi: 10.1289/EHP7944
15. Chen, R, Yang, C, Li, P, Wang, J, Liang, Z, Wang, W, et al. Long-term exposure to ambient PM2.5, sunlight, and obesity: a Nationwide study in China. Front Endocrinol. (2021) 12:790294. doi: 10.3389/fendo.2021.790294
16. Chen, Y-C, Chin, W-S, Pan, S-C, Wu, C-D, and Guo, Y-LL. Long-term exposure to air pollution and the occurrence of metabolic syndrome and its components in Taiwan. Environ Health Perspect. (2023) 131:17001. doi: 10.1289/EHP10611
17. Kim, JS, Chen, Z, Alderete, TL, Toledo-Corral, C, Lurmann, F, Berhane, K, et al. Associations of AIR pollution, obesity and cardiometabolic health in young adults: the Meta-AIR study. Environ Int. (2019) 133:105180. doi: 10.1016/j.envint.2019.105180
18. Fioravanti, S, Cesaroni, G, Badaloni, C, Michelozzi, P, Forastiere, F, and Porta, D. Traffic-related air pollution and childhood obesity in an Italian birth cohort. Environ Res. (2018) 160:479–86. doi: 10.1016/j.envres.2017.10.003
19. Davey Smith, G, and Hemani, G. Mendelian randomization: genetic anchors for causal inference in epidemiological studies. Hum Mol Genet. (2014) 23:R89–98. doi: 10.1093/hmg/ddu328
20. Zheng, J, Baird, D, Borges, M-C, Bowden, J, Hemani, G, Haycock, P, et al. Recent developments in Mendelian randomization studies. Curr Epidemiol Rep. (2017) 4:330–45. doi: 10.1007/s40471-017-0128-6
21. Sanderson, E. Multivariable Mendelian randomization and mediation. Cold Spring Harb Perspect Med. (2021) 11:a038984. doi: 10.1101/cshperspect.a038984
22. Davies, NM, Holmes, MV, and Davey, SG. Reading Mendelian randomisation studies: a guide, glossary, and checklist for clinicians. BMJ. (2018) 362:k601. doi: 10.1136/bmj.k601
23. Vrijheid, M, Fossati, S, Maitre, L, Márquez, S, Roumeliotaki, T, Agier, L, et al. Early-life environmental exposures and childhood obesity: An Exposome-wide approach. Environ Health Perspect. (2020) 128:67009. doi: 10.1289/EHP5975
24. Brandt, C, and Pedersen, BK. Physical activity, obesity and weight loss maintenance. Handb Exp Pharmacol. (2022) 274:349–69. doi: 10.1007/164_2021_575
25. Dong, Z, Wu, L, Chen, Y, Lyulyov, O, and Pimonenko, T. Intergenerational transmission of obesity: role of education and income. Int J Environ Res Public Health. (2022) 19:15931. doi: 10.3390/ijerph192315931
26. Madsen, M, Larsen, MN, Cyril, R, Møller, TK, Madsen, EE, Ørntoft, C, et al. Well-being, physical fitness, and health profile of 2,203 Danish girls aged 10-12 in relation to leisure-time sports Club activity-with special emphasis on the five Most popular sports. J Strength Cond Res. (2022) 36:2283–90. doi: 10.1519/JSC.0000000000003819
27. Shohaimi, S, Boekholdt, MS, Luben, R, Wareham, NJ, and Khaw, K-T. Distribution of lipid parameters according to different socio-economic indicators- the EPIC-Norfolk prospective population study. BMC Public Health. (2014) 14:782. doi: 10.1186/1471-2458-14-782
28. Newton, S, Braithwaite, D, and Akinyemiju, TF. Socio-economic status over the life course and obesity: systematic review and meta-analysis. PLoS One. (2017) 12:e0177151. doi: 10.1371/journal.pone.0177151
29. Eeftens, M, Meier, R, Schindler, C, Aguilera, I, Phuleria, H, Ineichen, A, et al. Development of land use regression models for nitrogen dioxide, ultrafine particles, lung deposited surface area, and four other markers of particulate matter pollution in the Swiss SAPALDIA regions. Environ Health. (2016) 15:53. doi: 10.1186/s12940-016-0137-9
30. Kurki, MI, Karjalainen, J, Palta, P, Sipilä, TP, Kristiansson, K, Donner, KM, et al. FinnGen provides genetic insights from a well-phenotyped isolated population. Nature. (2023) 613:508–18. doi: 10.1038/s41586-022-05473-8
31. Liu, Y, Basty, N, Whitcher, B, Bell, JD, Sorokin, EP, van Bruggen, N, et al. Genetic architecture of 11 organ traits derived from abdominal MRI using deep learning. eLife. (2021) 10:10. doi: 10.7554/eLife.65554
32. Gilly, A, Park, YC, Png, G, Barysenka, A, Fischer, I, Bjørnland, T, et al. Whole-genome sequencing analysis of the cardiometabolic proteome. Nat Commun. (2020) 11:6336. doi: 10.1038/s41467-020-20079-2
33. Clarke, L, Zheng-Bradley, X, Smith, R, Kulesha, E, Xiao, C, Toneva, I, et al. The 1000 genomes project: data management and community access. Nat Methods. (2012) 9:459–62. doi: 10.1038/nmeth.1974
34. Kamat, MA, Blackshaw, JA, Young, R, Surendran, P, Burgess, S, Danesh, J, et al. PhenoScanner V2: an expanded tool for searching human genotype-phenotype associations. Bioinformatics. (2019) 35:4851–3. doi: 10.1093/bioinformatics/btz469
35. Liu, MM, Liu, QJ, Wen, J, Wang, M, Wu, LY, Qu, ML, et al. Waist-to-hip ratio is the most relevant obesity index at each phase of insulin secretion among obese patients. J Diabetes Complicat. (2018) 32:670–6. doi: 10.1016/j.jdiacomp.2018.04.006
36. Lind, L, Ahmad, S, Elmståhl, S, and Fall, T. The metabolic profile of waist to hip ratio-a multi-cohort study. PLoS One. (2023) 18:e0282433. doi: 10.1371/journal.pone.0282433
37. Neovius, M, Linné, Y, and Rossner, S. BMI, waist-circumference and waist-hip-ratio as diagnostic tests for fatness in adolescents. Int J Obes (Lond). (2015) 29:163–9. doi: 10.1038/sj.ijo.0802867
38. Parente, EB, Mutter, S, Harjutsalo, V, Ahola, AJ, Forsblom, C, and Groop, PH. Waist-height ratio and waist are the best estimators of visceral fat in type 1 diabetes. Sci Rep. (2020) 10:18575. doi: 10.1038/s41598-020-75667-5
39. Papadimitriou, N, Dimou, N, Tsilidis, KK, Banbury, B, Martin, RM, Lewis, SJ, et al. Physical activity and risks of breast and colorectal cancer: a Mendelian randomisation analysis. Nat Commun. (2020) 11:597. doi: 10.1038/s41467-020-14389-8
40. Pagoni, P, Dimou, NL, Murphy, N, and Stergiakouli, E. Using Mendelian randomisation to assess causality in observational studies. Evid Based Ment Health. (2019) 22:67–71. doi: 10.1136/ebmental-2019-300085
41. Bowden, J, Davey Smith, G, Haycock, PC, and Burgess, S. Consistent estimation in Mendelian randomization with some invalid instruments using a weighted median estimator. Genet Epidemiol. (2016) 40:304–14. doi: 10.1002/gepi.21965
42. Hemani, G, Bowden, J, and Davey, SG. Evaluating the potential role of pleiotropy in Mendelian randomization studies. Hum Mol Genet. (2018) 27:R195–208. doi: 10.1093/hmg/ddy163
43. Pierce, BL, and Burgess, S. Efficient design for Mendelian randomization studies: subsample and 2-sample instrumental variable estimators. Am J Epidemiol. (2013) 178:1177–84. doi: 10.1093/aje/kwt084
44. Burgess, S, and Thompson, SG. Multivariable Mendelian randomization: the use of pleiotropic genetic variants to estimate causal effects. Am J Epidemiol. (2015) 181:251–60. doi: 10.1093/aje/kwu283
45. Hemani, G, Zheng, J, Elsworth, B, Wade, KH, Haberland, V, Baird, D, et al. The MR-base platform supports systematic causal inference across the human phenome. eLife. (2018) 7:e34408. doi: 10.7554/eLife.34408
46. Chen, X. False discovery rate control for multiple testing based on discrete p-values. Biom J. (2020) 62:1060–79. doi: 10.1002/bimj.201900163
47. López-Gil, JF, Chen, S, Smith, L, Gutiérrez-Espinoza, H, Victoria-Montesinos, D, Iglesias, JN, et al. What is the role of particulate matter 2.5 (PM2.5) on excess weight? A cross-sectional study in young Spanish people aged 2─14 years. Environ Res. (2023) 216:114561. doi: 10.1016/j.envres.2022.114561
48. Pan, W, Wang, M, Hu, Y, Lian, Z, Cheng, H, Qin, J-J, et al. The association between outdoor air pollution and body mass index, central obesity, and visceral adiposity index among middle-aged and elderly adults: a nationwide study in China. Front Endocrinol. (2023) 14:1221325. doi: 10.3389/fendo.2023.1221325
49. Liu, X, Tu, R, Qiao, D, Niu, M, Li, R, Mao, Z, et al. Association between long-term exposure to ambient air pollution and obesity in a Chinese rural population: the Henan rural cohort study. Environ Pollut. (2020) 260:114077. doi: 10.1016/j.envpol.2020.114077
50. Tong, J, Ren, Y, Liu, F, Liang, F, Tang, X, Huang, D, et al. The impact of PM2.5 on the growth curves of Children’s obesity indexes: a prospective cohort study. Front Public Health. (2022) 10:843622. doi: 10.3389/fpubh.2022.843622
51. Zhang, N, Wang, L, Zhang, M, and Nazroo, J. Air quality and obesity at older ages in China: the role of duration, severity and pollutants. PLoS One. (2019) 14:e0226279. doi: 10.1371/journal.pone.0226279
52. Chin, SO, Hwang, Y-C, Cho, I-J, Jeong, I-K, Ahn, KJ, and Chung, HY. Pancreatic fat accumulation is associated with decreased β-cell function and deterioration in glucose tolerance in Korean adults. Diabetes Metab Res Rev. (2021) 37:e3425. doi: 10.1002/dmrr.3425
53. Heni, M, Machann, J, Staiger, H, Schwenzer, NF, Peter, A, Schick, F, et al. Pancreatic fat is negatively associated with insulin secretion in individuals with impaired fasting glucose and/or impaired glucose tolerance: a nuclear magnetic resonance study. Diabetes Metab Res Rev. (2010) 26:200–5. doi: 10.1002/dmrr.1073
54. Alderete, TL, Habre, R, Toledo-Corral, CM, Berhane, K, Chen, Z, Lurmann, FW, et al. Longitudinal associations between ambient air pollution with insulin sensitivity, β-cell function, and adiposity in Los Angeles Latino children. Diabetes. (2017) 66:1789–96. doi: 10.2337/db16-1416
55. Vazquez, CE, and Cubbin, C. Socioeconomic status and childhood obesity: a review of literature from the past decade to inform intervention research. Curr Obes Rep. (2020) 9:562–70. doi: 10.1007/s13679-020-00400-2
56. Han, C, Xu, R, Gao, CX, Yu, W, Zhang, Y, Han, K, et al. Socioeconomic disparity in the association between long-term exposure to PM2.5 and mortality in 2640 Chinese counties. Environ Int. (2021) 146:106241. doi: 10.1016/j.envint.2020.106241
57. Wang, L, Chen, G, Pan, Y, Xia, J, Chen, L, Zhang, X, et al. Association of long-term exposure to ambient air pollutants with blood lipids in Chinese adults: the China multi-ethnic cohort study. Environ Res. (2021) 197:111174. doi: 10.1016/j.envres.2021.111174
58. Gui, Z-H, Yang, B-Y, Zou, Z-Y, Ma, J, Jing, J, Wang, H-J, et al. Exposure to ambient air pollution and blood lipids in children and adolescents: a national population based study in China. Environ Pollut. (2020) 266:115422. doi: 10.1016/j.envpol.2020.115422
59. Liu, F, Zhang, K, Chen, G, He, J, Pan, M, Zhou, F, et al. Sustained air pollution exposures, fasting plasma glucose, glycated haemoglobin, prevalence and incidence of diabetes: a nationwide study in China. Int J Epidemiol. (2022) 51:1862–73. doi: 10.1093/ije/dyac162
60. Hwang, M-J, Kim, J-H, Koo, Y-S, Yun, H-Y, and Cheong, H-K. Impacts of ambient air pollution on glucose metabolism in Korean adults: a Korea National Health and nutrition examination survey study. Environ Health. (2020) 19:70. doi: 10.1186/s12940-020-00623-9
61. Flippo, KH, and Potthoff, MJ. Metabolic messengers: FGF21. Nat Metab. (2021) 3:309–17. doi: 10.1038/s42255-021-00354-2
62. Dergham, M, Lepers, C, Verdin, A, Billet, S, Cazier, F, Courcot, D, et al. Prooxidant and proinflammatory potency of air pollution particulate matter (PM₂.₅₋₀.₃) produced in rural, urban, or industrial surroundings in human bronchial epithelial cells (BEAS-2B). Chem Res Toxicol. (2012) 25:904–19. doi: 10.1021/tx200529v
63. Ar, S, and Jm, O. Inflammatory mechanisms linking obesity and metabolic disease. J Clin Invest. (2017) 127:1–4. doi: 10.1172/JCI92035
64. Pan, K, Jiang, S, Du, X, Zeng, X, Zhang, J, Song, L, et al. AMPK activation attenuates inflammatory response to reduce ambient PM2.5-induced metabolic disorders in healthy and diabetic mice. Ecotoxicol Environ Saf. (2019) 179:290–300. doi: 10.1016/j.ecoenv.2019.04.038
65. Song, L, Lei, L, Jiang, S, Pan, K, Zeng, X, Zhang, J, et al. NLRP3 inflammasome is involved in ambient PM2.5-related metabolic disorders in diabetic model mice but not in wild-type mice. Inhal Toxicol. (2021) 33:260–7. doi: 10.1080/08958378.2021.1980637
66. Xu, X, Yavar, Z, Verdin, M, Ying, Z, Mihai, G, Kampfrath, T, et al. Effect of early particulate air pollution exposure on obesity in mice: role of p47phox. Arterioscler Thromb Vasc Biol. (2010) 30:2518–27. doi: 10.1161/ATVBAHA.110.215350
67. Aj, G, Ms, C, and Mc, M. Composition of air pollution particles and oxidative stress in cells, tissues, and living systems. J Toxicol Environ Health B Crit Rev. (2012) 15:1–21. doi: 10.1080/10937404.2012.632359
68. Haberzettl, P, O'Toole, TE, Bhatnagar, A, and Conklin, DJ. Exposure to fine particulate air pollution causes vascular insulin resistance by inducing pulmonary oxidative stress. Environ Health Perspect. (2016) 124:1830–9. doi: 10.1289/EHP212
69. Chen, L, Li, H, Ru, Y, Song, Y, Shen, Y, Zhao, L, et al. Xanthine-derived reactive oxygen species exacerbates adipose tissue disorders in male db/db mice induced by real-ambient PM2.5 exposure. Sci Total Environ. (2023) 882:163592. doi: 10.1016/j.scitotenv.2023.163592
70. Della Guardia, L, and Wang, L. Fine particulate matter induces adipose tissue expansion and weight gain: pathophysiology. Obes Rev. (2023) 24:e13552. doi: 10.1111/obr.13552
71. Campolim, CM, Weissmann, L, De O, FCK, Zordão, OP, APS, D, De Castro, G, et al. Short-term exposure to air pollution (PM2.5) induces hypothalamic inflammation, and long-term leads to leptin resistance and obesity via Tlr4/Ikbke in mice. Sci Rep. (2020) 10:10160. doi: 10.1038/s41598-020-67040-3
72. Bailey, MJ, Naik, NN, Wild, LE, Patterson, WB, and Alderete, TL. Exposure to air pollutants and the gut microbiota: a potential link between exposure, obesity, and type 2 diabetes. Gut Microbes. (2020) 11:1188–202. doi: 10.1080/19490976.2020.1749754
73. Aron-Wisnewsky, J, Warmbrunn, MV, Nieuwdorp, M, and Clément, K. Metabolism and metabolic disorders and the microbiome: the intestinal microbiota associated with obesity, lipid metabolism, and metabolic health-pathophysiology and therapeutic strategies. Gastroenterology. (2021) 160:573–99. doi: 10.1053/j.gastro.2020.10.057
74. Liu, T, Chen, X, Xu, Y, Wu, W, Tang, W, Chen, Z, et al. Gut microbiota partially mediates the effects of fine particulate matter on type 2 diabetes: evidence from a population-based epidemiological study. Environ Int. (2019) 130:104882. doi: 10.1016/j.envint.2019.05.076
Keywords: Mendelian randomization, PM2.5, obesity, visceral adipose tissue, fibroblast growth factor 21, HbA1c, causality
Citation: Wu Tq, Han X, Liu Cy, Zhao N and Ma J (2024) A causal relationship between particulate matter 2.5 and obesity and its related indicators: a Mendelian randomization study of European ancestry. Front. Public Health. 12:1366838. doi: 10.3389/fpubh.2024.1366838
Edited by:
Ciro Fernando Bustillo LeCompte, Toronto Metropolitan University, CanadaReviewed by:
Haiping Duan, Qingdao Municipal Center for Disease Control and Prevention, ChinaCopyright © 2024 Wu, Han, Liu, Zhao and Ma. This is an open-access article distributed under the terms of the Creative Commons Attribution License (CC BY). The use, distribution or reproduction in other forums is permitted, provided the original author(s) and the copyright owner(s) are credited and that the original publication in this journal is cited, in accordance with accepted academic practice. No use, distribution or reproduction is permitted which does not comply with these terms.
*Correspondence: Jian Ma, bWFqaWFuMTk2MUAxNjMuY29t
Disclaimer: All claims expressed in this article are solely those of the authors and do not necessarily represent those of their affiliated organizations, or those of the publisher, the editors and the reviewers. Any product that may be evaluated in this article or claim that may be made by its manufacturer is not guaranteed or endorsed by the publisher.
Research integrity at Frontiers
Learn more about the work of our research integrity team to safeguard the quality of each article we publish.