 Jane R. Schubart
 Eric W. Schaefer2
 Dacre R. T. Knight
 Clair A. Francomano
94% of researchers rate our articles as excellent or good
Learn more about the work of our research integrity team to safeguard the quality of each article we publish.
Find out more
ORIGINAL RESEARCH article
Front. Public Health , 03 July 2024
Sec. Health Economics
Volume 12 - 2024 | https://doi.org/10.3389/fpubh.2024.1365712
Introduction: Patients with Ehlers-Danlos syndromes (EDS) and hypermobility spectrum disorders (HSD) have significant health challenges that are well-documented, however their impact in terms of cost is not known. Our research objective was to examine the cost burden of EDS and HSD in the United States. We focused this analysis on those with commercial insurance plans.
Methods: We queried the MarketScan® database for year 2021 for claims that contained an ICD-10 diagnosis code for EDS or hypermobility. Excess costs for patients in the EDS and HSD cohorts were determined by matching each patient to one patient in the database that did not have a claim for EDS or HSD and comparing total costs for the calendar year. We determined whether patients had claims for selected comorbid conditions likely to impact costs during the calendar year.
Results: Sample sizes were 5,113 for adult (age ≥ 18) patients with EDS, 4,880 for adult patients with HSD, 1,059 for child (age 5–17) patients with EDS, and 2,427 for child patients with HSD. The mean excess costs were $21,100 for adult EDS patients, $11,600 for adult HSD patients, $17,000 for child EDS patients, and $11,000 for child HSD patients. EDS and HSD cohorts, both adults and children, with any of the comorbidities had greater healthcare costs. The largest difference was found in the EDS cohort with gastrointestinal comorbid conditions, with more than double the costs for adults.
Discussion: We found that patients in the MarketScan database, adults and children, who had EDS or HSD had substantially higher associated excess healthcare costs than patients without EDS or HSD when considering age, sex, geographic location, and comorbidities. These disproportionate healthcare costs in this population have health policy and economic implications, including the need for rapid diagnosis, access to treatment, and accelerated research to advance treatments.
The Ehlers-Danlos syndromes (EDS) are heritable connective tissue disorders characterized by varying degrees of joint hypermobility and instability, skin hyperextensibility and scarring, and other consequences of tissue fragility such as vascular and visceral rupture (1). Most types of EDS are rare; however, the hypermobile type (hEDS) (2) is more common (3). Hypermobility spectrum disorder (HSD) is a related diagnosis with hypermobility causing musculoskeletal pain and injury (4, 5). Patients with symptomatic joint hypermobility who do not meet the 2017 diagnostic criteria for hEDS are often assigned the diagnosis of HSD. Vascular type is the most severe type with features that may include arterial rupture at a young age, unexplained sigmoid colon perforation, uterine rupture, and other life-threatening events (1).
Symptoms of EDS typically begin in childhood and adolescence, worsen throughout young adulthood (most often in women in the peri-pubertal years), and can lead to chronic complex multi-system concerns, requiring multidisciplinary care by medical, surgical, and therapy specialties (2). Some comorbid conditions of EDS are not included in the formal diagnostic criteria (2), including sleep disturbance, fatigue, postural orthostatic tachycardia, disorders of the gut-brain interaction, dysautonomia, anxiety, and depression. These other systemic manifestations may be more debilitating than the joint symptoms (1). Patients have highly variable symptoms and treatment needs; thus, treatment is typically managed by multiple providers. There is a growing body of literature documenting the significant health challenges of EDS and HSD (2, 6–8). Many individuals will endure years without proper diagnoses and needed treatments. After diagnosis, it is common for patients to seek treatment for multiple issues at once, for extended periods of time (8). Treatments are individualized and focus on managing a wide range of symptoms and comorbidities that may include physical therapy, exercise, lifestyle modification, medication and when needed, surgical intervention. For this reason, published studies establishing the “value” of treatments for EDS and HSD are lacking.
Our research objective was to examine the cost burden of EDS and HSD in the United States. We focused this analysis on the population with commercial insurance plans for two reasons. First, over half of the total U.S. population receives health insurance through commercial plans that are offered by employers or purchased by individuals (9) and spending by commercial health insurers on hospital and physician services has grown faster than spending by the Medicare fee-for-service program. Second, the MarketScan database (10) provides a large sample across all 50 states of Americans with employer-provided health insurance and captures complete episodes of care.
Data were extracted from the Merative™ MarketScan® Commercial Claims and Encounters database (10). MarketScan contains reimbursed claims data on over 273 million unique patients since 1995. The database includes employees, dependents, and retirees receiving coverage annually under private insurance plans. No Medicaid or Medicare data are included. The database contains information regarding inpatient and outpatient claims, and prescription drug claims. It is one of the largest and longest running proprietary claims databases used for healthcare research in the U.S.
We searched all inpatient and outpatient claims in the MarketScan database for the calendar year 2021 for claims that contained an International Classification of Diseases, Tenth Revision, Clinical Modification (ICD-10) diagnosis code for EDS (Q79.6, Q79.60, Q79.61, Q79.62, Q79.63, Q79.69). These are the only codes for EDS. Because there are no current ICD-10 codes for HSD, we used the code for hypermobility syndrome (M35.7) as a surrogate. Other inclusion/exclusion criteria were age ≥ 5 years old and continuously enrolled in an insurance plan for the calendar year 2021 with prescription drug coverage included in the individual’s insurance plan. We constructed two separate cohorts: (1) patients with a diagnosis code for EDS (with or without coding for hypermobility); (2) patients with a diagnosis code for hypermobility only (no EDS diagnosis code).Additionally, each cohort was separated into adult (age ≥ 18) and child (age ≥ 5 to <18) cohorts.
All inpatient and outpatient claims that occurred during the calendar year 2021 were searched for claims with specific ICD-10 diagnosis codes that indicated chronic comorbidities. From these claims, we calculated a recent edition of the Charlson Comorbidity Index (CCI) score, which is particularly useful for claims-based research purposes (11).
We estimated the excess costs for patients in our EDS and HSD cohorts by matching each patient to one patient in the database that did not have a claim for EDS or HSD during 2021 and were continuously enrolled with prescription drug claim capture for the calendar year. A total of 14,263,020 patients met these criteria and formed the set of possible matches for our EDS and HSD patients. We matched patients on age (+/− 2 years), sex, Census division, and CCI score (+/− 1 point) using a greedy matching algorithm (12). 88.8% of the matches in the EDS cohort and 91.7% in the HSD cohort were exact. We compared mean total healthcare costs in 2021 between groups.
Total healthcare costs were calculated for the calendar year 2021. All costs from inpatient claims, outpatient claims, and pharmaceutical claims that occurred during the year were summed to create the total healthcare costs for a patient in 2021. The value represents the amount eligible for payment under the medical plan terms after applying rules such as discounts, but before applying coordination of benefits, copayments, and deductibles. We also calculated the total healthcare costs for each type of claim (inpatient, outpatient, emergency department, and pharmaceutical). For a small proportion of patients (<10 for each cohort; <0.1%), total healthcare costs were negative. Negative costs indicate reimbursement or other adjustments to a previous error in billing. We imputed a value of $0 for these patients.
We identified ED claims using the sub-service category code in the MarketScan database. A code with the last two digits of ‘20’ indicated an ED visit.
We determined whether patients had claims for selected comorbid conditions during the calendar year 2021. We used these specific comorbidities because these are the most frequently occurring comorbidities affecting patients with EDS/HSD that are likely to impact healthcare costs. Patients were classified as having the comorbidity if any claim was found with the respective code during the calendar year (13–31).The comorbidities were determined using the following ICD-10 diagnosis codes:
• Dysautonomia (POTS): G90.8, G90.9, I49.8, G90.A, I95.1, R55, R00.2
• Mast cell disorders: D89.40-D89.44, D89.49
• Gastrointestinal: K31.84, K58, K58.1, K21
• Depression/anxiety: F32.x, F33.x, F41.x, F43.x
• Musculoskeletal: S13.x, S23.x, S33.x, S43.x, S53.x, S63.x, S73.x, S83.x, S93.x, M81.x, M80.x, M26.6x
• Neurological: G93.5, Q07.0x, G95.89, G06.9, G54.0, G43.x, M24.80
• Other: R53.82, F84.0, M79.7, G47.x, G90.50x, N94.89, I87.2, I77.9x, I87.1, I77.4, N30.1x, N80.x, I34.0, I34.1, I71.x
Excess costs for patients in the EDS and HSD cohorts were determined by matching each patient to one patient in the database that did not have a claim for EDS or HSD and comparing total costs for the calendar year. We reported descriptive statistics (mean, standard deviation [SD], median, interquartile range [IQR], and range) for total healthcare costs. Cost estimates were rounded to the nearest $100.
For patients with EDS, we examined costs for patients who had a diagnosis code for vascular type (ICD-10: Q79.63) compared to those without a vascular diagnosis coded. Separately, we examined costs for patients with EDS who had a diagnosis code for hypermobile type (ICD-10: Q79.62) and compared to HSD patients.
To estimate excess costs, we calculated the difference in mean total healthcare costs between the cohorts and their matched comparison group. We used bootstrapping to estimate 95% CIs. Specifically, we used 1,000 resamples and the percentile method to obtain CIs.
To model costs with respect to EDS comorbidities, we used generalized linear regression models. For these models, we assumed a Gamma distribution and used a log link. The Gamma distribution was selected because costs exhibited substantial skewness, with some patients having very large costs. The models contained indicators for each comorbidity, age, sex, and CCI score with age and CCI score modeled linearly. Results from the models were reported in two ways. First, we reported cost ratios (CRs) and corresponding 95% confidence intervals (CIs). The cost ratios represent the multiplicative costs for each comorbidity. Second, we reported marginal differences in costs on the dollars scale. To estimate marginal costs, we set all other variables in the model to the most common value or the median as a reference. Specifically, marginal estimates were calculated for each comorbidity after assuming no other comorbidities, age of 34 (adult cohorts) or 14 (child cohorts), female sex, and CCI score of 0 as the reference, which we refer to below as the “reference patient.”
Sample sizes for each cohort were 5,113 and 1,059 for adult and child EDS cohorts, respectively, and 4,880 and 2,427 for adult and child HSD cohorts, respectively.
A flowchart depicting how these cohorts were constructed is shown in Figure 1. In the calendar year 2021, the database contained a total of 22,828,135 patients. Diagnosis codes for EDS and HSD were found for 8,068 and 9,463 patients, respectively (<0.1% for each). When restricting the cohorts to patients age ≥ 5 years old, 0.5% of the EDS cohort and 2.9% of the HSD cohort were excluded. Then, an additional 23.1 and 20.5% for EDS and HSD cohorts, respectively, were excluded because they did not have continuous enrollment with prescription drug claim capture for the entire calendar year. In total, 76.5% of EDS patients and 77.2% of HSD patients were retained for the analysis. In contrast, for all other patients in the database, only 62.5% were retained after applying the same inclusion/exclusion criteria. The larger percentage excluded was primarily due to the continuous enrollment exclusion, which indicated that patients with EDS and HSD were more likely to have commercial insurance for the entire calendar year.
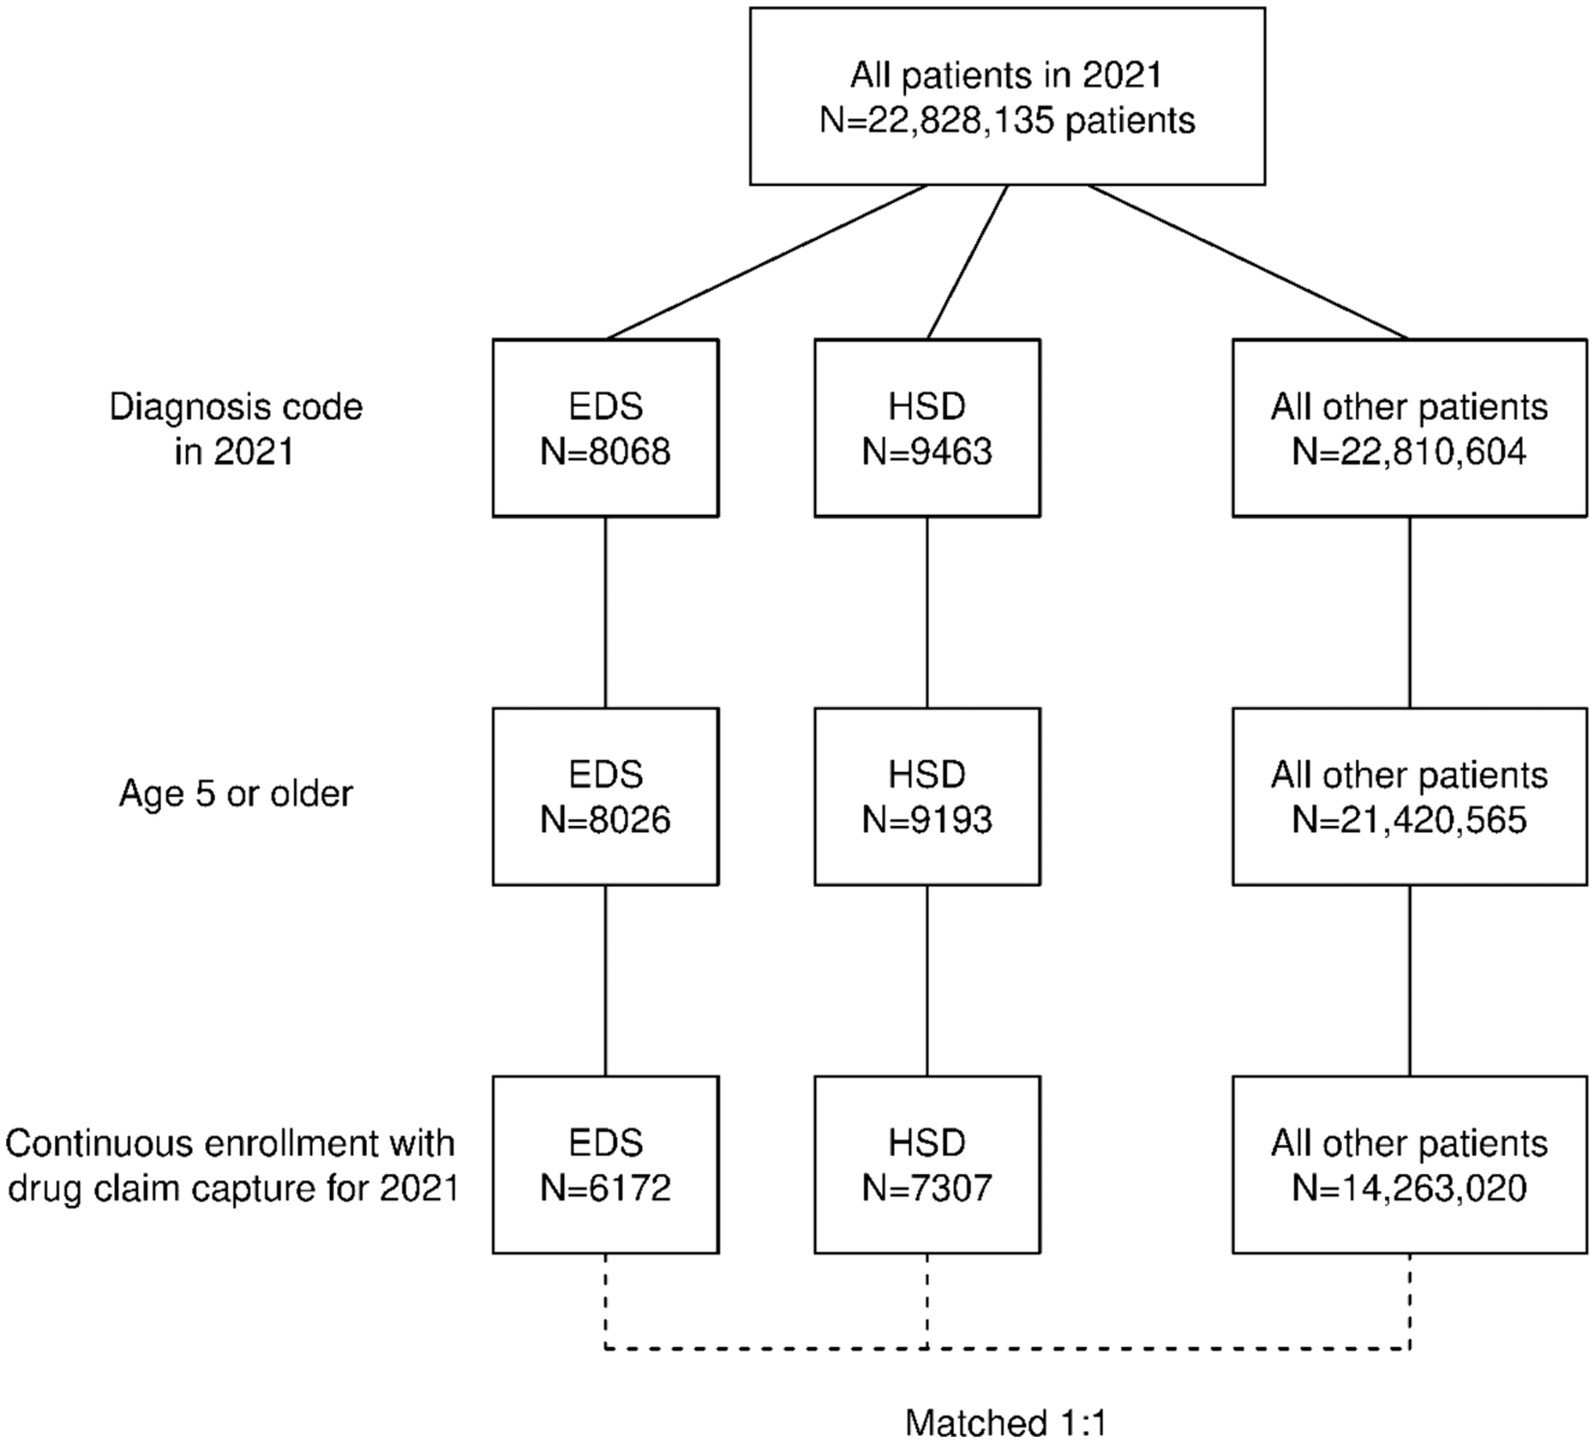
Figure 1. Construction of the cohort.
Table 1 shows characteristics and comorbidities for the EDS and HSD cohorts.
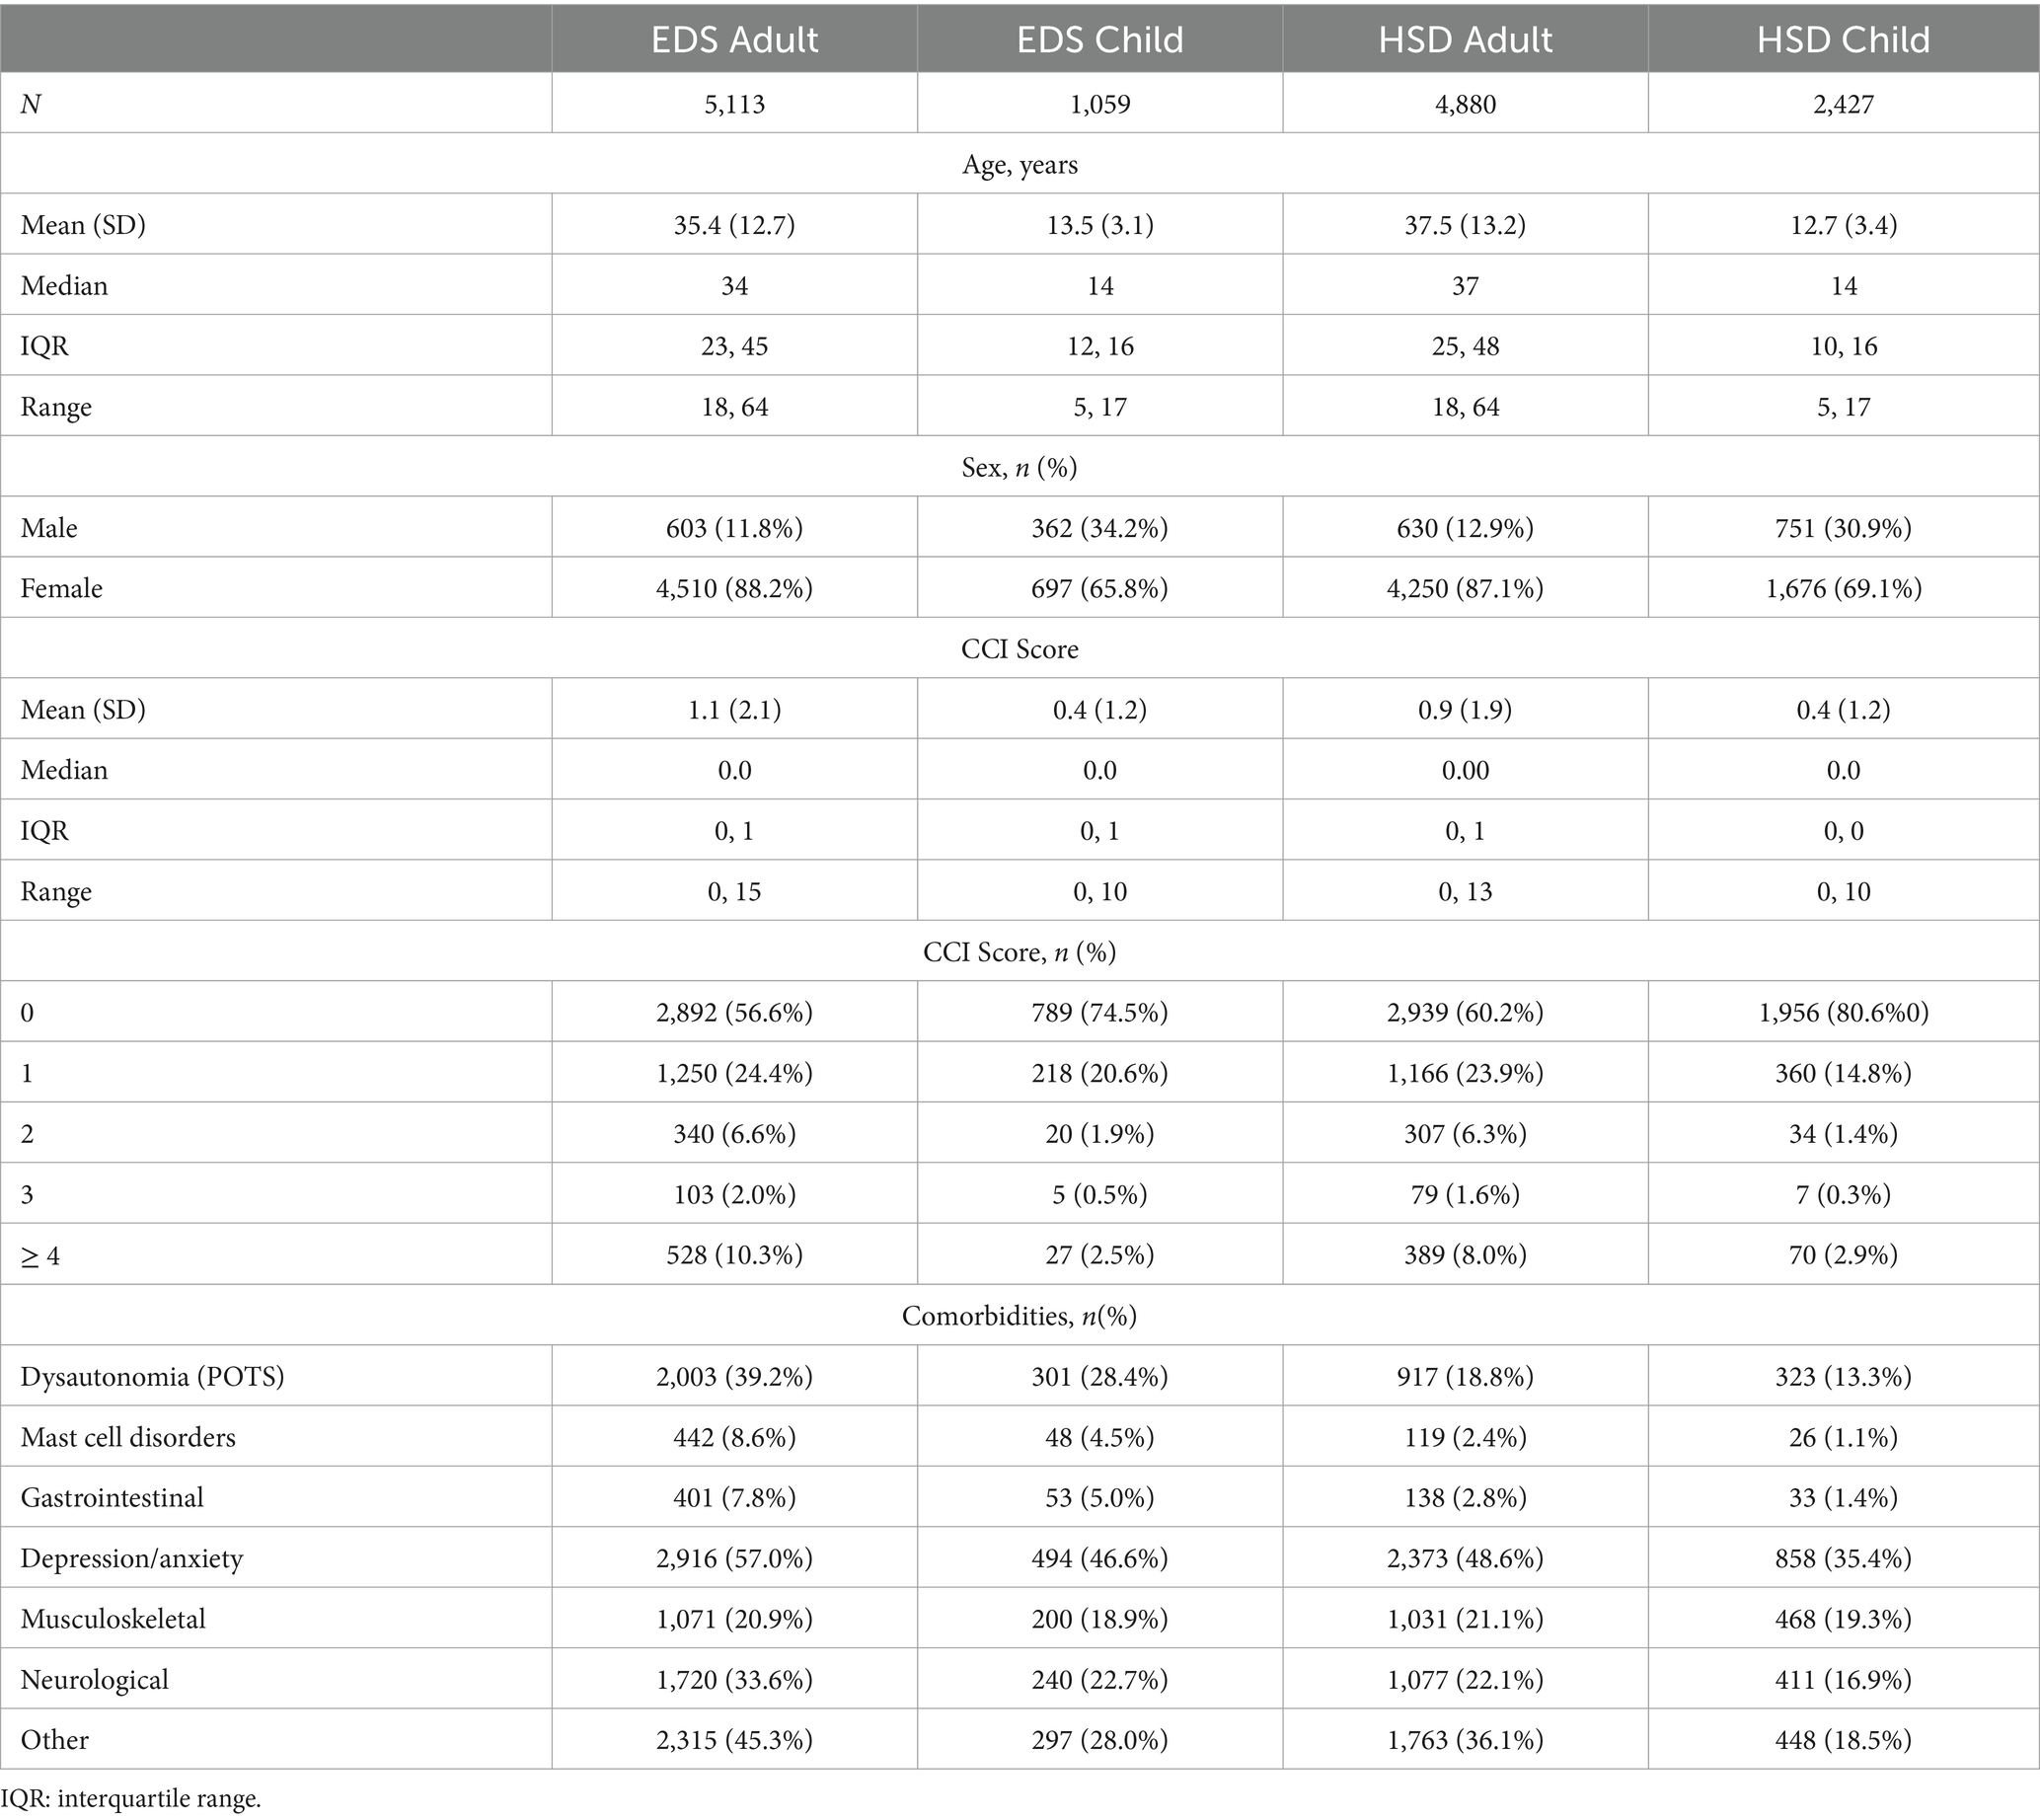
Table 1. Patient characteristics.
In the EDS cohort, 87.3% of adults and 72.8% of children had one or more EDS/HSD comorbid conditions, compared to 75.6% of adults and 60.7% of children in the hypermobility cohort. In the EDS cohort, 36.0% of adults and 21.4% of children had 3 or more EDS/HSD comorbid conditions, compared to 21.4% of adults and 11.9% of children in the hypermobility cohort.
Patient characteristics for those included in the sample were generally similar to those who were excluded. For all EDS patients (adults and child cohorts) who were excluded, the median age was 29 (compared to 30 for those included), 85.3% were female (compared to 84.4%) and 62.5% had a CCI score of 0 (compared to 59.6%). Similarly, for all HSD patients (adult and child cohorts) who were excluded, the median age was 27 (compared to 25), 82.4% were female (compared to 81.1%), and 71.3% had CCI score of 0 (compared to 67.0%).
Table 2 shows diagnoses found in claims during the year for the EDS cohort. These diagnoses are not mutually exclusive because patients could have claims for any of the diagnoses during the calendar year.
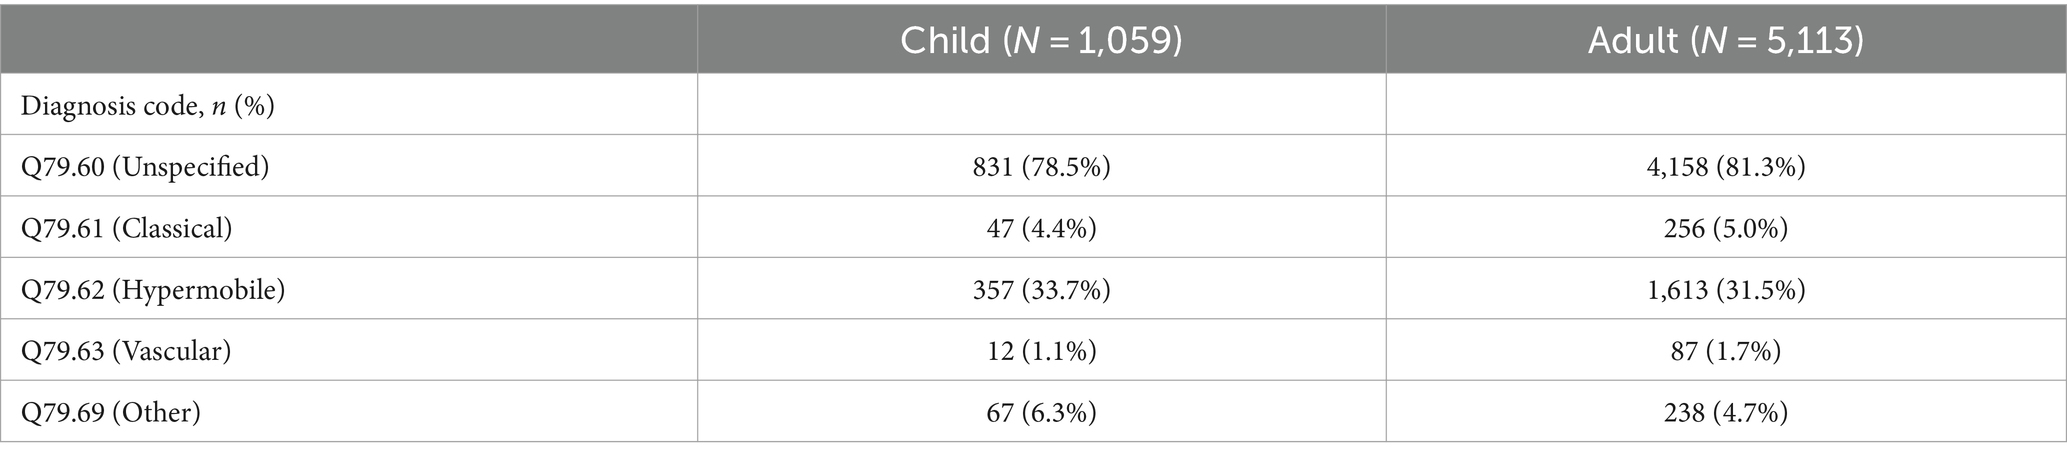
Table 2. Diagnoses for EDS cohort.
Table 3 shows the total healthcare costs overall, and by each claim source (outpatient, inpatient, pharmaceutical, and Emergency Department). By definition, all of the cohorts had outpatient claims. 13.3% of adults with EDS and 9.5% of children had inpatient claims, nearly two-fold compared to the HSD cohorts. The vast majority had pharmaceutical claims which is not surprising given the multi-system manifestations of the conditions. Approximately one-third of those with EDS and one quarter with HSD had ED claims.
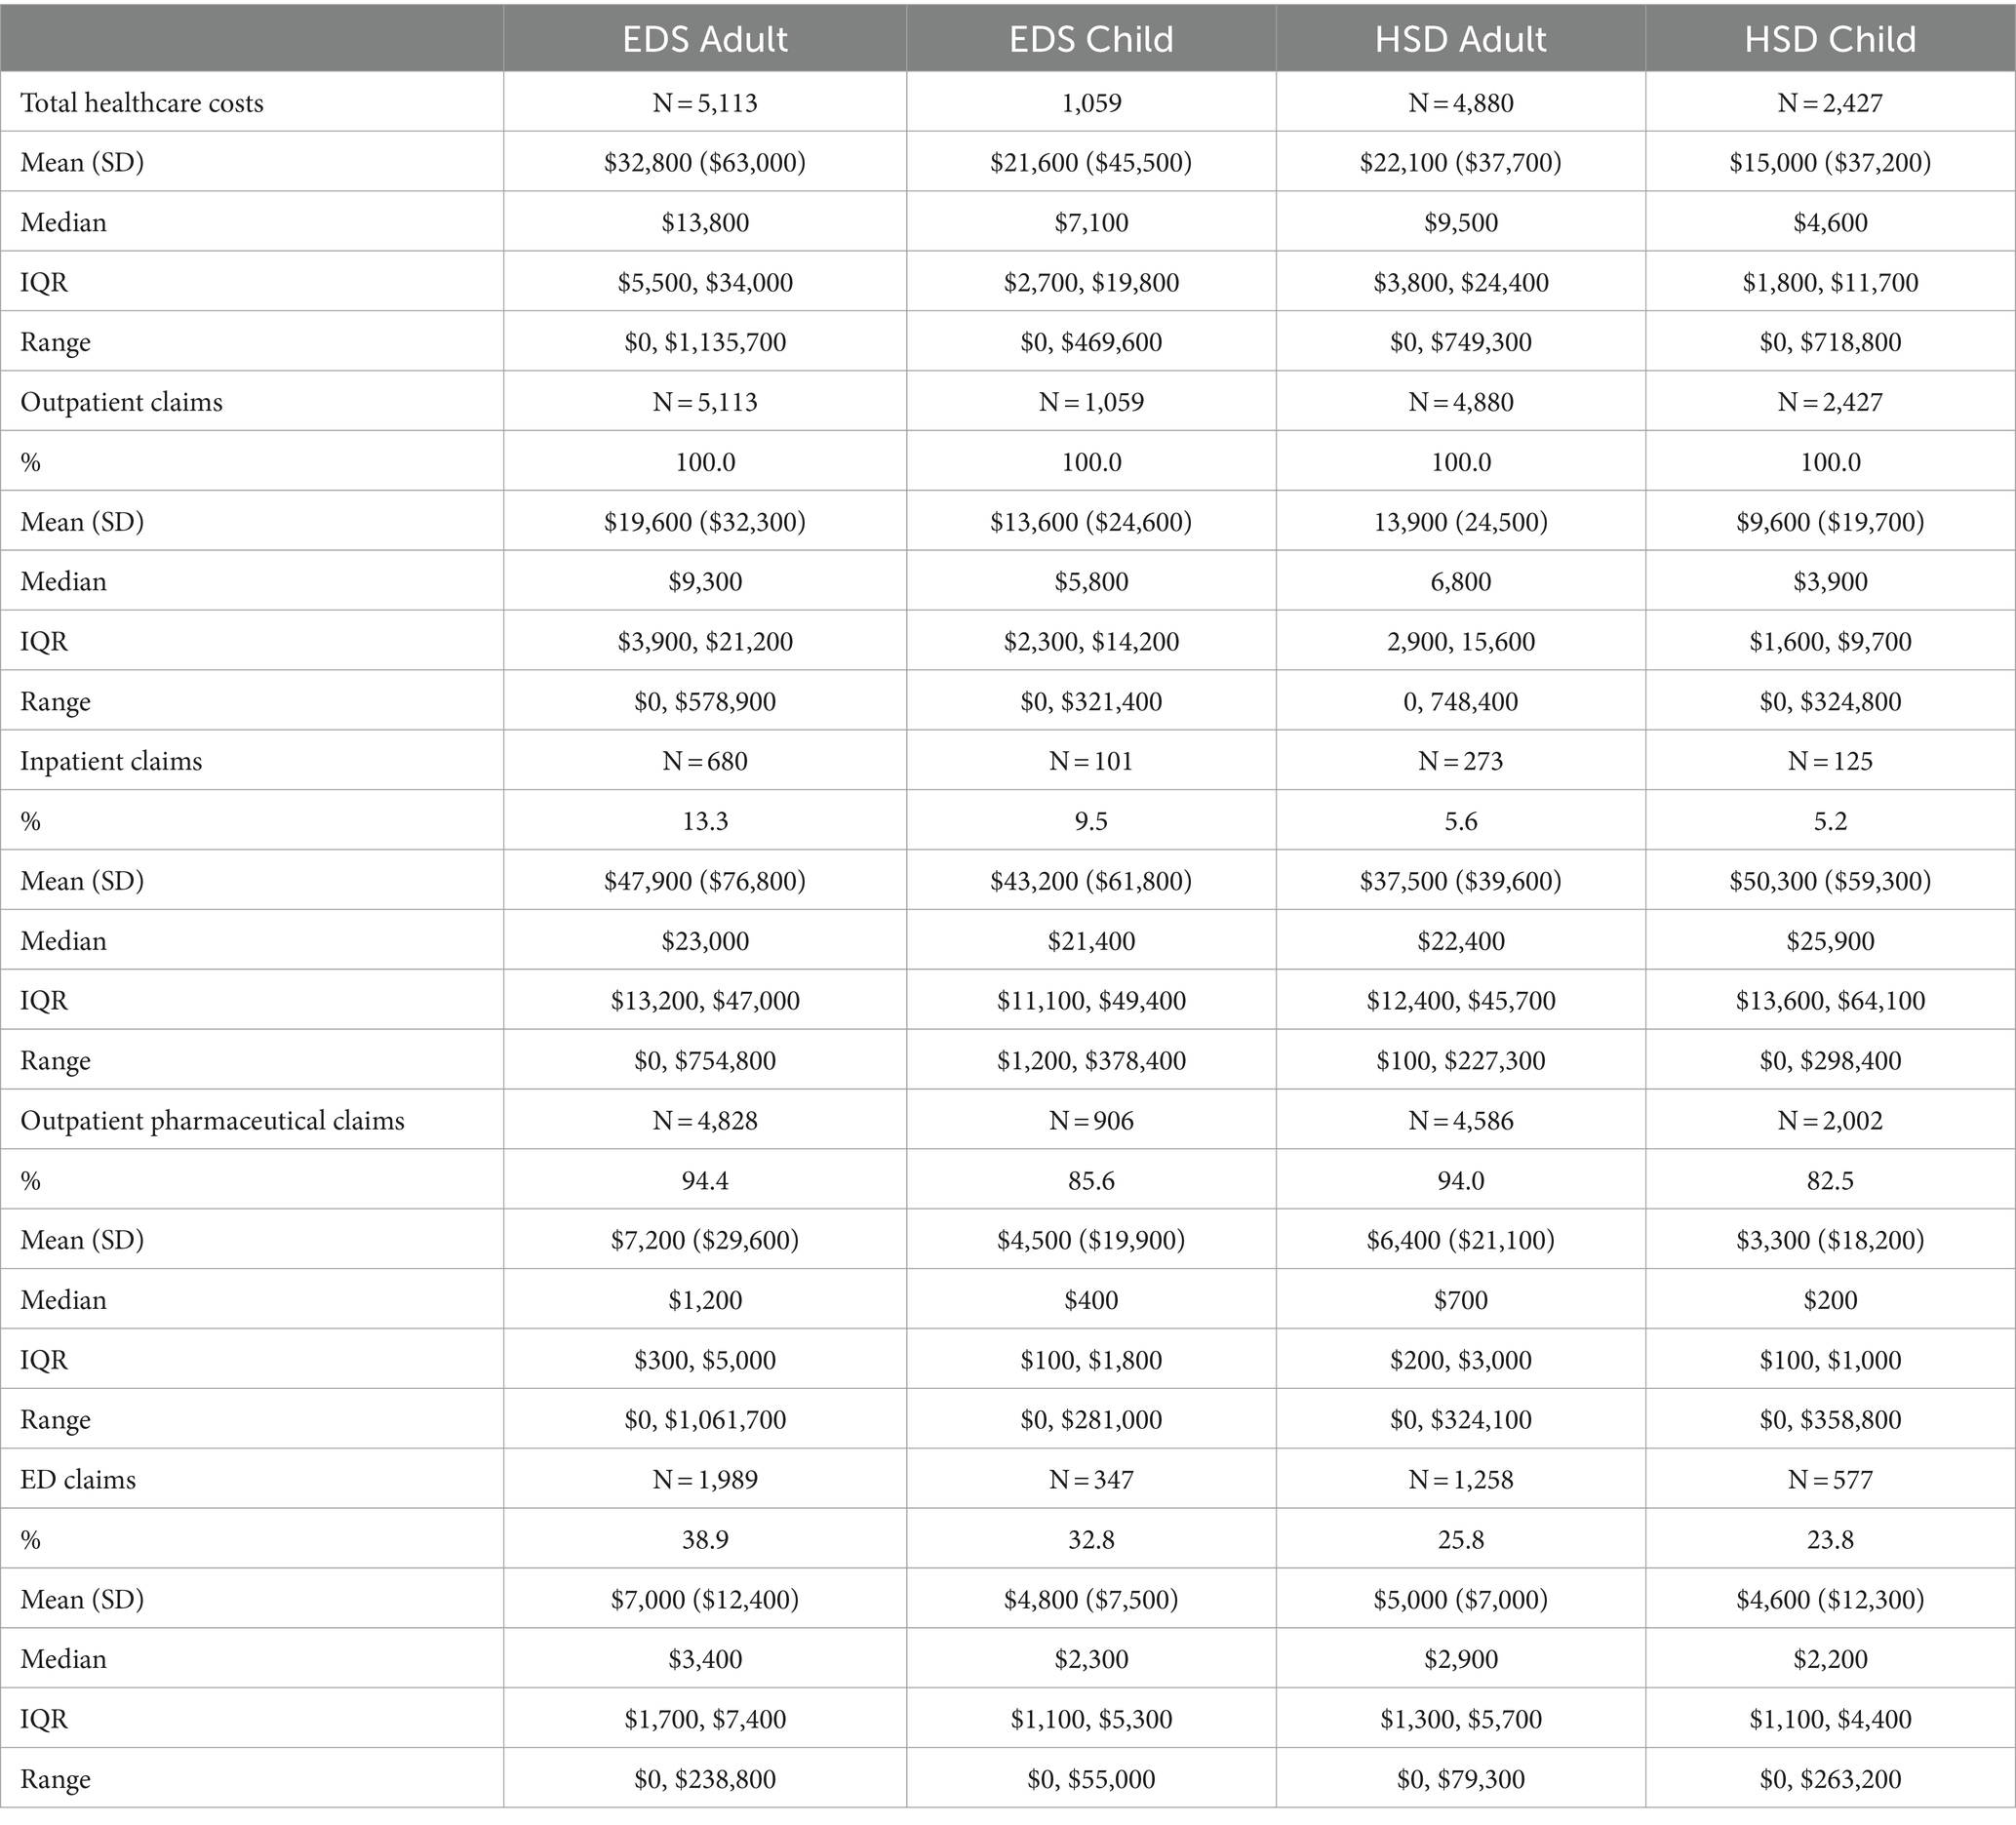
Table 3. Healthcare costs by cohort and type.
Cardiovascular complications have been noted in all EDS subtypes due tissue fragility, however, patients with vascular type EDS are at greater risk of life-threatening events including cerebrovascular events, aneurysm, and arterial dissection/rupture. For this reason, we compared vascular type to non-vascular types. For the adult EDS cohort, Table 4 shows total healthcare costs, by each claim source, stratified by whether patients had vascular type of EDS. For the child EDS cohort, only 12 patients had a diagnosis of vascular type, and therefore, we did not conduct this analysis. Mean costs were higher for patients with vascular EDS across all categories except outpatient pharmaceutical claims. This finding is consistent with the potential catastrophic manifestations of this type.
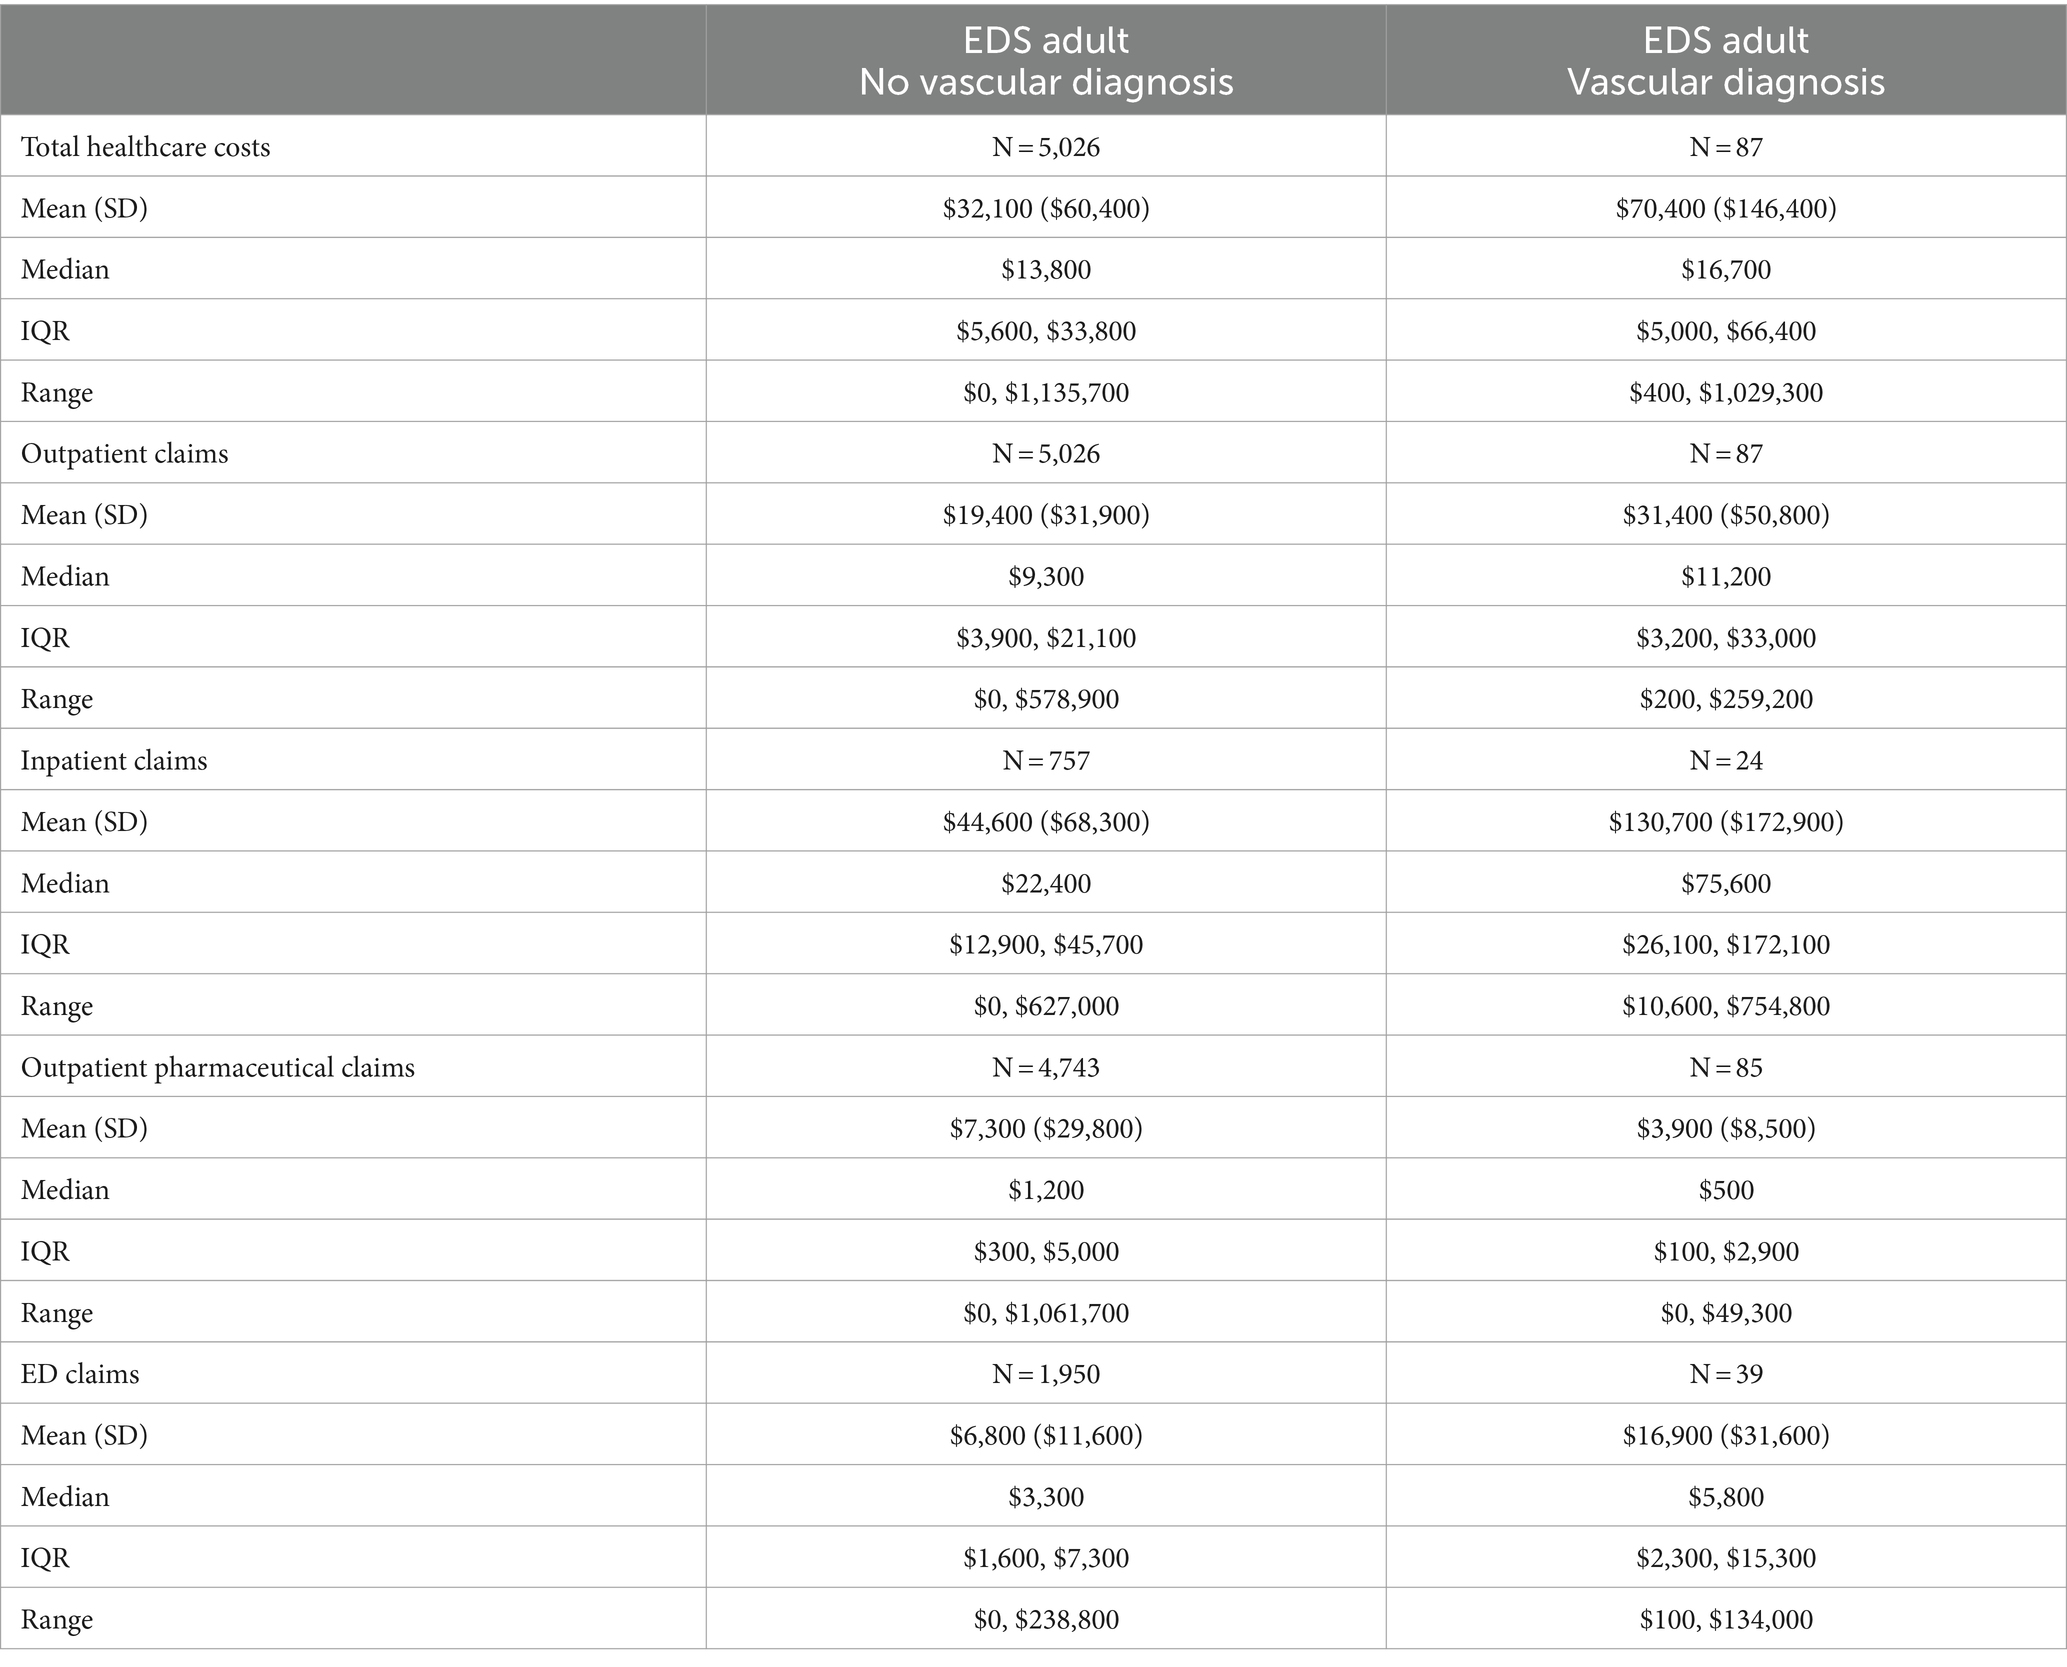
Table 4. Healthcare costs for Vascular EDS.
We compared total healthcare costs between patients with hypermobile type EDS (hEDS) and HSD patients. Table 5 shows total healthcare costs for hEDS compared to HSD. Mean costs were higher for patients with hEDS. Costs were also higher across all categories except inpatient claims which were approximately the same (data not shown). This finding is consistent with the clinical observation that individuals with hEDS are likely to be more severe in terms of their clinical presentation than those with HSD due to the coexisting conditions associated with EDS.
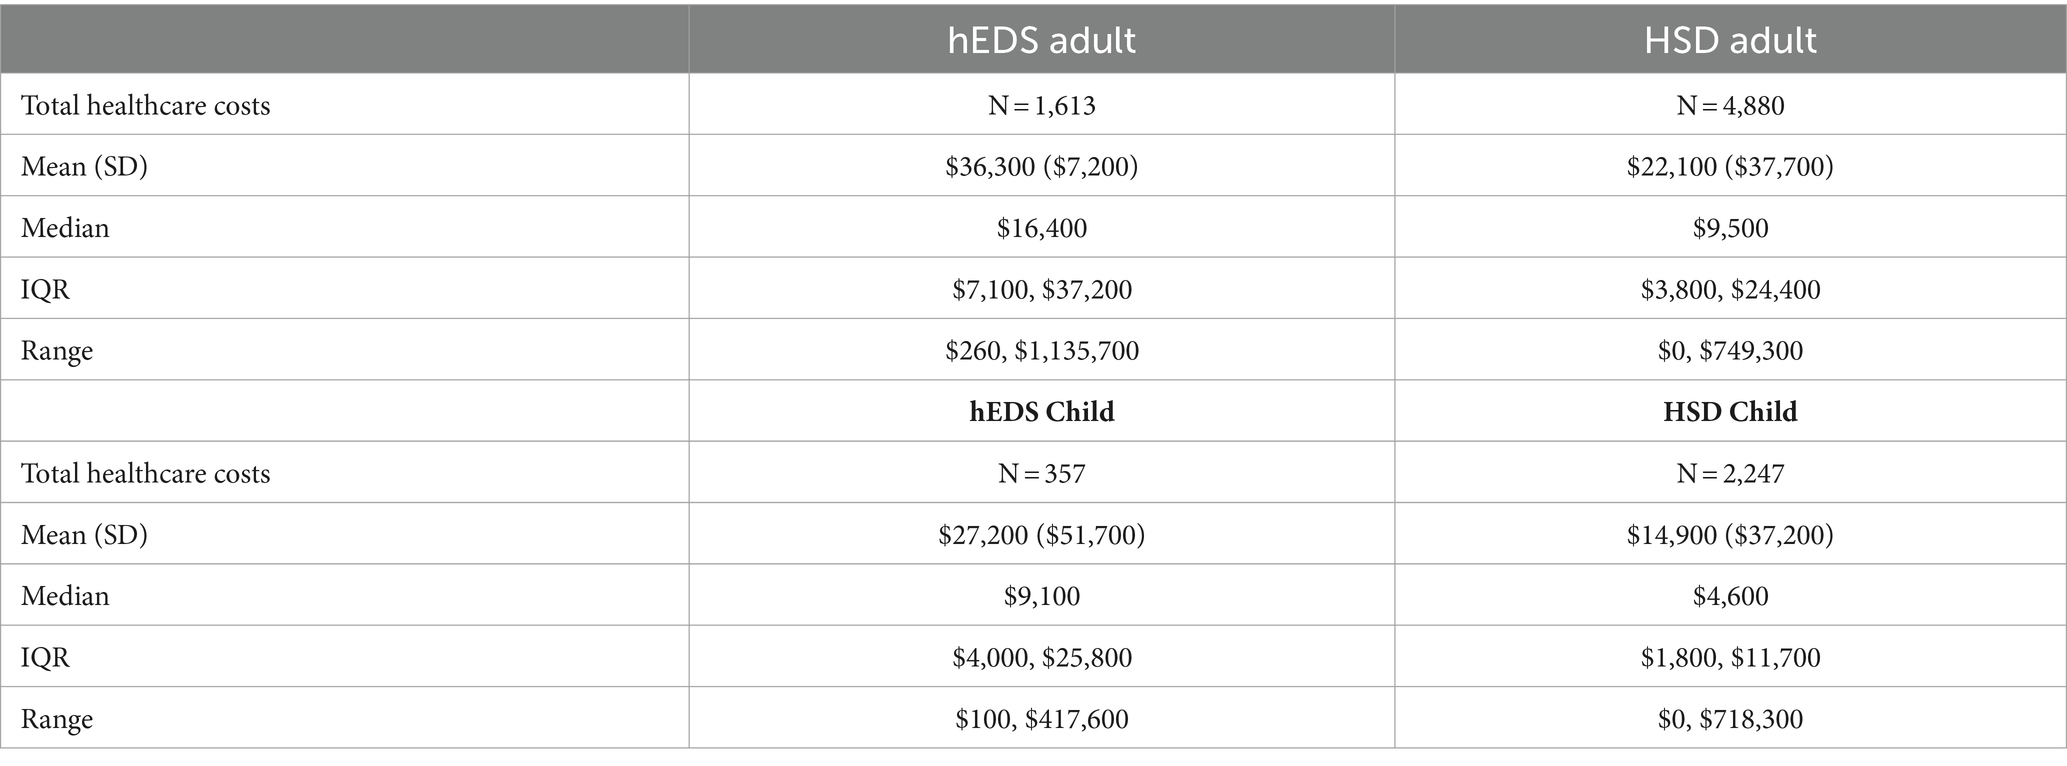
Table 5. Healthcare costs for hEDS compared to HSD.
Table 6 shows parameter estimates from fitted regression models that included comorbidities and age and sex for total healthcare costs. Multiplicative costs (cost ratios) were reported for each comorbidity along with marginal differences calculated on the dollars scale (for the reference patient).
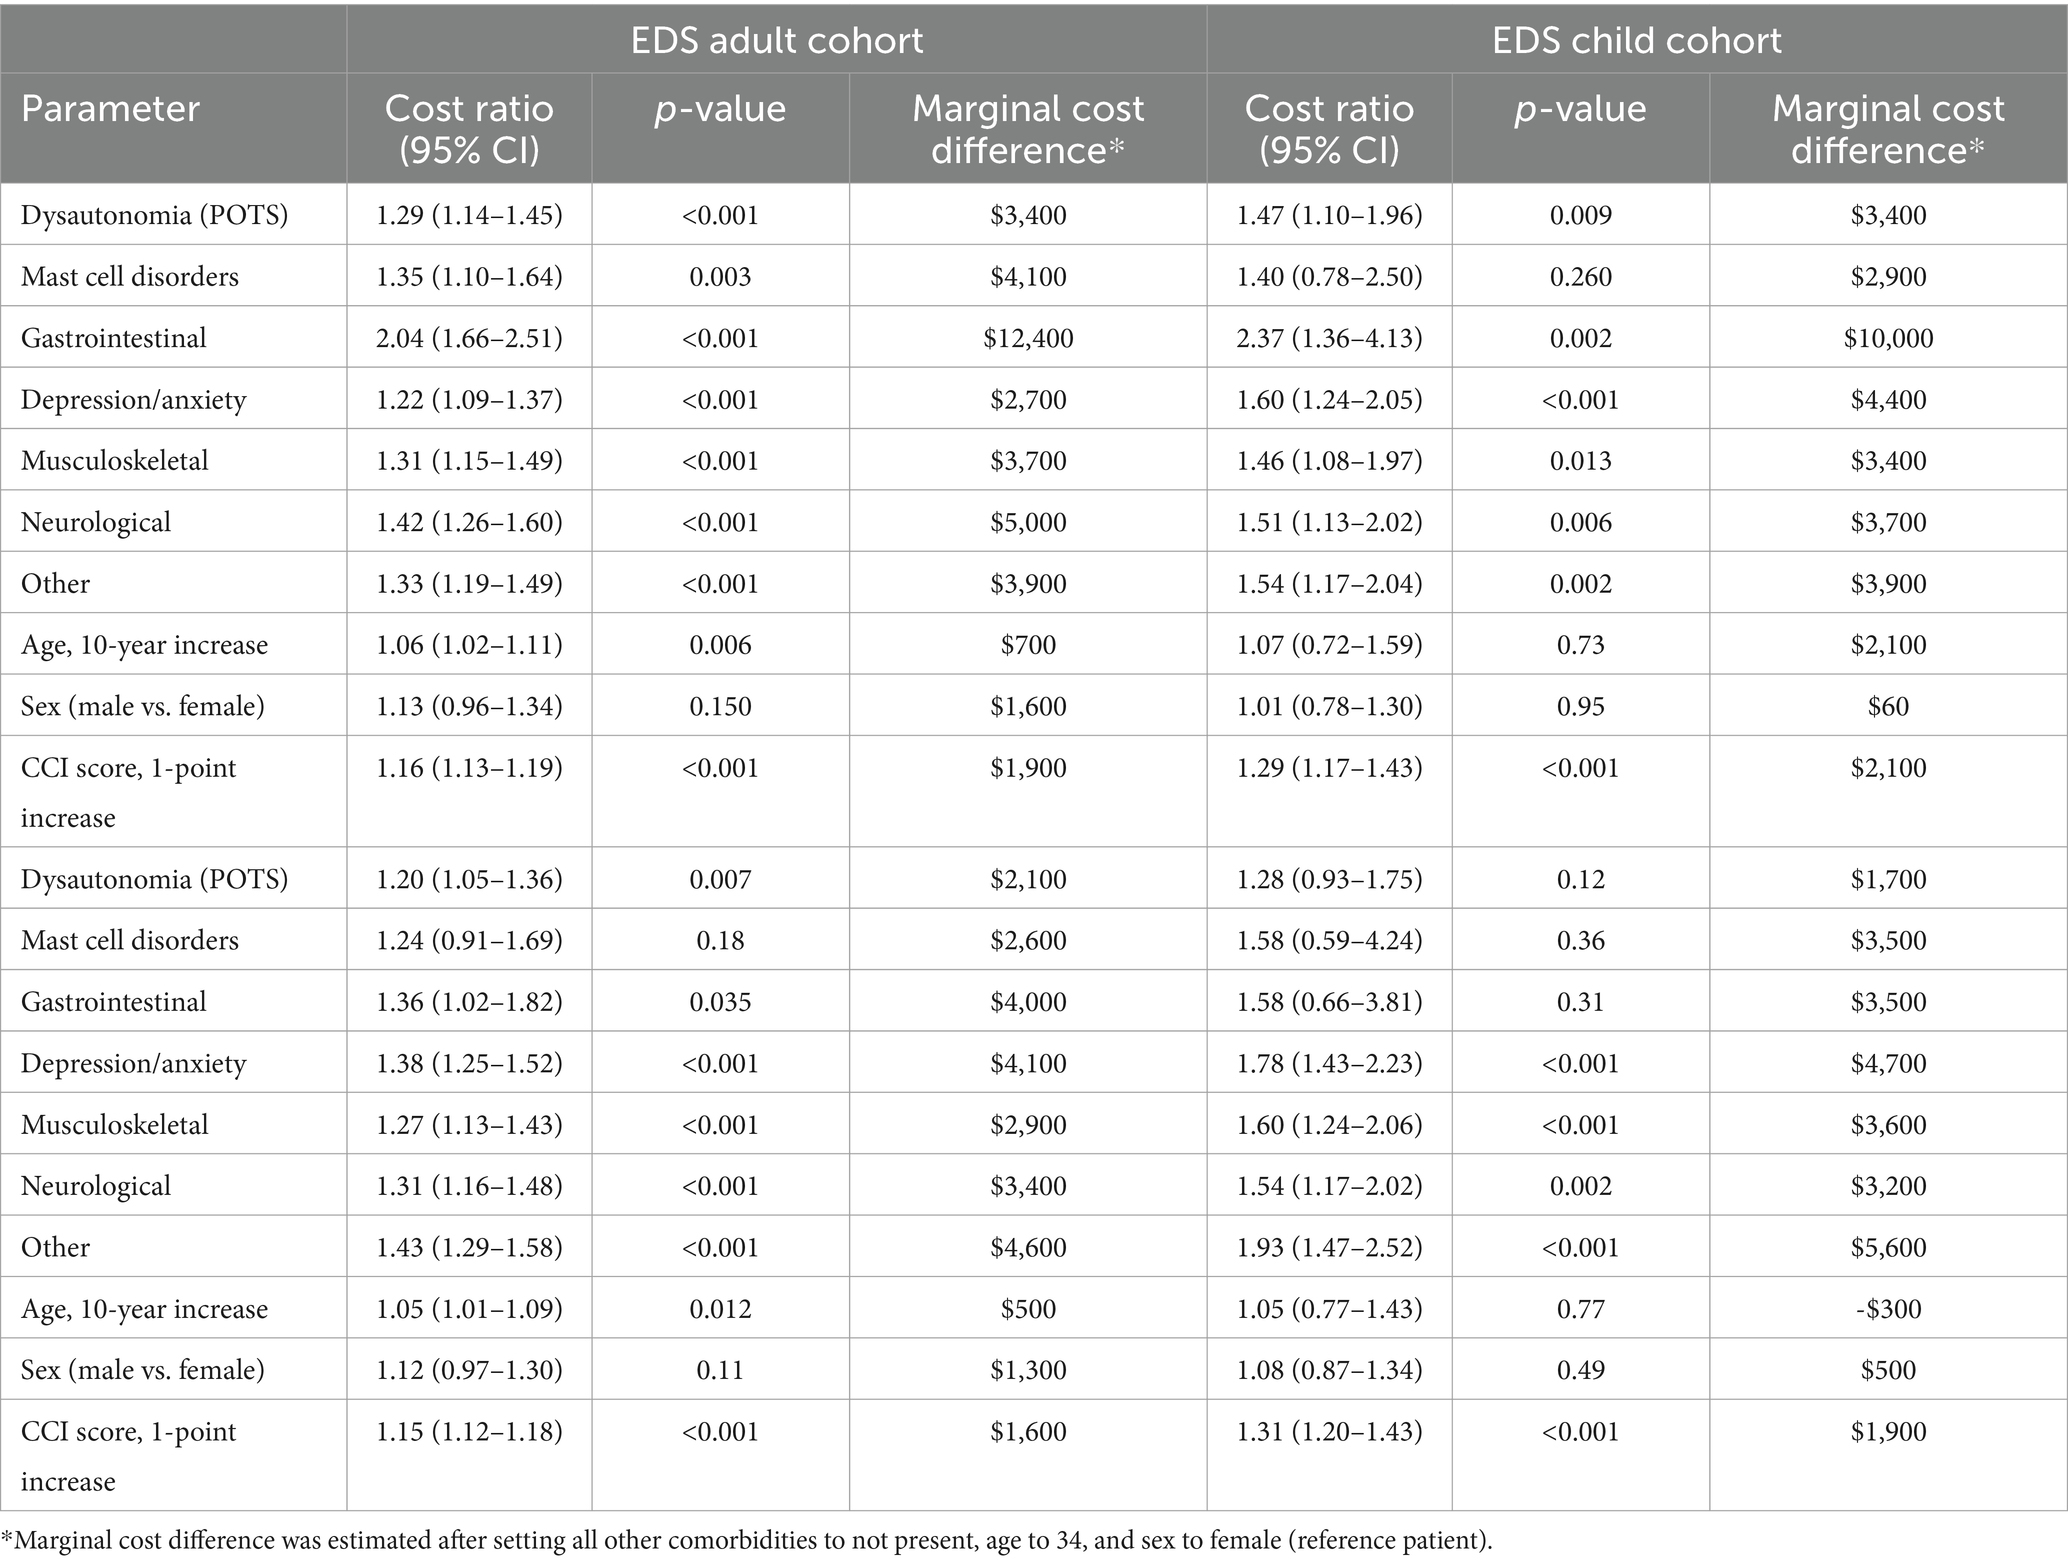
Table 6. Total healthcare costs: Estimated cost ratios and marginal differences in costs.
As reported in Table 5, for the EDS and HSD cohorts, both adults and children, with any of the comorbidities had greater healthcare costs. The largest difference was found in the EDS cohorts with gastrointestinal comorbid conditions, with more than double the costs (Adults: CR = 2.04; Children CR = 2.37), which reflected a marginal cost increase of $12,400 for the reference adult patient and $10,000 for the reference child patient. Patients with HSD, both adults and children, showed similar patterns, but to a lesser degree. Age and sex had less impact on marginal costs, however, differences in the comorbidity index were significant in all cohorts, adding to costs.
The estimated excess costs for patients with EDS and HSD are shown in Table 7. In 2021, adults with EDS and HSD had total healthcare commercial insurance costs that were $21,100 and $11,600 more than the matched comparison groups without EDS and HSD. Children with EDS and HSD had total healthcare commercial insurance costs that were $17,000 and $11,000 more than the matched comparison groups without EDS and HSD.
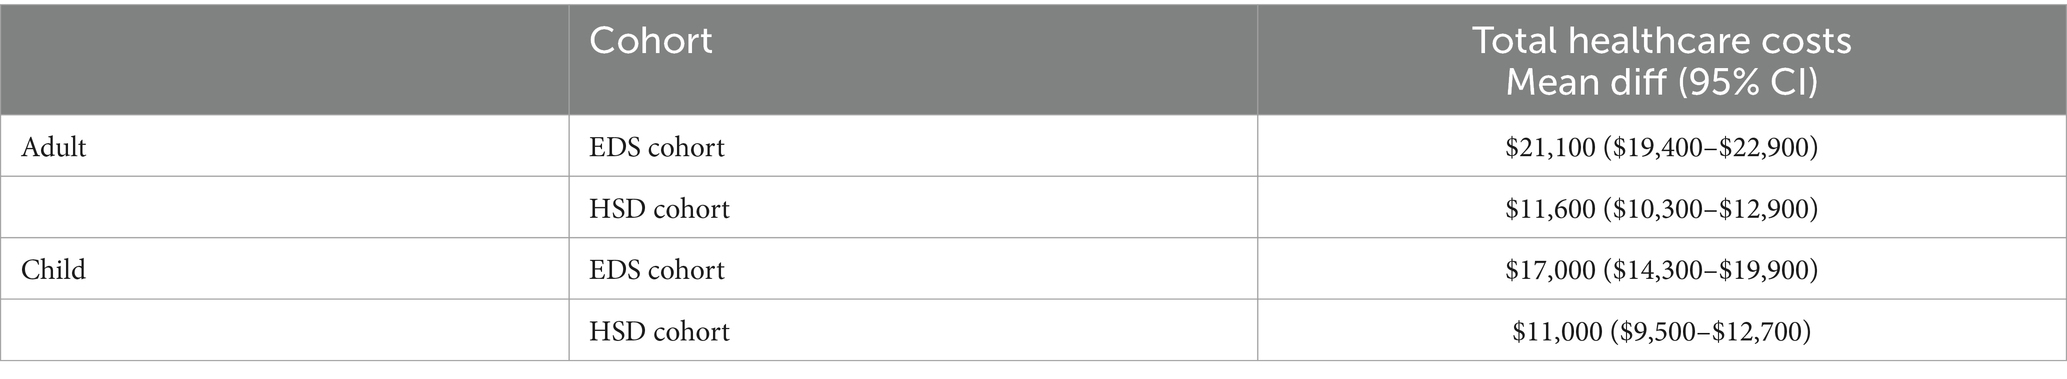
Table 7. Estimated excess costs for patients with EDS and HSD.
This research study is the first to examine the cost burden of EDS and HSD in United States. We found that patients in the MarketScan database, adults and children, who had EDS or HSD had substantially higher associated excess healthcare costs than patients without EDS or HSD when considering age, sex, geographic location, and comorbidities. Because other variables not included in the MarketScan database, such as socioeconomic factors, may also influence excess costs, we cannot conclude that EDS/HSD is the sole causal reason for these large excess costs.
A wide spectrum of diseases and disorders have been associated with EDS (14). Functional gastrointestinal disorders (disorders of the gut-brain interaction) are widespread (20–23). Autonomic dysfunction, specifically postural orthostatic tachycardia syndrome (POTS) and orthostatic hypotension are well-documented (16–19). More recently, potential associations with mast cell disorders are documented (24–27). Anxiety and depression are also well-documented (28–31). We examined the most frequently occurring comorbidities that are likely to impact costs in this population. The findings support the assumption that EDS/HSD specific comorbid conditions contribute to overall costs.
While the literature says that HSD is of comparable severity to hEDS (32) our data indicate that those diagnosed with hypermobility syndrome are incurring lower healthcare costs and thus are likely not as severe in terms of their clinical presentation. As expected, costs were higher for patients with vascular type EDS because of their need for emergency care likely due to catastrophic events (e.g., vessel rupture, arterial dissection).
The overall prevalence of EDS has been estimated to be 1 in 5000 (28, 33, 34), however, scientific evidence is lacking to support this number and the prevalence of EDS differs for each of the 13 types. Classical EDS has a prevalence of 1 in 20,000–40,000. Vascular EDS has a prevalence of 1 in 100,000–200,000 (1). Hypermobile type EDS (hEDS) is the most common, but the exact prevalence has been difficult to estimate due to changes in categorization. A recent study reports a combined prevalence of hEDS and joint hypermobility syndrome (JSD) in Wales of 1 in 500 (3). Since misdiagnosis is common, the actual number may be much higher. It is important to highlight that the costs reported in our results are only from those with an established diagnosis. The average time from the onset of symptoms to a diagnosis in hEDS can be over a decade (4). Previous research shows if undiagnosed, chronic illnesses can have even higher costs (13). These conditions have the hallmarks of rare disease including lack of research, few treatments under development, little funding, lack of public awareness, and dependence on patients’ groups for advocacy (35).
This study has several limitations. Selection bias is a limitation of our study. MarketScan is a very large convenience sample, but we cannot say that it is nationally representative because there may be differences in patient characteristics and healthcare plans that differ from the universe of all privately insured individuals. This to our knowledge has not been assessed. All of the study cohort patients had EDS/HSD, defined as at least one outpatient claim in 2021. We do not know when patients were diagnosed. Socioeconomic variables that impact having commercial insurance coverage are not included.
Notably, most EDS patients (79.5%) in this dataset were assigned the ICD-10 code “Unspecified” (Q79.60). This limited our ability to analyze subtypes. The large percentage coded unspecified could be explained by patients with overlapping types, uncertainty about types, or one of the rare types that do not have an ICD-10 subcode. Likewise, the study selection criteria for the EDS/HSD comorbid conditions were dependent on the selection of ICD-10 codes. We do not know the year that the patient was originally diagnosed; thus, we could not determine whether costs differed for patients who were newly diagnosed compared to those receiving an established treatment course. Another limitation is that there are no published diagnostic criteria for hypermobility syndrome (M35.7) and no diagnostic codes for HSD. Finally, our findings may not be applicable to patients with noncommercial insurance.
Patients living with EDS and HSD have high unmet needs, with high biopsychosocial and economic impacts. This burden affects patients, families, and health systems. Our study found that patients diagnosed with EDS or HSD had significantly greater healthcare costs than patients without EDS or HSD. Disproportionate healthcare costs in this population have health policy and economic implications. The drivers of disproportionate healthcare costs need to be understood. For example, does earlier diagnosis and appropriate referrals to specialist care, when necessary, bring down overall costs? If diagnosed and treated early and effectively, costs for EDS patients may be reduced and more predictable. It is our hope that this study highlighting the excess costs of EDS/HSD will raise interest and recognition of EDS/HSD as a public health problem. Policy implications include timely diagnosis, access to optimal treatment, and accelerated research to improve treatments.
The datasets presented in this article are not readily available because the dataset analyzed for this study was obtained by Penn State College of Medicine from Merative and is subject to restrictions under the license agreement. Requests to access the datasets should be directed to anNjaHViYXJ0QHBzdS5lZHU=.
Ethical review and approval was not required for the study on human participants in accordance with the local legislation and institutional requirements. Written informed consent from the patients/participants or patients/participants' legal guardian/next of kin was not required to participate in this study in accordance with the national legislation and the institutional requirements.
JS: Conceptualization, Investigation, Methodology, Project administration, Supervision, Writing – original draft, Writing – review & editing. ES: Data curation, Formal analysis, Methodology, Writing – original draft, Writing – review & editing, Conceptualization. DK: Writing – original draft, Writing – review & editing, Investigation. SM: Writing – original draft, Writing – review & editing, Investigation. CF: Writing – original draft, Writing – review & editing, Conceptualization, Investigation.
The author(s) declare that partial financial support was received for the research, authorship, and/or publication of this article from the Ehlers Danlos Research Foundation (EDSRF). The funder was not involved in the study design, collection, analysis, interpretation of the data, the writing of this article, or the decision to submit it for publication.
The authors declare that the research was conducted in the absence of any commercial or financial relationships that could be construed as a potential conflict of interest.
All claims expressed in this article are solely those of the authors and do not necessarily represent those of their affiliated organizations, or those of the publisher, the editors and the reviewers. Any product that may be evaluated in this article, or claim that may be made by its manufacturer, is not guaranteed or endorsed by the publisher.
1. Malfait, F, Francomano, C, Byers, P, Belmont, J, Berglund, B, Black, J, et al. The 2017 international classification of the Ehlers–Danlos syndromes. Am J Med Genet Part C Semin Med Genet. (2017) 175:8–26. doi: 10.1002/ajmg.c.31552
2. Tinkle, B, Castori, M, Berglund, B, Cohen, H, Grahame, R, Kazkaz, H, et al. Hypermobile Ehlers–Danlos syndrome (aka Ehlers–Danlos syndrome type III and Ehlers–Danlos syndrome hypermobility type): clinical description and natural history. Am J Med Genet Part C Semin Med Genet. (2017) 175:48–69. doi: 10.1002/ajmg.c.31538
3. Demmler, JC, Atkinson, MD, Reinhold, EJ, Choy, E, Lyons, RA, and Brophy, ST. Diagnosed prevalence of Ehlers-Danlos syndrome and hypermobility spectrum disorder in Wales, UK: a national electronic cohort study and case–control comparison. BMJ Open. (2019) 9:e031365. doi: 10.1136/bmjopen-2019-031365
4. Castori, M, Tinkle, B, Levy, H, Grahame, R, Malfait, F, and Hakim, A. A framework for the classification of joint hypermobility and related conditions. Am J Med Genet Part C Semin Med Genet. (2017) 175:148–57. doi: 10.1002/ajmg.c.31539
5. Atwell, K, Michael, W, Dubey, J, James, S, Martonffy, A, Anderson, S, et al. Diagnosis and management of hypermobility spectrum disorders in primary care. J Am Board Fam Med. (2021) 34:838–48. doi: 10.3122/jabfm.2021.04.200374
6. Palomo-Toucedo, IC, Leon-Larios, F, Reina-Bueno, M, Vázquez-Bautista, MD, Munuera-Martínez, PV, and Domínguez-Maldonado, G. Psychosocial influence of Ehlers–Danlos syndrome in daily life of patients: a qualitative study. Int J Environ Res Public Health. (2020) 17:6425. doi: 10.3390/ijerph17176425
7. Miklovic, T, and Sieg, VC. Ehlers-Danlos syndrome. 2023 may 29. Treasure Island, FL: StatPearls Publishing (2024).
8. Gensemer, C, Burks, R, Kautz, S, Judge, DP, Lavallee, M, and Norris, RA. Hypermobile Ehlers-Danlos syndromes: complex phenotypes, challenging diagnoses, and poorly understood causes. Dev Dyn. (2021) 250:318–44. doi: 10.1002/dvdy.220
9. Congressional Budget Office. The Prices That Commercial Health Insurers and Medicare Pay for Hospitals’ and Physicians’ Services. (2022). Available at: https://www.cbo.gov/system/files/2022-01/57422-medical-prices.pdf (Accessed November 12, 2023).
10. Merative. Merative Marketscan Research Databases. (2023). Available at: https://www.merative.com/documents/brief/marketscan-explainer-general. (Accessed November 15, 2023).
11. Glasheen, WP, Cordier, T, Gumpina, R, Haugh, G, Davis, J, and Renda, A. Charlson comorbidity index: ICD-9 update and ICD-10 translation. Am Health Drug Benefits. (2019) 12:188–97.
12. Bergsralh, DJ, and Kosanke, JL. Computerized matching of controls (technical report series #56). Rochester, MN: Mayo Foundation, pp. 1–35. (1995).
13. Hughes, G, Martinez, C, Myon, E, Taïeb, C, and Wessely, S. The impact of a diagnosis of fibromyalgia on health care resource use by primary care patients in the UK: an observational study based on clinical practice. Arthritis Rheum. (2006) 54:177–83. doi: 10.1002/art.21545
14. Leganger, J, Fonnes, S, Kulas Søborg, ML, Rosenberg, J, and Burcharth, J. The most common comorbidities in patients with Ehlers-Danlos syndrome: a 15-year nationwide population-based cohort study. Disabil Rehabil. (2022) 44:189–93. doi: 10.1080/09638288.2020.1761890
15. Halverson, CME, Cao, S, Perkins, SM, and Francomano, CA. Comorbidity, misdiagnoses, and the diagnostic odyssey in patients with hypermobile Ehlers-Danlos syndrome. Genet Med. (2023) 1:100812. doi: 10.1016/j.gimo.2023.100812
16. Rowe, PC, Barron, DF, Calkins, H, Maumenee, IH, Tong, PY, and Geraghty, MT. Orthostatic intolerance and chronic fatigue syndrome associated with Ehlers-Danlos syndrome. J Pediatr. (1999) 135:494–9. doi: 10.1016/s0022-3476(99)70173-3
17. Celletti, C, Camerota, F, Castori, M, Censi, F, Gioffrè, L, Calcagnini, G, et al. Orthostatic intolerance and postural orthostatic tachycardia syndrome in joint hypermobility syndrome/Ehlers-Danlos syndrome, hypermobility type: Neurovegetative dysregulation or autonomic failure? Biomed Res Int. (2017) 2017:9161865. doi: 10.1155/2017/9161865
18. Cheng, JL, Au, JS, Guzman, JC, Morillo, CA, and MacDonald, MJ. Cardiovascular profile in postural orthostatic tachycardia syndrome and Ehlers-Danlos syndrome type III. Clin Auton Res. (2017) 27:113–6. doi: 10.1007/s10286-016-0392-4
19. Roma, M, Marden, CL, De Wandele, I, Francomano, CA, and Rowe, PC. Postural tachycardia syndrome and other forms of orthostatic intolerance in Ehlers-Danlos syndrome. Auton Neurosci. (2018) 215:89–96. doi: 10.1016/j.autneu.2018.02.006
20. Fikree, A, Chelimsky, G, Collins, H, Kovacic, K, and Aziz, Q. Gastrointestinal involvement in the Ehlers-Danlos syndromes. Am J Med Genet C Semin Med Genet. (2017) 175:181–7. doi: 10.1002/ajmg.c.31546
21. Inayet, N, Hayat, JO, Kaul, A, Tome, M, Child, A, and Poullis, A. Gastrointestinal symptoms in Marfan syndrome and hypermobile Ehlers-Danlos syndrome. Gastroenterol Res Pract. (2018) 2018:4854701. doi: 10.1155/2018/4854701
22. Nee, J, Kilaru, S, Kelley, J, Oza, SS, Hirsch, W, Ballou, S, et al. Prevalence of functional GI diseases and pelvic floor symptoms in Marfan syndrome and Ehlers-Danlos syndrome: a national cohort study. J Clin Gastroenterol. (2019) 53:653–9. doi: 10.1097/MCG.0000000000001173
23. Alomari, M, Hitawala, A, Chadalavada, P, Covut, F, Al Momani, L, Khazaaleh, S, et al. Prevalence and predictors of gastrointestinal dysmotility in patients with hypermobile Ehlers-Danlos syndrome: a tertiary care center experience. Cureus. (2020) 12:e7881. doi: 10.7759/cureus.7881
24. Seneviratne, SL, Maitland, A, and Afrin, L. Mast cell disorders in Ehlers-Danlos syndrome. Am J Med Genet C Semin Med Genet. (2017) 175:226–36. doi: 10.1002/ajmg.c.31555
25. Bonamichi-Santos, R, Yoshimi-Kanamori, K, Giavina-Bianchi, P, and Aun, MV. Association of postural tachycardia syndrome and Ehlers-Danlos syndrome with mast cell activation disorders. Immunol Allergy Clin N Am. (2018) 38:497–504. doi: 10.1016/j.iac.2018.04.004
26. Kohn, A, and Chang, C. The relationship between hypermobile Ehlers-Danlos syndrome (hEDS), postural orthostatic tachycardia syndrome (POTS), and mast cell activation syndrome (MCAS). Clin Rev Allergy Immunol. (2020) 58:273–97. doi: 10.1007/s12016-019-08755-8
27. Monaco, A, Choi, D, Uzun, S, Maitland, A, and Riley, B. Association of mast-cell-related conditions with hypermobile syndromes: a review of the literature. Immunol Res. (2022) 70:419–31. doi: 10.1007/s12026-022-09280-1
28. Cederlöf, M, Larsson, H, Lichtenstein, P, Almqvist, C, Serlachius, E, and Ludvigsson, JF. Nationwide population-based cohort study of psychiatric disorders in individuals with Ehlers-Danlos syndrome or hypermobility syndrome and their siblings. BMC Psychiatry. (2016) 16:207. doi: 10.1186/s12888-016-0922-6
29. Bulbena, A, Baeza-Velasco, C, Bulbena-Cabré, A, Pailhez, G, Critchley, H, Chopra, P, et al. Psychiatric and psychological aspects in the Ehlers-Danlos syndromes. Am J Med Genet C Semin Med Genet. (2017) 175:237–45. doi: 10.1002/ajmg.c.31544
30. Baeza-Velasco, C, Bourdon, C, Montalescot, L, de Cazotte, C, Pailhez, G, Bulbena, A, et al. Low- and high-anxious hypermobile Ehlers-Danlos syndrome patients: comparison of psychosocial and health variables. Rheumatol Int. (2018) 38:871–8. doi: 10.1007/s00296-018-4003-7
31. Mu, W, Muriello, M, Clemens, JL, Wang, Y, Smith, CH, Tran, PT, et al. Factors affecting quality of life in children and adolescents with hypermobile Ehlers-Danlos syndrome/hypermobility spectrum disorders. Am J Med Genet A. (2019) 179:561–9. doi: 10.1002/ajmg.a.61055
32. Aubry-Rozier, B, Schwitzguebel, A, Valerio, F, Tanniger, J, Paquier, C, Berna, C, et al. Are patients with hypermobile Ehlers-Danlos syndrome or hypermobility spectrum disorder so different? Rheumatol Int. (2021) 41:1785–94. doi: 10.1007/s00296-021-04968-3
33. Pyeritz, RE. Ehlers-Danlos syndromes. N Engl J Med. (2000) 342:730–2. doi: 10.1056/nejm200003093421009
34. Kulas Søborg, ML, Leganger, J, Mortensen, LQ, Rosenberg, J, and Burcharth, J. Establishment and baseline characteristics of a nationwide Danish cohort of patients with Ehlers–Danlos syndrome. Rheumatology. (2017) 56:763–7. doi: 10.1093/rheumatology/kew478
Keywords: Ehlers-Danlos syndromes, hypermobility, economic, cost, MarketScan, commercial health insurance, health policy
Citation: Schubart JR, Schaefer EW, Knight DRT, Mills SE and Francomano CA (2024) Estimates of the excess cost burden of Ehlers-Danlos syndromes: a United States MarketScan® claims database analysis. Front. Public Health. 12:1365712. doi: 10.3389/fpubh.2024.1365712
Edited by:
Adam Atherly, Virginia Commonwealth University, United StatesReviewed by:
Seyed M. Karimi, University of Louisville, United StatesCopyright © 2024 Schubart, Schaefer, Knight, Mills and Francomano. This is an open-access article distributed under the terms of the Creative Commons Attribution License (CC BY). The use, distribution or reproduction in other forums is permitted, provided the original author(s) and the copyright owner(s) are credited and that the original publication in this journal is cited, in accordance with accepted academic practice. No use, distribution or reproduction is permitted which does not comply with these terms.
*Correspondence: Jane R. Schubart, anNjaHViYXJ0QHBlbm5zdGF0ZWhlYWx0aC5wc3UuZWR1
Disclaimer: All claims expressed in this article are solely those of the authors and do not necessarily represent those of their affiliated organizations, or those of the publisher, the editors and the reviewers. Any product that may be evaluated in this article or claim that may be made by its manufacturer is not guaranteed or endorsed by the publisher.
Research integrity at Frontiers
Learn more about the work of our research integrity team to safeguard the quality of each article we publish.