 Wenxin He
 Junjie Fu
 Ruiyi Fu
 Xiaoguang Song1
 Siyue Huang
 Yujue Wang
 Keke Lu
 Hao Wu
94% of researchers rate our articles as excellent or good
Learn more about the work of our research integrity team to safeguard the quality of each article we publish.
Find out more
ORIGINAL RESEARCH article
Front. Public Health, 09 September 2024
Sec. Environmental Health and Exposome
Volume 12 - 2024 | https://doi.org/10.3389/fpubh.2024.1357588
This article is part of the Research TopicChemical contaminants in natural environments and human health implicationsView all 12 articles
Background: Lead exposure levels are closely linked to human health and can cause damage to multiple organ systems, including the blood system and liver. However, due to insufficient evidence, the effects of lead exposure on hematological and biochemical indices have not been fully established.
Objective: This study aims to explore the blood lead levels of permanent residents in Jiangxi Province and analyze the factors affecting blood lead levels and the impact of blood lead levels on hematological and biochemical indices.
Methods: We conducted a cross-sectional study including questionnaires, health examinations, and blood sample examinations on 720 randomly selected permanent residents (3–79 years) in Jiangxi Province in 2018. The blood lead levels were measured using inductively coupled plasma mass spectrometry. Routine hematological and biochemical tests were determined by qualified medical institutions using automated hematology analyzers and biochemistry analyzers.
Results: The geometric mean of blood lead concentration in permanent residents of Jiangxi Province was 20.45 μg/L. Gender, age, annual household income, smoking, and hypertension were the influencing factors for blood lead levels. For each 1 μg/L increase in blood lead, the risks of elevated red blood cell count (from low to high), platelet volume distribution width, alkaline phosphatase (from low to high), and cholesterol increased by 2.4, 1.6, 3.6, and 2.3%, respectively, whereas the risks of elevation of direct bilirubin and total bilirubin both decreased by 1.7%.
Conclusion: The blood lead level in permanent residents of Jiangxi Province is higher than the national average. Higher blood lead levels were found in men than in women; blood lead levels were positively correlated with age but negatively correlated with annual household income; smoking and hypertension are risk factors for elevated blood lead; and blood lead levels affect routine hematological and biochemical markers such as red blood cell count, platelet volume distribution width, direct bilirubin, total bilirubin, alkaline phosphatase, and cholesterol.
Lead, also known as Pb, is a toxic heavy metal element that is widely found in human production and the living environment. Humans are exposed to Pb mainly through their diet, drinking water, air, and industrial production such as heavy metals, fuel, batteries, and gasoline manufacturing (1). In terms of diet, the test results of a total of 1,065 food items in six categories in Jiangxi Province during the period from 2018 to 2021 showed that the exceedance rate of lead was 0.75% (2). In terms of soil and water, some river water bodies in Jiangxi Province have high levels of lead (3–5); the lead content in river sediments is generally higher than the soil background value (3, 6, 7); and the lead content of Jiangxi soils, especially those in mining areas, is serious soil background value (8–12). In terms of air, atmospheric lead emissions in Jiangxi Province have increased in recent years, from 23rd in the country in 2002 (less than 200 tons) to 11th in the country in 2017 (nearly 400 tons), with non-ferrous metal smelting, industrial coal combustion, and iron and steel smelting being the main sources of lead (13). In terms of agriculture and industry, there have been reports indicating that workers in certain industries in Jiangxi Province have seriously exceeded blood lead levels (14, 15), and incidents of lead contamination, such as from improperly treated sewage from storage batteries (16) and lead contamination due to irrigation of swine wastewater (17), have also occurred occasionally. In summary, there is a certain risk of environmental lead exposure in Jiangxi Province.
Blood is both a transport medium and a key toxic target for lead. Once in circulation, blood lead levels reflect the balance of tissue absorption and accumulation. According to the clinical guidelines for blood lead levels of the China Health Council, 400 μg/L is considered harmful to health for adults and 100 μg/L for children. However, none of the blood lead values are considered safe. Due to the high toxicity and slow clearance rate, even small amounts of lead can cause damage to the nervous system, cardiovascular system, reproductive system, hematopoietic system, and liver health (18–20).
Lead blood exposure has been found to have significant effects and alterations on many hematological indicators (21). Most studies consider Pb as a harmful hematological factor that can lead to a decrease in red blood cell count, mean platelet volume, and hemoglobin content. However, some studies have come to the opposite conclusion (22, 23), Chwalba et al. (24) suggested that long-term lead exposure at levels of <50 μg/dL did not affect red blood cell counts and hemoglobin levels, and that long-term lead exposure elevated mean platelet volume compared to short-term exposure, suggesting that the relationship between lead exposure and hematological parameters is unclear and that different levels of lead exposure may have different effects on hematological indices The liver is both an important detoxification organ in the body and the site of initial lead storage and damage. Lead absorbed into the circulation reaches the liver rapidly, where it is metabolized, accumulated, and excreted through the liver, causing pathological and biochemical alterations in these organs and thus indirectly affecting blood biochemical parameters. Some studies have shown that blood lead is positively correlated with total cholesterol (25), and liver enzymes (ALP, ALT, and AST) while negatively correlated with direct bilirubin (26). However, an animal study by Pandi Prabha showed that lead toxicity reduced the levels of the liver marker enzymes alanine aminotransferase and aspartate aminotransferase in fish serum (27).
In conclusion, it is important to pay attention to the lead exposure issue in Jiangxi Province. However, the current research on blood lead and human health indicators focuses on high-risk groups or high levels of lead exposure, and there are not many human studies on the monitoring of lead exposure in the general population and the impact of low-level blood lead exposure on blood and biochemical indicators, and the relevant studies in Jiangxi Province are still blank. The connections among blood lead and hematological and biochemical indices are not conclusive yet. Therefore, we investigated the status of lead blood internal exposure in permanent residents of Jiangxi Province, aiming to understand the blood lead levels and their effects on routine hematological and biochemical indices in permanent residents of the province, to provide research evidence to elaborate the mechanisms of lead effects on routine hematological and biochemical indicators, and to provide a scientific basis for the development of targeted health strategies.
The minimum sample size of the monitoring sites was determined using the formula sample size:
The study population was permanent residents aged 3–79 years in the survey area (living in the monitoring area for more than 6 months in the 12 months prior to the survey). Permanent residents for the purpose of this monitoring were defined as citizens of Chinese nationality who had lived in the monitoring area for more than 6 months in the 12 months prior to the survey, excluding residents in the functional areas of their residences, such as the military, schools, nursing homes, and so on.
The method of multi-stage stratified random sampling was adopted, based on the urbanization rate and secondary industry employment rate of 100 counties (districts and cities) in Jiangxi Province, after stratification by clustering method, systematic sampling was used to select five monitoring sites in Duchang County, Jizhou District, Jinxian County, Lushan City and Qingshanhu District. Each monitoring site was divided into two strata according to urban and rural areas, and the urban/rural sampling ratio for the three survey sites was determined on the basis of the urbanization rate. Based on the demographic information obtained from the survey sites, the population was divided into 6 strata according to age: 3–5, 6–11, 12–18, 19–39, 40–59, and 60–79 years old, and within each stratum, it was further divided into 2 strata according to gender, for a total of 12 strata, with 4 randomly selected samples in each stratum, for a total of 720 permanent residents.
Participants were interviewed in person using face-to-face questioning by uniformly trained investigators, and younger children were answered by their parents on their behalf. The survey included basic information such as gender, age, place of origin, transportation travel, diet and home environment, as well as daily behavioral habits such as smoking and drinking. Smoking and drinking status were defined as current cigarette consumption and alcohol consumption within 1 year, and any subject under 10 years of age was considered to be a non-smoker and non-drinker.
The health examination includes height, weight, hematology routine, and blood biochemistry items. Height measurement was performed using a metal column type height meter with an accuracy of 0.1 cm; weight measurement was performed using an electronic weight scale with an accuracy of 0.1 kg The body mass index (BMI) of subjects aged 3 ~ 6 years, 7 ~ 17 years and 18 years and above were categorized as wasting, normal, overweight, and obesity according to the appropriate criteria (29–32). The clinical hematology routine and biochemical tests were determined by qualified medical institutions using automated hematology analyzers and biochemistry analyzers. The routine blood tests refer to WS/T 406–2012 Clinical Hematology Testing Routine Items Analysis Quality Requirements, and the biochemical tests refer to WS/T 403–2012 Clinical Biochemistry Testing Routine Items Analysis Quality Indicators. The test results were uploaded to the information management platform system of the center in Excel format.
Sample collection and processing were carried out in strict compliance with the Biological Monitoring Quality Assurance Specification (GB/T 16126) (33). Blood samples were collected using 5 mL vacuum blood collection tubes, 3 tubes of fasting venous blood non-anticoagulated whole blood, and 1 tube of anticoagulated whole blood of 4 mL each for children over 12 years old and adults; 1 tube of fasting venous blood anticoagulated whole blood and 2 tubes of non-anticoagulated whole blood of 4 mL each for children 6–12 years old; and 1 tube of 4–5 mL anticoagulated blood for children under 6 years old.
All samples were dispensed within 4 h. Samples for hematological tests and blood biochemical tests could only be stored at 2 ~ 6°C within 24 h of dispensing and were not to be frozen. Samples for blood lead tests were transported to the Chinese Center for Disease Control and Prevention within 24 h of dispensing for detection by inductively coupled plasma mass spectrometry (ICP-MS). The detection limit (LOD) for blood lead was 0.035 μg/L, and all test values were above the detection limit.
Organize unified training for investigators before conducting the survey, standardize the questionnaire survey process and filling methods, and arrange for supervisors to supervise and guide the survey site to ensure that the survey is conducted in strict accordance with the requirements of the unified workbook. The collection of blood samples from survey subjects is undertaken by qualified medical institutions; sampling supplies are uniformly issued; each batch of samples is measured in a standard series; the linear correlation coefficient of the standard curve for lead elements should be ≥0.999; at least 3 sets of field blanks are prepared for each batch of samples; and the sample blanks are not higher than the detection limit. Health checkups were conducted in qualified medical institutions, and the testing instruments all met the requirements of national metrological certification. The data were entered into the computer system and reviewed by Jiangxi CDC and China CDC to ensure the reliability of the data.
Statistical analysis using SPSS (version 26.0). The blood lead levels of the study subjects were skewed and approximately obeyed normal distribution after logarithmic transformation, described by geometric mean (G), median and interquartile range [M (P25 ~ P75)], maximum and minimum values. Combining the questionnaire and health examination data, the Mann–Whitney rank sum test was used for the comparison of two independent samples, the Kruskal-Wallis rank sum test was used for the comparison of multiple independent samples, and Spearman’s correlation was used to determine the correlation between the two skewed distribution indicators. Variables for which the rank-sum test or Spearman’s correlation was statistically significant were included in the linear regression. The data on routine hematological and biochemical indexes were skewed and classified into low (< P25), medium (P25 ~ P75), and high (> P75) levels according to the range of P25 ~ P75. After correcting for potential confounders, logistic regression was used to explore the dose–response relationship between blood lead levels and routine hematological and biochemical parameters. A p < 0.05 was considered a statistically significant difference.
The demographic characteristics of the study population are shown in Table 1. There were 720 study subjects, of which 360 (50.00%) were male and 360 (50.00%) were female; 384 (53.33%) were urban residents and 336 (46.67%) were rural residents; the age of the study subjects (29.29 ± 23.21) years, range 3 ~ 78 years, 3 ~ 5, 6 ~ 11, 12 ~ 18, 19 ~ 39, 40 ~ 59, 60 ~ 79 years old were 121 (16.81%), 119 (16.53%), 119 (16.53%), 120 (16.67%), 121 (16.81%), 120 (16.67%), respectively. 47 (6.53%), 427 (59.30%), 183 (25.42%), and 63 (8.75%) of the study subjects were wasting, normal, overweight, and obesity, respectively. Annual household income was less than 30 thousand yuan, 30 ~ 100 thousand yuan, and more than 100 thousand yuan were 168 (23.33%), 369 (51.25%), and 146 (20.28%). Seventy (9.72%), 49 (6.81%), 167 (23.19%), and 434 (60.28%) of the study population were engaged in primary, secondary, tertiary and other occupations, respectively. Nine (1.25%) of the study population had occupational pollution from metals and metalloids, 31 (4.31%) had occupational pollution from pesticides, 36 (5.00%) had occupational pollution from production dusts, and 37 (5.14%) had other occupational pollution.105 (14.58%), 185 (25.69%), and 44 (6.11%) were smokers, alcohol drinkers, and hypertensive patients, respectively (Table 1).
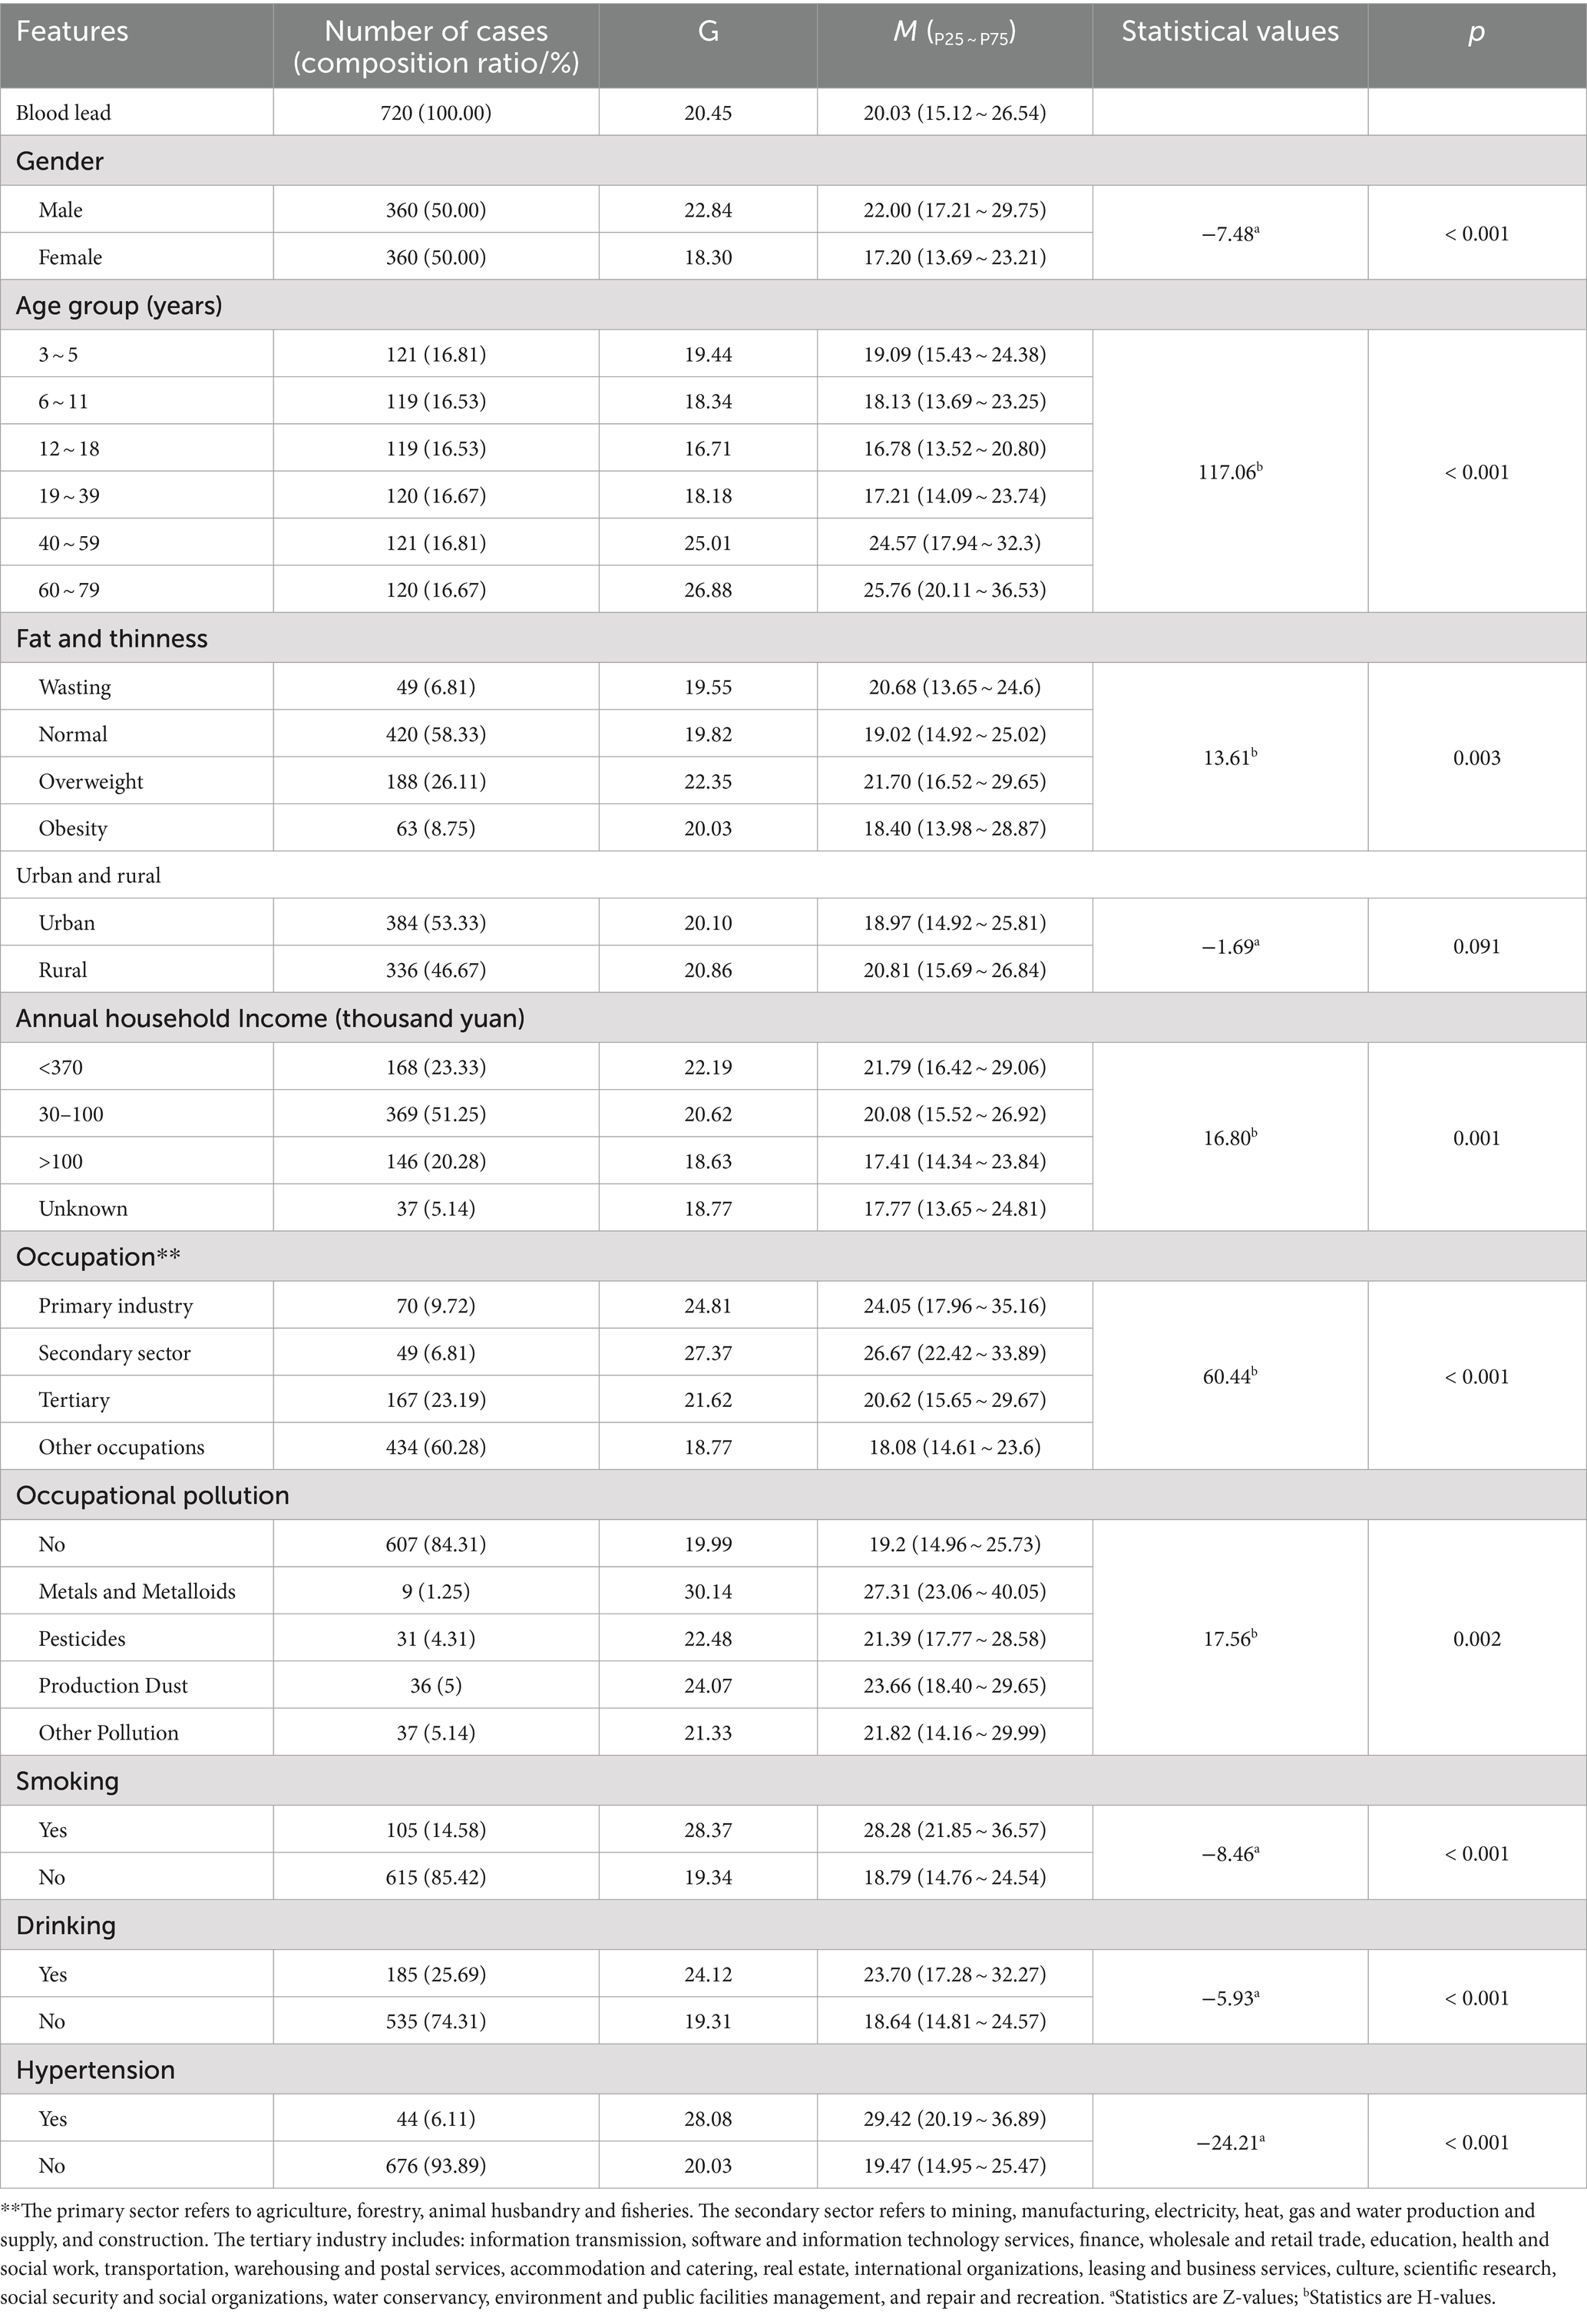
Table 1. Univariate analysis of blood lead exposure level (μg/L) and demographic characteristics, smoking, alcohol consumption, and hypertension in permanent residents of Jiangxi Province.
The study subjects traveled to and from work or school mainly on foot, 250 (34.72%) of them, and the travel time to and from work or school was mainly within one hour. Most of the study subjects made breakfast, lunch and dinner at home, 561 (77.92%), 659 (91.53%) and 477 (66.25%) respectively. The median and quartiles of mean daily intake of beverages, boiled water, coffee, freshly squeezed juice, bottled water, raw water, tea, staple food, meat, fish intake, eggs, vegetables, fruits, milk, mushrooms, and other food items of the study population in the past year were, respectively, 0 (0 ~ 20) mL/d, 600 (400 ~ 800) mL/d, 0 (0 ~ 0) mL/d, 0 (0 ~ 0) mL/d, 0.83 (0,57 ~ 14) mL/d, 0 (0 ~ 0) mL/d, 0 (0 ~ 0) mL/d, 346.76 (264.07 ~ 487.99) g/d, 60.14 (27.72 ~ 113.83) g/d, 14.29 (4.12 ~ 35.12) g/d, 30 (14.29 ~ 50) g/d, 155 (80 ~ 300) g/d, 50 (14.29 ~ 120) g/d, 35.71 (0 ~ 200) g/d, 3.57 (1 ~ 14.29) g/d, 8.09 (1.67 ~ 23.33) g/d. Among the study subjects, 539 (74.86%) had tap water as their main type of drinking water, 652 (90.56%) had a frequency of consumption of fried foods <1 time/week, and 673 (93.47%) had a frequency of consumption of barbecued foods <1 time/week (Tables 1, 2).
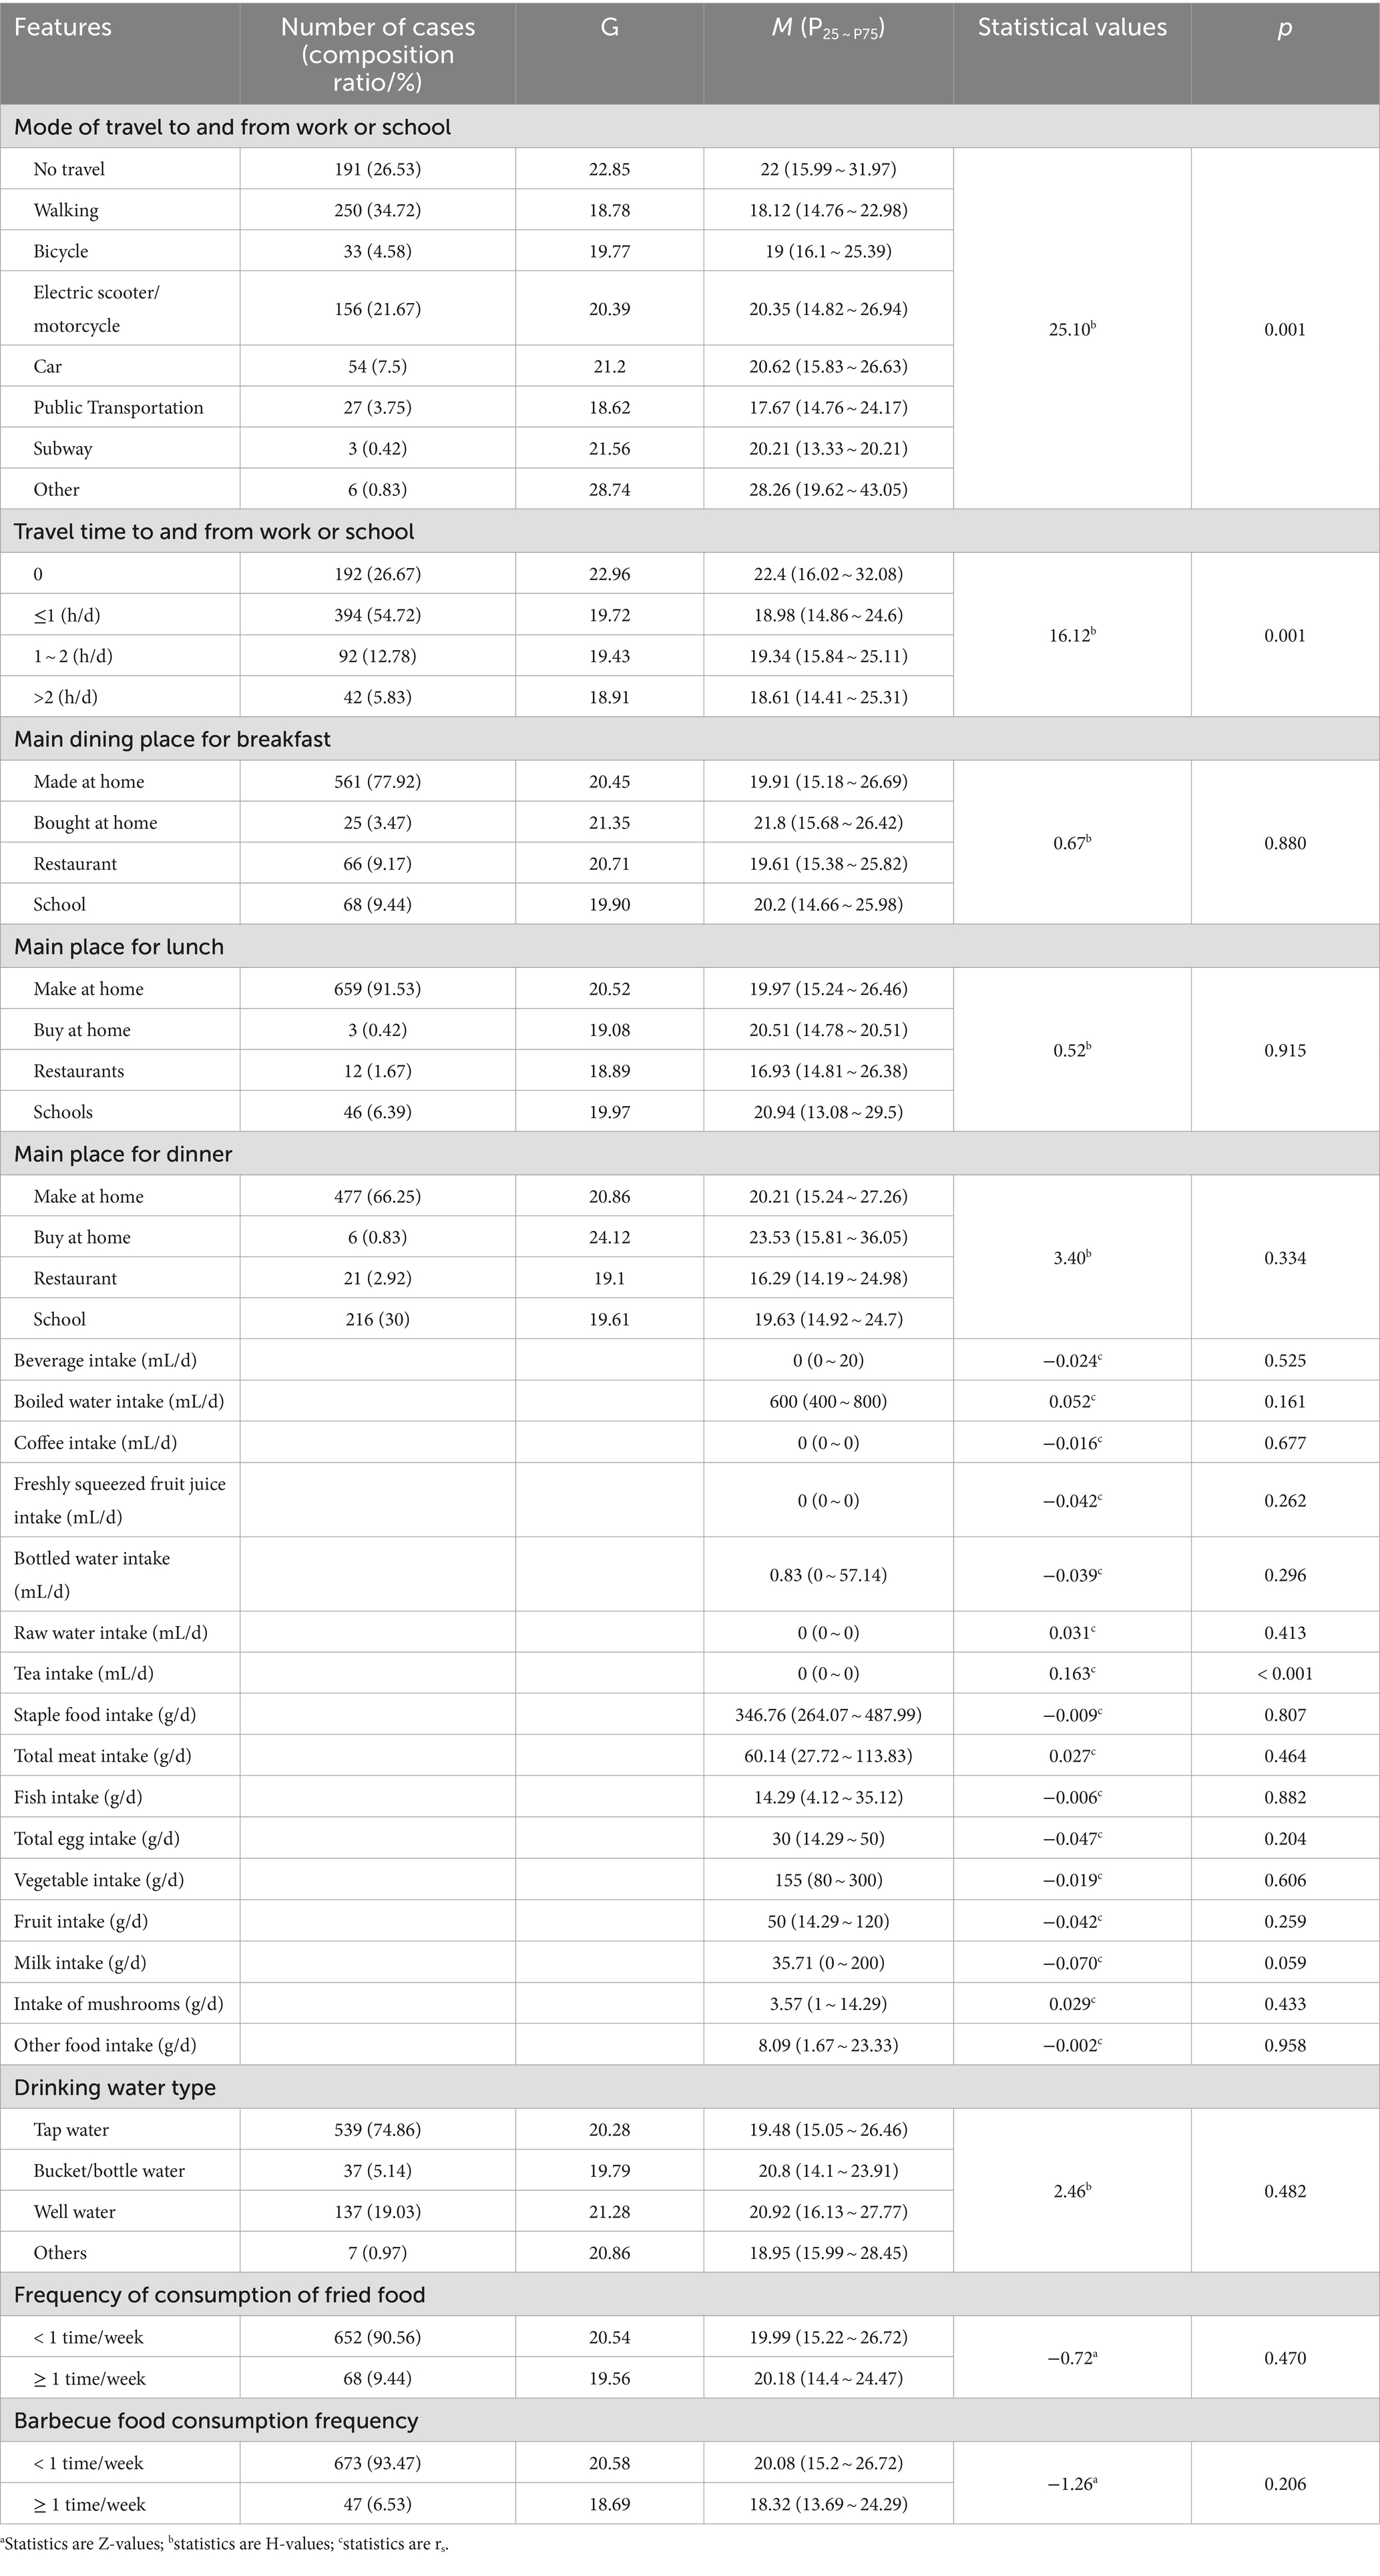
Table 2. Univariate analysis of blood lead exposure level (μg/L) and transportation and diet among permanent residents in Jiangxi Province.
Among the study subjects, 52 (7.22%) used air purifiers or activated charcoal. Most of the study subjects did not use insecticides, moth-proofing agents, air fresheners, air purifiers, disinfectants, toilet cleaners, and hoods on a regular basis, 451 (62.64), 598 (83.06%), 661 (91.81%), 698 (96.94%), 527 (73.19%), 286 (39.72%), and 326 (45.28%). 352 (48.89%) used mosquito repellent occasionally. Among the study population, 365 (50.69%) did not renovate their dwellings, 442 (61.39%) did not replace their furniture, 349 (48.47%) had simple buildings, 319 (44.31%) had actual usable area of the dwelling less than 100 m2, 473 (65.69%) used closed kitchens, 384 (53.33%) had kitchens with exhaust fan for ventilation, 595 people (82.64%) use gas/LPG/natural gas/biogas as the first domestic fuel for cooking, 518 people (71.94%) cook frequently, 516 people (71.67%) use electricity as the main heating method in winter, 653 people (90.69%) in spring, 686 people (95.28%) in summer, and 627 people (87.08%) in fall, 455 (63.19%) in winter, and the frequency of indoor ventilation was characterized by >5 times/week.
The blood lead concentration of 720 study subjects participating in this survey ranged from 7.27 to 103.73 μg/L, with a geometric mean of 20.45 μg/L, a median of 20.03 μg/L, and P25 and P75 were 15.12 and 26.54 μ g/L, respectively. The results of the rank sum test showed that blood lead levels differed significantly by gender (p < 0.001), age group (p < 0.001), fat and thinness (p = 0.003), annual household income (p = 0.001), occupation (p < 0.001), occupational pollution (p < 0.05), smoking (p < 0.001), drinking (p < 0.001), hypertension (p < 0.001), mode of travel to and from work or school (p < 0.05), travel time to and from work or school (p < 0.05), frequency of hood use (p < 0.05), type of housing (p < 0.05), and frequency of cooking (p < 0.05). Blood lead levels were positively correlated with tea intake (p < 0.001) (Tables 1, 2, 3).
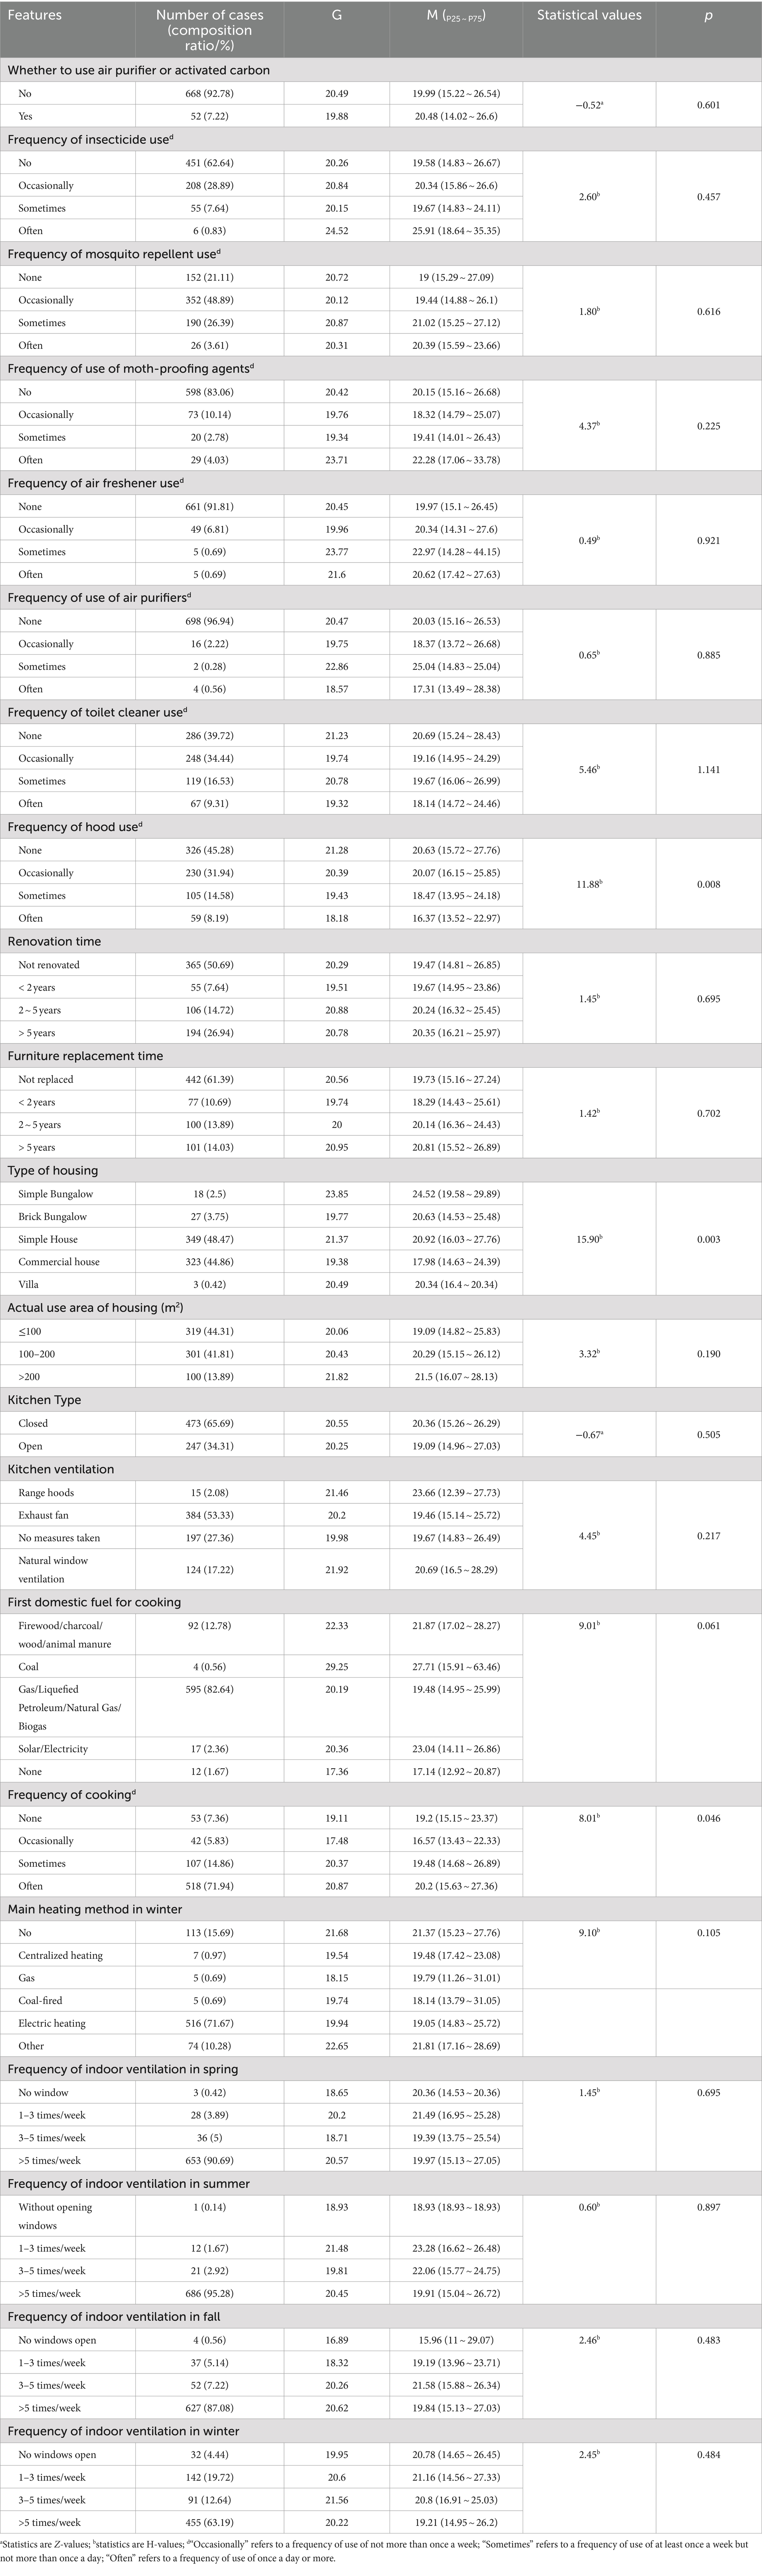
Table 3. Univariate analysis of blood lead exposure level (μg/L) and home environment in permanent residents of Jiangxi Province.
Blood lead concentration was approximately normally distributed after log-transformation, and by stepwise linear regression, gender (β = 0.078, p < 0.001), age groups (β = 0.022, p < 0.001), annual household income (>100 thousand yuan) (β = −0.042, p < 0.05), smoking (β = 0.075, p < 0.001), hypertension (β = 0.092, p < 0.05), and frequency of hood use (β = −0.014, p < 0.05) still had significant effects on blood lead concentration (Table 4).
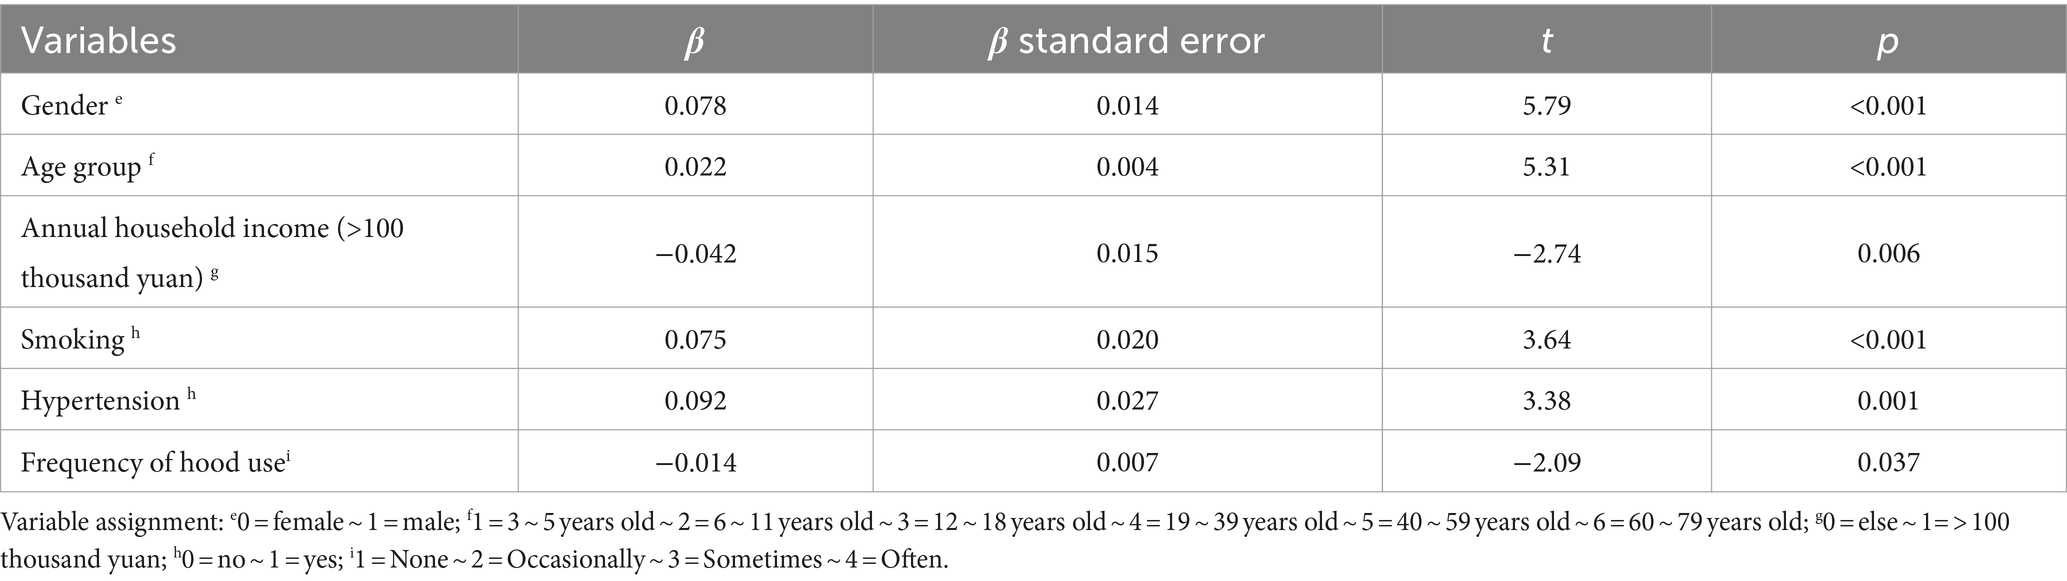
Table 4. Multiple linear regression results of blood lead levels and related factors in permanent residents of Jiangxi Province.
The data of routine hematological and biochemical indexes of the surveyed subjects were skewed, and their median, P25 and P75 distributions are shown in Table 5. We classified the data of routine hematological and biochemical indexes into low, medium, and high levels according to P25 and P75, and analyzed the effects of blood lead levels on routine hematological and biochemical indexes of the survey respondents after correcting for gender, age, annual household income, smoking, and hypertension. Logistic regression analysis showed that each unit increase in blood lead resulted in a 2.4% (OR = 1.024, 95%CI: 1.001 ~ 1.048), 1.6% (OR = 1.016, 95%CI: 1.002 ~ 1.031), 3.6% (OR = 1.036, 95%CI: 1.000 ~ 1.072), and 2.3% (OR = 1.023, 95%CI: 1.007 ~ 1.039) increased risk of elevated RBC (from low to high levels), PDW, ALP (from low to high levels), and CHO, respectively, while the risks of elevated DBIL and TBIL decreased by 1.7% (OR = 0.983, 95%CI: 0.969 ~ 0.998) (p < 0.05) (Table 6).

Table 5. Distribution of routine hematological and biochemical indices of permanent residents in Jiangxi Province.

Table 6. Association of blood lead levels with routine hematological and biochemical indices in permanent residents of Jiangxi Province.
The study found that the geometric mean of blood lead concentration in permanent residents of Jiangxi Province was 20.45 μg/L, which was significantly lower than that of Liaoning Province, higher than that of Jilin Province (34) and the national (35). Compared with other countries, the geometric mean of blood lead in our province is higher than that in the United States (36) and Korea (37). The range of blood lead concentration of permanent residents in Jiangxi Province is 7.27 ~ 103.73 μg/L, which is far below the limit value of lead poisoning proposed by the China Health and Wellness Commission (400 μg/L for adults and 100 μg/L for children) and is still at a low concentration level.
In the study, the blood lead levels of males was higher than that of females, which was consistent with Guizhou Province (38). This difference may be due to differences in men’s and women’s jobs and lifestyles, as well as physiological processes and hormone levels. Females are mainly engaged in family activities, and their positions require avoiding lead working environment as much as possible, while males have long outdoor activities and more opportunities for lead occupational exposure, so their blood lead levels are relatively higher. This study found that age was positively correlated with blood lead levels (p < 0.001), which may be related to the duration of exposure and metabolic levels in different age groups. Lead tends to accumulate in the human body, and as age increases, the exposure time of the human body to lead increases, while the functions of the body decrease and the metabolic rate also slows down, which makes the accumulation of lead in the body more serious and the internal exposure level increase. It was also found that those with an annual household income of more than 100 thousand yuan had lower blood lead levels (p < 0.05), probably because higher-income people have better living environments and pay more attention to the quality of foods than lower-income people, and therefore are less likely to consume lead-containing foods and have less exposure to lead in their living environments. The study showed that the blood lead level was lower in residents with frequent use of hoods, which may be due to the fact that lead is contained in grease fumes, and those with frequent use of hoods inhaled less grease fumes and therefore had a lower blood lead level. There was no statistically significant difference in blood lead exposure between urban and rural residents (p > 0.05), which may be related to the industrial layout and the proximity of urban and rural residents’ living standards, as factories tend to build their plants at the urban–rural border to save costs, and as China’s strategy of revitalization of the countryside advances, the living standards of rural residents have significantly improved, and urban and rural residents’ living conditions have become more and more convergent, so that urban and rural residents have similar levels of exposure to lead. Human lead comes from the outside environment, and tobacco smoke is an important source of lead exposure for permanent residents. Tobacco plants can capture lead from soil and air and enrich it in tobacco leaves. The results of this study demonstrated that human blood lead concentrations were higher in the smoking group than in the non-smoking group. The study (39) showed that each gram of cigarette contains about 0.54 μg of lead, and 33–60% of lead is transferred to cigarette smoke during the smoking process and enters the body as aerosols through the respiratory tract, thus the lead level in smokers is usually higher. It is suggested that changing the living habits of the population and advocating smoking cessation are feasible measures to reduce lead exposure. There is a lack of evidence regarding the mechanism of the effect of lead and hypertension, but many cross-sectional studies (40–42) have shown that lead exposure levels are positively associated with hypertension, which is consistent with the results of this study.
Currently, most of the studies on lead and routine hematological and biochemical indices focus on high blood lead internal exposure, and there is a lack of studies on the effects of low blood lead internal exposure on routine hematological and biochemical indices. The low blood lead concentration explored in the study makes up for the shortcomings of this type of study. High concentrations of lead can interfere with the redox reactions and energy metabolism of cells by binding to enzymes containing sulfhydryl groups involved in cellular metabolism, resulting in damage to multiple organ systems such as the hematopoietic system and liver, causing changes such as a decrease in RBC and Hb. The study found that low blood lead concentrations were positively correlated with RBC and CHO and negatively correlated with DBIL and TBIL. This may be related to the toxic excitatory effect (hormesis), which is the stimulating effect of low-concentration blood lead on the organism.
Lead inhibits the activity of heme synthetase, so lead poisoning is often manifested by a decrease in hematocrit, and the body shows signs of anemia. However, the results of this study showed a positive correlation between blood lead exposure and red blood cell count. Although lead blocks the binding of protoporphyrin to iron to form heme and reduces heme synthesis, the low blood lead concentration also leads to a lower degree of hematocrit decline, and the body stimulates the hematopoietic system to produce more erythrocytes through a feedback mechanism, leading to a compensatory increase in the number of erythrocytes to reduce the adverse effects caused by lower hematocrit (43), which results in an increase in the red blood cell count as shown in the assay index. Therefore, the positive correlation between low blood lead exposure and erythrocyte count shown in this study is not contradictory to blood Pb causing anemia. Bilirubin is a metabolite of hemoglobin, and lead may increase bilirubin levels by inducing hemoglobin degradation, while the study found that the risk of elevated DBIL and TBIL levels decreased with increasing blood lead concentration, which is consistent with the study of Ye M et al. (44), probably due to a decrease in bilirubin synthesis caused by the depletion of hemoglobin.
ALP is an enzyme widely distributed in human liver, bones, intestines, kidneys, placenta and other tissues and excreted by liver to bile, which can reflect the function of liver and bile (45). Ali Firoozichahak et al. showed that blood lead levels were positively correlated with ALP levels, which is consistent with my findings (46). On the one hand, lead causes disturbance and disruption of cell membranes (47). Phosphate is known as an intracellular anion and it increases serum ALP levels when cell membranes are damaged or disrupted (48). On the other hand, bones contain large amounts of ALP. Lead replaces bone calcium, leading to structural damage to the bones, thus causing an increase in serum ALP levels (49).
Park et al. (25) found that blood lead levels were positively correlated with total cholesterol levels, which is consistent with the findings of the study, and it may be that elevated blood lead levels induce lipid peroxidation (50), which increases cholesterol through lipid peroxidation. PDW indicates the size distribution of platelets produced by megakaryocytes and is an important marker of platelet activation. Kooshki et al. (51) found a positive correlation between lead exposure and platelet distribution width, which is consistent with the results of the study, suggesting that lead may cause inflammatory responses and altered platelet morphology in the body.
In conclusion, this study found that there is a certain correlation between blood lead concentration and blood routine hematological and biochemical indexes in permanent residents, suggesting that low blood lead concentration may be related to the number of red blood cells, platelet morphology, as well as liver functions. The mechanism of its effect still needs to be studied in depth, and the threshold value of blood lead concentration that has a damaging effect on the hematological system and liver function needs to be further determined. In this study, the effect of low blood lead concentration on routine hematological and biochemical indexes of permanent residents was found, which provides a scientific basis for early identification, prevention, and control of potential health damage from lead and reduction of its health risk. However, our study is a prospective study, which can only provide clues to investigate the association between blood lead and routine blood and biochemical indicators, but cannot determine the causal relationship between them. Therefore, we need to conduct further prospective studies to investigate the causal relationship between blood lead and routine blood and biochemical indicators. In addition, since blood lead is an important indicator of recent lead exposure, but lead tends to accumulate in the body over a long period of time, our future studies could further measure lead in urine and bone, and explore the effects of lead exposure in urine and bone on the health of the population.
The original contributions presented in the study are included in the article/supplementary materials, further inquiries can be directed to the corresponding author.
The studies involving humans were approved by the Institute of Environmental and Health-Related Product Safety, Chinese Center for Disease Control and Prevention. The studies were conducted in accordance with the local legislation and institutional requirements. Written informed consent for participation in this study was provided by the participants’ legal guardians/next of kin.
WH: Conceptualization, Data curation, Investigation, Methodology, Writing – original draft. JF: Conceptualization, Formal analysis, Validation, Writing – review & editing. RF: Writing – review & editing. XS: Project administration, Supervision, Writing – review & editing. SH: Data curation, Investigation, Writing – review & editing. YW: Investigation, Supervision, Writing – review & editing. KL: Investigation, Methodology, Writing – review & editing. HW: Methodology, Validation, Writing – review & editing.
The author(s) declare financial support was received for the research, authorship, and/or publication of this article. This research work was funded by the Science and Technology Plan of Jiangxi Health Commission (20204847).
The authors gratefully acknowledge all the participants in this study. Sincerely thanks to the staff of the in Duchang County CDC, Jizhou District CDC, Jinxian County CDC, Lushan City CDC, and Qingshanhu District CDC.
The authors declare that the research was conducted in the absence of any commercial or financial relationships that could be construed as a potential conflict of interest.
All claims expressed in this article are solely those of the authors and do not necessarily represent those of their affiliated organizations, or those of the publisher, the editors and the reviewers. Any product that may be evaluated in this article, or claim that may be made by its manufacturer, is not guaranteed or endorsed by the publisher.
1. Balali-Mood, M, Naseri, K, Tahergorabi, Z, Khazdair, MR, and Sadeghi, M. Toxic mechanisms of five heavy metals: mercury, Lead, chromium, cadmium, and arsenic. Front Pharmacol. (2021) 12:643972. doi: 10.3389/fphar.2021.643972
2. Li, J, Wang, Y-m, Hu, L-l, and Gu, Y. Investigation and health risk assessment of lead and cadmium pollution in food in Jiangxi Province. Modern Prevent Med. (2023) 50:446–50. doi: 10.20043/j.cnki.MPM.202209179
3. Li, W, Yang, Z, Guo, L, Tang, M, Yuan, G, and Liu, C. Geochemical characteristic and fluxes of heavy metals in water system of the Poyang Lake. Geoscience. (2014) 28:512–22+36. doi: 10.3969/j.issn.1000-8527.2014.03.007
4. Yu, Y, Li, Q, Wang, H, Wang, B, Lu, Q, Yan, Z, et al. Exposure risk of young population to lead: a case study in Le'an River Basin in Jiangxi Province. China Environ Pollut. (2016) 209:140–6. doi: 10.1016/j.envpol.2015.11.017
5. Xia, Z . Response analysis of diatom markers under heavy metal pollution in the waters of Le'an. River: Nanchang Engineering University (2018).
6. Li, F . Pollution characteristics and risk assessment of heavy metals in sediments of Ganjiang. River: Jiangxi University of Science and Technology (2020).
7. Tang, M . Study on the influence of urbanization process on the ecological environment of Poyang Lake. Waters: Shanghai Normal University (2019).
8. Shi, H, Wang, P, Zheng, J, Xiao, R, Deng, Y, and Zhuang, C. Spatial distribution of soil heavy metals and regional control strategies in China at province level. Environm Sci. (2023) 44:4706–16. doi: 10.13227/j.hjkx.202208160
9. Chen, C, Ni, S, He, B, and Zhang, C. Heavy metals contamination of soils of in DEXING mine Jiangxi province China. Earth Environ. (2007) 35:134–41. doi: 10.3969/j.issn.1672-9250.2007.02.007
10. Wang, F, Xu, F, Huang, Y, Hu, Y, Wang, X, Qiao, M, et al. Ecological risk assessment of heavy metals in surrounding soils of a copper smelting plant in Jiangxi Province. Environ Chem. (2014) 33:1066–74. doi: 10.7524/j.issn.0254-6108.2014.07.004
11. Wang, M, Zhang, Y, Zhou, W, Xiong, Y, Zhang, X, and Guo, B. Lead isotope signatures and source identification of heavy metals in vegetable soils irrigated with swine wastewater of Jiangxi Province, China. Bull Environ Contam Toxicol. (2024) 112:69. doi: 10.1007/s00128-024-03900-2
12. Zhang, Y, Feng, N, Liu, Y, Xu, Z, Zhang, Y, and Wang, Q. Speciation analysis and risk assessment of heavy metals in the soil of a Lead-zinc mining area. Multipurpose Utilization Min Resour. (2023) 199–204+10. doi: 10.3969/j.issn.1000-6532.2023.03.033
13. Wang, Z . The atmospheric Lead emission transfer and environmental inequality driven by the interprovincial trade in China, vol. 797. Lanzhou: Lanzhou University (2022). 149113 p.
14. Yu, A, and Li, Y. Analysis of blood Lead results in temporary workers who exposed to Lead of Jiangxi Enterprise. Jiangxi Science. (2012) 30:762–763+814. doi: 10.3969/j.issn.1001-3679.2012.06.015
15. Jiang, X, and Liu, K. Survey on the health condition of Lead exposure Workers in Nanchang Railway Enterprises. Railway Labor Safety Health Environ Protect. (2002) 29:288–9. doi: 10.3969/j.issn.2095-1671.2002.06.035
16. Yang, R. (2018) Jiangxi Industrial Park Lead pollution paroxysm. Financial News Weekly September 2; Sect. Environment and Technology.
17. Chen, M, Li, F, Hu, L, Yang, T, Yang, Q, Tao, M, et al. Heavy metal pollution in topsoil and vegetables in the typical mining area near Gannan, Jiangxi Province, China. Environ Eng Sci. (2019) 36:1307–14. doi: 10.1089/ees.2019.0013
18. Qiao, Z, Li, C, Zhou, Z, Yan, P, Wei, T, Hua, J, et al. Advances in the study of lead toxicity hazards and its therapeutic drug applications. J Toxicol. (2020) 34:416–20. doi: 10.16421/j.cnki.1002-3127.2020.05.016
19. Xin, P, and Jin, Y. Progress in the study of toxic effects and mechanism of action of lead. J Environ Hyg. (2008) 35:70–4.
20. Yu, YL, Yang, WY, Hara, A, Asayama, K, Roels, HA, Nawrot, TS, et al. Public and occupational health risks related to lead exposure updated according to present-day blood lead levels. Hypertens Res. (2023) 46:395–407. doi: 10.1038/s41440-022-01069-x
21. Ravipati, ES, Mahajan, NN, Sharma, S, Hatware, KV, and Patil, K. The toxicological effects of lead and its analytical trends: an update from 2000 to 2018. Crit Rev Anal Chem. (2021) 51:87–102. doi: 10.1080/10408347.2019.1678381
22. Chen, Y, Xu, X, Zeng, Z, Lin, X, Qin, Q, and Huo, X. Blood lead and cadmium levels associated with hematological and hepatic functions in patients from an e-waste-polluted area. Chemosphere. (2019) 220:531–8. doi: 10.1016/j.chemosphere.2018.12.129
23. Haider, MJ, and Qureshi, N. Studies on battery repair and recycling workers occupationally exposed to lead in Karachi. Rocz Panstw Zakl Hig. (2013) 64:37–42.
24. Chwalba, A, Maksym, B, Dobrakowski, M, Kasperczyk, S, Pawlas, N, Birkner, E, et al. The effect of occupational chronic lead exposure on the complete blood count and the levels of selected hematopoietic cytokines. Toxicol Appl Pharmacol. (2018) 355:174–9. doi: 10.1016/j.taap.2018.05.034
25. Park, Y, and Han, J. Blood Lead levels and cardiovascular disease risk: results from the Korean National Health and nutrition examination survey. Int J Environ Res Public Health. (2021) 18:18. doi: 10.3390/ijerph181910315
26. Yan, J, Zhang, H, Niu, J, Luo, B, Wang, H, Tian, M, et al. Effects of lead and cadmium co-exposure on liver function in residents near a mining and smelting area in northwestern China. Environ Geochem Health. (2022) 44:4173–89. doi: 10.1007/s10653-021-01177-6
27. PP, S, Rajkumar, J, and Karthik, C. Hepatotoxic effect of lead and hepatoprotective effect of Hydrilla verticillata on hepatic transcriptional and physiological response in edible fish Labeo rohita. Drug Chem Toxicol. (2022) 45:1276–83. doi: 10.1080/01480545.2020.1815762
28. Cao, Z, Qu, Y, Zhao, F, Liu, L, Song, S, Liu, Y, et al. Sampling methods and errors appearing in the China National Human Biomonitoring Program. Chinese J Epidemiol. (2018) 39:1642–7. doi: 10.3760/cma.j.issn.0254-6450.2018.12.020
30. China NHaFPCotPsRo . (2018). Screening for overweight and obesity among school-age children and adolescents. WS/T 586—2018.
31. China NHCotPsRo . (2014). Screening standard for malnutrition of school-age children and adolescents. WS/T456—2014.
33. Group BQASD . (1996). Guidelines for quality assurance of biological monitoring: GB/T 16126-1995.
34. Qu, Y . Monitoring and analysis of nine elements in some areas of Jilin Province. Changchun: Jilin University (2019).
35. Cao, Z, Lin, S, Zhao, F, Lv, Y, Qu, Y, Hu, X, et al. Cohort profile: China National Human Biomonitoring (CNHBM)-a nationally representative, prospective cohort in Chinese population. Environ Int. (2021) 146:106252. doi: 10.1016/j.envint.2020.106252
36. Tsoi, MF, Cheung, CL, Cheung, TT, and Cheung, BM. Continual decrease in blood Lead level in Americans: United States National Health Nutrition and examination survey 1999-2014. Am J Med. (2016) 129:1213–8. doi: 10.1016/j.amjmed.2016.05.042
37. Eom, SY, Lee, YS, Lee, SG, Seo, MN, Choi, BS, Kim, YD, et al. Lead, mercury, and cadmium exposure in the Korean general population. J Korean Med Sci. (2018) 33:e9. doi: 10.3346/jkms.2018.33.e9
38. Li, H, Lu, X, and Jiang, L. Serum levels of heavy metals among residents in five counties (districts) of Guizhou Province. Chinese Prevent Med. (2022) 23:220–3. doi: 10.16506/j.1009-6639.2022.03.011
39. Pinto, E, Cruz, M, Ramos, P, Santos, A, and Almeida, A. Metals transfer from tobacco to cigarette smoke: evidences in smokers' lung tissue. J Hazard Mater. (2017) 325:31–5. doi: 10.1016/j.jhazmat.2016.11.069
40. Gambelunghe, A, Sallsten, G, Borné, Y, Forsgard, N, Hedblad, B, Nilsson, P, et al. Low-level exposure to lead, blood pressure, and hypertension in a population-based cohort. Environ Res. (2016) 149:157–63. doi: 10.1016/j.envres.2016.05.015
41. Hara, A, Thijs, L, Asayama, K, Gu, YM, Jacobs, L, Zhang, ZY, et al. Blood pressure in relation to environmental lead exposure in the national health and nutrition examination survey 2003 to 2010. Hypertension. (2015) 65:62–9. doi: 10.1161/hypertensionaha.114.04023
42. Huang, Z . Association between blood Lead level with high blood pressure in US (NHANES 1999-2018). Front Public Health. (2022) 10:836357. doi: 10.3389/fpubh.2022.836357
43. Kuang, W, Chen, Z, Shi, K, Sun, H, Li, H, Huang, L, et al. Adverse health effects of lead exposure on physical growth, erythrocyte parameters and school performances for school-aged children in eastern China. Environ Int. (2020) 145:106130. doi: 10.1016/j.envint.2020.106130
44. Ye, M, Zhang, T, Chen, Z, Chen, S, and Chen, H. Decreased serum bilirubin levels in children with lead poisoning. J Int Med Res. (2021) 49:300060521990248. doi: 10.1177/0300060521990248
45. Matović, V, Buha, A, Ðukić-Ćosić, D, and Bulat, Z. Insight into the oxidative stress induced by lead and/or cadmium in blood, liver and kidneys. Food Chem Toxicol. (2015) 78:130–40. doi: 10.1016/j.fct.2015.02.011
46. Firoozichahak, A, Rahimnejad, S, Rahmani, A, Parvizimehr, A, Aghaei, A, and Rahimpoor, R. Effect of occupational exposure to lead on serum levels of lipid profile and liver enzymes: an occupational cohort study. Toxicol Rep. (2022) 9:269–75. doi: 10.1016/j.toxrep.2022.02.009
47. Choie, DD, and Richter, GW. Cell proliferation in rat kidney induced by lead acetate and effects of uninephrectomy on the proliferation. Am J Pathol. (1972) 66:265–75.
48. Dioka, CE, Orisakwe, OE, Adeniyi, FA, and Meludu, SC. Liver and renal function tests in artisans occupationally exposed to lead in mechanic village in Nnewi, Nigeria. Int J Environ Res Public Health. (2004) 1:21–5. doi: 10.3390/ijerph2004010021
49. Can, S, Bağci, C, Ozaslan, M, Bozkurt, A, Cengiz, B, Cakmak, EA, et al. Occupational lead exposure effect on liver functions and biochemical parameters. Acta Physiol Hung. (2008) 95:395–403. doi: 10.1556/APhysiol.95.2008.4.6
50. Kshirsagar, MS, Patil, JA, and Patil, A. Increased blood lead level induces oxidative stress and alters the antioxidant status of spray painters. J Basic Clin Physiol Pharmacol. (2020) 31:31. doi: 10.1515/jbcpp-2018-0229
Keywords: blood lead levels, hematological indices, biochemical indices, heavy metals, biomonitoring
Citation: He W, Fu J, Fu R, Song X, Huang S, Wang Y, Lu K and Wu H (2024) Internal blood lead exposure levels in permanent residents of Jiangxi Province and its effects on routine hematological and biochemical indices. Front. Public Health. 12:1357588. doi: 10.3389/fpubh.2024.1357588
Edited by:
Azubuike Chukwuka, National Environmental Standards and Regulations Enforcement Agency (NESREA), NigeriaReviewed by:
Khaled Salama, Imam Abdulrahman Bin Faisal University, Saudi ArabiaCopyright © 2024 He, Fu, Fu, Song, Huang, Wang, Lu and Wu. This is an open-access article distributed under the terms of the Creative Commons Attribution License (CC BY). The use, distribution or reproduction in other forums is permitted, provided the original author(s) and the copyright owner(s) are credited and that the original publication in this journal is cited, in accordance with accepted academic practice. No use, distribution or reproduction is permitted which does not comply with these terms.
*Correspondence: Junjie Fu, MTMyNjYyMTA0MEBxcS5jb20=
Disclaimer: All claims expressed in this article are solely those of the authors and do not necessarily represent those of their affiliated organizations, or those of the publisher, the editors and the reviewers. Any product that may be evaluated in this article or claim that may be made by its manufacturer is not guaranteed or endorsed by the publisher.
Research integrity at Frontiers
Learn more about the work of our research integrity team to safeguard the quality of each article we publish.