 Tegene Atamenta Kitaw
 Biruk Beletew Abate
 Befkad Derese Tilahun
 Ribka Nigatu Haile
94% of researchers rate our articles as excellent or good
Learn more about the work of our research integrity team to safeguard the quality of each article we publish.
Find out more
ORIGINAL RESEARCH article
Front. Public Health, 19 June 2024
Sec. Public Health and Nutrition
Volume 12 - 2024 | https://doi.org/10.3389/fpubh.2024.1348755
Background: Despite prior progress and the proven benefits of optimal feeding practices, improving child dietary intake in developing countries like Ethiopia remains challenging. In Ethiopia, over 89% of children fail to meet the minimum acceptable diet. Understanding the geographical disparity and determinants of minimum acceptable diet can enhance child feeding practices, promoting optimal child growth.
Methods: Spatial and multiscale geographically weighted regression analysis was conducted among 1,427 weighted sample children aged 6–23 months. ArcGIS Pro and SatScan version 9.6 were used to map the visual presentation of geographical distribution failed to achieve the minimum acceptable diet. A multiscale geographically weighted regression analysis was done to identify significant determinants of level of minimum acceptable diet. The statistical significance was declared at P-value <0.05.
Results: Overall, 89.56% (95CI: 87.85–91.10%) of children aged 6–23 months failed to achieve the recommended minimum acceptable diet. Significant spatial clustering was detected in the Somali, Afar regions, and northwestern Ethiopia. Children living in primary clusters were 3.6 times more likely to be unable to achieve the minimum acceptable diet (RR = 3.61, LLR =13.49, p < 0.001). Mother’s with no formal education (Mean = 0.043, p-value = 0.000), family size above five (Mean = 0.076, p-value = 0.005), No media access (Mean = 0.059, p-value = 0.030), home delivery (Mean = 0.078, p-value = 0.002), and no postnatal checkup (Mean = 0.131, p-value = 0.000) were found to be spatially significant determinants of Inadequate minimum acceptable diet.
Conclusion: Level of minimum acceptable diet among children in Ethiopia varies geographically. Therefore, to improve child feeding practices in Ethiopia, it is highly recommended to deploy additional resources to high-need areas and implement programs that enhance women’s education, maternal healthcare access, family planning, and media engagement.
Sufficient nutrition is predominant for optimal physical and cognitive development of the child. Children’s morbidity and mortality associated with undernutrition are high (1). Minimum acceptable diet (MAD) is a crucial indicator for evaluating infant and young child feeding (IYCF) practices among children aged 6 to 23 months. It encompasses two essential components: minimum dietary diversity (MDD) and minimum meal frequency (MMF) (2). MDD ensures that a child’s diet includes a variety of food groups from different nutritional categories, while MMF ensures that the child receives an adequate number of meals and snacks throughout the day (3).
Maintaining a MAD during infancy and early childhood is crucial for ensuring optimal growth and development (4). Failure to achieve MAD places young children at heightened risk of undernutrition, particularly stunting and micronutrient deficiencies. These nutritional inadequacies can lead to increased morbidity and mortality (5). Underscoring the critical importance of providing adequate and balanced diets during this critical period of life.
Undernutrition, a state of inadequate nutrient intake, is a significant contributor to child mortality, claiming the lives of nearly half of all children under the age of five (6). A substantial proportion of childhood fatalities, amounting to almost one-third, occur in the African Region and are directly attributable to malnutrition (7).
In Ethiopia, a significant proportion of child mortality, amounting to 28%, is linked to inadequate nutrition (8). Only 4% of children between the ages of 6 and 23 months receive a diverse diet encompassing four or more food groups. Moreover, the frequency of feeding sessions is also suboptimal, with only 45% of children in this age group being fed at least thrice daily (9). This alarming situation is reflected in the low prevalence of optimal feeding practices among young children.
Previous research identified various factors influencing the likelihood of children not achieving a minimum acceptable diet (MAD). These factors include residential location (10), maternal age (11), maternal education level (12), socioeconomic status (13), exposure to media messaging about healthy eating (14), maternal employment status (15), place of delivery (16), frequency of antenatal care attendance (17), and participation in postnatal care services (18).
The Sustainable Development Goals (SDGs) have targeted reducing newborn and under-five mortality by 2030, aiming for as low as 12 and 25 deaths per 1,000 live births, respectively (19). Achieving these targets hinges significantly on ensuring that children consume a minimum acceptable diet (MAD). In line with this global initiative, Ethiopia’s Ministry of Health has also adopted a comprehensive plan to address malnutrition and diet-related public health issues, recognizing their crucial role in reducing under-five mortality. The ministry’s strategy promotes MAD among children as a critical intervention for achieving this goal (20).
Despite the enormous progress made previously and the known health benefits of optimal feeding practices, increasing the number of children getting a minimum acceptable diet in developing countries like Ethiopia has become a significant challenge. Thus, recent data regarding minimum acceptable is crucial for public health practitioners and policymakers in supporting efforts toward strengthening child nutrition programs and ending all types of malnutrition in the late life of children.
Most studies on minimum acceptable diet (MAD) in Ethiopia are confined to specific districts or regions. Additionally, logistic regression is the predominant method employed to identify factors influencing MAD. Logistic regression might provide information in situations where there is no variation across the study area. However, in the field of public health, such assumptions are not always valid, particularly when it is known that variables vary across the study area (i.e., spatially non-stationary). In such cases, logistic regression becomes inadequate for providing suitable information. Thus, geographical weighted regression is better suited for addressing these challenges.
According to previous reports, approximately 89% of children in Ethiopia failed to meet MAD requirements (21). However, the geospatial distribution of MAD among children in Ethiopia remains poorly understood, hindering the development of geographically targeted interventions. Furthermore, data on hot and cold spot areas for MAD is scarce. To expedite progress toward improving child feeding practices and ending child malnutrition, understanding the geospatial distribution of MAD and its determinants among children is crucial. Thus, this study aims to better understand the spatial pattern of the level of minimum acceptable diet and its determinants among children aged 6–23 months in Ethiopia.
According to forecasts from trading economics and data from recent census figures, the total population of Ethiopia was 115.0 million by 2020 (22). The EDHS 2019 final report includes data at the country level from the nine regional states and two municipal administrations. The administrative levels were divided into zones, woreda, and so forth. A multilevel analysis was conducted among children between 6 to 23 months. The EDHS collects pertinent information mainly regarding maternity health care utilization, marriage and sexual behavior, child feeding practice, children and women’s dietary condition, and children’s and adult mortality. Data collection was carried out from March to June 2019 (23).
First, the project proposal was sent to the Demographic and Health Surveys (DHS) Program. After a detailed review process, the DHS program accepted the proposal and granted access with an approval letter to use the survey datasets. Data extraction was done to select children aged 6–23 months. The data extraction was conducted between August 3 and 30, 2023. All children aged 6–23 months were the source population, whereas all children aged 6–23 months in the selected enumeration area were the study population.
The EDHS 2019 sample was stratified and selected in two levels. Twenty-one sampling strata were produced after stratifying each region into urban and rural areas. Using probability proportion, 305 enumeration areas (93 from urban and 212 from rural) were selected in the first stage. Newly formed household listing was used in the second stage to choose a set number of thirty households per cluster with an equal probability of systematic selection. Sample allocation was done to verify that survey precision was equivalent across regions. Thirty-five enumeration areas were selected from the three largest regions. Twenty-five enumeration areas were selected from eight regions (including two city administrations). The complete sampling procedure is available in the EDHS 2019 final report (24). In the current study, a total of 1,427 weighted children aged 6–23 month were participated. The spotlight sampling technique for the present study is shown in Figure 1.

Figure 1. Schematic representation of the sampling procedures in the study of geospatial pattern of level of minimum acceptable diet and its determinants among children aged 6–23 months in Ethiopia, EDHS 2019 N.B EAs, enumeration areas.
The dependent variable is minimum acceptable diet. This study considered different independent variables to identify determinants of level of minimum acceptable diet (Table 1).
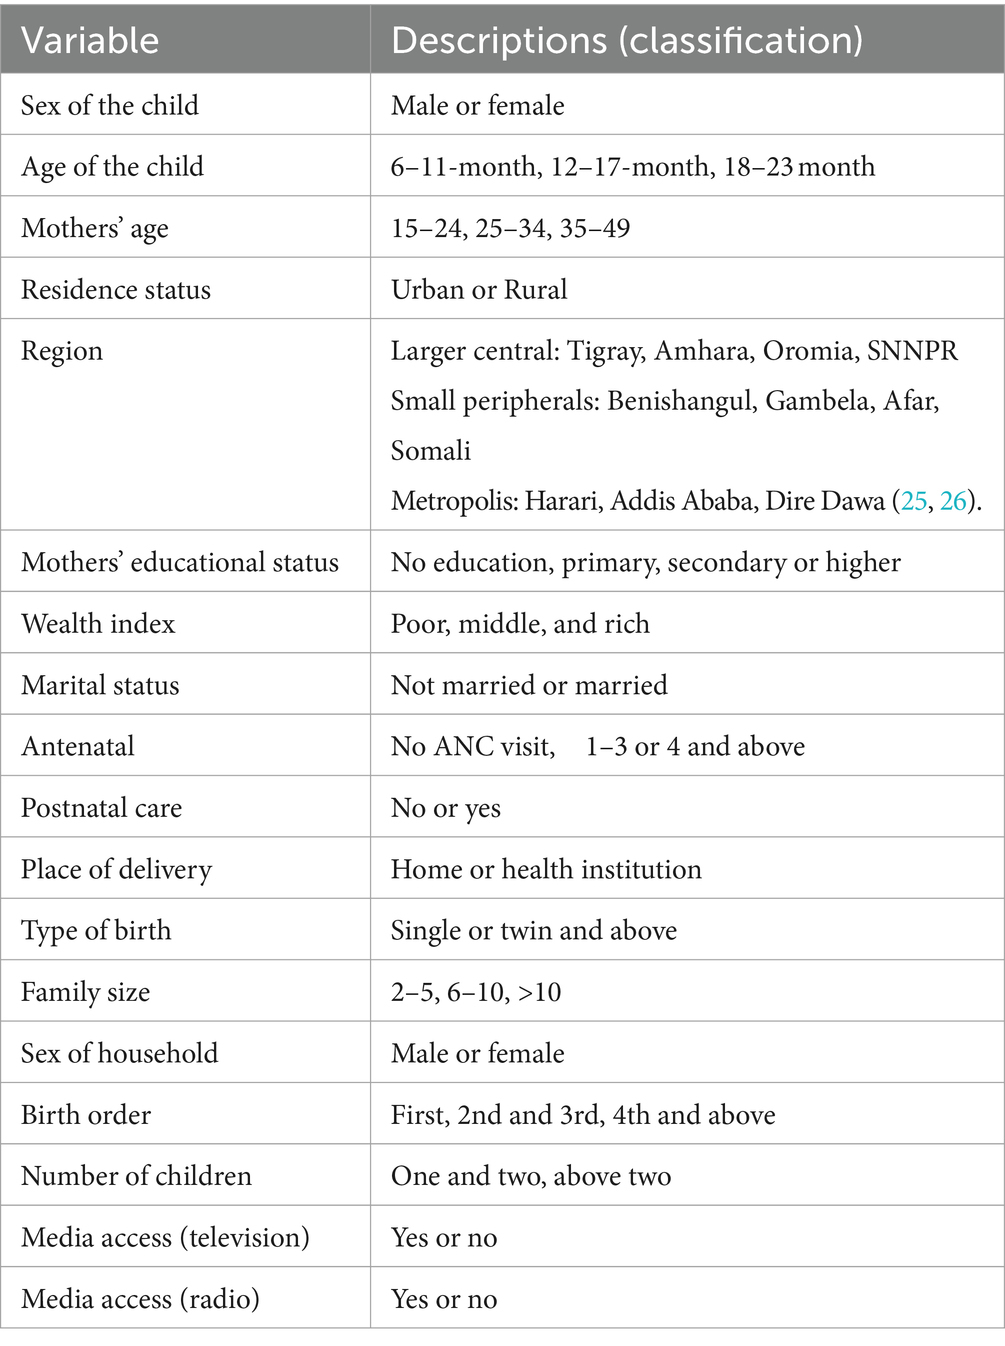
Table 1. List of independent variables for the assessment of geospatial pattern of level of minimum acceptable diet and its predictors among children in Ethiopia.
Inadequate minimum acceptable diet (MAD) is defined as the situation when a child is unable to meet the WHO minimum acceptable diet criteria. Minimum acceptable diet is defined as a composite of children fed with a minimum dietary diversity and a minimum meal frequency. Minimum dietary diversity: children age 6–23 months who received a minimum of five out of eight food groups during the previous day. Minimum meal frequency: For breastfed children receiving solid, semisolid, or soft food at least twice a day for infants age 6–8 months aged and at least three times a daily for children age 9–23 months. For non-breastfed children, age 6–23 months aged receiving solid, semisolid, or soft food or milk feeds at least four times a day (27).
Data were extracted from the EDHS 2019 individual record folder using STATA version 17. Sorting and listing were used to find any missing values. Descriptive statistics were calculated using frequency and percentage. Data were weighted, cleaned, edited, and recoded. STATA version 17 was used for non-spatial analysis. ArcGIS Pro and SatScan version 9.6 were used to map the level of minimum acceptable diet at regional and district levels.
Spatial autocorrelation with Global Moran’s I was computed to determine whether inadequate minimum acceptable diet among children is randomly distributed, clustered, or dispersed. Global Moran’s I value near “0” indicates inadequate minimum acceptable diet is randomly distributed, near “–1” shows dispersed, and close to “+1” indicates clustered. Spatial autocorrelation is declared at a statistically significant Moran’s I p-value less than 0.05.
Hot spot analysis was done using Getis-Ord Gi* Spatial Statistics to identify statistically significant spatial clusters of cold spots (low) and hot spots (high) of inadequate minimum acceptable diet. Clusters with high Gi* values are statistically significant hot spots, while clusters with low Gi* values are statistically significant cold spots. Ordinary kriging interpolation was computed to estimate the value of unsampled locations from sampled data points.
Ordinary least squares (OLS) regression was used to model the relationship between inadequate minimum acceptable diet and a set of independent variables, using data from a sample of 295 enumeration areas. The outcome variable for the regression model was the weighted inadequate minimum acceptable diet prevalence in each cluster. OLS regression assumes that the relationship between each explanatory variable and the outcome variable is the same throughout the study area (28). However, a constant relationship between the explanatory variables and the outcome variable may not always be valid. Thus, exploring further through geographically weighted regression (GWR) is crucial, which allows the coefficients to vary across the study area.
A newly emerging geographic regression model called MGWR was used to explore geographically varying relationships between inadequate minimum acceptable diet and explanatory variables. Unlike GWR, MGWR not only allows the coefficients to vary over space but also allows the scale to vary across different covariates. MGW considers distinct neighborhoods for each covariate to account for different spatial scales of the relationships between each explanatory variable and the outcome variable (29). MGWR is a powerful tool that can be used to model complex spatial relationships between variables. Variance inflation factor was calculated to check the exitances of multicollinearity between variables. A VIF above 4 indicates multicollinearity might exist (30, 31). Akaike information criterion (AIC) and adjusted R2 values were computed to select the appropriate model. The model with the lowest AICc and higher adjusted R2 was declared the best-fitted model (32). In all statistical analyses, the statistical significance was considered at p-value <0.05.
An analysis of 1,427 children aged 6–23 months was conducted to determine geospatial pattern and predictors of level of minimum acceptable diet in Ethiopia. Form 697(48.84%) children of Mothers’ with no education, the majority (46.95%) of children did not achieve the minimum acceptable diet. Regarding the wealth index, of 661 (46.32%) children in the poor household wealth category, only 23 (1.61%) get the minimum acceptable diet. Additionally, in households with three or more children, only 3.85% of children met the minimum acceptable diet (Table 2).
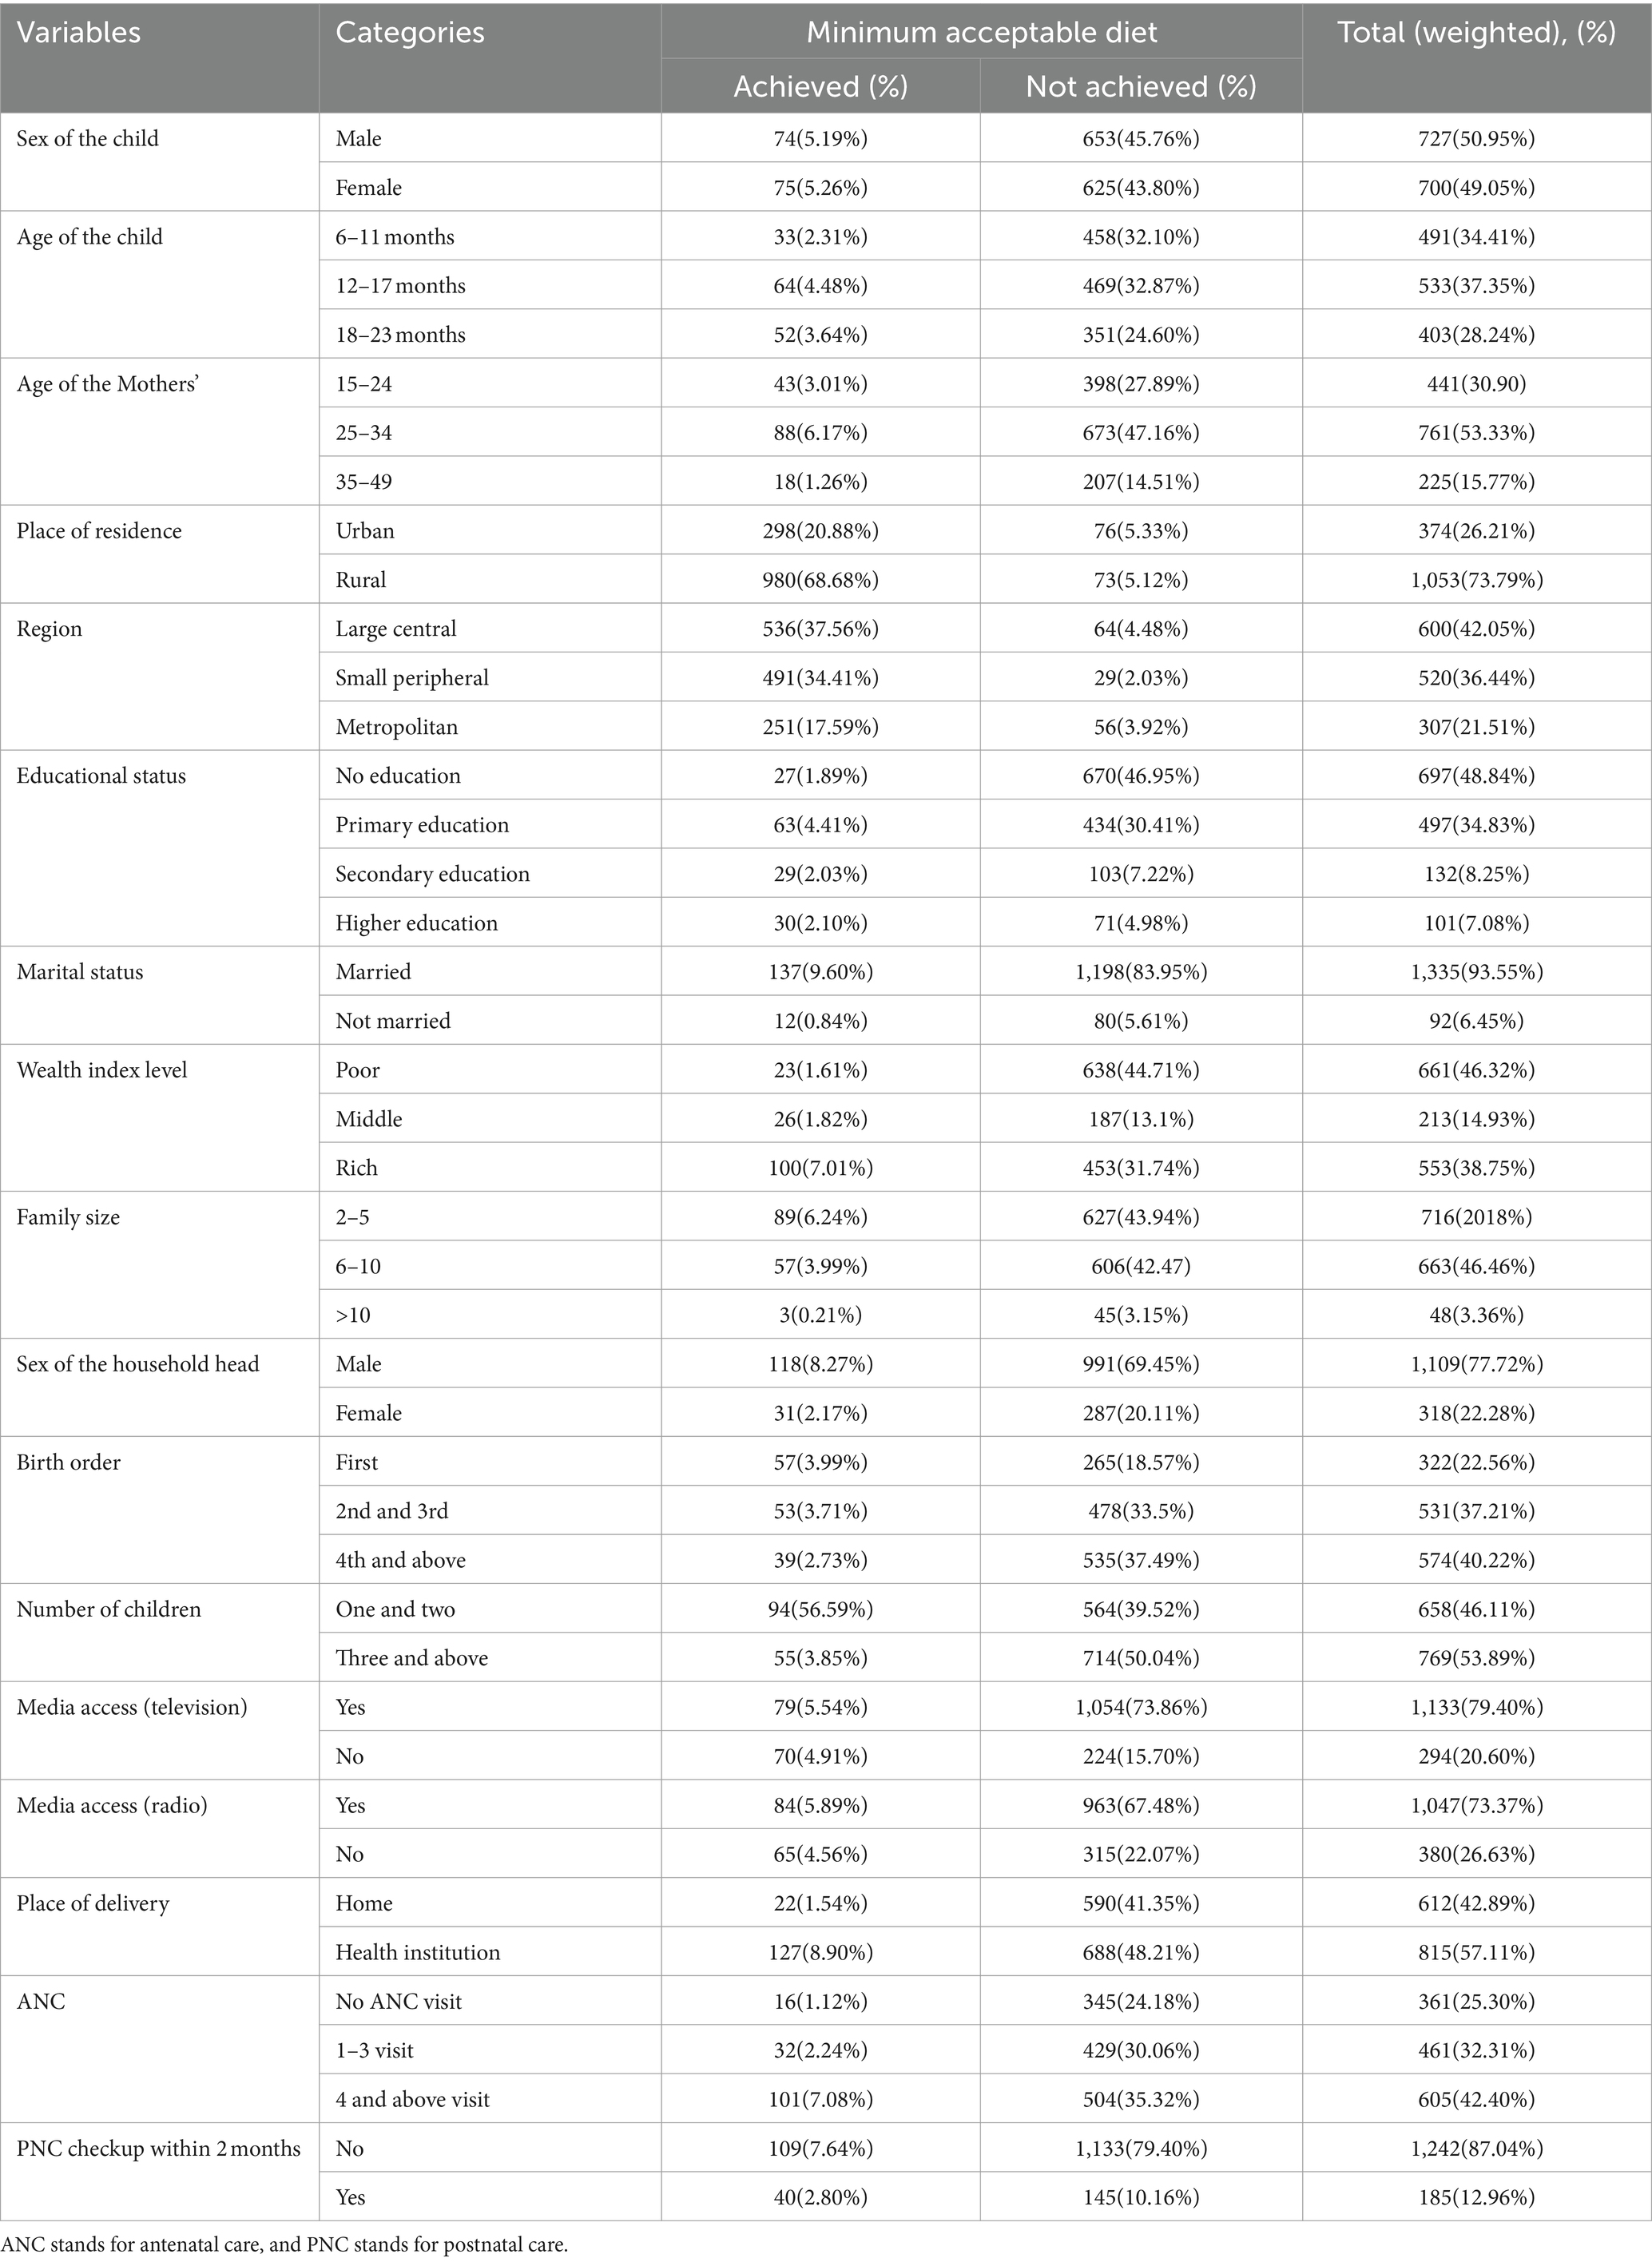
Table 2. Individual level characteristics of study participants EDHS 2019, (weighted n = 1,427).
In this study, the majority of the children (89.56%, 95CI, 87.85–91.10%) did not achieve the minimum acceptable diet according to the WHO criteria.
The spatial distribution of inadequate minimum acceptable diet among children aged 6–23 months in Ethiopia is clustered with Global Moran’s I value of 0.235, p-value <0.001, and Z-score of 6.58. Thus, a minimum acceptable diet has a spatial dependency. In addition, the likelihood of this clustered pattern because of random chance is less than 1% (Figure 2). The line graph of incremental autocorrelation shows the minimum and the maximum distance band. The minimum distance at the beginning was 155193.00 m (Z-score = 4.06, p-value <0.001), whereas the first maximum peak was 225028.86 m (Z-score = 5.98, p-value <0.001) (Figure 3).
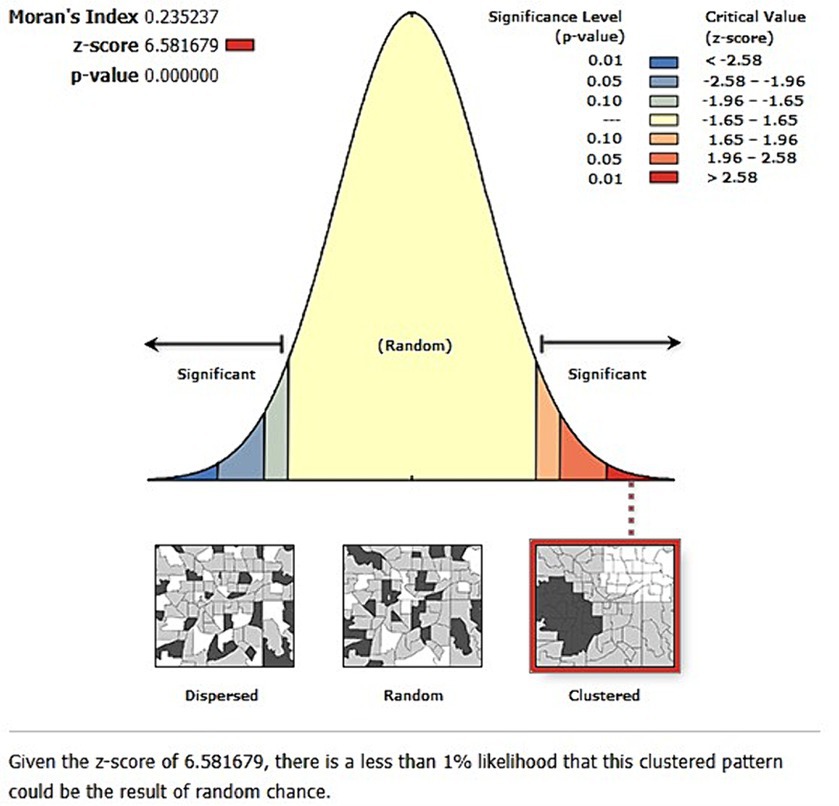
Figure 2. Spatial autocorrelation analysis of geospatial pattern of level of minimum acceptable diet among children in Ethiopia, EDHS 2019, (weighted n = 1,427).
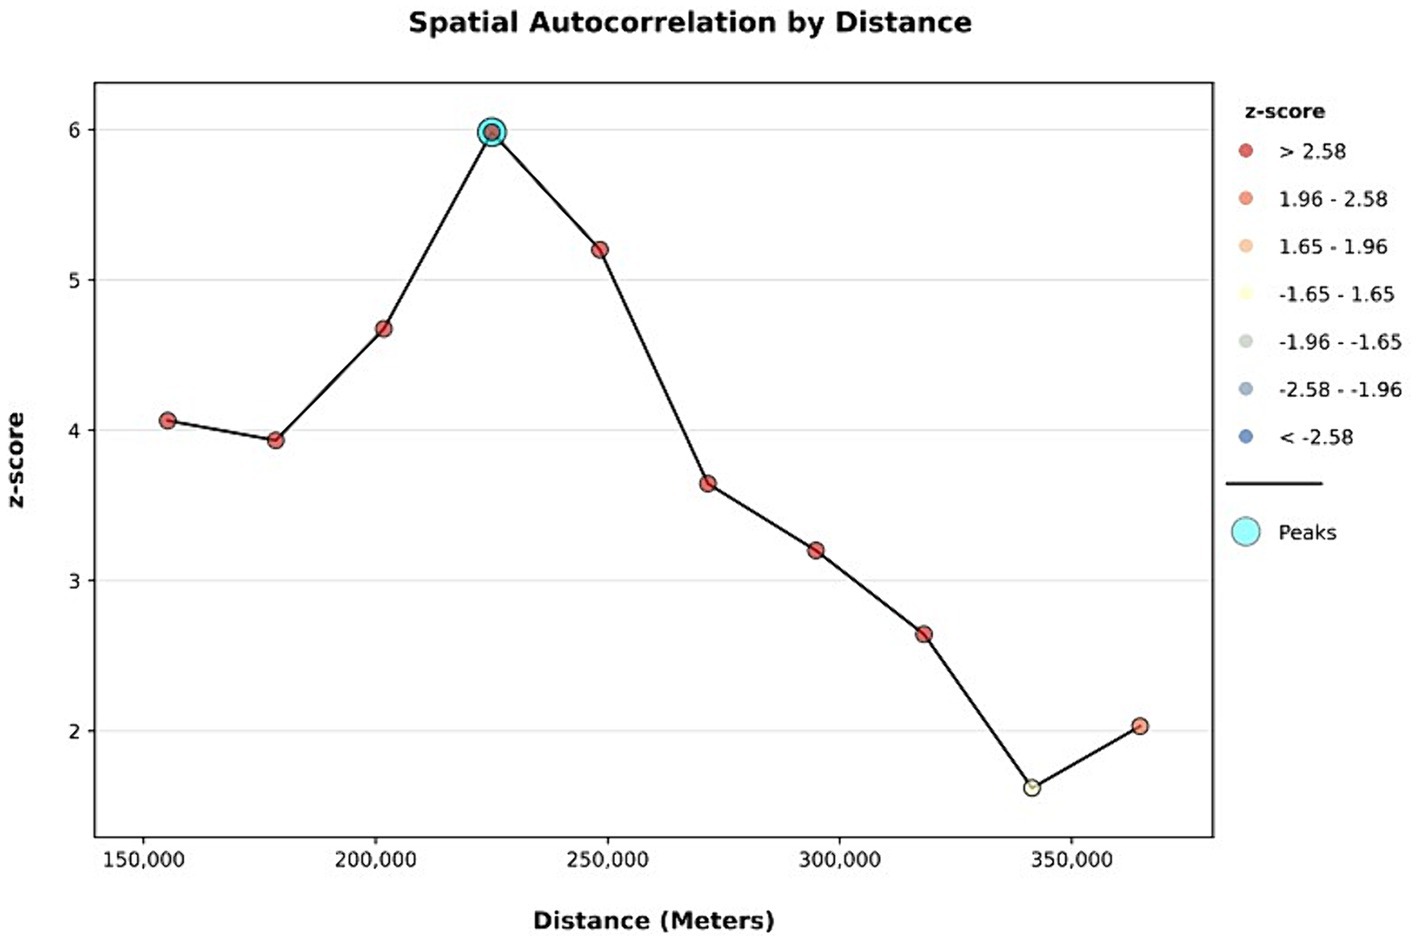
Figure 3. Incremental autocorrelation analysis of geospatial pattern of level of minimum acceptable diet among children in Ethiopia, EDHS 2019, (weighted n = 1,427).
Hotspot and cold spot analysis was computed to identify areas with a high and low prevalence of inadequate minimum acceptable diet. Thus, significant clustering of inadequate minimum acceptable diet is detected in Afar and Somali regions (Figure 4).
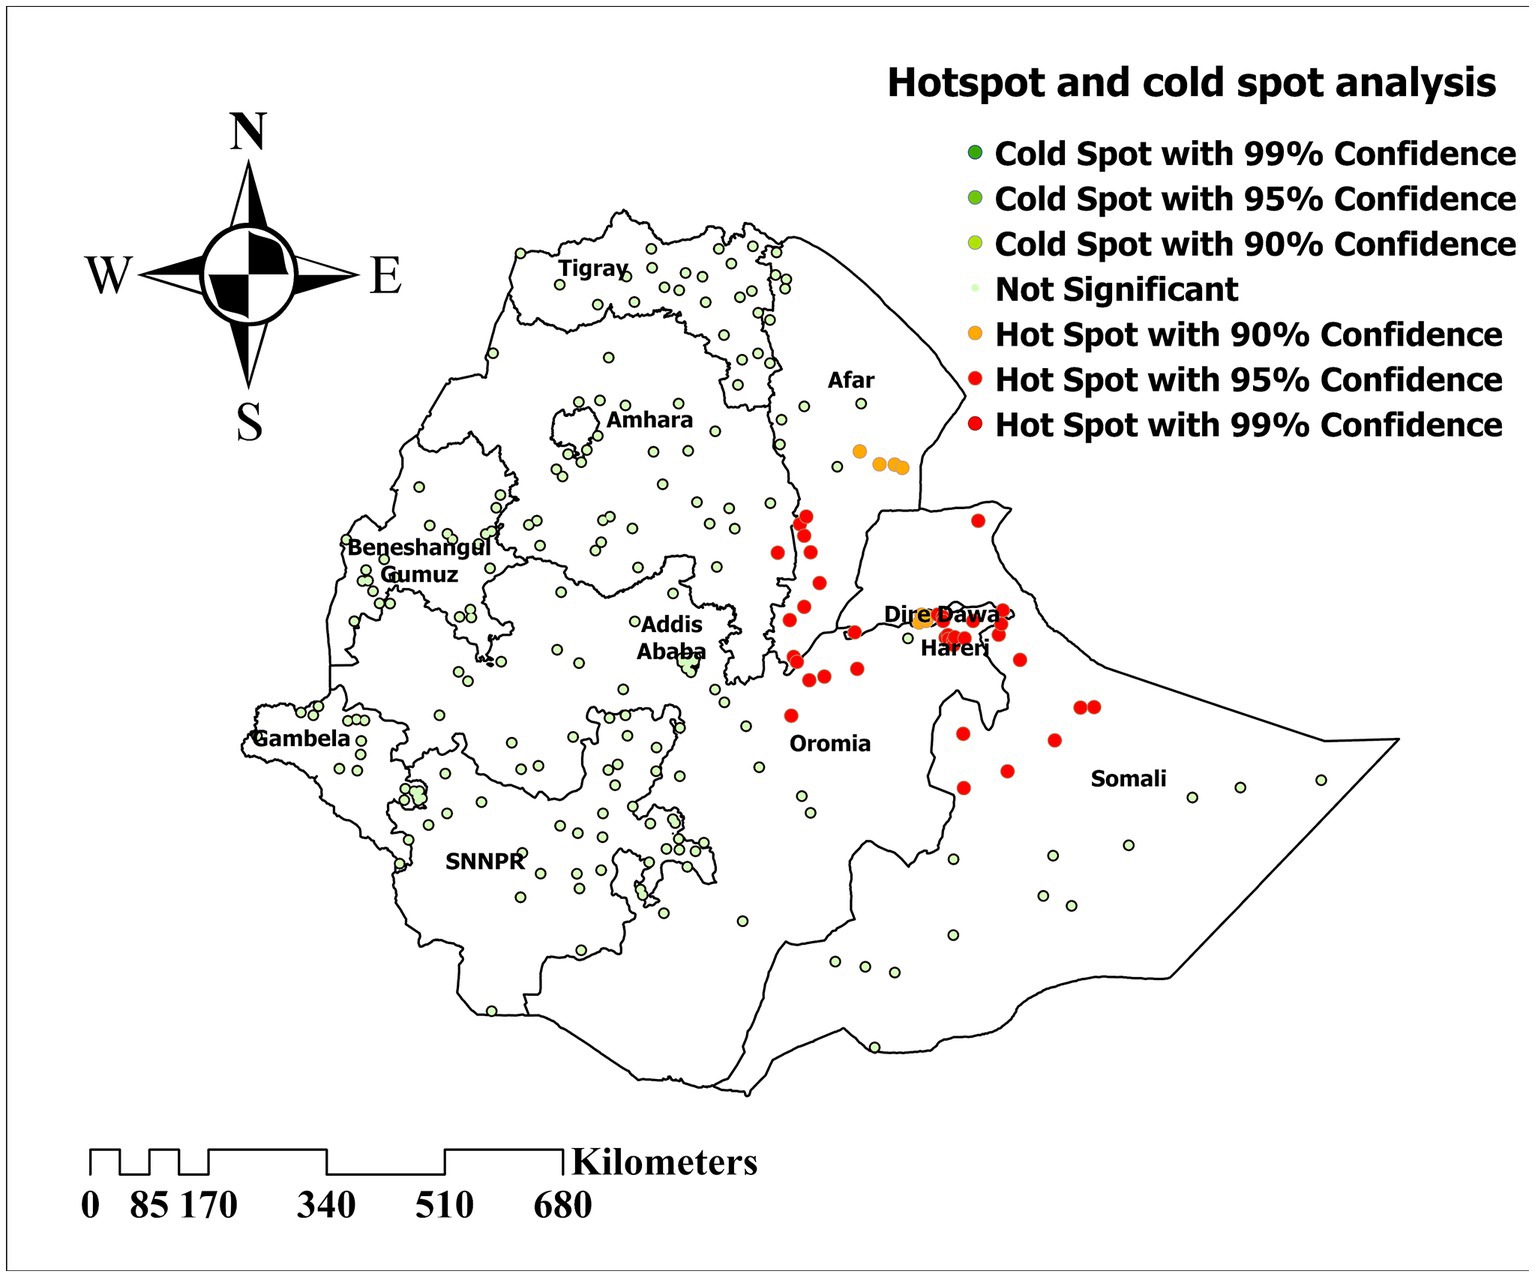
Figure 4. Hotspot and cold spot analysis of inadequate minimum acceptable diet among children in Ethiopia, EDHS 2019, (weighted n = 1,427).
Ordinary kriging interpolation was computed to predict the inadequate minimum acceptable diet distribution among children in Ethiopia. Thus, the highest predictive prevalence of inadequate minimum acceptable diet increased in the Somali, Afar, and Amhara regions. Meanwhile, low prediction was found in the remaining areas of Ethiopia (Figure 5).
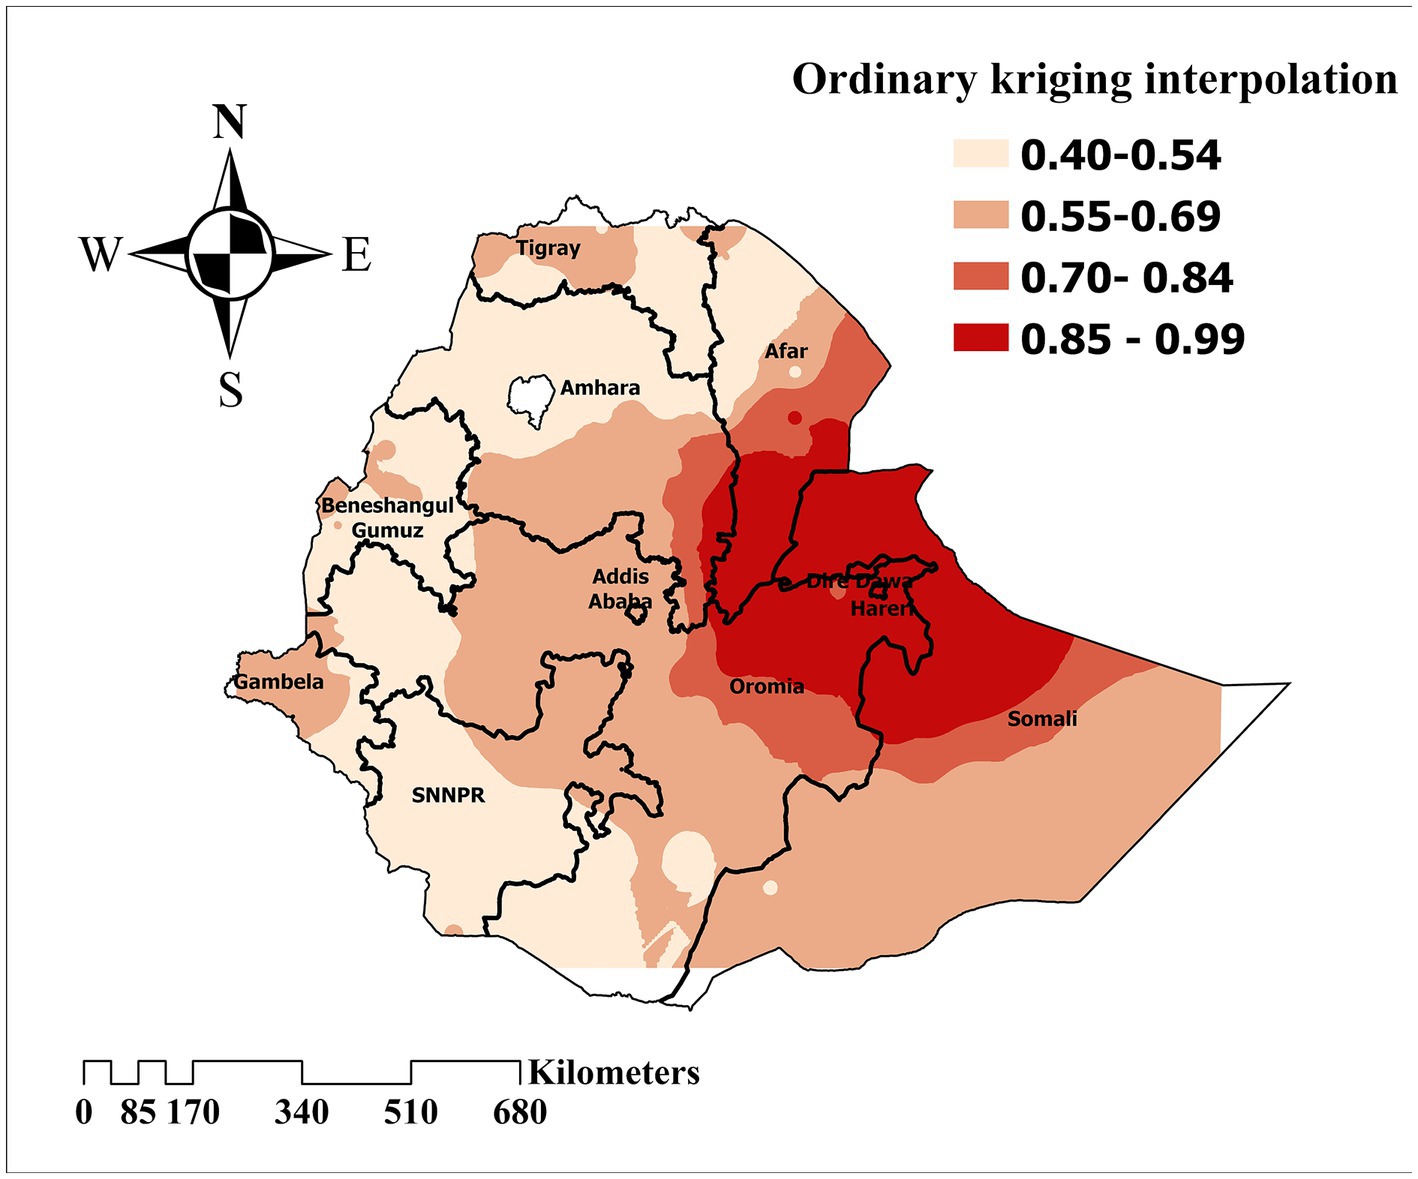
Figure 5. Ordinary kriging interpolation to predict the prevalence of inadequate minimum acceptable diet among children in Ethiopia, EDHS 2019, (weighted n = 1,427).
Purely spatial analysis using the Bernoulli model was done to identify clusters with high or low inadequate minimum acceptable diet rates. The primary significant sat scan was identified in Eastern Ethiopia (Somali) at 5.856584 N, 43.726016 E/geographic location (radius of 399.27 km) with a relative risk of 3.61 (p-value ≤ 0.001) and Log likelihood ratio (LLR) of 13.49. In that highly cluttered area, there was over three and a half times the risk of inadequate minimum acceptable diet. The prevalence of inadequate minimum acceptable diet was higher with the circle hole than the outside (Figure 6).
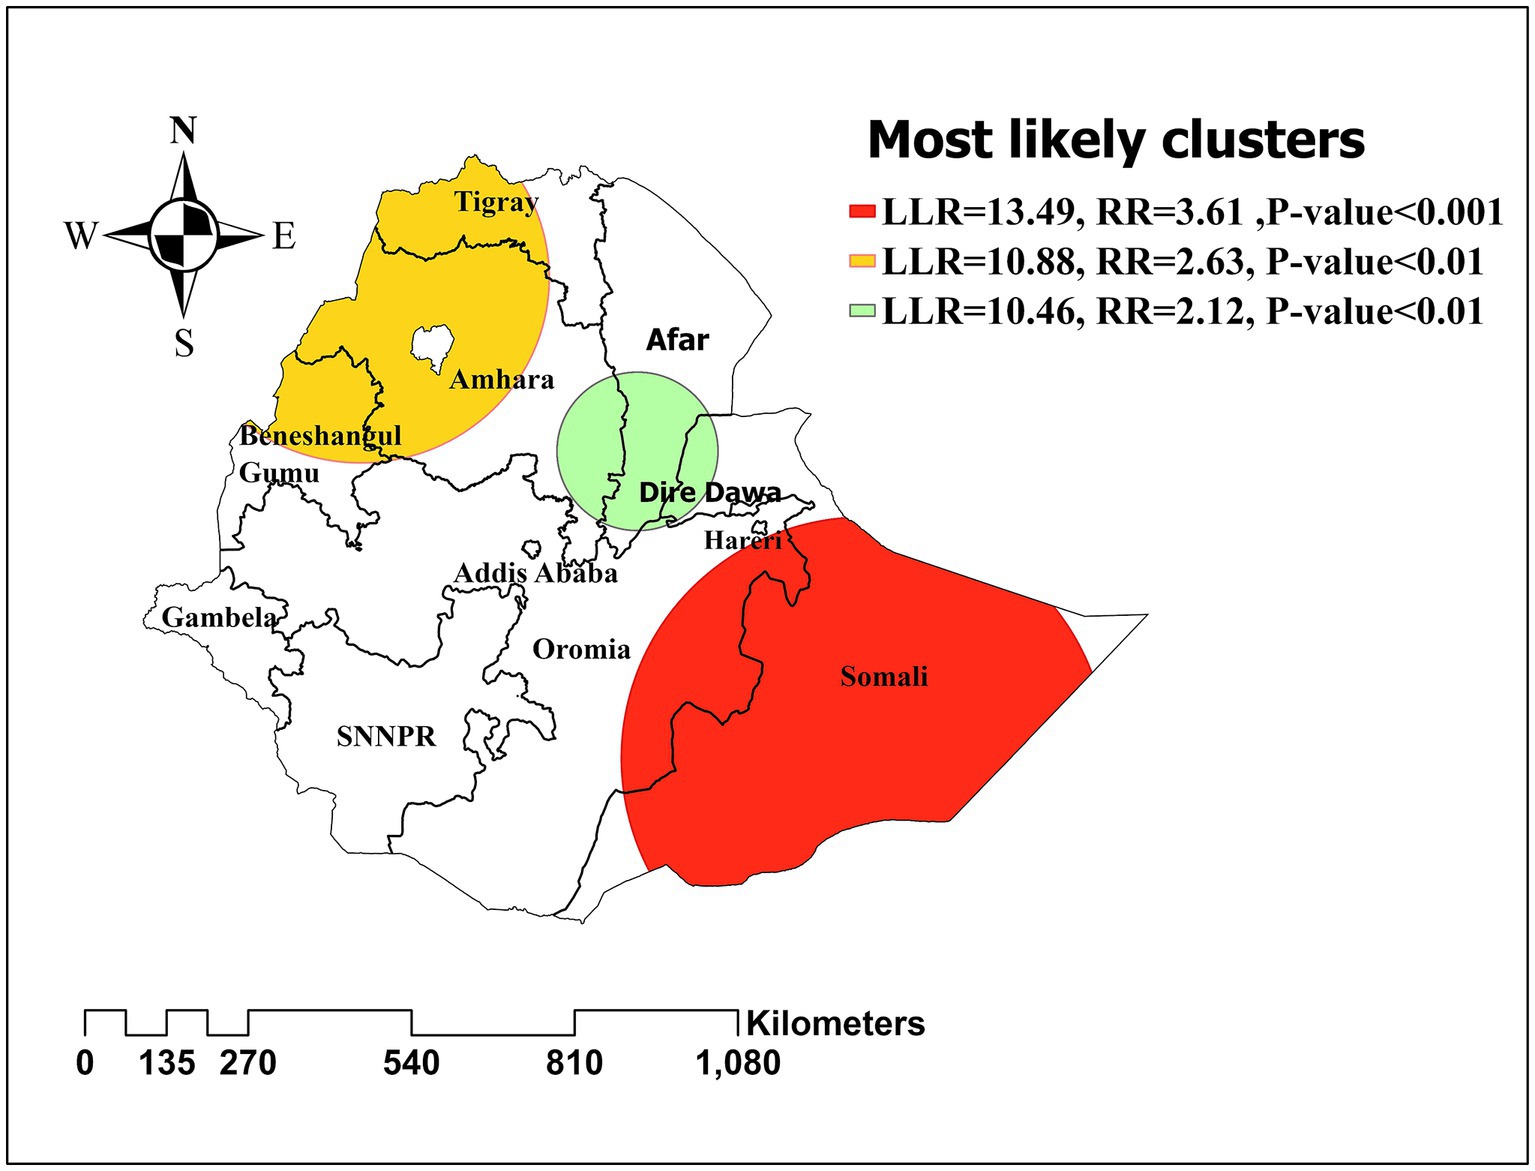
Figure 6. Spatial clustering of high and low rate of inadequate minimum acceptable diet among children in Ethiopia, EDHS 2019, (weighted n = 1,427).
An ordinary least squares model was computed to identify spatial predictors of inadequate minimum acceptable diet. Mothers’ with no formal education, family size above five, no media access, no ANC utilization, no PNC checkup after delivery, and poor wealth index were found to have relationships with inadequate minimum acceptable diet among children in Ethiopia. Multicollinearity was checked by computing the Variance inflation factor (VIF). The maximum and the minimum VIF were 3.609 and 2.161, respectively. Thus, there is no significant multicollinearity between explanatory variables. Joint F-Statistic and Joint Wald Statistic result (p-value <0.05) shows that the model is statistically significant.
On the other hand, the Jarque-Bera Statistic result (p-value >0.05) explained that the OLS is free from bias. Furthermore, Koenker’s (BP) Statistic was found to be statistically significant (p-value <0.05). Therefore, there is a possibility of heteroscedasticity and/or non-stationarity. Thus, the model is a good candidate for further multiscale geographically weighted regression (GWR) analysis (Table 3).
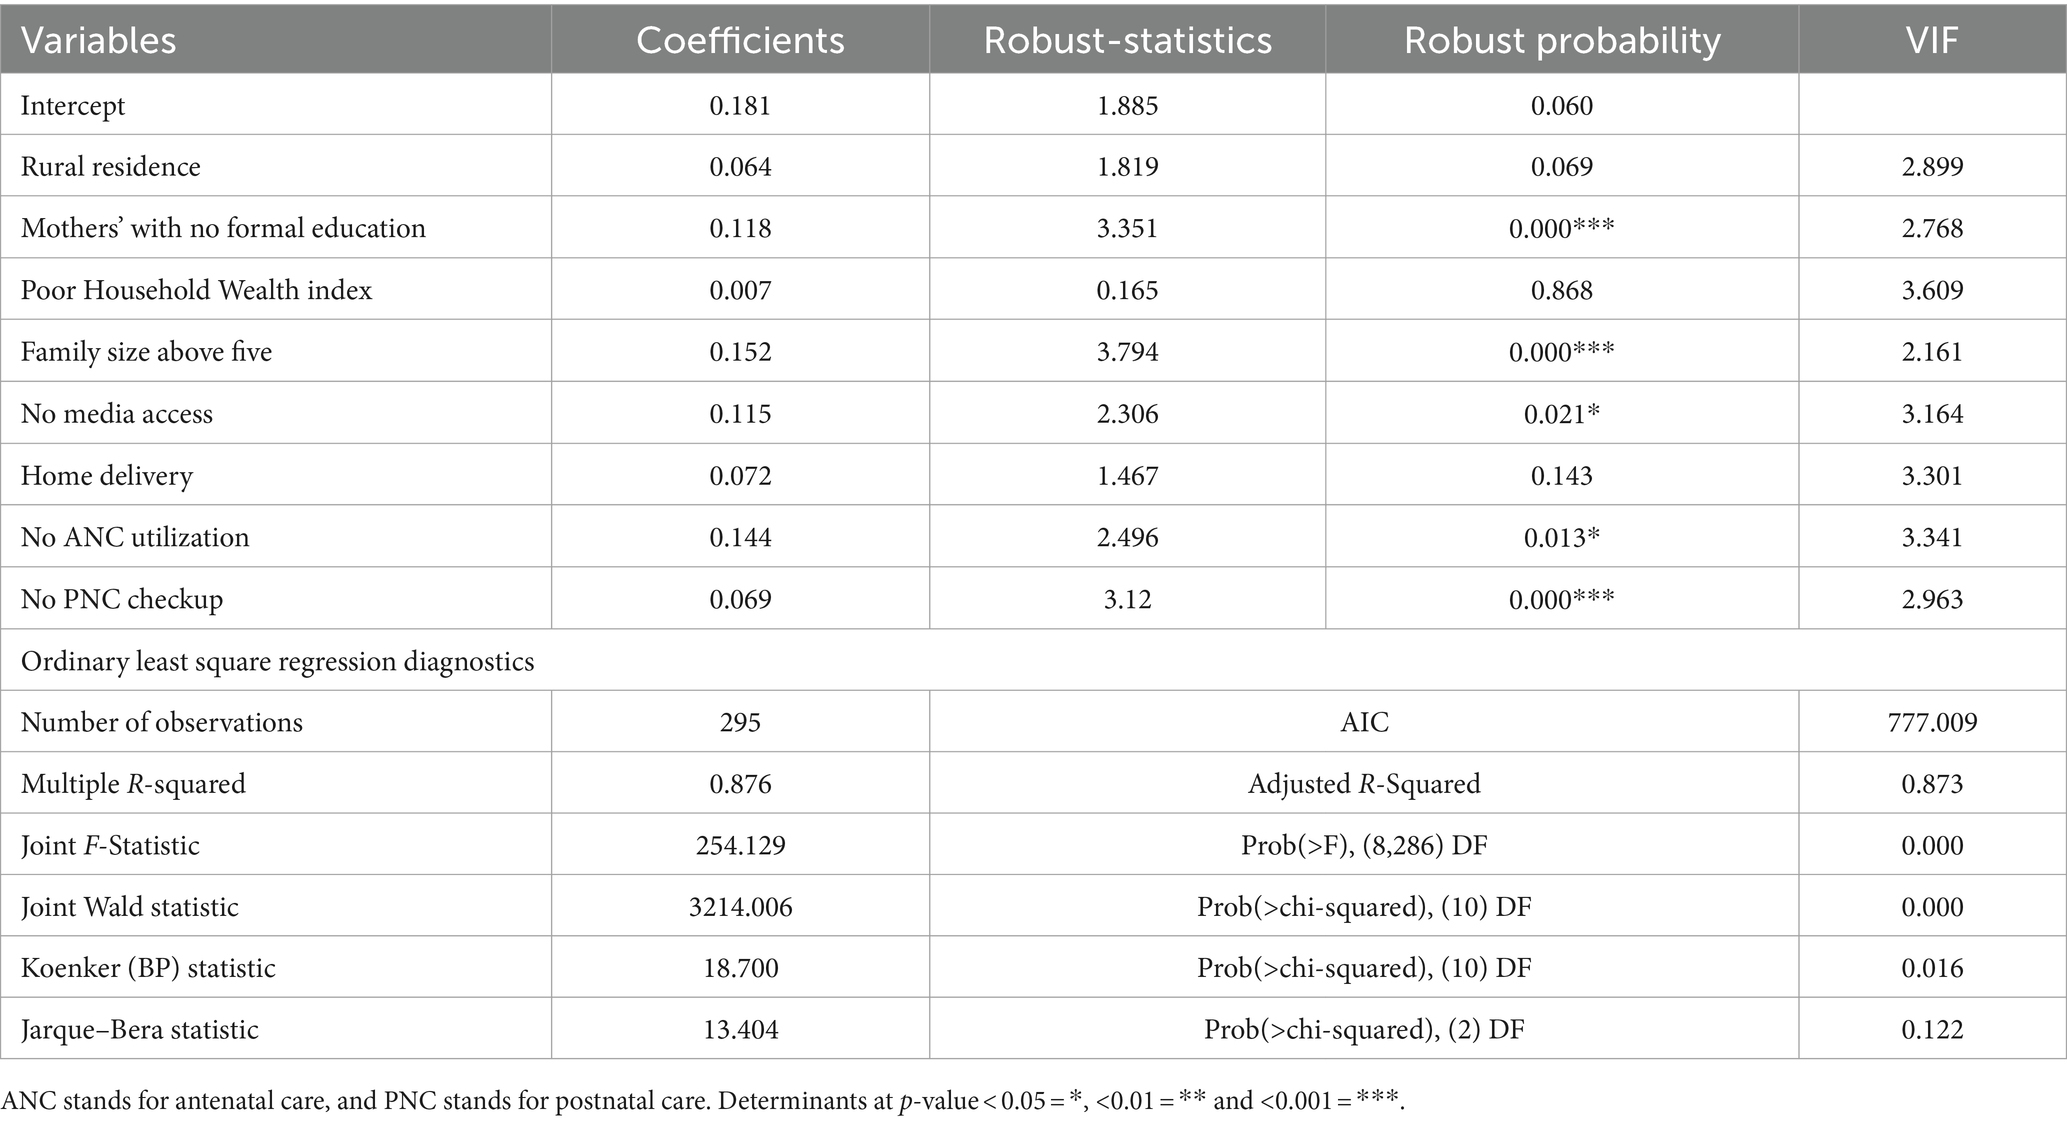
Table 3. Summary Ordinary Least Squares (OLS) regression result.
The model comparison was done by comparing AIC and R-squared values for each model. A model with a small AIC and a high value of R2 was considered the best model. Thus, the MGWR model was favorable, with AIC and R2 values of 256.388 and 0.891, respectively. The MGWR analysis revealed that mothers’ with no formal education, family size above five, no media access, home delivery, and no PNC checkup after delivery were found to have a positive relationship with inadequate minimum acceptable diet (Table 4).
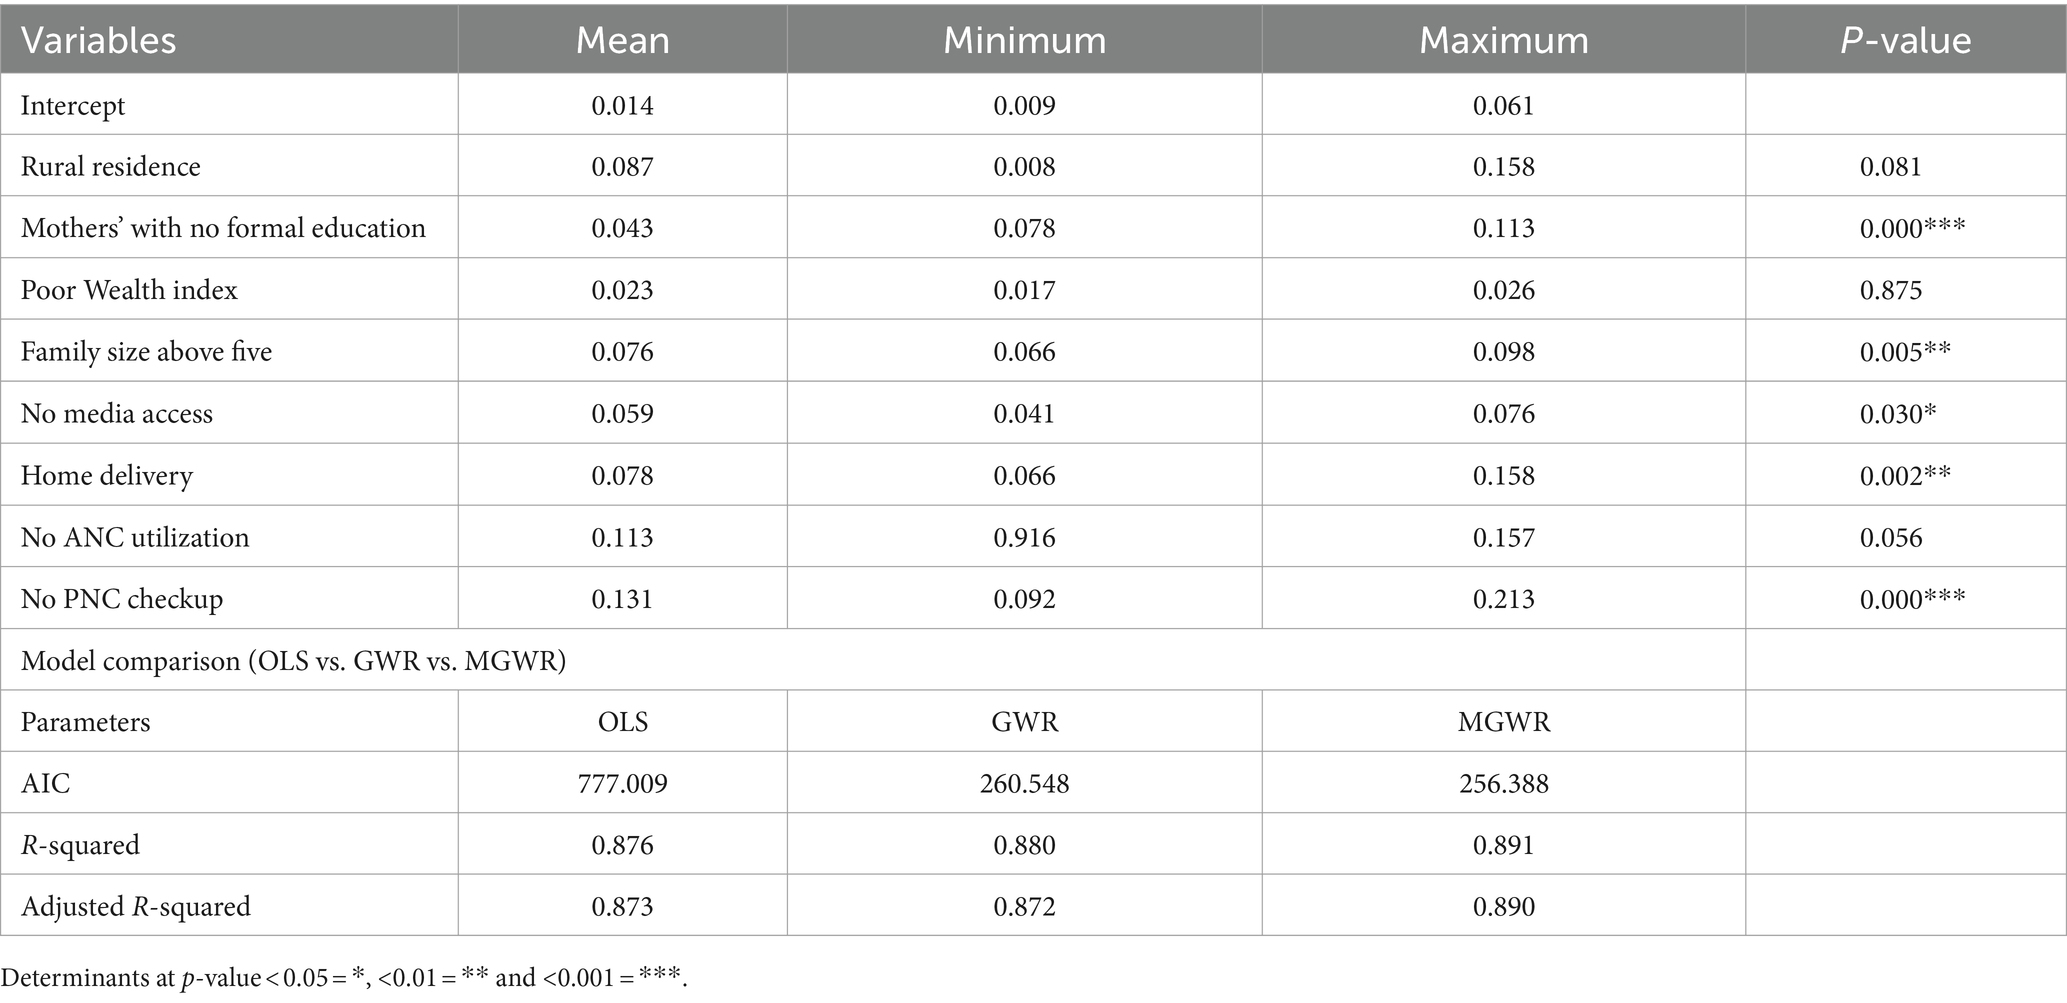
Table 4. Summary of geographically weighted regression analysis result and model comparison.
Analyzing the MGWR graph revealed that a 1% increase in the number of mothers’ with no formal education was associated with a 4.3% higher likelihood of not achieving the minimum acceptable diet, particularly in the eastern part of Ethiopia (Somali regions) (Mean = 0.043, p-value = 0.000). In southern Ethiopia (Gambela and SNNPR regions), household family size was the main factor influencing the likelihood of not achieving the minimum acceptable diet. As the number of households with a family size above five increased, the probability of not achieving the minimum acceptable diet rose by 7.6% (Mean = 0.076, p-value = 0.005). Furthermore, a decrease in the number of mothers who utilized postnatal care (PNC) was associated with an 13.1% higher chance of not achieving the minimum acceptable diet (Mean = 0.131, p-value = 0.000), primarily in the southwestern and eastern parts of Ethiopia. Additionally, with other factors held constant, children from communities with high home delivery rates were 7.8% more likely to have an inadequate minimum acceptable diet in the northern and western parts of Ethiopia (Mean = 0.078, p-value = 0.002). In areas with inadequate media access, the likelihood of not achieving the minimum acceptable diet increases by 5.9% (Mean = 0.059, p-value = 0.030) (Figure 7).
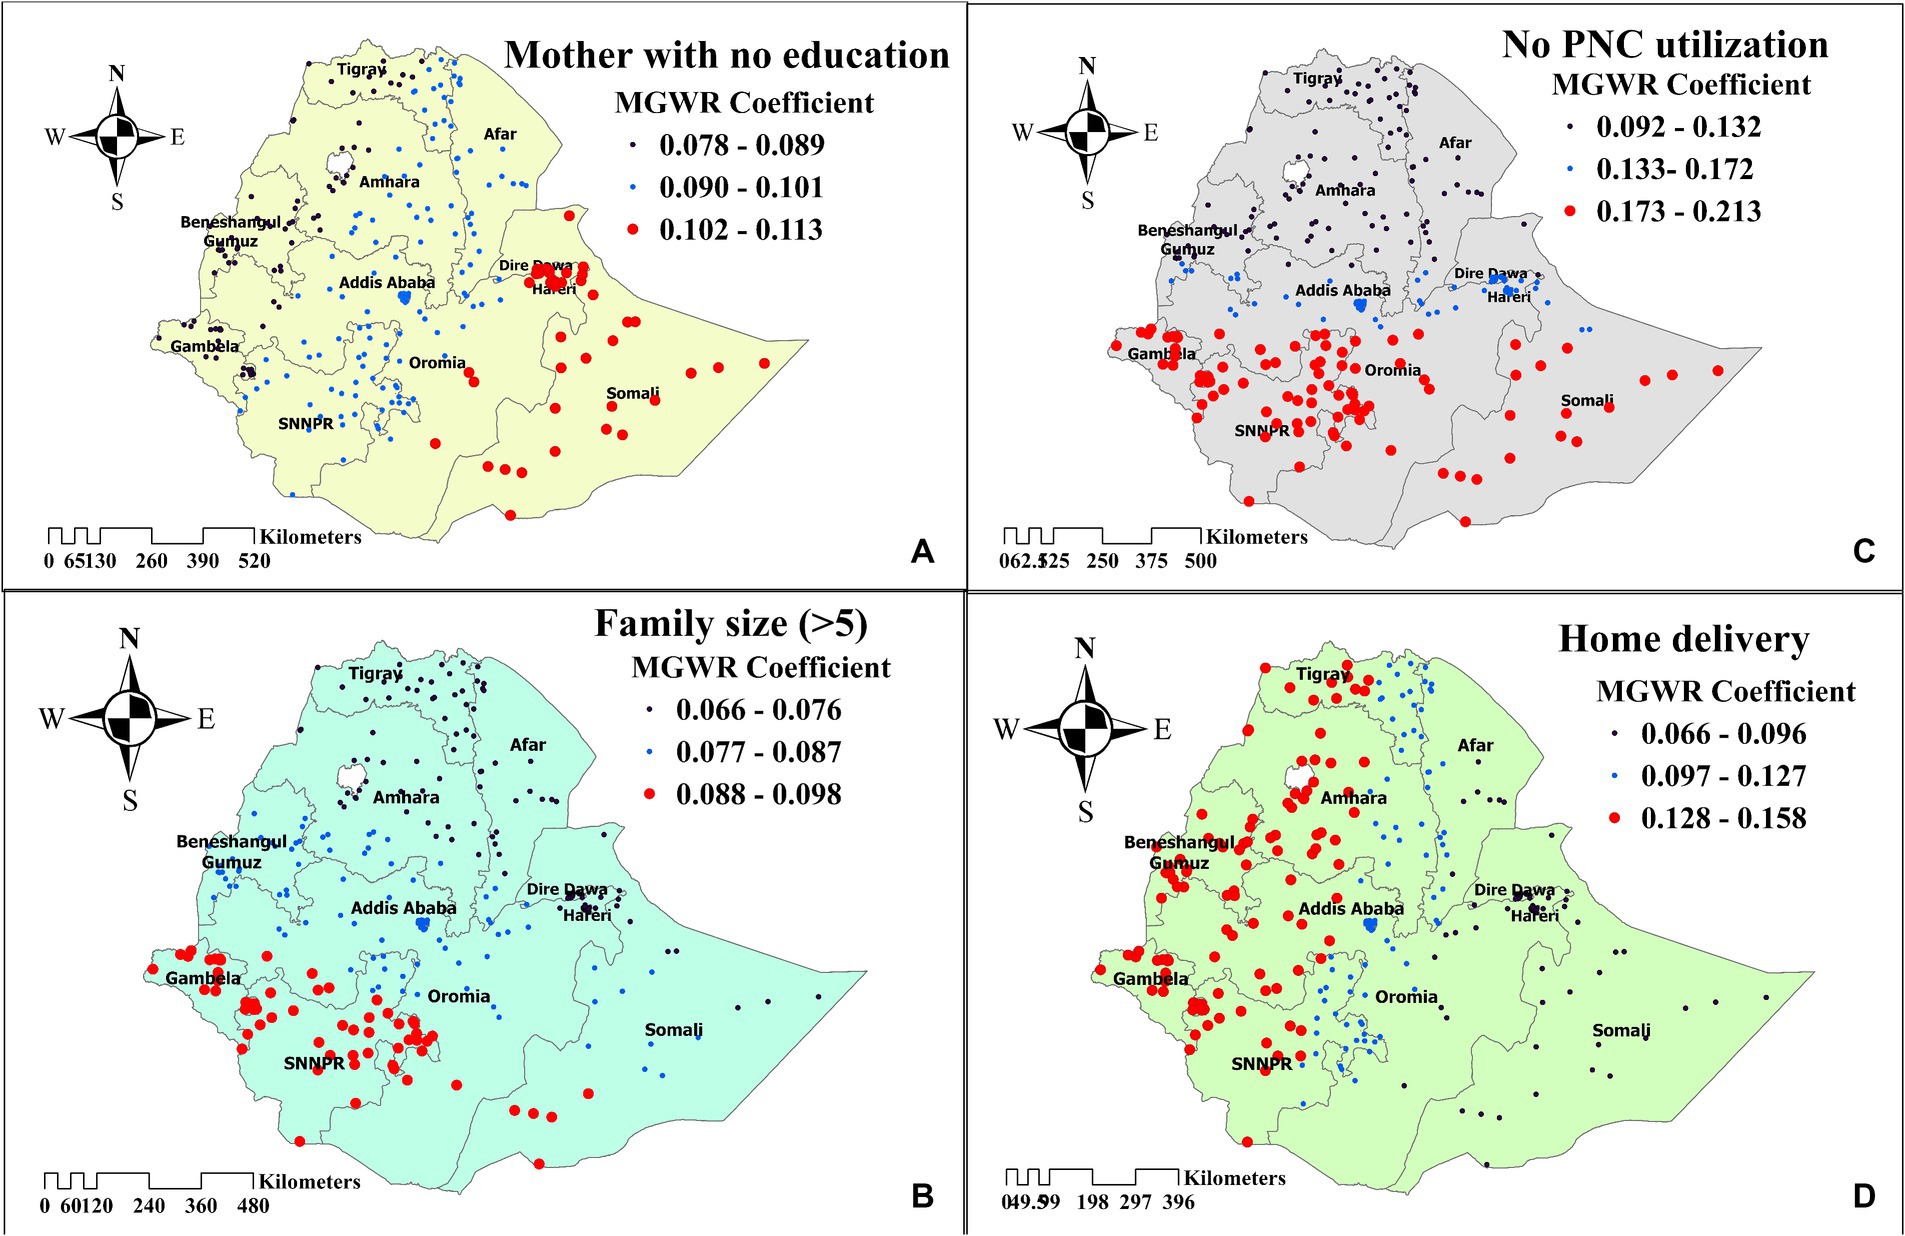
Figure 7. The spatial mapping of geographically weighted regression coefficients by mothers’ with no education (A), family size (>5) (B), no PNC utilization (C), and home delivery (D) to predict the hotspot of inadequate minimum acceptable diet among children in Ethiopia.
This study aimed to determine the geospatial pattern of level of minimum acceptable diet and its predictors among children aged 6–23 months in Ethiopia. The final analysis revealed that 89.56% of the children were unable to achieve the minimum acceptable diet. Besides, The MGWR analysis revealed that mother with no formal education, family size above five, no media access, home delivery, and no PNC checkup after delivery were found to be the determinates of level of minimum acceptable diet.
In this study majority of the child (89.56%, 95CI: 87.85–91.10%) failed to achieve the minimum acceptable diet recommended by the WHO. This finding is higher than the study done in in Nepal (71%) (33), Indonesia (52.3%) (34), and Congo (67%) (10). In contrast, the finding is lower than the study done in India (91.6%) (11), Uganda (94.7%) (35), and Guinea (96.9%) (36). However, the finding is consistent with the study done in East Africa (88.5%) (37). These observed differences could be due to various factors, such as regional variations, population growth rates, and socioeconomic disparities between the countries being compared (38). Additionally, cultural backgrounds and individual perceptions of a balanced diet can significantly impact dietary choices (14). Governmental initiatives implementing national nutrition programs focused on proper feeding practices could also play a significant role in improving child feeding practices, thereby contributing to achieving a MAD (39). Moreover, the implementation of the Baduta program by the Global Alliance for Improved Nutrition (GAIN) has contributed to improving the achievement of an acceptable minimum diet in Indonesia (40). To address this issue effectively, tailored strategies should be developed, taking into account the variations observed across different regions. Continuous monitoring and evaluation of nutritional programs are crucial for assessing their impact and making necessary adjustments. Furthermore, translating research findings into actionable insights through various dissemination channels is key for informing policy and practice, ultimately leading to improved child nutrition outcomes.
The prevalence of inadequate minimum acceptable diet among children in Ethiopia exhibits substantial geographical variation, ranging from 40 to 99%. This finding aligns with a similar study conducted in India, confirming the existence of regional disparities in child dietary practices (41). This spatial dependency of child feeding practices stems from geographical variations in cultural norms, socioeconomic status, educational attainment, and maternal healthcare utilization, all of which influence the likelihood of children achieving a minimum acceptable diet (42, 43).
Children whose mothers have no formal education were unable to achieve the minimum acceptable diet in high hotspot areas (Somali regions). Several other studies also report a positive association between mother’s educational level and meeting MAD (15, 16, 44). In high hotspot areas like the Somali regions, which have the highest women illiteracy rate (73.3%) among Ethiopia’s regions, the absence of formal education among mothers correlates with challenges in providing children with minimum acceptable diets. Firstly, socioeconomic status plays a crucial role, as mothers with no formal education often hail from lower-income backgrounds where access to nutritious food is limited due to financial constraints. In such circumstances, families may prioritize cheaper but less nutritious food options, compromising the quality of their children’s diets. Additionally, the lack of formal education may result in a deficit of nutritional knowledge among mothers, hindering their ability to make informed decisions regarding their children’s dietary needs. Without the understanding of the importance of a balanced diet and how to achieve it, mothers may unintentionally provide inadequate nutrition to their children. Moreover, societal factors such as limited access to healthcare and community resources can further exacerbate the challenge of attaining a minimum acceptable diet for these children.
In households with a family size above five, children fail to achieve the minimum acceptable diet in southern Ethiopia. Likewise, in another study, an increase in the number of children reduces the likelihood of attaining MAD (45). In southern Ethiopia, myths and misconceptions regarding family planning (46) might contribute to an increase in family size, leading to challenges in achieving the minimum acceptable diet. Moreover, factors such as unmet need for family planning in this areas (47) may also play a role. Addressing the nutritional challenges associated with family size in southern Ethiopia requires interventions that promote reproductive health education, improve access to family planning resources, and provide economic empowerment opportunities for women. These measures can help families make informed decisions about family size while ensuring the well-being of their children.
In regions with limited access to media resources, children are unable to achieve the recommended minimum acceptable diet. This is in accordance with the findings of a previous study (48), which indicated a similar trend. The lack of access to media sources among parents hinders their ability to gain adequate knowledge about food diversification and maintaining proper meal frequency, which are crucial factors in achieving the recommended minimum acceptable diet for their children. Thus, improving media access to disseminate essential nutrition-related information will improve child feeding practices.
In western Ethiopia, the practice of home delivery is the main factor hindering the achievement of the minimum acceptable diet for children. This finding aligns with the study conducted in Nepal (49). Home deliveries often lack the involvement of skilled healthcare providers who can offer guidance on proper child feeding practices, including the importance of timely introduction of complementary foods, maintaining dietary diversity, and ensuring adequate meal frequency. In western Ethiopia, it is evident that the prevalence of home delivery is high, reaching up to 80% (50). Consequently, children in households that rely on home deliveries may be more susceptible to malnutrition and its associated health complications. This underscores the need for targeted interventions to address the challenges associated with home delivery and promote optimal child-feeding practices in regions where home delivery is widespread. Improve access to healthcare facilities by investing in infrastructure and maternal health services is also crucial.
In southern and eastern Ethiopia, the failure to attend postnatal care (PNC) checkups significantly impacts children’s ability to achieve the minimum acceptable diet. These regions often face challenges such as remote locations, limited healthcare infrastructure, and cultural beliefs that may deter mothers’ from seeking healthcare services (51, 52). Consistent findings was obtained from other studies (14, 53). Mothers who forgo PNC checkups miss essential opportunities to receive comprehensive counseling and support on optimal infant and young child feeding (IYCF) practices. These checkups provide a critical platform for healthcare providers to educate mothers’ on various aspects of IYCF, including dietary diversity and meal frequency. Implementing programs that enhance PNC utilization is therefore crucial. Besides, including essential child nutritional education and demonstration in PNC checkup will be crucial to achieve MAD.
The use of nationally representative data enhances this study’s generalizability and statistical power, allowing for the application of its findings on a national scale. Additionally, the employment of SaTScan and spatial distribution analysis provides valuable insights into the geographical distribution of inadequate minimum acceptable diet. However, the study’s reliance on secondary data limits its ability to delve into the underlying causes of this phenomenon. The data may not encompass all the factors contributing to inadequate minimum acceptable diet. Furthermore, the cross-sectional nature of the data hinders the establishment of causal relationships between the explanatory variables and minimum acceptable diet. Moreover, the lack of longitudinal data prevents the study from tracking changes in achieving a minimum acceptable diet over time and identifying potential risk factors.
In Ethiopia, 89.56% of children were unable to meet the minimum acceptable diet, surpassing the global average of 84% (54). This alarming statistic underscores the urgent need for targeted interventions, particularly in high-risk areas like the Afar and Somali regions. Additionally, allocating resources to these areas is crucial to expedite progress toward enhancing child feeding practices. Mothers’ with no formal education, family size exceeding five, no media access, home deliveries, and the absence of postnatal care (PNC) checkups were found to be the determinates of inadequate minimum acceptable. Community-based initiatives to promote women’s education have a pivotal role in addressing the problem. Programs that encourage institutional deliveries and enhance the utilization of postnatal care services are also highly recommended. Moreover, managing family size can significantly contribute to achieving the minimum acceptable diet for children. Overall, addressing those contributing factors in identified geographical locations holds immense potential to improve child nutrition and foster optimal child growth.
The datasets presented in this study can be found in online repositories. The names of the repository/repositories and accession number(s) can be found at: https://dhsprogram.com/.
Ethical approval was not required for the studies involving humans because The EDHS 2019 was ethically reviewed by the National Research Ethics Review Committee (NRERC) of the Ethiopian Ministry of Science and Technology. As described in the survey final report, involvement in the survey program was voluntary, and verbal agreement (informed consent) was also taken (23). The studies were conducted in accordance with the local legislation and institutional requirements.
TK: Conceptualization, Formal analysis, Methodology, Software, Writing – original draft, Writing – review & editing. BA: Methodology, Resources, Software, Validation, Visualization, Writing – review & editing. BT: Conceptualization, Data curation, Funding acquisition, Validation, Visualization, Writing – review & editing. RH: Funding acquisition, Investigation, Methodology, Project administration, Software, Supervision, Validation, Writing – original draft.
The author(s) declare that no financial support was received for the research, authorship, and/or publication of this article.
The authors is indebted to the DHS program for giving permission to access the dataset.
The authors declare that the research was conducted in the absence of any commercial or financial relationships that could be construed as a potential conflict of interest.
All claims expressed in this article are solely those of the authors and do not necessarily represent those of their affiliated organizations, or those of the publisher, the editors and the reviewers. Any product that may be evaluated in this article, or claim that may be made by its manufacturer, is not guaranteed or endorsed by the publisher.
1. Kirkpatrick, SI, McIntyre, L, and Potestio, ML. Child hunger and long-term adverse consequences for health. Arch Pediatr Adolesc Med. (2010) 164:754–62. doi: 10.1001/archpediatrics.2010.117
2. World Health Organization. Indicators for assessing infant and young child feeding practices: Part 2: measurement. Geneve, Switzerland: World Health Organization. (2010).
4. Das, JK, Salam, RA, Imdad, A, and Bhutta, ZA. Infant and young child growth In: Reproductive, maternal, newborn, and child Health. Toronto, Canada (2016). 225.
5. WHO U, USAID A, AED U. Indicators for assessing infant and young child feeding practices. Geneva: World Health Organization (2008).
6. Unicef. Levels and trends in child malnutrition. New York, United States of America: eSocialSciences. (2018).
7. World Health Organization. Child maltreatment: fact sheet. Geneve, Switzerland: World Health Organization. (2016). 2020 p.
8. UNICEF Global. Ethiopia. For every child, nutrition. (2023). Available at: https://www.unicef.org/ethiopia/every-child-nutrition#:~:text=28%20per%20cent%20of%20child,under%20five%20years%20are%20stunted.
9. UNICEF Ethiopia. UNICEF emergency nutrition response in Ethiopia. New York, United States of America, UNICEF. (2018).
10. Kambale, RM, Ngaboyeka, GA, Kasengi, JB, Niyitegeka, S, Cinkenye, BR, Baruti, A, et al. Minimum acceptable diet among children aged 6-23 months in south Kivu, Democratic Republic of Congo: a community-based cross-sectional study. BMC Pediatr. (2021) 21:239. doi: 10.1186/s12887-021-02713-0
11. Acharya, A, Pradhan, MR, and Das, AK. Determinants of minimum acceptable diet feeding among children aged 6-23 months in Odisha, India. Public Health Nutr. (2021) 24:3834–44. doi: 10.1017/s1368980021002172
12. Birie, B, Kassa, A, Kebede, E, and Terefe, B. Minimum acceptable diet practice and its associated factors among children aged 6-23 months in rural communities of Goncha district, north West Ethiopia. BMC Nutr. (2021) 7:40. doi: 10.1186/s40795-021-00444-0
13. Belay, DG, Taddese, AA, and Gelaye, KA. Minimum acceptable diet intake and its associated factors among children age at 6-23 months in sub-Saharan Africa: a multilevel analysis of the sub-Saharan Africa demographic and health survey. BMC Public Health. (2022) 22:684. doi: 10.1186/s12889-022-12966-8
14. Gizaw, G, and Tesfaye, G. Minimum acceptable diet and factor associated with it among infant and young children age 6-23 months in north Shoa, Oromia region, Ethiopia. Int J Homeopathy Nat Med. (2019) 5:1. doi: 10.11648/j.ijhnm.20190501.11
15. Molla, A, Egata, G, Getacher, L, Kebede, B, Sayih, A, Arega, M, et al. Minimum acceptable diet and associated factors among infants and young children aged 6-23 months in Amhara region, Central Ethiopia: community-based cross-sectional study. BMJ Open. (2021) 11:e044284. doi: 10.1136/bmjopen-2020-044284
16. Feleke, FW, and Mulaw, GF. Minimum acceptable diet and its predictors among children aged 6-23 months in Mareka District, southern Ethiopia: community based cross-sectional study. Int J. (2020) 9:203.
17. Mukhopadhyay, B. Minimum acceptable diet and child undernutrition in India. India: Indian Council of Social Science Research (2020).
18. Shaun, MMA, Nizum, MWR, and Munny, S. Determinants of meeting the minimum acceptable diet among children aged 6 to 23 months in Bangladesh: evidence from a national representative cross-sectional study. Heliyon. (2023) 9:e17560. doi: 10.1016/j.heliyon.2023.e17560
19. Colglazier, W. Sustainable development agenda: 2030. Science. (2015) 349:1048–50. doi: 10.1126/science.aad2333
20. Ministry of Health of Ethiopia. Addis Ababa, Ethiopia: Food-Based Dietary Guidelines–2022 (2022).
21. EPHI I. Ethiopian public health institute (EPHI) [Ethiopia] and ICF. Addis Ababa,Ethiopia: Ethiopia Mini Demographic and Health Survey 2019: Key Indicators (2021).
22. Ethiopia population – 2021 data – 2022 forecast – 1960-2020 historical – chart – news (2022). Available at: https://tradingeconomics.com/ethiopia/population.
23. Ethiopian Public Health Institute (EPHI) and ICF. Ethiopia Mini demographic and health survey. Final Report. Rockville, Maryland, USA: EPHI and ICF. (2019).
24. Ethiopian Public Health Institute – EPHI, Federal Ministry of Health – FMoH, ICF. Ethiopia Mini demographic and health survey 2019. Addis Ababa, Ethiopia: EPHI/FMoH/ICF (2021).
25. Mare, KU, Aychiluhm, SB, Tadesse, AW, and Mohammed, OA. Individual and community-level determinants of non-use of contraceptive among women with no fertility desire in Ethiopia: a multilevel mixed-effect analysis. Emerg Themes Epidemiol. (2022) 19:2. doi: 10.1186/s12982-022-00112-z
26. Teshale, AB, and Tesema, GA. Magnitude and associated factors of unintended pregnancy in Ethiopia: a multilevel analysis using 2016 EDHS data. BMC Pregnancy Childbirth. (2020) 20:329. doi: 10.1186/s12884-020-03024-5
27. World Health Organization. Indicators for assessing infant and young child feeding practices: definitions and measurement methods. Geneve, Switzerland: World Health Organization (2021).
28. Shrestha, PM. Comparison of ordinary least square regression, spatial autoregression, and geographically weighted regression for modeling forest structural attributes using a geographical information system (GIS). Remote Sensing (RS) Approach Thesis Canada: University of Calgary. Available at: http://peopleucalgaryca/~mcdermid/Docs/Theses/Shrestha_2006.pdf (Accessed October 30, 2012). (2006).
29. Li, Z, and Fotheringham, AS. Computational improvements to multi-scale geographically weighted regression. Int J Geogr Inf Sci. (2020) 34:1378–97. doi: 10.1080/13658816.2020.1720692
30. Kitaw, TA, and Haile, RN. Time to first antenatal care booking and its determinants among pregnant women in Ethiopia: Survival analysis of recent evidence from EDHS 2019. BMC Pregnancy and Childbirth. (2022). 22:921. doi: 10.1186/s12884-022-05270-1
31. Kitaw, TA, and Haile, RN. Time to first childbirth and its predictors among reproductive-age women in Ethiopia: Survival analysis of recent evidence from the EDHS 2019. Frontiers in Reproductive Health. (2023) 5:1165204.
32. Nazeer, M, and Bilal, M. Evaluation of ordinary least square (OLS) and geographically weighted regression (GWR) for water quality monitoring: a case study for the estimation of salinity. J Ocean Univ China. (2018) 17:305–10. doi: 10.1007/s11802-018-3380-6
33. Dirghayu, KC, Shrestha, N, Shrestha, R, Sunuwar, DR, and Poudyal, A. Household food security access and dietary diversity amidst COVID-19 pandemic in rural Nepal; an evidence from rapid assessment. PLoS One. (2023) 18:e0293514. doi: 10.1371/journal.pone.0293514
34. Dewanti, A, Muslimatun, S, Iswarawanti, N, and Khusun, H. Minimum acceptable diet and factors related among children aged 6-23 months in Bekasi municipality West Java province Indonesia. Asian J Microbiol Biotechnol Environ Sci. (2015) 17:415–21.
35. Kimuli, D, Nakaggwa, F, Kasule, K, Kiconco, I, Nyakwezi, S, Sevume, S, et al. Level of minimum acceptable diet and its associated factors among children aged 12-23 months in Ugandan districts. PLoS One. (2023) 18:e0293041. doi: 10.1371/journal.pone.0293041
36. Aboagye, RG, Seidu, A-A, Ahinkorah, BO, Arthur-Holmes, F, Cadri, A, Dadzie, LK, et al. Dietary diversity and undernutrition in children aged 6–23 months in sub-Saharan Africa. Nutrients. (2021) 13:3431. doi: 10.3390/nu13103431
37. Worku, MG, Alamneh, TS, Tesema, GA, Alem, AZ, Tessema, ZT, Liyew, AM, et al. Minimum acceptable diet feeding practice and associated factors among children aged 6-23 months in East Africa: a multilevel binary logistic regression analysis of 2008-2018 demographic health survey data. Arch Public Health. (2022) 80:127. doi: 10.1186/s13690-022-00882-7
38. Lutter, CK, Daelmans, BM, de Onis, M, Kothari, MT, Ruel, MT, Arimond, M, et al. Undernutrition, poor feeding practices, and low coverage of key nutrition interventions. Pediatrics. (2011) 128:e1418–27. doi: 10.1542/peds.2011-1392
39. Ahoya, B, Kavle, JA, Straubinger, S, and Gathi, CM. Accelerating progress for complementary feeding in Kenya: key government actions and the way forward. Matern Child Nutr. (2019) 15:e12723. doi: 10.1111/mcn.12723
40. Mallipu, A. Improving childhood nutrition in Indonesia through an innovative behavioural change programme. EBioMedicine. (2021) 66:103292. doi: 10.1016/j.ebiom.2021.103292
41. Dhami, MV, Ogbo, FA, Osuagwu, UL, and Agho, KE. Prevalence and factors associated with complementary feeding practices among children aged 6-23 months in India: a regional analysis. BMC Public Health. (2019) 19:1034. doi: 10.1186/s12889-019-7360-6
42. Karrebæk, MS. Lasagna for breakfast: the respectable child and cultural norms of eating practices in a Danish kindergarten classroom. Food, Cult Soc. (2013) 16:85–106. doi: 10.2752/175174413X13500468045443
43. Green, J, Waters, E, Haikerwal, A, O'Neill, C, Raman, S, Booth, ML, et al. Social, cultural and environmental influences on child activity and eating in Australian migrant communities. Child Care Health Dev. (2003) 29:441–8. doi: 10.1046/j.1365-2214.2003.00363.x
44. Senarath, U, Agho, KE, Akram, DE, Godakandage, SS, Hazir, T, Jayawickrama, H, et al. Comparisons of complementary feeding indicators and associated factors in children aged 6–23 months across five south Asian countries. Matern Child Nutr. (2012) 8:89–106. doi: 10.1111/j.1740-8709.2011.00370.x
45. Pranita, RF, Briawan, D, Ekayanti, I, and Triwinarto, A. Minimum acceptable diet and its associated factors among children aged 6–23 months in Indonesia. Jurnal Gizi Dan Pangan. (2023) 18:1–10. doi: 10.25182/jgp.2023.18.1.1-10
46. Endriyas, M, Eshete, A, Mekonnen, E, Misganaw, T, and Shiferaw, M. Where we should focus? Myths and misconceptions of long acting contraceptives in southern nations, nationalities and People's region, Ethiopia: qualitative study. BMC Pregnancy Childbirth. (2018) 18:98. doi: 10.1186/s12884-018-1731-3
47. Amaje, E, and Ayalew, T. Unmet need for family planning and associated factors, among women of child-bearing age working in Hawassa industrial park, southern Ethiopia 2021: an institution based cross-sectional study. Clin Epidemiol Global Health. (2022) 17:101122. doi: 10.1016/j.cegh.2022.101122
48. Dhawan, D, Pinnamaneni, R, and Viswanath, K. Association between mass media exposure and infant and young child feeding practices in India: a cross-sectional study. Sci Rep. (2023) 13:19353. doi: 10.1038/s41598-023-46734-4
49. Sunuwar, DR, Bhatta, A, Rai, A, Chaudhary, NK, Tamang, MK, Nayaju, S, et al. The factors influencing inappropriate child feeding practices among families receiving nutrition allowance in the Himalayan region of Nepal. BMC Nutr. (2023) 9:33. doi: 10.1186/s40795-023-00691-3
50. Berhe, R, and Nigusie, A. Magnitude of home delivery and associated factors among child bearing age mothers in Sherkole District, Benishangul Gumuz regional state-Western-Ethiopia. BMC Public Health. (2020) 20:796. doi: 10.1186/s12889-020-08919-8
51. Ababor, S, Birhanu, Z, Defar, A, Amenu, K, Dibaba, A, Araraso, D, et al. Socio-cultural beliefs and practices influencing institutional delivery service utilization in three communities of Ethiopia: a qualitative study. Ethiop J Health Sci. (2019) 29:343–52. doi: 10.4314/ejhs.v29i3.6
52. Jalu, MT, Ahmed, A, Hashi, A, and Tekilu, A. Exploring barriers to reproductive, maternal, child and neonatal (RMNCH) health-seeking behaviors in Somali region, Ethiopia. PLoS One. (2019) 14:e0212227. doi: 10.1371/journal.pone.0212227
53. Abebe, H, Gashu, M, Kebede, A, Abata, H, Yeshaneh, A, Workye, H, et al. Minimum acceptable diet and associated factors among children aged 6-23 months in Ethiopia. Ital J Pediatr. (2021) 47:215. doi: 10.1186/s13052-021-01169-3
54. UNICEF DATA. Available indicators for recommended feeding practices – UNICEF DATA. (2015). Available at: https://data.unicef.org/wp-content/uploads/2016/10/iycf-recommendations-practices-mdd-mmf-mad-regions-plus-INDICATOR.pdf.
Keywords: geospatial pattern, minimum acceptable diet, determinants, children, Ethiopia
Citation: Kitaw TA, Abate BB, Derese Tilahun B and Haile RN (2024) Geospatial pattern of level of minimum acceptable diet and its determinants among children aged 6–23 months in Ethiopia. Spatial and multiscale geographically weighted regression analysis. Front. Public Health. 12:1348755. doi: 10.3389/fpubh.2024.1348755
Edited by:
Bruna Leal Lima Maciel, Federal University of Rio Grande do Norte, BrazilReviewed by:
Marta Cristina Sanabria, National University of Asunción, ParaguayCopyright © 2024 Kitaw, Abate, Derese Tilahun and Haile. This is an open-access article distributed under the terms of the Creative Commons Attribution License (CC BY). The use, distribution or reproduction in other forums is permitted, provided the original author(s) and the copyright owner(s) are credited and that the original publication in this journal is cited, in accordance with accepted academic practice. No use, distribution or reproduction is permitted which does not comply with these terms.
*Correspondence: Tegene Atamenta Kitaw, dGVnZW5lMjAxM0BnbWFpbC5jb20=
Disclaimer: All claims expressed in this article are solely those of the authors and do not necessarily represent those of their affiliated organizations, or those of the publisher, the editors and the reviewers. Any product that may be evaluated in this article or claim that may be made by its manufacturer is not guaranteed or endorsed by the publisher.
Research integrity at Frontiers
Learn more about the work of our research integrity team to safeguard the quality of each article we publish.