
95% of researchers rate our articles as excellent or good
Learn more about the work of our research integrity team to safeguard the quality of each article we publish.
Find out more
ORIGINAL RESEARCH article
Front. Public Health , 25 April 2024
Sec. Aging and Public Health
Volume 12 - 2024 | https://doi.org/10.3389/fpubh.2024.1347219
This article is part of the Research Topic Aging-Related Sarcopenia and Frailty: Prevalence, Risk Factors and Prediction Models View all 14 articles
 Rongxuan Xu1
 Yongxing Chen1
 Zhihan Yao1Wei Wu1
 Jiaxue Cui1
 Ruiqi Wang1
 Yizhuo Diao1
 Chenxin Jin1Zhijun Hong2*
 Xiaofeng Li1*
Background: Osteoporosis is becoming more common worldwide, imposing a substantial burden on individuals and society. The onset of osteoporosis is subtle, early detection is challenging, and population-wide screening is infeasible. Thus, there is a need to develop a method to identify those at high risk for osteoporosis.
Objective: This study aimed to develop a machine learning algorithm to effectively identify people with low bone density, using readily available demographic and blood biochemical data.
Methods: Using NHANES 2017–2020 data, participants over 50 years old with complete femoral neck BMD data were selected. This cohort was randomly divided into training (70%) and test (30%) sets. Lasso regression selected variables for inclusion in six machine learning models built on the training data: logistic regression (LR), support vector machine (SVM), gradient boosting machine (GBM), naive Bayes (NB), artificial neural network (ANN) and random forest (RF). NHANES data from the 2013–2014 cycle was used as an external validation set input into the models to verify their generalizability. Model discrimination was assessed via AUC, accuracy, sensitivity, specificity, precision and F1 score. Calibration curves evaluated goodness-of-fit. Decision curves determined clinical utility. The SHAP framework analyzed variable importance.
Results: A total of 3,545 participants were included in the internal validation set of this study, of whom 1870 had normal bone density and 1,675 had low bone density Lasso regression selected 19 variables. In the test set, AUC was 0.785 (LR), 0.780 (SVM), 0.775 (GBM), 0.729 (NB), 0.771 (ANN), and 0.768 (RF). The LR model has the best discrimination and a better calibration curve fit, the best clinical net benefit for the decision curve, and it also reflects good predictive power in the external validation dataset The top variables in the LR model were: age, BMI, gender, creatine phosphokinase, total cholesterol and alkaline phosphatase.
Conclusion: The machine learning model demonstrated effective classification of low BMD using blood biomarkers. This could aid clinical decision making for osteoporosis prevention and management.
Osteoporosis, the most prevalent metabolic bone disorder, is characterized by low bone mass, microarchitectural deterioration, fragility, and increased fracture risk (1–3). The growing older adult/adults population has contributed to rising osteoporosis prevalence globally - currently estimated at 19.7% (4–6). Fractures in six EU nations may increase from 2.7 million in 2017 to 3.3 million by 2030, with costs rising by 27% to $37.5 billion (7). Thus osteoporosis imposes substantial socioeconomic burdens worldwide. However, its subtle onset often delays diagnosis until fractures occur (8). Effective screening and early interventions are critical for prevention. In other words, it is important to screen for osteopenia and osteoporosis in the general population, in order to enable timely interventions to prevent fragility fractures. Dual-energy X-ray absorptiometry remains the gold standard for measuring BMD (9). However, the need for skilled technicians and radiation exposure limit its widespread use (10, 11). Since some blood biomarkers have shown modest correlations with osteoporosis and are easily obtained, this study aimed to develop biomarker-based models to identify those with low BMD (12–14). Machine learning, an important artificial intelligence tool, discovers patterns in big datasets via complex algorithms (15). Advancements in healthcare big data have expanded ML applications (16). The purpose of this study is to utilize the data from the National Health and Nutrition Examination Survey (NHANES) database to build models and test them using six machine learning algorithms, namely, logistic regression (LR), support vector machine (SVM), gradient boosting machine (GBM), naive Bayesian (NB), artificial neural network (ANN), and random forest (RF), which were modeled and tested to compare the accuracy of several methods in predicting low bone density in the test set, and to explore the application value of machine learning algorithms in low bone density prediction and auxiliary diagnosis.
The National Health and Nutrition Examination Survey (NHANES) database was selected for this study. The NHANES is a program designed by the National Center for Health Statistics (NCHS) to assess the health and nutritional status of the U.S. population by surveying a national sample of 5,000 citizens annually since 1999. NHANES protocols were approved by the NCHS Research Ethics Review Board with written informed consent obtained from all participants (17).
In this study, NHANES data for the cycle 2017–2020 was selected as the internal validation set, and NHANES data for the cycle 2013–2014 was used as the external validation set, excluding participants younger than 50 years of age and participants with missing or invalid Femoral neck BMD data in Dual-Energy X-ray Absorptiometry – Femur.
Based on previous literature (18, 19) and the purpose of the study, the following four components of variables were included: (a) Demographic information: age, gender, race and education, marital status, poverty index. (b) Examination data: Dual-Energy X-ray Absorptiometry - Femur (Femoral neck BMD), body mass index (BMI). (c) Laboratory data: Standard Biochemical Profile, Plasma Fasting Glucose, HDL, LDL & Triglycerides, Total Cholesterol, Complete Blood Count, Glycohemoglobin. (d) Questionnaire information: Osteoporosis, Alcohol Use, Blood Pressure &Cholesterol, Diabetes, Smoking-Cigarette Use. Alcohol use was defined as having ever had 4/5 drinks or more per day; smoking was defined as having smoked at least 100 cigarettes in one’s lifetime; having ever been told that one has high blood pressure or is on prescription medication for high blood pressure was defined as high blood pressure; having ever been told that one has diabetes or is on insulin or glucose-lowering medication was defined as diabetes; and history of personal osteoporosis or fracture is defined as having at least one of the following: ever had a hip, wrist, spine or other fracture; been told by a doctor that you have osteoporosis. Parental history of osteoporosis or fracture was defined as having at least one of the following: self-reported fracture of a parent; parent had been told that he or she had osteoporosis.
Bone mineral density (BMD) measurements in the NHANES database were primarily determined using dual-energy X-ray absorptiometry (DXA). In 2017–18, the femur scans were acquired on Hologic Discovery model A densitometers (Hologic, Inc., Bedford, Massachusetts), using software version Apex 3.2. Bedford, Massachusetts, using software version Apex 3.2. In 2019-March 2020, the femur scans were acquired on Hologic Horizon model A densitometers (Hologic, Inc., Bedford, Massachusetts), using software version Apex version 5.6.0.5. The 2013–2014 femur scans were acquired on Hologic QDR-4500A fan-beam densitometers (Hologic, Inc., Bedford, Massachusetts) using software version Apex 3.2. All scans were analyzed with Hologic APEX version 4.0 software. In this study, the BMD of the femoral neck was chosen as a criterion because it has been proposed as a reference skeletal site for defining osteoporosis in several epidemiologic studies (11). The diagnosis of primary osteoporosis and osteopenia is mainly based on the T-value obtained after the calculation of BMD measurements (20). T-value = bone mineral density of the study population – mean value of bone mineral density of the reference group (age group of peak bone mineral density)/standard deviation of that reference age group (World Health Organization recommendations use bone mineral density data of non-Hispanic white women aged 20–29 years from NHANES III as the reference group).
T-value ≥ −1: healthy −2.5 < T-value < −1: osteopenia T-value ≤ −2.5: osteoporosis
Both conditions, osteopenia and osteoporosis, are considered to be low bone mineral density (21), and are therefore defined as low bone mineral density when either of the following is met: (1) femoral neck T-score < −1 (2) patient said “yes” to the question: Has a doctor ever told you that you had osteoporosis, sometimes called thin or brittle bones?
Participants aged ≥50 years with complete femoral neck BMD data were included. Due to substantial missingness and outliers, data preprocessing was performed. We assigned “NA” to the data with “7, 9, 77, 99,” deleted the variables with more than 30% missing values (22, 23), and used the MI package in the R software to perform multiple interpolation for the variables with less than 30% missing values. Summary statistics were calculated following imputation. Normally or near-normally distributed continuous variables were presented as mean ± standard deviation and compared between groups by independent t-tests. Non-normally distributed continuous data were expressed as median (interquartile range) and compared using non-parametric tests. Categorical variables were presented as n (%) and compared via chi-squared tests.
In this study, Lasso (Least Absolute Shrinkage and Selection Operator) feature selection was performed using the ‘glmnet’ package in the R software. By adding an L1 regularization term to the least squares function, LASSO forces some coefficients to zero, effectively removing those variables from the model. An important tuning parameter in LASSO is λ (λ ≥ 0), controlling the degree of coefficient shrinkage. When λ = 0, LASSO is equivalent to ordinary linear regression. This study performs 10-fold cross-validation through the ‘cv.glmnet’ function, that is, the data are randomly divided into 10 groups, nine of which are used as the training set and one as the test set, and one extreme value of λ is generally selected for the training set, and then the parameters obtained from the training set are used for the prediction of the remaining set of data, and this process is repeated for 10 times, and the optimal value of λ is finally determined by the mean-square error obtained from the calculation of the results of the 10 predictions. Under this function, there are usually two choices for the optimal λ value, one is λ.min, the value of λ that minimizes the cross-validation error; the other is λ.1se, which keeps the cross-validation error within one standard error. The choice of the optimal λ varies from study to study depending on the specifics of the study and the purpose of the study. In addition, Lasso performs well in coping with the problem of the existence of multiple covariates among variables, and the independent variables in this study are mainly common blood biochemical indexes in clinics, and there is often the effect of multiple covariates among these variables, while Lasso regression can effectively deal with the problem of covariates by forcing some of the coefficients to be contracted to zero, which improves the stability and interpretability of the models (24).
In machine learning, there are four main methods: supervised learning, unsupervised learning, semi-supervised learning and reinforcement learning. The goal of this study is to categorize the population with normal bone density and the population with low bone density. Since this is a classification problem, the use of supervised learning algorithms is most appropriate (25). Therefore, six commonly used supervised learning algorithms, logistic regression (LR), support vector machine (SVM), gradient boosting machine (GBM), naive Bayes (NB), artificial neural network (ANN), and random forest (RF), were used to construct the model in this study. The internal validation dataset was randomly divided into training set and test set according to the ratio of 7:3. During the model training process, 10-fold cross-validation was used to select and adjust the model parameters. Then, 30% of the test dataset was input into the trained model for prediction. Additionally, NHANES data from 2013 to 2014 was entered into the model for external validation. The model performance was evaluated in terms of model differentiation ability, calibration ability and clinical application value. The area under the receiver operating characteristic curve (ROC) (AUC), accuracy, sensitivity, specificity, precision and F1 score were utilized to assess the discriminative ability of the model. Calibration ability of the model was assessed using calibration curves. The clinical applicability of the models was assessed by decision curve (DCA), and the confusion matrices of several models were visualized to provide a more intuitive understanding of the classification ability of the models.
SHAP (SHapley Additive exPlanation) is a post-hoc explanation framework for machine learning models based on game theory (26). It quantifies the importance of each feature in the model by calculating the contribution value, known as the Shapley value, for each feature towards the predicted outcome. This study utilizes the SHAP method to enhance the interpretability and transparency of the model. The data analysis process was conducted using R 4.3.1 and Python 3.11.3, and a significance level of p < 0.05 was considered statistically significant.
Based on the inclusion and exclusion criteria, a total of 3,545 study participants who were ≥50 years of age and had complete femoral neck BMD data were included in the internal validation set of this study (Figure 1). The baseline information of the study subjects is shown in Table 1, of which 1870 were in the normal BMD group and 1,675 in the low BMD group, and a total of 60 initial variables were included after deletion of variables with more than 30% of missing values (Fasting Glucose, LDL-Cholesterol, and Triglyceride); among the demographic factors, lifestyle factors and past medical history, it can be seen that compared to the normal BMD group, the low BMD group was more likely to be older, female, non-Hispanic white or other race, widowed/divorced/separated, no history of smoking and alcohol consumption, lower BMI, no diabetes, and have a personal and parental history of osteoporosis and fracture; among the blood biochemical indexes, the mean values of direct HDL-Cholesterol, Total Cholesterol, Segmented neutrophils percent, Mean cell volume, Mean cell hemoglobin, Alkaline Phosphatase (ALP) were greater in the low bone density group than in the normal bone density group, while the mean values of Red blood cell count, Hemoglobin, Hematocrit, Glycohemoglobin, Alanine Aminotransferase (ALT), Creatine Phosphokinase (CPK), Creatinine, Globulin, Glucose, Gamma Glutamyl Transferase (GGT), Total Protein, Uric acid were smaller than those of the normal BMD group (p < 0.001). The external validation set screened 3,127 study participants, of whom 1,796 were in the normal BMD group and 1,331 in the reduced BMD group, and the baseline information table is shown in Supplementary Table S1.
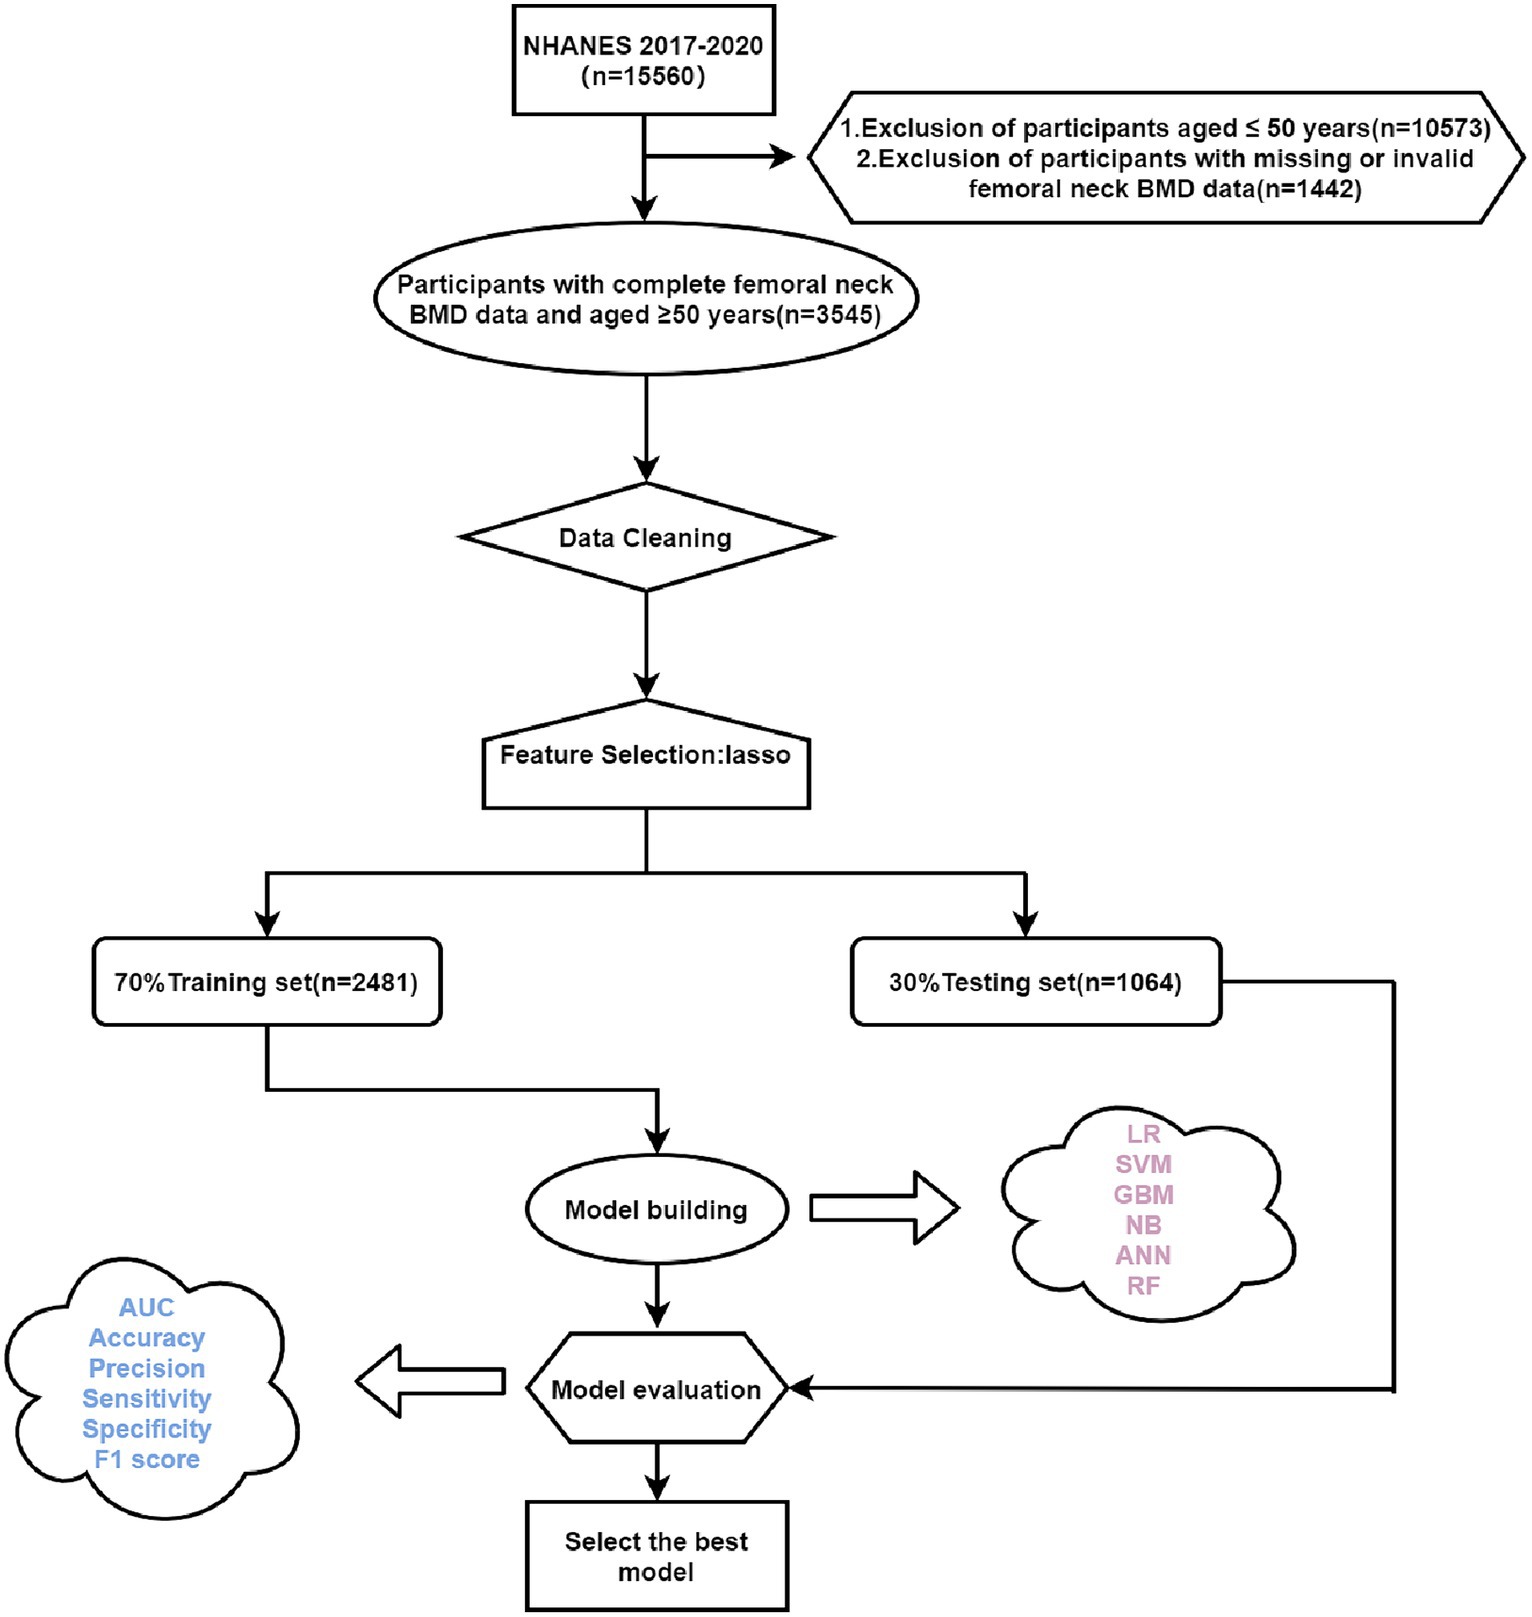
Figure 1. Flow chart of this study. LR, logistic regression; SVM, support vector machine; GBM, gradient boosting machine; NB, naive Bayesian; ANN, artificial neural network; RF, random forest; Lasso, Least Absolute Shrinkage and Selection Operator.
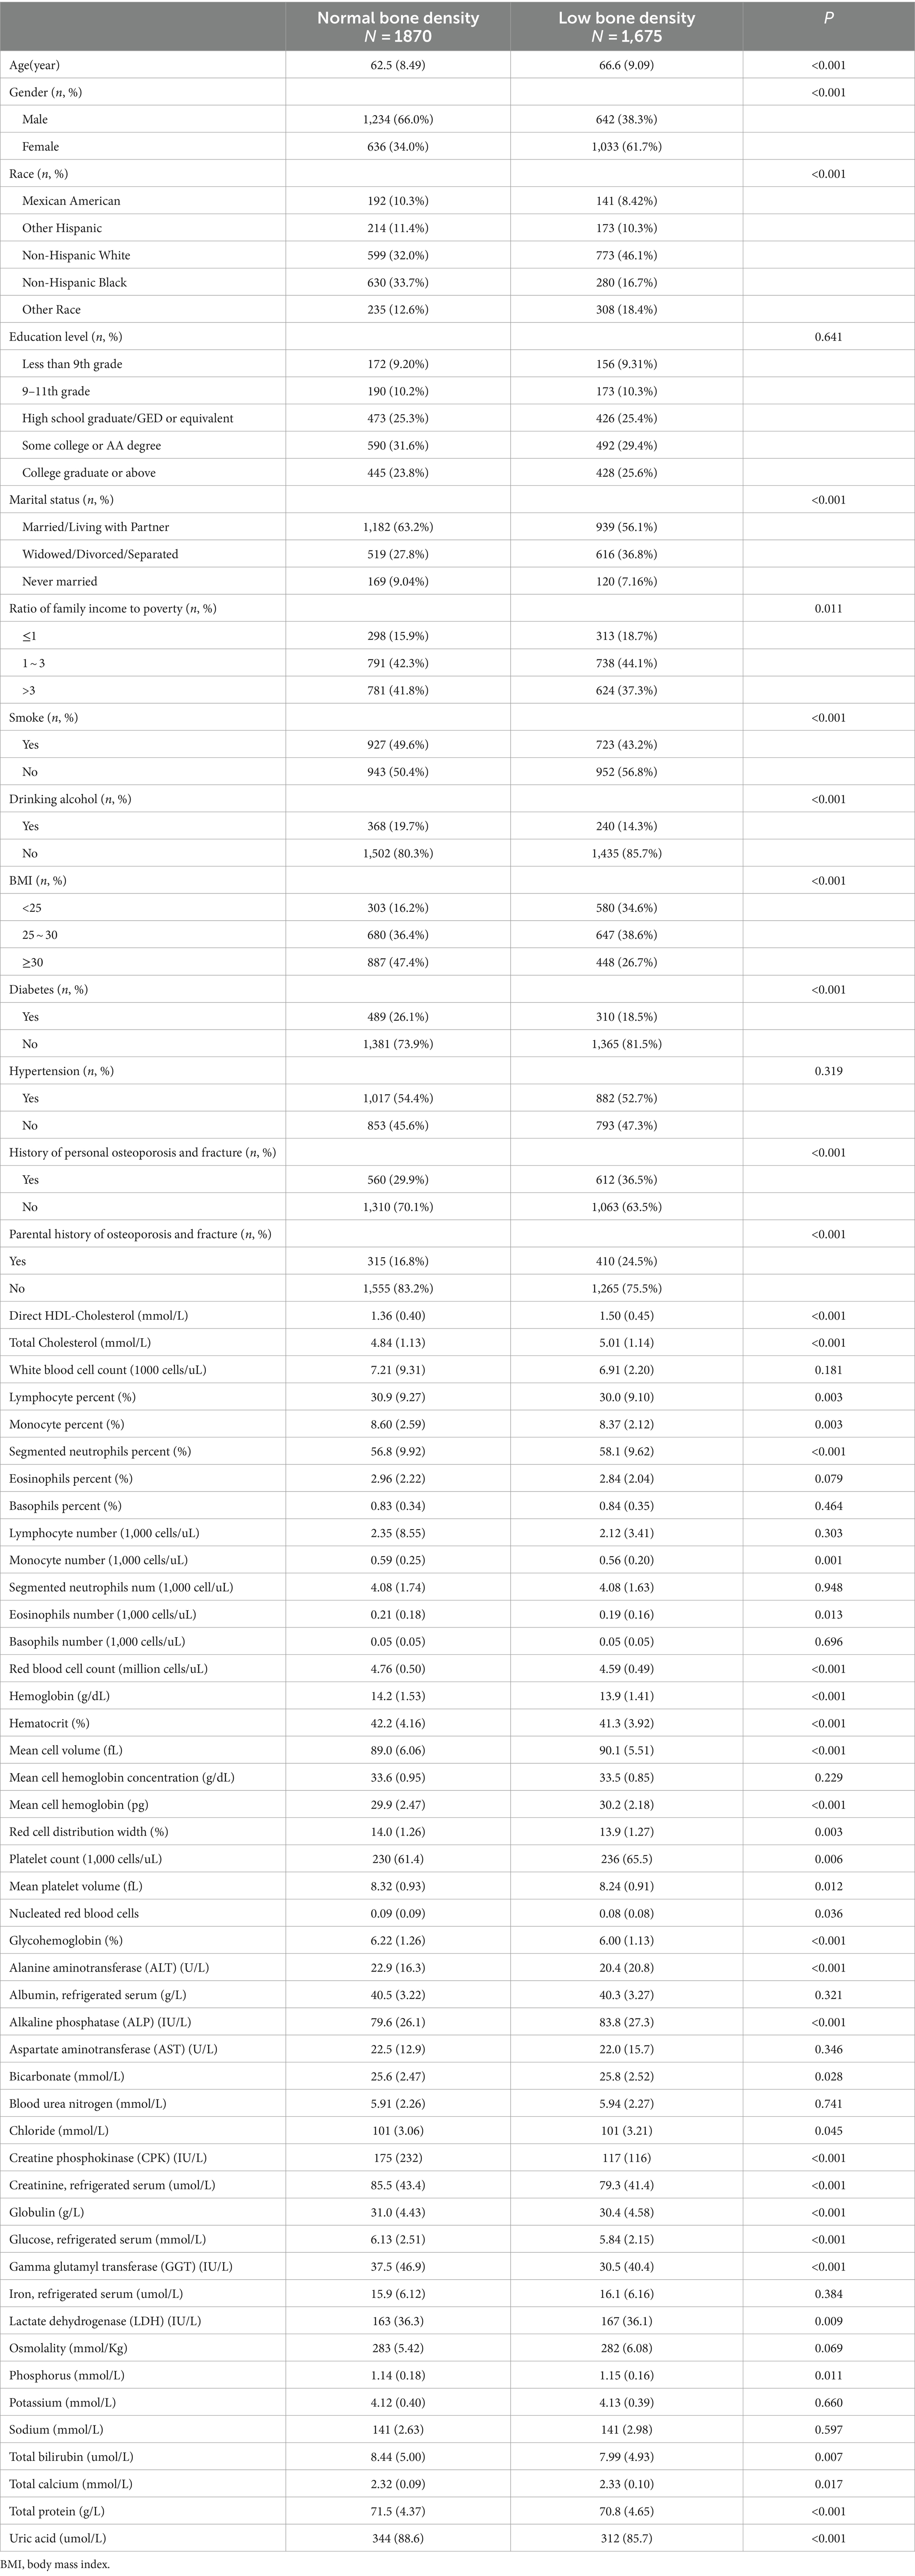
Table 1. Comparison of general characteristics of the group with normal bone mineral density and the group with low bone mineral density.
Variable selection was performed by Lasso (Least Absolute Shrinkage and Selection Operator), as shown in Figure 2, and 10-fold cross-validation was used to select λ. Due to the large number of characteristic variables in this study, if λ.min is used as the optimal λ value, there will be 41 variables included in the final model, which makes the model too complex and may have the risk of overfitting. On the other hand, when λ.1se is chosen as the optimal λ value, 19 variables will be included in the model, which is more concise and has a good prediction performance. Therefore, λ.1se is finally chosen as the optimal λ value in this study. The 19 variables included in the machine learning model were Age, Gender, Ratio of family income to poverty, BMI, Diabetes, and History of personal osteoporosis and fracture, Parental history of osteoporosis and fracture, Total Cholesterol, Monocyte percent, Segmented neutrophils percent, Mean cell volume, Red cell distribution width, Glycohemoglobin, Alkaline Phosphatase (ALP), Creatine Phosphokinase (CPK), Globulin, Osmolality, Total Protein, Uric acid.
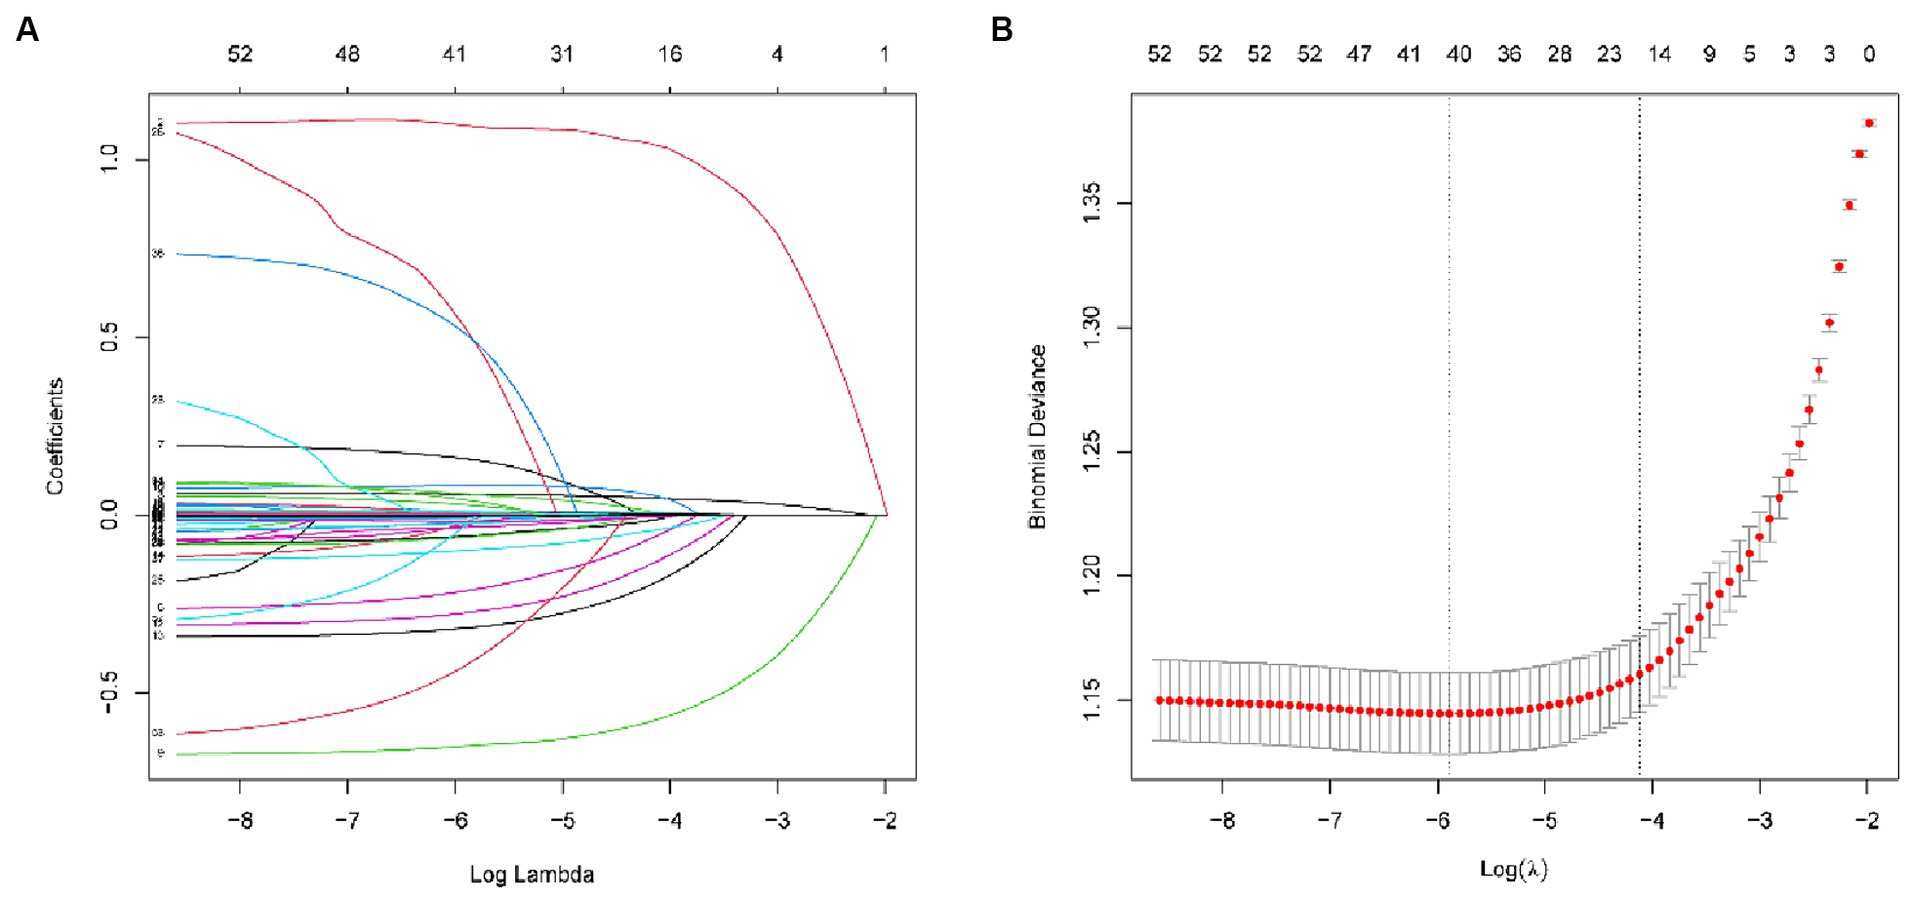
Figure 2. (A) Lasso coefficient path plots for 59 variables. (B) Cross-validation curves (10-fold cross validation). The left dashed line represents lambda.min and the right dashed line represents lambda.1se.
Six machine learning models were constructed in this study, Figure 3 shows the ROC curves for the training and test sets of the model in the internal validation set, in the test set, LR (AUC = 0.785) has the highest AUC value and the best model discrimination, followed by SVM (AUC = 0.78), GBM (AUC = 0.775), ANN (AUC = 0.771), RF (AUC = 0.761), and NB (AUC = 0.729); LR also had higher accuracy (0.733), specificity (0.829), and precision (0.766) than the remaining five models; RF had the highest sensitivity (0.684); and GBM had a higher F1 score (0.693) than the other models (Table 2). Figure 4 shows the confusion matrix for the model test set, from which it can also be seen that LR has the strongest ability to discriminate between people with normal bone density and those with low bone density among the six models. The calibration curves of the six model training and validation sets are shown in Figure 5, and in the test set, the calibration curve of RF fits the ideal curve to the highest degree, and the calibration curves of the rest of the models fit the ideal curve reasonably well except for NB, which has a worse fit, suggesting a better match between the predicted probabilities of the models and the actual observed incidence rates. The results of Decision Curve Analysis (DCA) on the training and test sets of the models are shown in Figure 6, which shows that when the predictive probability threshold is certain, LR has the largest net gain compared to the other five models, indicating that LR has better clinical utility. In the external validation of the model, the AUC value (0.78), accuracy (0.718), specificity (0.752), and precision (0.667) of LR were higher than those of the other models, and good robustness and extrapolation ability could also be seen from the confusion matrix, ROC curve, calibration curve, and decision curve of the model (Supplementary Figures S3, S4 and Supplementary Table S3). Therefore, from the comprehensive evaluation of model differentiation, calibration, and clinical gain, LR is the optimal model for predicting low BMD population.
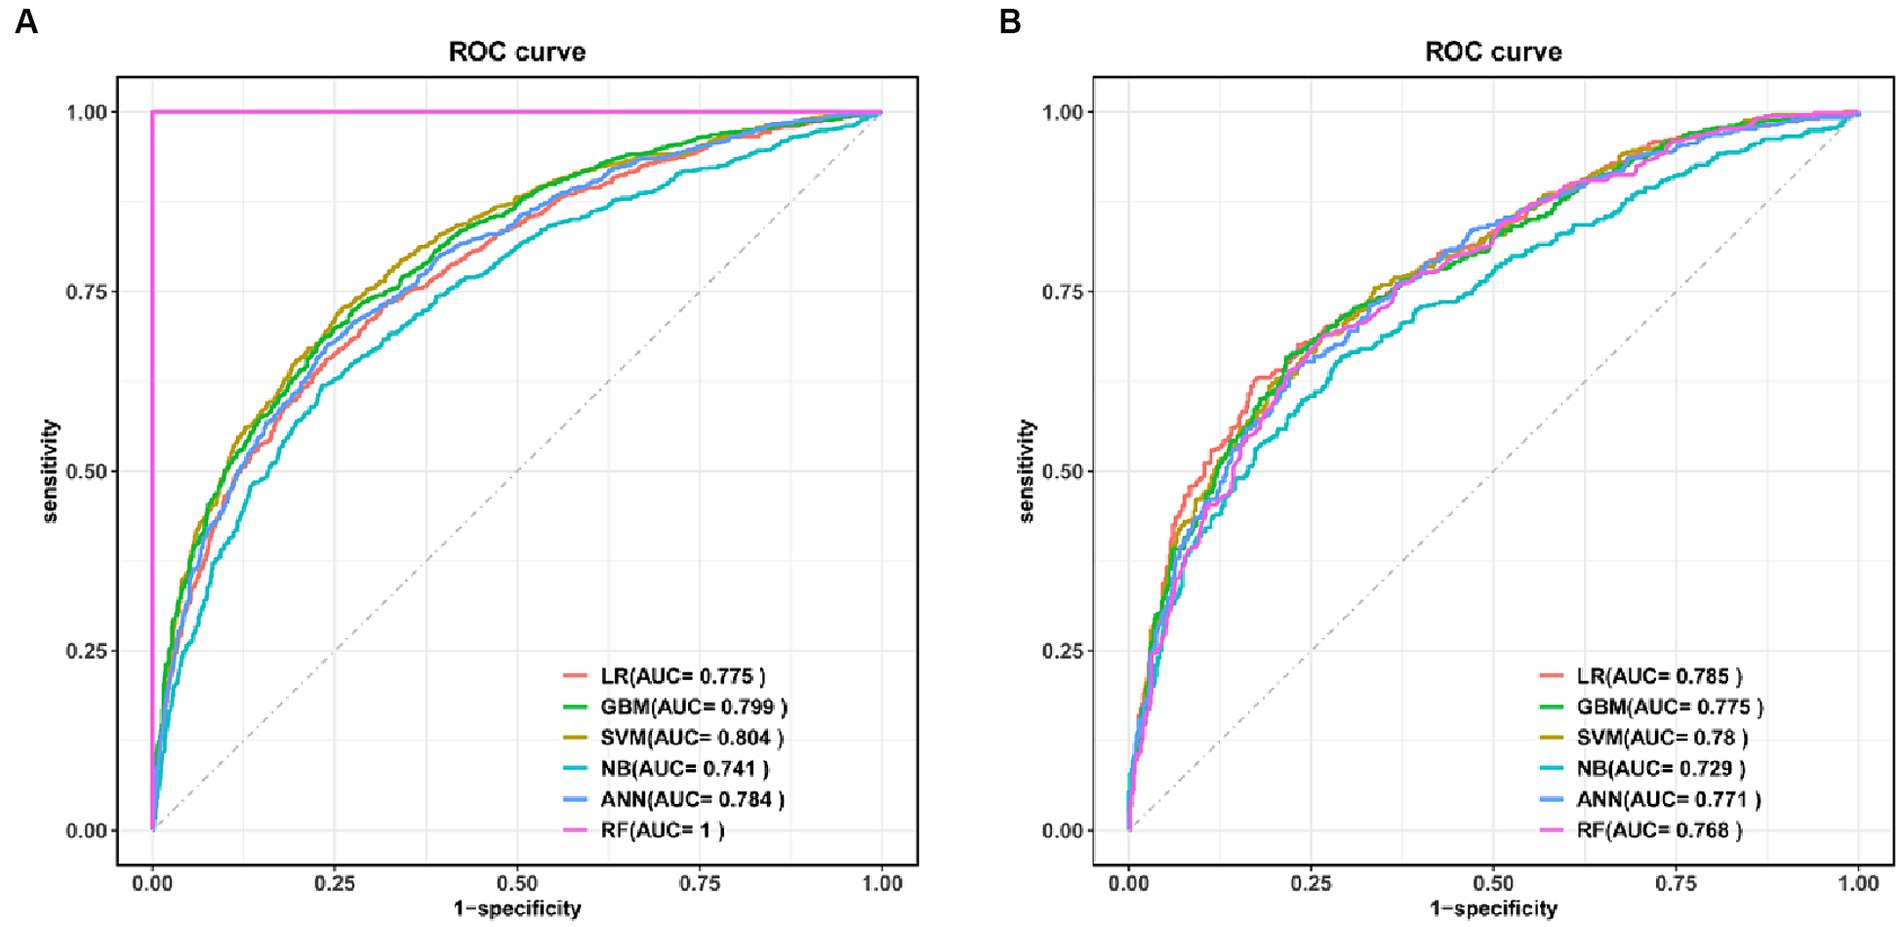
Figure 3. ROC curves for the six models in the training set (A) and test set (B). LR, logistic regression; SVM, support vector machine; GBM, gradient boosting machine; NB, naive Bayesian; ANN, artificial neural network; RF, random forest.
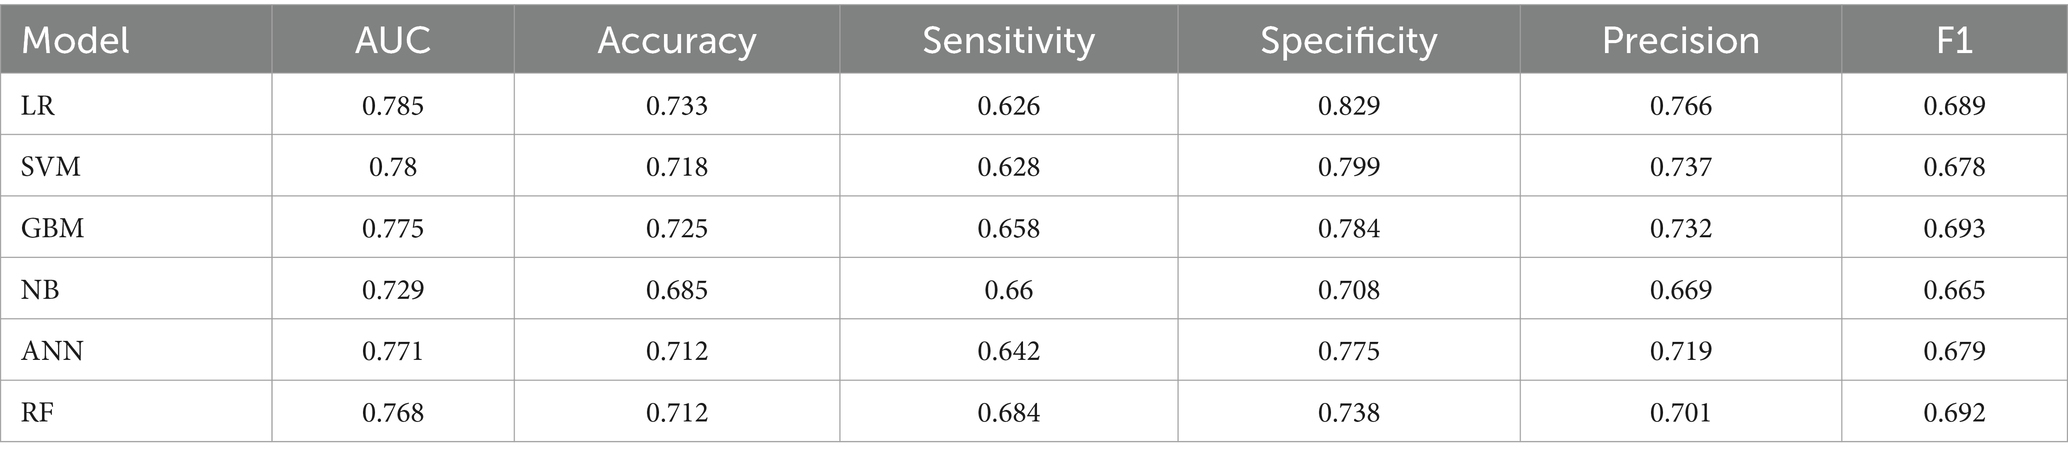
Table 2. Comparison of the predictive power of several models in the test set.
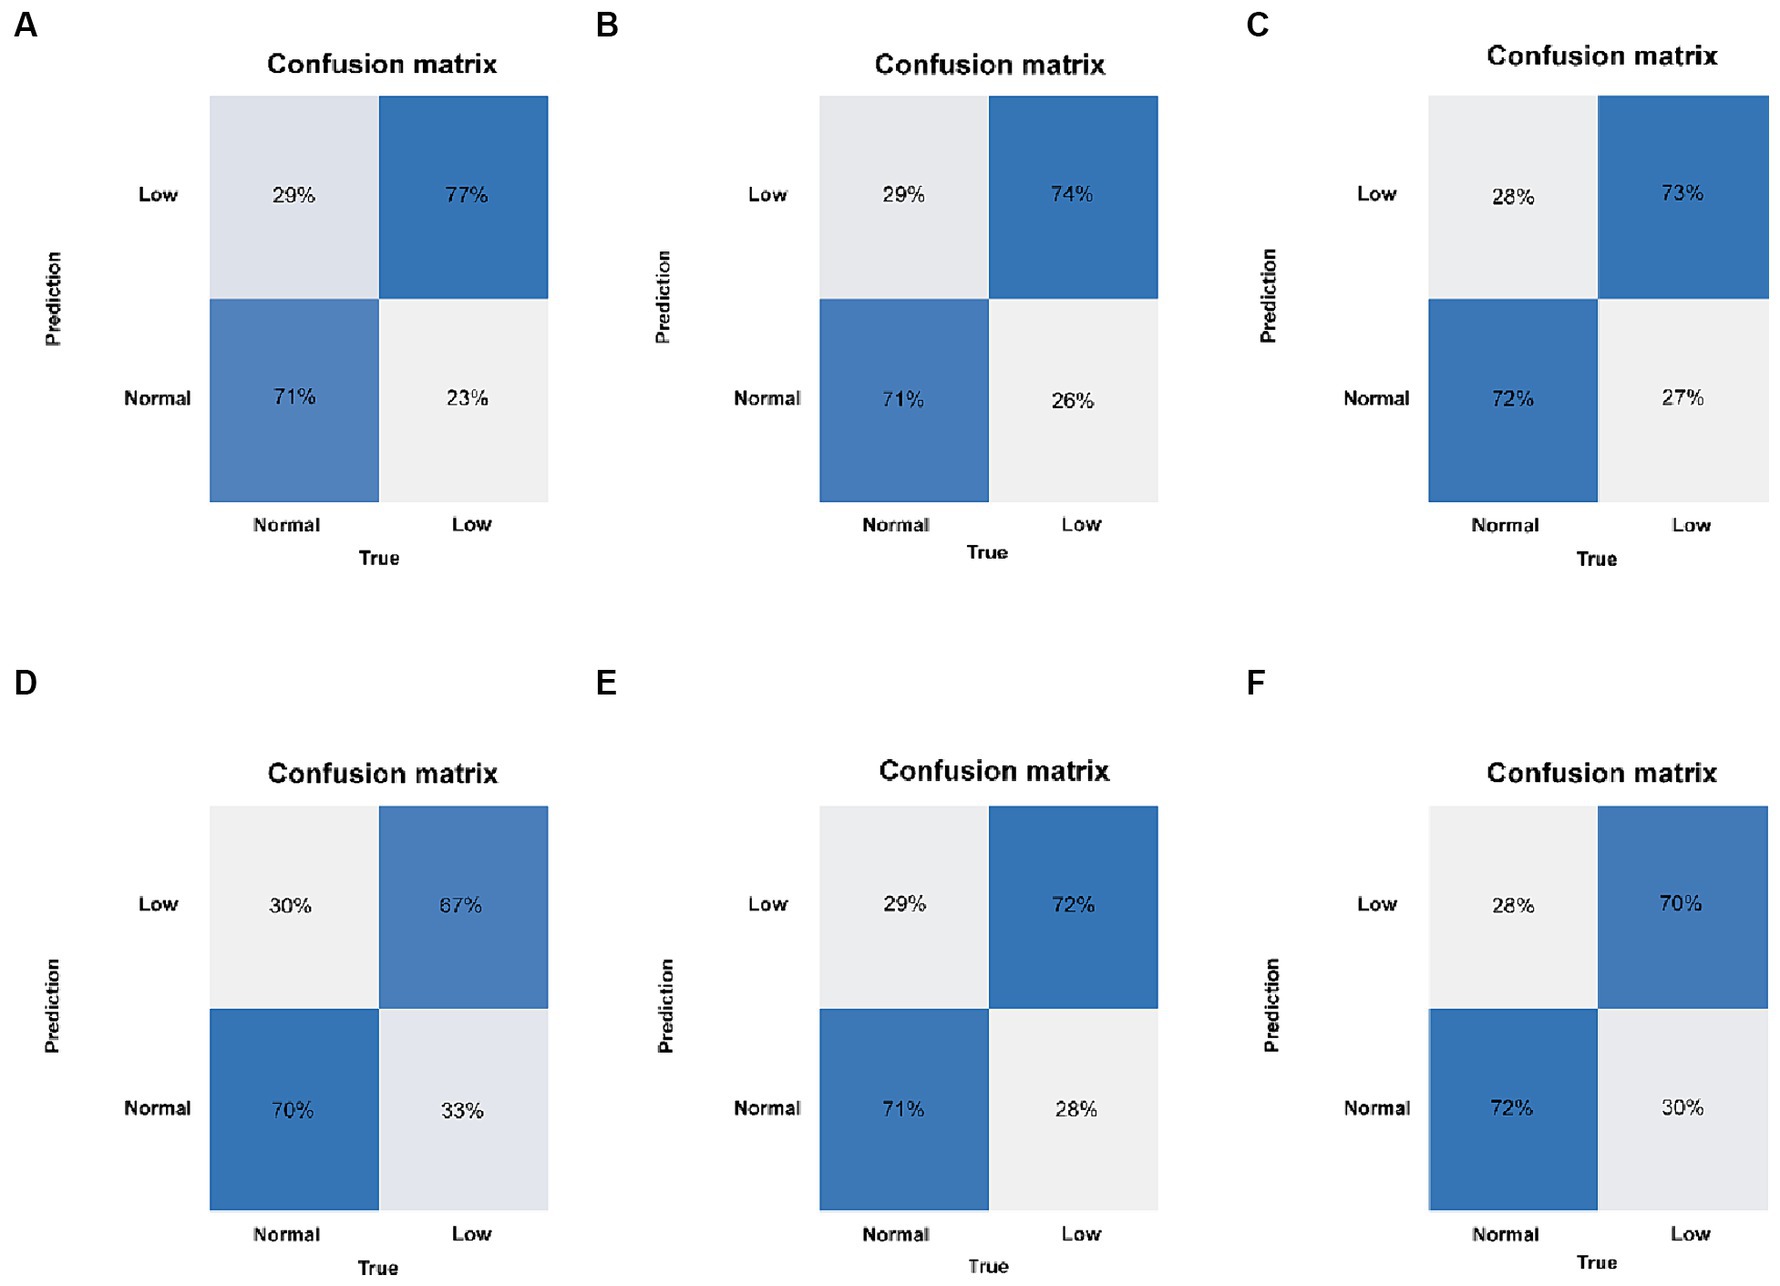
Figure 4. Confusion matrix of the six models in the test set. (A) LR, logistic regression. (B) SVM, support vector machine. (C) GBM, gradient boosting machine. (D) NB, naive Bayesian. (E) ANN, artificial neural network. (F) RF, random forest.
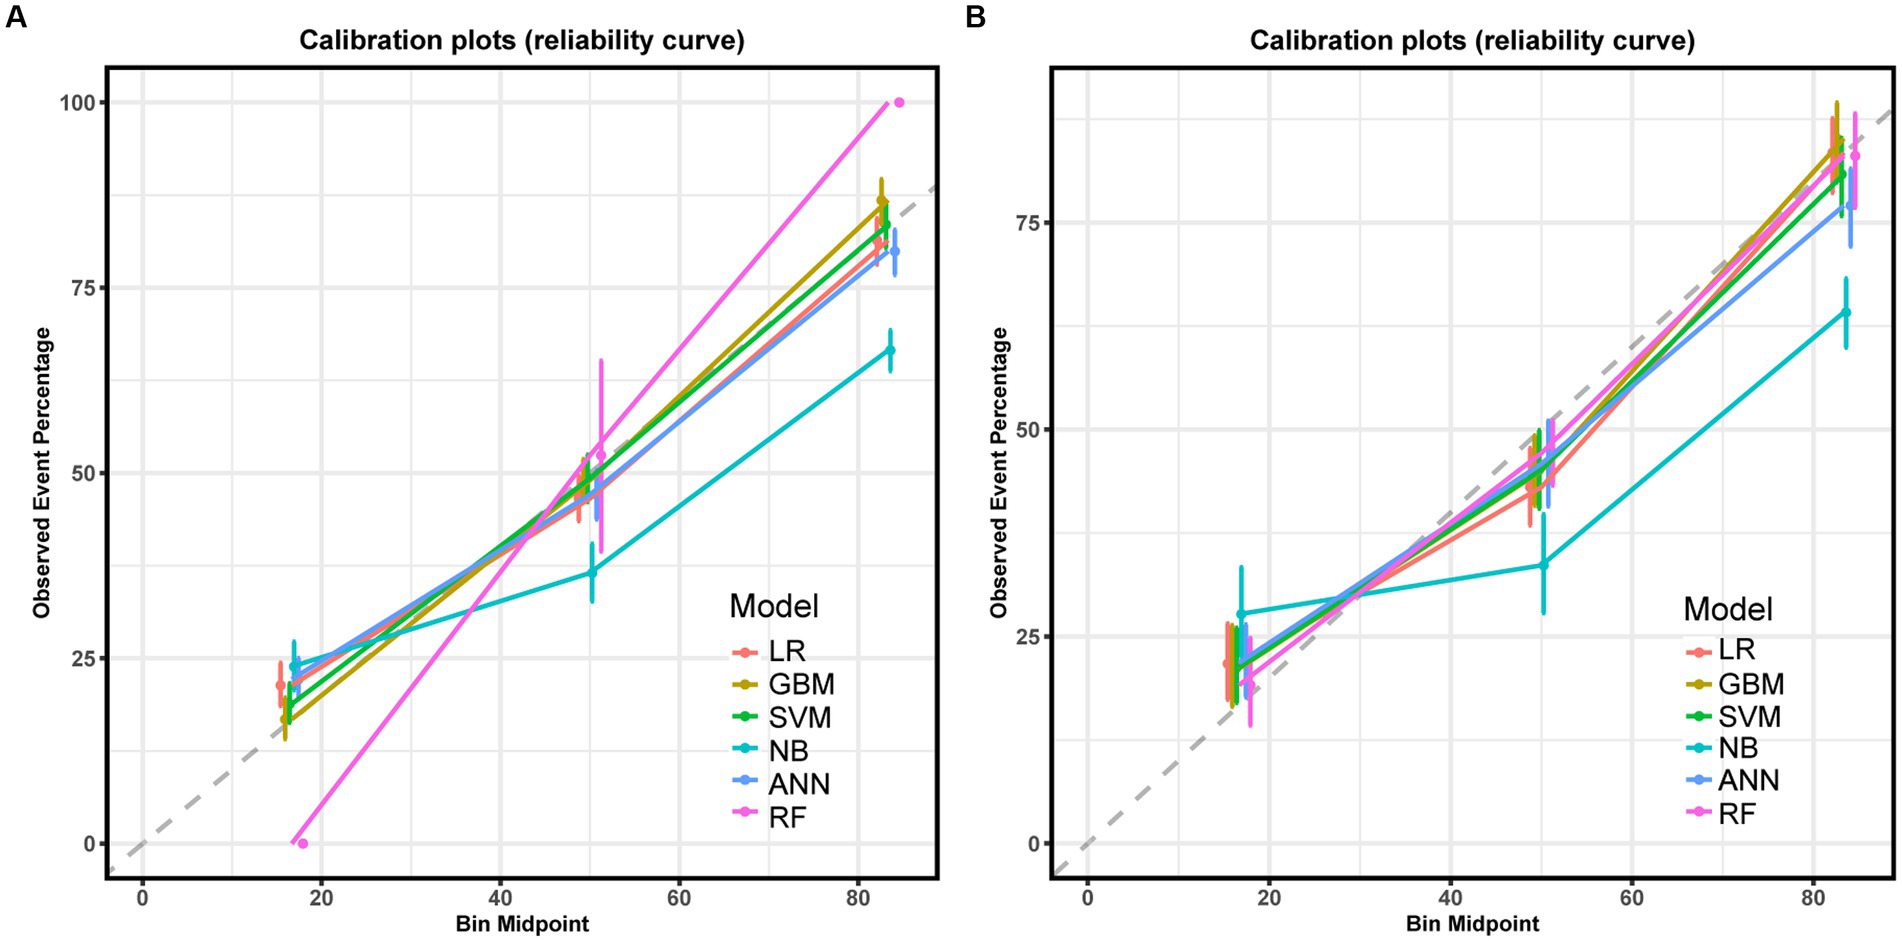
Figure 5. Calibration curve for the six models in the training set (A) and test set (B).
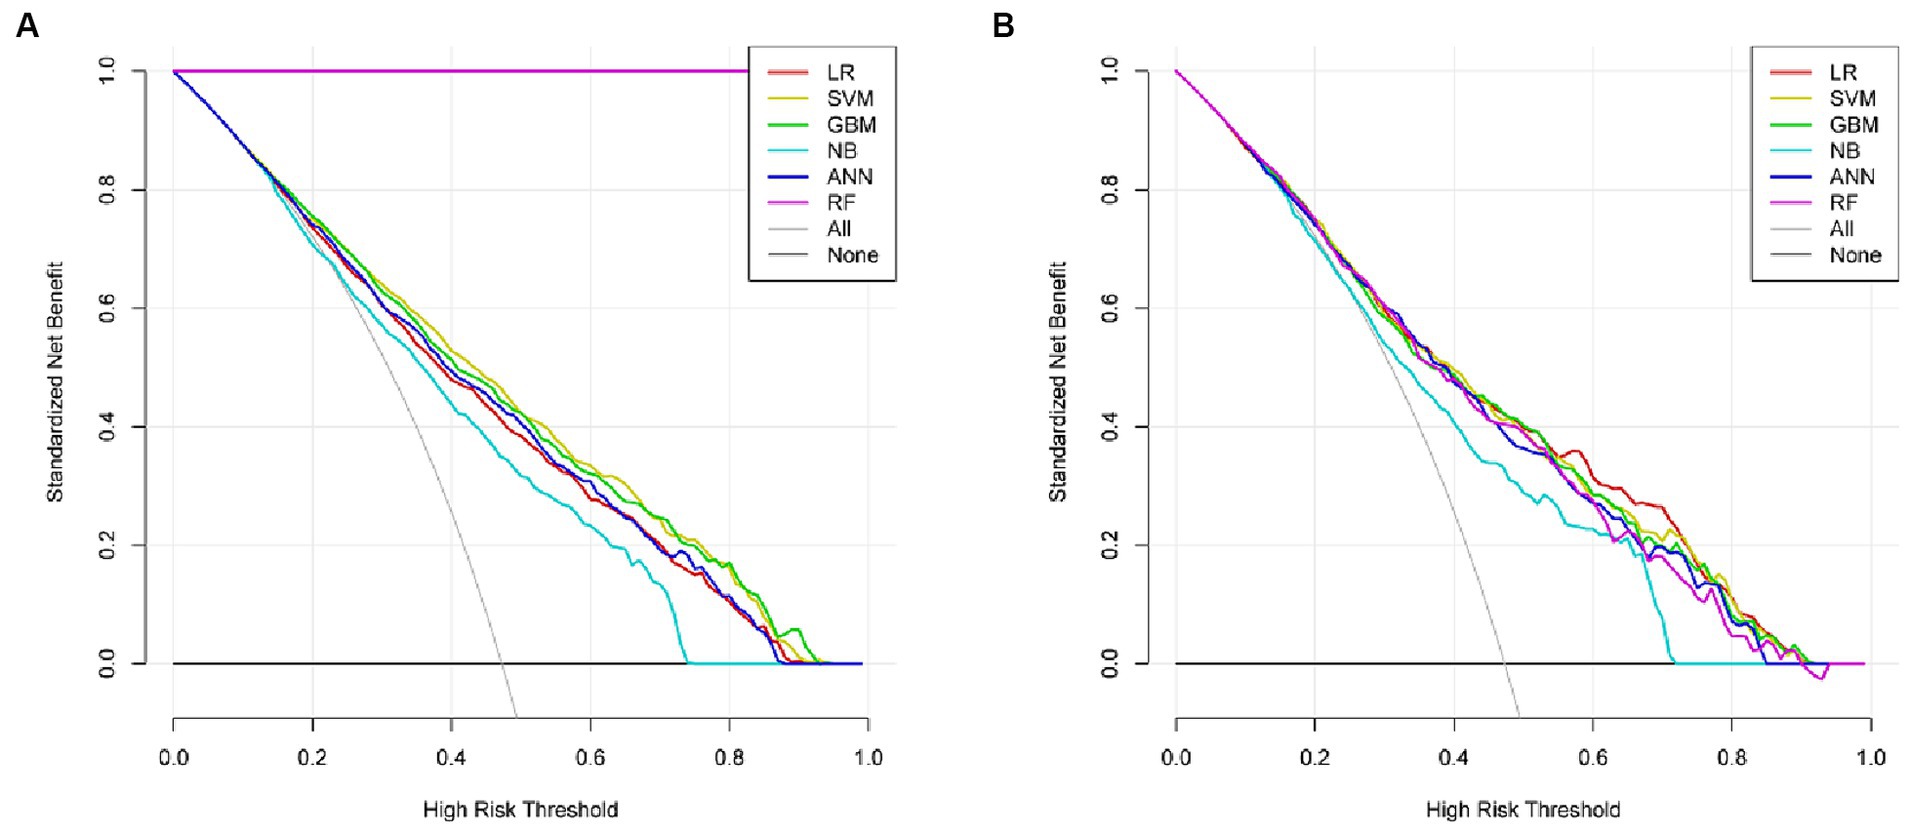
Figure 6. Decision curves for the six models in the training set (A) and test set (B).
We interpreted the importance of predictor variables based on the SHAP algorithm for the LR model with the best predictive performance (Figure 7). The extent to which a variable contributes to the model is reflected by the SHAP value. A higher SHAP value of a variable means a higher degree of its contribution to the model (26). As shown in Figure 7A, the top-down ordering of the variables means that their contribution to low BMD is in ascending order, with the line with a SHAP value of 0 as the vertical axis, the variables with red color on the right side of the line represent the positive contribution of the variable to the predicted outcome, while the variables with blue color on the right side of the line have a negative contribution. Therefore, the top six variables in terms of importance for predicting low bone mass in the population were: age > BMI > gender > creatine phosphokinase > total cholesterol > alkaline phosphatase, in which age, total cholesterol, and alkaline phosphatase were positively correlated with the occurrence of low bone mineral density, i.e., the older the age, the higher the indexes of total cholesterol and alkaline phosphatase, and the higher the probability of developing low bone mineral density. BMI, gender, and creatine phosphokinase were negatively correlated with the occurrence of low BMD, i.e., the lower the BMI, the female, and the lower the creatine phosphokinase index, the higher the probability of low BMD. Given that age was the variable with the highest variable importance in the model of this study, we explored the effect of age on the occurrence of low BMD as well as other blood biochemical indices. Comparison of the study subjects divided into groups with a cutoff of 5 years of age revealed that most of the blood biochemical indices were significantly associated with age (Supplementary Table S2). Their associations were further explored by applying restricted cubic spline (RCS), and age was found to be linearly related to the occurrence of low BMD, with the older the age, the higher the risk of low BMD (Supplementary Figure S1). Among the blood biochemical indices, except for Alkaline Phosphatase (ALP), Mean cell volume, Segmented neutrophils percent, and Total Cholesterol, all of them showed a linear trend with age (Supplementary Figure S2).
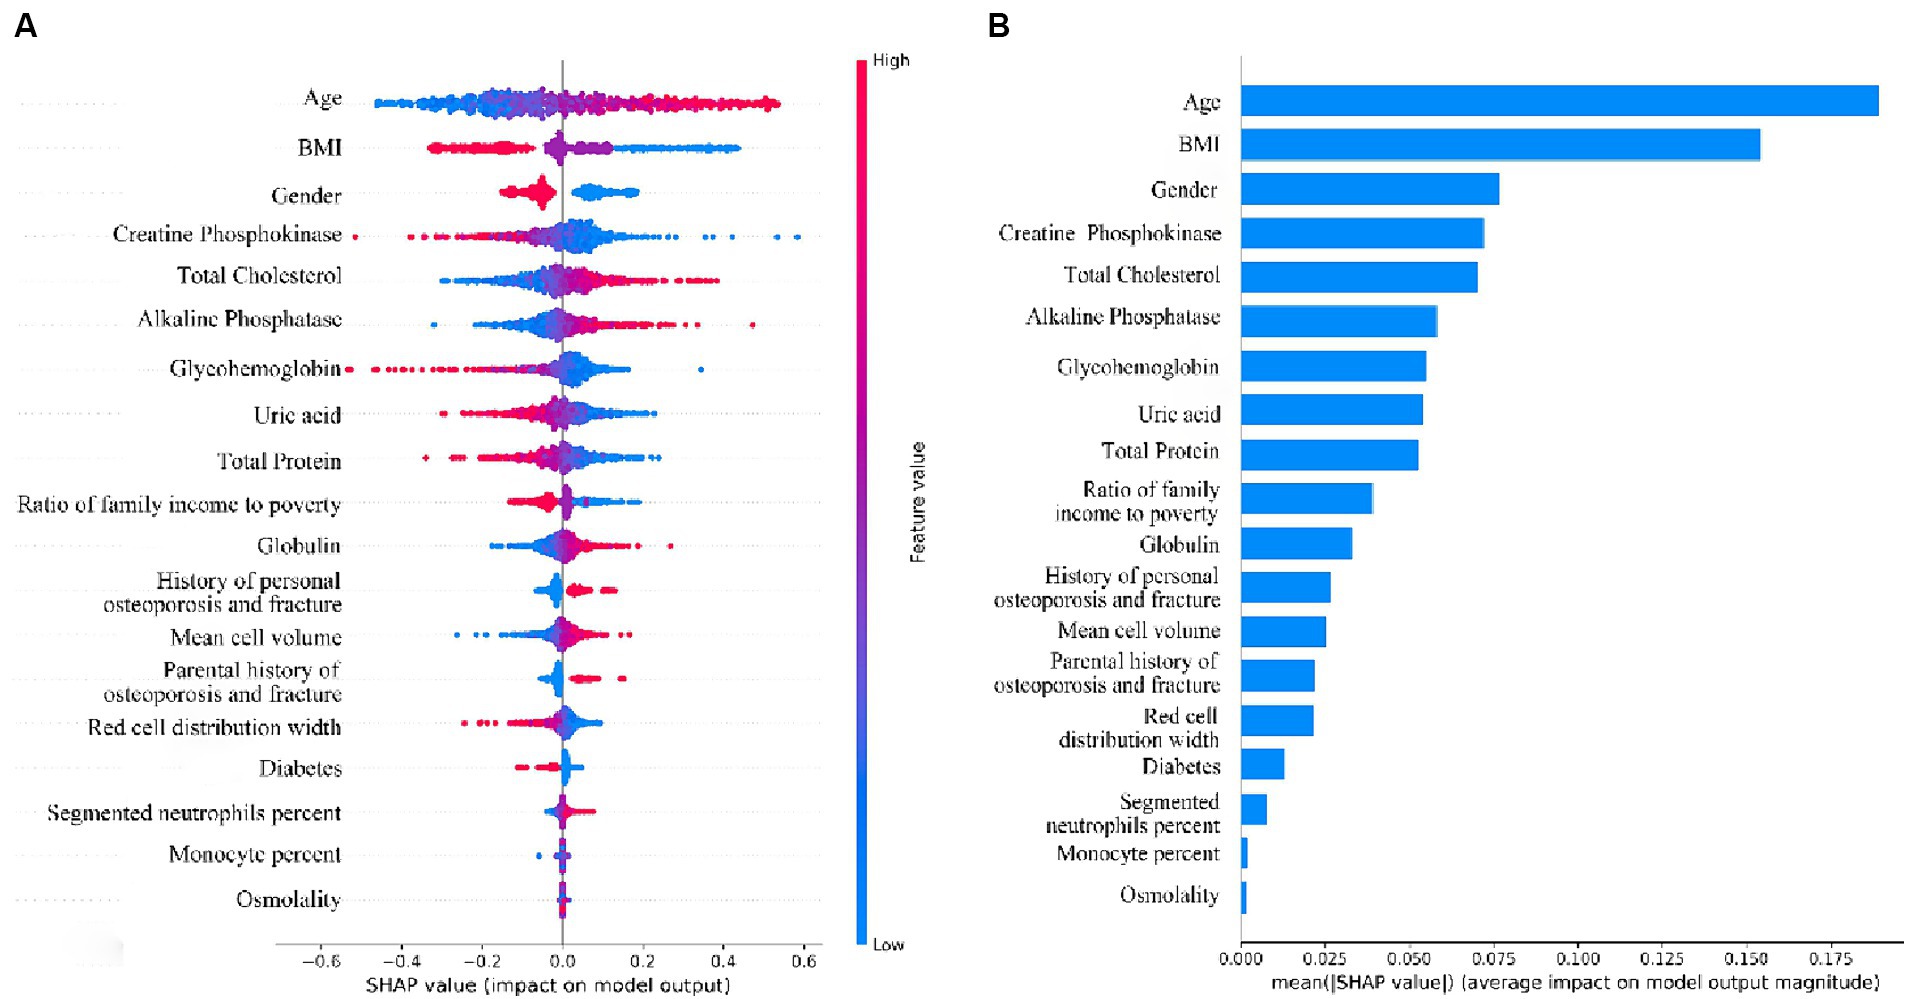
Figure 7. (A) Beeswarm plots of the LR Model. Generate SHAP values for each variable and reveal its relationship with low bone density. (B) Importance ranking plot of variables for LR model.
With the aging of the population worldwide in recent years, the incidence of osteoporosis in older adult/adults men and women remains high, and fractures caused by osteoporosis can lead to disability, prolonged bed rest, impaired function, and even death, bringing serious economic and physical and psychological burdens to the affected families as well as to individuals (27). Some studies have shown that early diagnosis and intervention for patients with osteopenia and osteoporosis can effectively reduce their fracture incidence (28), so we developed several machine learning algorithms to identify abnormal bone density in the population with osteopenia and osteoporosis. In medical research, the collection of clinical data is difficult and the collected data are heterogeneous and non-standardized, while public databases such as SEER, MIMIC, and NHANES have the advantages of large amount of data and richness of the information contained in them, and thus they are widely favored by researchers (29). Many previous studies (30–32) have applied machine learning algorithms to mine public databases and achieved good prediction results. Our study included 3,545 participants with complete femoral neck BMD measurements from 2017 to 2020 from the National Household Nutrition and Exercise Survey (NHANES) database, which were divided into a training set and a test set according to the ratio of 7:3, with 2,841 participants in the training set and 1,064 participants in the test set, and the data from the training set were analyzed by using demographic factors, blood biochemical indices, and questionnaire information, which are clinically readily available variables, six common supervised machine learning models were built using the training set data and the model performance was tested with the test set data, and the model with the best predictive performance, LR, was finally selected based on the ROC curves, calibration curves, decision curves, confusion matrices, as well as model performance evaluation indexes, such as accuracy and sensitivity, etc. It is worth noting that the performances of the three models, GBM, SVM, and ANN, are also very well. Especially in the training set (Table 3), the AUC values of SVM (AUC = 0.804), GBM (AUC = 0.799), and ANN (AUC = 0.784) even exceed that of LR (AUC = 0.775), and it can be seen from the calibration curves and the decision curves of the training set that the fit of the calibration curves of GBM and SVM is better than that of LR, and ANN is on a par with LR. The decision curve performance of GBM, SVM and ANN is also better than that of LR. The ability of two models, RF and NB, to predict the population with low bone density is relatively weak. RF has an overfitting problem in the training set, and in the test set, although the calibration curves fit the ideal curves better, the AUC value is low, and the model’s differentiation is average. Several model evaluation indexes of NB are lower in the training set and the test set. The model’s ROC curve, calibration curve, and decision curve are poor compared to the rest of the models, and the predictive ability is the weakest among the six models.
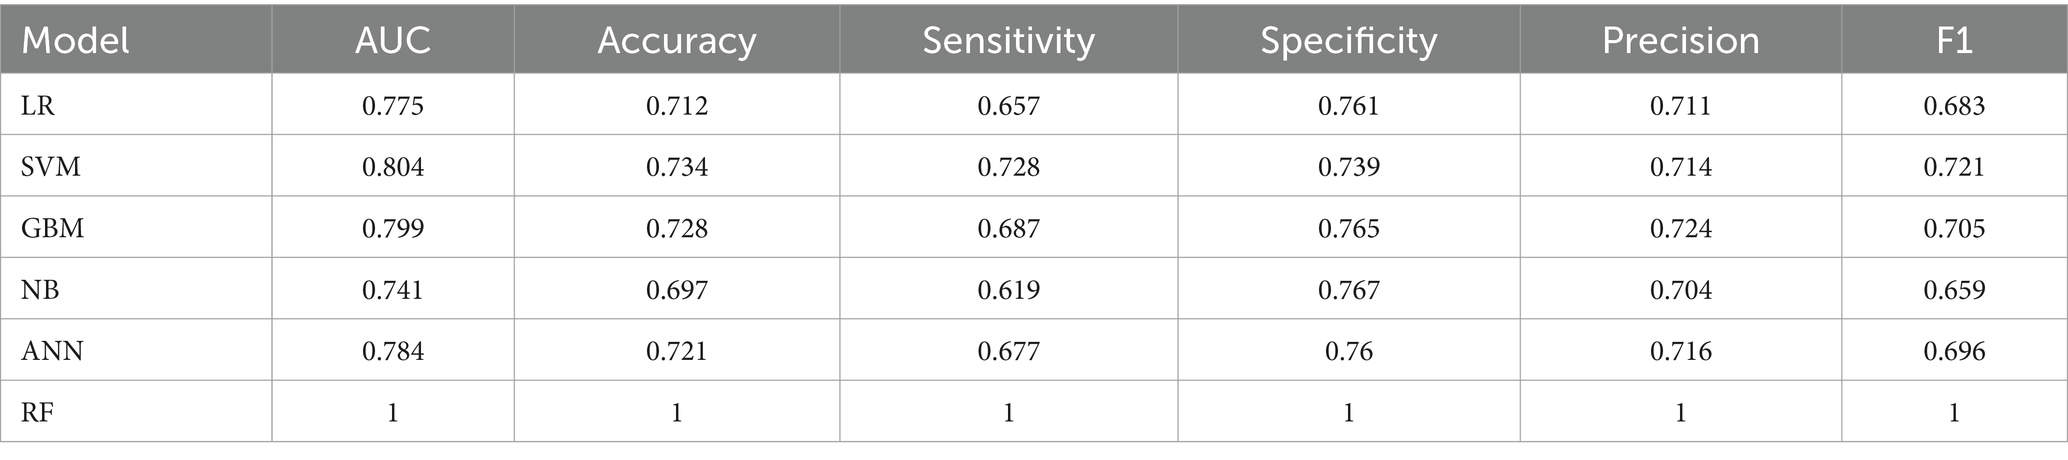
Table 3. Comparison of the predictive ability of several models in the training set.
We analyzed the variable importance of the 19 independent variables included in the model through the SHAP framework, and found that the top three variables in terms of importance were age, BMI, and gender, and that older age, lower BMI, and female gender were risk factors for lower BMD. In previous studies, age and gender have been recognized as established risk factors for osteoporosis (33, 34), especially in women, after menopause, the level of estrogen in the body decreases, and BMD decreases, and the prevalence of osteoporosis rises dramatically, so that women over the age of 50 years are often a priority population for osteoporosis screening (35). Whereas the relationship between BMI and BMD is unclear, a two-sample Mendelian randomization study showed a positive causal association between BMI and BMD levels (36); a meta-analysis that included 108 studies showed that the risk of osteoporosis in people with low BMI was 2.76 times higher than that in people with high BMI (6), which are in keeping with the conclusions we have drawn. However, a prospective study concluded that the contribution of BMI to fragility fractures varies by gender and by skeletal site, with a more complex association between the two (37). Therefore, further exploration of the relationship between BMI and BMD is warranted.
Among the blood biochemical indices, the three variables that contribute most to low BMD are creatine phosphokinase, total cholesterol, and alkaline phosphatase, where the higher the two indices of total cholesterol and alkaline phosphatase, the higher the likelihood of lower BMD, and the opposite is true of creatine phosphokinase, where the lower the value, the higher the likelihood of lower BMD. Creatine phosphokinase (CPK), also known as creatine kinase (CK), plays an important role in cellular energy metabolism, and fewer studies have been conducted on the association between CK and BMD. A retrospective and prospective cohort study found that the group with a history of previous fracture had a higher level of CK values than the group without a history of fracture, and the group that presented with a new fracture also had a higher level than the group that did not present with a fracture, which is contrary to our opinion, but the study was only conducted on young female athletes, which has some limitations, and the number of subjects was small, so this conclusion also needs to be further confirmed (38). Alkaline phosphatase is a bone turnover marker that is widely found in bone, liver, and intestine and plays an important role in bone growth and metabolism (39). Previous studies have shown that higher ALP levels are positively associated with low BMD or osteoporosis, which is consistent with the conclusions we have drawn, probably because alkaline phosphatase activity is increased when skeletal disease is present to meet the demands of bone growth and reconstruction (40, 41). There is no clear consensus on the relationship between total cholesterol and BMD, and most studies agree with us (42–44) that there is a negative correlation between the two, however, there are also studies that take the opposite view (40), and a cross-sectional study from China found that the associations were very different in men and women, with TC positively correlated with BMD in men and In women, the association was U-shaped, with curve inflection points varying by age and BMI (45). Therefore, the association and mechanisms between TC and BMD need to be explored in further studies.
The present study also has some limitations. First, in the NHANES database, those who participated in BMD measurement by dual-energy X-ray absorptiometry were older than 50 years, and nowadays there is a trend of younger age for both osteoporosis and bone loss (46), so screening should not be limited to the middle-aged and older population. Second, our study is based on the U.S. NHANES database, which, although covering multiple races in the U.S., may have limitations when applied to other racial or national populations. Therefore, data from different countries and regions will be collected and analyzed in the future to increase the generalizability of the model. Third, although several variables such as demographic and blood biochemical indicators were included in this study, there are many factors that were not included in the study, such as lifestyle, dietary habits, genomic data, and imaging data, which are also closely related to BMD. It is hoped that more data such as these will be included in future studies to further improve the accuracy of the model and expand its scope of application. Fourth, with the rapid development of the field of artificial intelligence, new algorithms such as deep learning algorithms (47, 48) and image recognition technology (49) are constantly emerging. In addition, more and more research tends to explore diseases from the perspective of pathogenic mechanisms (50) and drug development (51), and we are looking forward to making more progress in these areas in the future.
In this study, we applied six machine learning algorithms to construct a prediction model for low bone mass based on clinically accessible metrics in the NHANES database, and used 10-fold cross-validation to internally validate the model and NHANES data from different time periods to input into the model as an external validation, applying multiple metrics to evaluate the model performance, and finally selecting the best predictive performance of the ML model, LR. The model can screen out people osteopenia and osteoporosis, and assist clinicians in making decisions to better realize the primary and secondary prevention of osteoporosis.
The original contributions presented in the study are included in the article/Supplementary material, further inquiries can be directed to the corresponding authors.
The NHANES protocols and studies involving human participants were reviewed and approved by NCHS Research Ethics Review Board. The patients/participants provided their written informed consent to participate in this study.
RX: Conceptualization, Data curation, Methodology, Software, Writing – original draft. YC: Data curation, Software, Writing – review & editing. ZY: Methodology, Writing – review & editing. WW: Data curation, Writing – review & editing. JC: Validation, Writing – review & editing. RW: Software, Writing – review & editing. YD: Methodology, Writing – review & editing. CJ: Data curation, Writing – review & editing. ZH: Supervision, Writing – review & editing. XL: Supervision, Writing – review & editing.
The author(s) declare that financial support was received for the research, authorship, and/or publication of this article. This study was supported by the Foundation of Liaoning Province Education Administration (No. LJKZ0849).
The authors declare that the research was conducted in the absence of any commercial or financial relationships that could be construed as a potential conflict of interest.
All claims expressed in this article are solely those of the authors and do not necessarily represent those of their affiliated organizations, or those of the publisher, the editors and the reviewers. Any product that may be evaluated in this article, or claim that may be made by its manufacturer, is not guaranteed or endorsed by the publisher.
The Supplementary material for this article can be found online at: https://www.frontiersin.org/articles/10.3389/fpubh.2024.1347219/full#supplementary-material
1. Sözen, T, Özışık, L, and Başaran, NÇ. An overview and management of osteoporosis. Eur J Rheumatol. (2017) 4:46–56. doi: 10.5152/eurjrheum.2016.048
2. Ma, M, Ma, Z, He, Y, Sun, H, Yang, B, Ruan, B, et al. Efficacy of vitamin K2 in the prevention and treatment of postmenopausal osteoporosis: a systematic review and meta-analysis of randomized controlled trials. Front Public Health. (2022) 10:979649. doi: 10.3389/fpubh.2022.979649
3. Haoqiang, H, Feng, X, Feng, Y, Peng, Z, Jiao, C, Chen, H, et al. Bone-targeting HUVEC-derived exosomes containing miR-503-5p for osteoporosis therapy|ACS applied Nano materials. Available at: https://pubs.acs.org/doi/abs/10.1021/acsanm.3c05056 (Accessed March 20, 2024).
4. Li, G, Thabane, L, Papaioannou, A, Ioannidis, G, Levine, MAH, and Adachi, JD. An overview of osteoporosis and frailty in the elderly. BMC Musculoskelet Disord. (2017) 18:46. doi: 10.1186/s12891-017-1403-x
5. Clynes, MA, Harvey, NC, Curtis, EM, Fuggle, NR, Dennison, EM, and Cooper, C. The epidemiology of osteoporosis. Br Med Bull. (2020) 133:105–17. doi: 10.1093/bmb/ldaa005
6. Xiao, P-L, Cui, A-Y, Hsu, C-J, Peng, R, Jiang, N, Xu, X-H, et al. Global, regional prevalence, and risk factors of osteoporosis according to the World Health Organization diagnostic criteria: a systematic review and meta-analysis. Osteoporos Int. (2022) 33:2137–53. doi: 10.1007/s00198-022-06454-3
7. Borgström, F, Karlsson, L, Ortsäter, G, Norton, N, Halbout, P, Cooper, C, et al. Fragility fractures in Europe: burden, management and opportunities. Arch Osteoporos. (2020) 15:59. doi: 10.1007/s11657-020-0706-y
8. Papadopoulou, SK, Papadimitriou, K, Voulgaridou, G, Georgaki, E, Tsotidou, E, Zantidou, O, et al. Exercise and nutrition impact on osteoporosis and sarcopenia—the incidence of Osteosarcopenia: a narrative review. Nutrients. (2021) 13:4499. doi: 10.3390/nu13124499
9. Lorente-Ramos, R, Azpeitia-Armán, J, Muñoz-Hernández, A, García-Gómez, JM, Díez-Martínez, P, Grande-Bárez, M, et al. Dual-energy X-ray absorptiometry in the diagnosis of osteoporosis: a practical guide. Am J Roentgenol. (2012) 196:897–904. doi: 10.2214/AJR.10.5416
10. Wong, CP, Gani, LU, and Chong, LR. Dual-energy X-ray absorptiometry bone densitometry and pitfalls in the assessment of osteoporosis: a primer for the practicing clinician. Arch Osteoporos. (2020) 15:135. doi: 10.1007/s11657-020-00808-2
11. Looker, AC, Melton, LJ, Harris, TB, Borrud, LG, and Shepherd, JA. Prevalence and trends in low femur bone density among older US adults: NHANES 2005–2006 compared with NHANES III. J Bone Miner Res. (2010) 25:64–71. doi: 10.1359/jbmr.090706
12. Huang, C, and Li, S. Association of blood neutrophil lymphocyte ratio in the patients with postmenopausal osteoporosis. Pak J Med Sci. (2016) 32:762–5. doi: 10.12669/pjms.323.10292
13. Ye, X, Jiang, H, Wang, Y, Ji, Y, and Jiang, X. A correlative studies between osteoporosis and blood cell composition. Medicine (Baltimore). (2020) 99:e20864. doi: 10.1097/MD.0000000000020864
14. Fang, H, Zhang, H, Wang, Z, Zhou, Z, Li, Y, and Lu, L. Systemic immune-inflammation index acts as a novel diagnostic biomarker for postmenopausal osteoporosis and could predict the risk of osteoporotic fracture. J Clin Lab Anal. (2020) 34:e23016. doi: 10.1002/jcla.23016
15. Goecks, J, Jalili, V, Heiser, LM, and Gray, JW. How machine learning will transform biomedicine. Cell. (2020) 181:92–101. doi: 10.1016/j.cell.2020.03.022
16. Polevikov, S . Advancing AI in healthcare: a comprehensive review of best practices. Clin Chim Acta. (2023) 548:117519. doi: 10.1016/j.cca.2023.117519
17. Ahluwalia, N, Dwyer, J, Terry, A, Moshfegh, A, and Johnson, C. Update on NHANES dietary data: focus on collection, release, analytical considerations, and uses to inform public policy12. Adv Nutr. (2016) 7:121–34. doi: 10.3945/an.115.009258
18. Weng, S-F, Hsu, H-R, Weng, Y-L, Tien, K-J, and Kao, H-Y. Health-related quality of life and medical resource use in patients with osteoporosis and depression: a cross-sectional analysis from the National Health and nutrition examination survey. Int J Environ Res Public Health. (2020) 17:1124. doi: 10.3390/ijerph17031124
19. Xia, F, Li, Q, Luo, X, and Wu, J. Identification for heavy metals exposure on osteoarthritis among aging people and machine learning for prediction: a study based on NHANES 2011-2020. Front Public Health. (2022) 10:906774. doi: 10.3389/fpubh.2022.906774
20. Looker, AC, Orwoll, ES, Johnston, CC, Lindsay, RL, Wahner, HW, Dunn, WL, et al. Prevalence of low femoral bone density in older U.S. adults from NHANES III. J Bone Miner Res Off J Am Soc Bone Miner Res. (1997) 12:1761–8. doi: 10.1359/jbmr.1997.12.11.1761
21. Hou, W, Chen, S, Zhu, C, Gu, Y, Zhu, L, and Zhou, Z. Associations between smoke exposure and osteoporosis or osteopenia in a US NHANES population of elderly individuals. Front Endocrinol. (2023) 14:1074574. doi: 10.3389/fendo.2023.1074574
22. Liu, J, Chou, EL, Lau, KK, Woo, PYM, Li, J, and Chan, KHK. Machine learning algorithms identify demographics, dietary features, and blood biomarkers associated with stroke records. J Neurol Sci. (2022) 440:120335. doi: 10.1016/j.jns.2022.120335
23. Hu, C, Li, L, Huang, W, Wu, T, Xu, Q, Liu, J, et al. Interpretable machine learning for early prediction of prognosis in Sepsis: a discovery and validation study. Infect Dis Ther. (2022) 11:1117–32. doi: 10.1007/s40121-022-00628-6
24. Tibshirani, R . Regression shrinkage and selection via the Lasso. J R Stat Soc Ser B Methodol. (1996) 58:267–88. doi: 10.1111/j.2517-6161.1996.tb02080.x
25. Choi, RY, Coyner, AS, Kalpathy-Cramer, J, Chiang, MF, and Campbell, JP. Introduction to machine learning, neural networks, and deep learning. Transl Vis Sci Technol. (2020) 9:14. doi: 10.1167/tvst.9.2.14
26. Lundberg, SM, and Lee, S-I. A unified approach to interpreting model predictions. Advances in Neural Information Processing Systems. Curran Associates, Inc. (2017) Available at: (https://proceedings.neurips.cc/paper/2017/hash/8a20a8621978632d76c43dfd28b67767-Abstract.html)
27. Barnsley, J, Buckland, G, Chan, PE, Ong, A, Ramos, AS, Baxter, M, et al. Pathophysiology and treatment of osteoporosis: challenges for clinical practice in older people. Aging Clin Exp Res. (2021) 33:759–73. doi: 10.1007/s40520-021-01817-y
28. Karaguzel, G, and Holick, MF. Diagnosis and treatment of osteopenia. Rev Endocr Metab Disord. (2010) 11:237–51. doi: 10.1007/s11154-010-9154-0
29. Wu, W-T, Li, Y-J, Feng, A-Z, Li, L, Huang, T, Xu, A-D, et al. Data mining in clinical big data: the frequently used databases, steps, and methodological models. Mil Med Res. (2021) 8:44. doi: 10.1186/s40779-021-00338-z
30. Lee, C, and Kim, H. Machine learning-based predictive modeling of depression in hypertensive populations. PLoS One. (2022) 17:e0272330. doi: 10.1371/journal.pone.0272330
31. Feng, X, Hong, T, Liu, W, Xu, C, Li, W, Yang, B, et al. Development and validation of a machine learning model to predict the risk of lymph node metastasis in renal carcinoma. Front Endocrinol. (2022) 13:1054358. doi: 10.3389/fendo.2022.1054358
32. Yue, S, Li, S, Huang, X, Liu, J, Hou, X, Zhao, Y, et al. Machine learning for the prediction of acute kidney injury in patients with sepsis. J Transl Med. (2022) 20:215. doi: 10.1186/s12967-022-03364-0
33. Kelsey, JL . Risk factors for osteoporosis and associated fractures. Public Health Rep. (1989) 104:14–20.
34. Farmer, ME, White, LR, Brody, JA, and Bailey, KR. Race and sex differences in hip fracture incidence. Am J Public Health. (1984) 74:1374–80. doi: 10.2105/AJPH.74.12.1374
35. Wang, Y, Tao, Y, and Hyman, ME. Osteoporosis in China|Osteoporosis International. (2009) 20:1651–1662. https://link.springer.com/article/10.1007/s00198-009-0925-y (Accessed November 28, 2023).
36. Song, J, Zhang, R, Lv, L, Liang, J, Wang, W, Liu, R, et al. The relationship between body mass index and bone mineral density: a Mendelian randomization study. Calcif Tissue Int. (2020) 107:440–5. doi: 10.1007/s00223-020-00736-w
37. Holmberg, AH, Johnell, O, Nilsson, PM, Nilsson, J, Berglund, G, and Åkesson, K. Risk factors for fragility fracture in middle age. A prospective population-based study of 33,000 men and women. Osteoporos Int. (2006) 17:1065–77. doi: 10.1007/s00198-006-0164-4
38. Miyamoto, T, Oguma, Y, Sato, Y, Kobayashi, T, Ito, E, Tani, M, et al. Elevated Creatine kinase and lactic acid dehydrogenase and decreased osteocalcin and uncarboxylated osteocalcin are associated with bone stress injuries in young female athletes. Sci Rep. (2018) 8:18019. doi: 10.1038/s41598-018-36982-0
39. Radisson, J, Angrand, M, Chavassjeux, P, Roux, B, and Azzar, G. Differential solubilization of osteoblastic alkaline phosphatase from human primary bone cell cultures. Int J Biochem Cell Biol. (1996) 28:421–30. doi: 10.1016/1357-2725(95)00160-3
40. Biver, E, Chopin, F, Coiffier, G, Brentano, TF, Bouvard, B, Garnero, P, et al. Bone turnover markers for osteoporotic status assessment? A systematic review of their diagnosis value at baseline in osteoporosis. Joint Bone Spine. (2012) 79:20–5. doi: 10.1016/j.jbspin.2011.05.003
41. Migliorini, F, Maffulli, N, Spiezia, F, Tingart, M, Maria, PG, and Riccardo, G. Biomarkers as therapy monitoring for postmenopausal osteoporosis: a systematic review. J Orthop Surg. (2021) 16:318. doi: 10.1186/s13018-021-02474-7
42. Fang, W, Peng, P, Xiao, F, He, W, Wei, Q, and He, M. A negative association between total cholesterol and bone mineral density in US adult women. Front Nutr. (2022) 9:937352. doi: 10.3389/fnut.2022.937352
43. Sun, C, Zhu, B, Zhu, S, Zhang, L, Du, X, and Tan, X. Risk factors analysis of bone mineral density based on Lasso and quantile regression in America during 2015–2018. Int J Environ Res Public Health. (2021) 19:355. doi: 10.3390/ijerph19010355
44. Chen, Y-Y, Wang, W-W, Yang, L, Chen, W-W, and Zhang, H-X. Association between lipid profiles and osteoporosis in postmenopausal women: a meta-analysis. Eur Rev Med Pharmacol Sci. (2018) 22:1–9. doi: 10.26355/eurrev_201801_14093
45. Sun, Y, Qi, X, Lin, X, Zhou, Y, Lv, X, Zhou, J, et al. Association between total cholesterol and lumbar bone density in Chinese: a study of physical examination data from 2018 to 2023. Lipids Health Dis. (2023) 22:180. doi: 10.1186/s12944-023-01946-5
46. Strøm Rönnquist, S, Viberg, B, Kristensen, MT, Palm, H, Jensen, J-EB, Madsen, CF, et al. Frailty and osteoporosis in patients with hip fractures under the age of 60—a prospective cohort of 218 individuals. Osteoporos Int. (2022) 33:1037–55. doi: 10.1007/s00198-021-06281-y
47. Xie, Y, Wu, X, Huang, X, Liang, Q, Deng, S, Wu, Z, et al. A deep learning-enabled skin-inspired pressure sensor for complicated recognition tasks with Ultralong life. Research. (2023). 6:0157. doi: 10.34133/research.0157
48. Chen, H, Liu, Y, Balabani, S, Hirayama, R, and Huang, J. Machine learning in predicting printable biomaterial formulations for direct ink writing. Research. (2023). 6:197. doi: 10.34133/research.0197
49. Zhang, H, Lv, G, Liu, S, Liu, D, and Wu, X. The artificial intelligence watcher predicts cancer risk by facial features. Tradit Med Res. (2022) 7:1. doi: 10.53388/TMR20211227255
50. Li, N, Hamor, C, An, Y, Zhu, L, Gong, Y, Toh, Y, et al. Biological functions and therapeutic potential of acylation by histone acetyltransferases. Acta Mater Medica. (2023) 2:228–254. doi: 10.15212/AMM-2023-0010
Keywords: low bone density, osteoporosis, machine learning, blood biochemical indicators, National Health and Nutrition Examination Survey
Citation: Xu R, Chen Y, Yao Z, Wu W, Cui J, Wang R, Diao Y, Jin C, Hong Z and Li X (2024) Application of machine learning algorithms to identify people with low bone density. Front. Public Health. 12:1347219. doi: 10.3389/fpubh.2024.1347219
Edited by:
Xiaolei Liu, Sichuan University, ChinaReviewed by:
Zhiwen Luo, Fudan University, ChinaCopyright © 2024 Xu, Chen, Yao, Wu, Cui, Wang, Diao, Jin, Hong and Li. This is an open-access article distributed under the terms of the Creative Commons Attribution License (CC BY). The use, distribution or reproduction in other forums is permitted, provided the original author(s) and the copyright owner(s) are credited and that the original publication in this journal is cited, in accordance with accepted academic practice. No use, distribution or reproduction is permitted which does not comply with these terms.
*Correspondence: Zhijun Hong, aGFwcHlkYXkyNDZAMTYzLmNvbQ==; Xiaofeng Li, bHhmX2NoZW5AZG11LmVkdS5jbg==
Disclaimer: All claims expressed in this article are solely those of the authors and do not necessarily represent those of their affiliated organizations, or those of the publisher, the editors and the reviewers. Any product that may be evaluated in this article or claim that may be made by its manufacturer is not guaranteed or endorsed by the publisher.
Research integrity at Frontiers
Learn more about the work of our research integrity team to safeguard the quality of each article we publish.