 Chitra Maharani Saraswati1
 Melinda A. Judge1,2
 Lewis J. Z. Weeda3
 Quique Bassat4,5,6,7,8
 Ndola Prata9
 Peter N. Le Souëf3
 Corey J. A. Bradshaw10,11*
- 1Telethon Kids Institute, Perth, WA, Australia
- 2School of Mathematics and Statistics, University of Western Australia, Nedlands, WA, Australia
- 3School of Medicine, University of Western Australia, Nedlands, WA, Australia
- 4ISGlobal, Hospital Clínic - Universitat de Barcelona, Barcelona, Spain
- 5Centro de Investigação em Saúde de Manhiça (CISM), Maputo, Mozambique
- 6Catalan Institution for Research and Advanced Studies (ICREA), Barcelona, Spain
- 7Paediatrics Department, Hospital Sant Joan de Déu, Universitat de Barcelona, Esplugues, Barcelona, Spain
- 8Centro de Investigación Biomédica en Red (CIBER) de Epidemiología y Salud Pública, Instituto de Salud Carlos III, Madrid, Spain
- 9Bixby Center for Population Health and Sustainability, School of Public Health, University of California, Berkeley, Berkeley, CA, United States
- 10Global Ecology | Partuyarta Ngadluku Wardli Kuu, College of Science and Engineering, Flinders University, Adelaide, SA, Australia
- 11Australian Research Council Centre of Excellence for Australian Biodiversity and Heritage, Wollongong, NSW, Australia
Introduction: The global human population is still growing such that our collective enterprise is driving environmental catastrophe. Despite a decline in average population growth rate, we are still experiencing the highest annual increase of global human population size in the history of our species—averaging an additional 84 million people per year since 1990. No review to date has accumulated the available evidence describing the associations between increasing population and environmental decline, nor solutions for mitigating the problems arising.
Methods: We summarize the available evidence of the relationships between human population size and growth and environmental integrity, human prosperity and wellbeing, and climate change. We used PubMed, Google Scholar, and Web of Science to identify all relevant peer-reviewed and gray-literature sources examining the consequences of human population size and growth on the biosphere. We reviewed papers describing and quantifying the risks associated with population growth, especially relating to climate change.
Results: These risks are global in scale, such as greenhouse-gas emissions, climate disruption, pollution, loss of biodiversity, and spread of disease—all potentially catastrophic for human standards of living, health, and general wellbeing. The trends increasing the risks of global population growth are country development, demographics, maternal education, access to family planning, and child and maternal health.
Conclusion: Support for nations still going through a demographic transition is required to ensure progress occurs within planetary boundaries and promotes equity and human rights. Ensuring the wellbeing for all under this aim itself will lower population growth and further promote environmental sustainability.
1 Introduction
Growth of the global human population is one important dimension of the rising severity of climate change, but is often not overtly discussed as a driver. For example, the Sixth Assessment Report by the Intergovernmental Panel on Climate Change (IPCC) did not mention population in its widely disseminated Summary for Policymakers (1), although population was discussed in the full report (2). Neither was population mentioned in either the Paris COP 21 Agreement (3) or the Glasgow COP 26 Climate Pact (4). The reason for this lack of emphasis on the contribution of population growth to environmental decline, including climate change, is unclear, but it possibly stems from sensitivities regarding unclear messaging (5), inequalities between high- and low-income nations, and concerns about challenging the established paradigm that economic growth is necessary for development (6). If the issue of the human contribution to environmental integrity and future wellbeing are to be given proper consideration and discussed rationally, it is essential that the population morass be included in any debates.
The effects of climate change on human health have been the focus of extensive research, but the contribution of population growth to these effects have been largely overlooked. This oversight threatens to diminish recent improvements in global health. Although the global fertility rate is slowly declining, the annual rate of population increase relative to planetary boundaries has not changed in 30 years, with the annual increment exceeding 80 million (7). The contribution of population increase to environmental integrity and resilience remains one of the greatest gaps in understanding. Finding acceptable and ethical solutions to the quandary of population in terms of maintaining resources and human health and wellbeing is therefore urgent. Emphasizing that women and men globally have access to free, non-coercive, culturally and socially acceptable, and high-quality family-planning services is an important component of these solutions in the long term. Indeed, this is one of the United Nations Sustainable Development Goals, but is still a long way from being met (8).
In this review, we summarize the available evidence of the relationships between human population size and growth and environmental integrity, human prosperity and wellbeing, and of course, climate change. After revealing the available evidence, we suggest approaches to mitigate negative repercussions. We review the broad range of ways in which a high and increasing population contributes to increasing consumption, rising emissions, and continuing environmental damage. Given that climate change is the greatest threat to future human health and persistence (2), including the potential to interact with other socio-economic drivers exacerbating conflict (9), we examine the contribution of an increasing population to this threat, including the potential of overshooting current population projections. We examine the evidence for the impact of environmental change, including climate change, on human health, with an emphasis on child health given that 88% of the climate-change health burden is borne by children (10, 11). Finally, we examine the arguments for and against policies to stimulate or reduce population growth globally, nationally, and locally.
We have organized our review into the following sections: (i) introduction (ii) basics of population projections, how these measures are created, and potential limitations to be considered from existing global population projections, (iii) risks from increasing global population size, where we consider the implications of the highest population growth projections (“worst case” scenario), (iv) drivers of increasing risk of population overshoot, (v) countering arguments against a safe and sustainable global population, specifically addressing the unfounded fears associated with population decline and aging populations, and (vi) discussing potential policy pathways to achieve safe and sustainable population sizes globally.
2 Materials and methods
We employed a search strategy in Pubmed, Google Scholar, and Web of Science to identify all relevant peer-reviewed and gray-literature sources examining the consequences of human population size and growth on the biosphere. Our main search terms included: “population,” “demography,” “fertility,” “overpopulation,” “population size,” “family planning,” “projection,” and these expanded rapidly to incorporate elements associated with “climate change,” “greenhouse-gas emissions,” “consumption,” “ecological footprint,” “biocapacity,” “pollution,” “biodiversity,” “disease,” “contraception,” “child health,” “maternal education,” and “population decline.” We also followed many additional pathways identified via these search strings to online reports and databases to complete the coverage of available literature. To determine the trends in peer-reviewed publications addressing the joint topics of population and human fertility, we employed the search string “population + fertility” in PubMed from 01.01.1970 to 31.12.2022.
3 Results
3.1 Current population projections and risk of overshoot
3.1.1 Human population size and projected trends
There are now over eight billion people living on Earth (12). The world population has increased at an unprecedented rate since the 1700s (Figure 1), and is projected to increase to an average of 10.4 billion people in 2100—a 10-fold increase over 250 years (7).
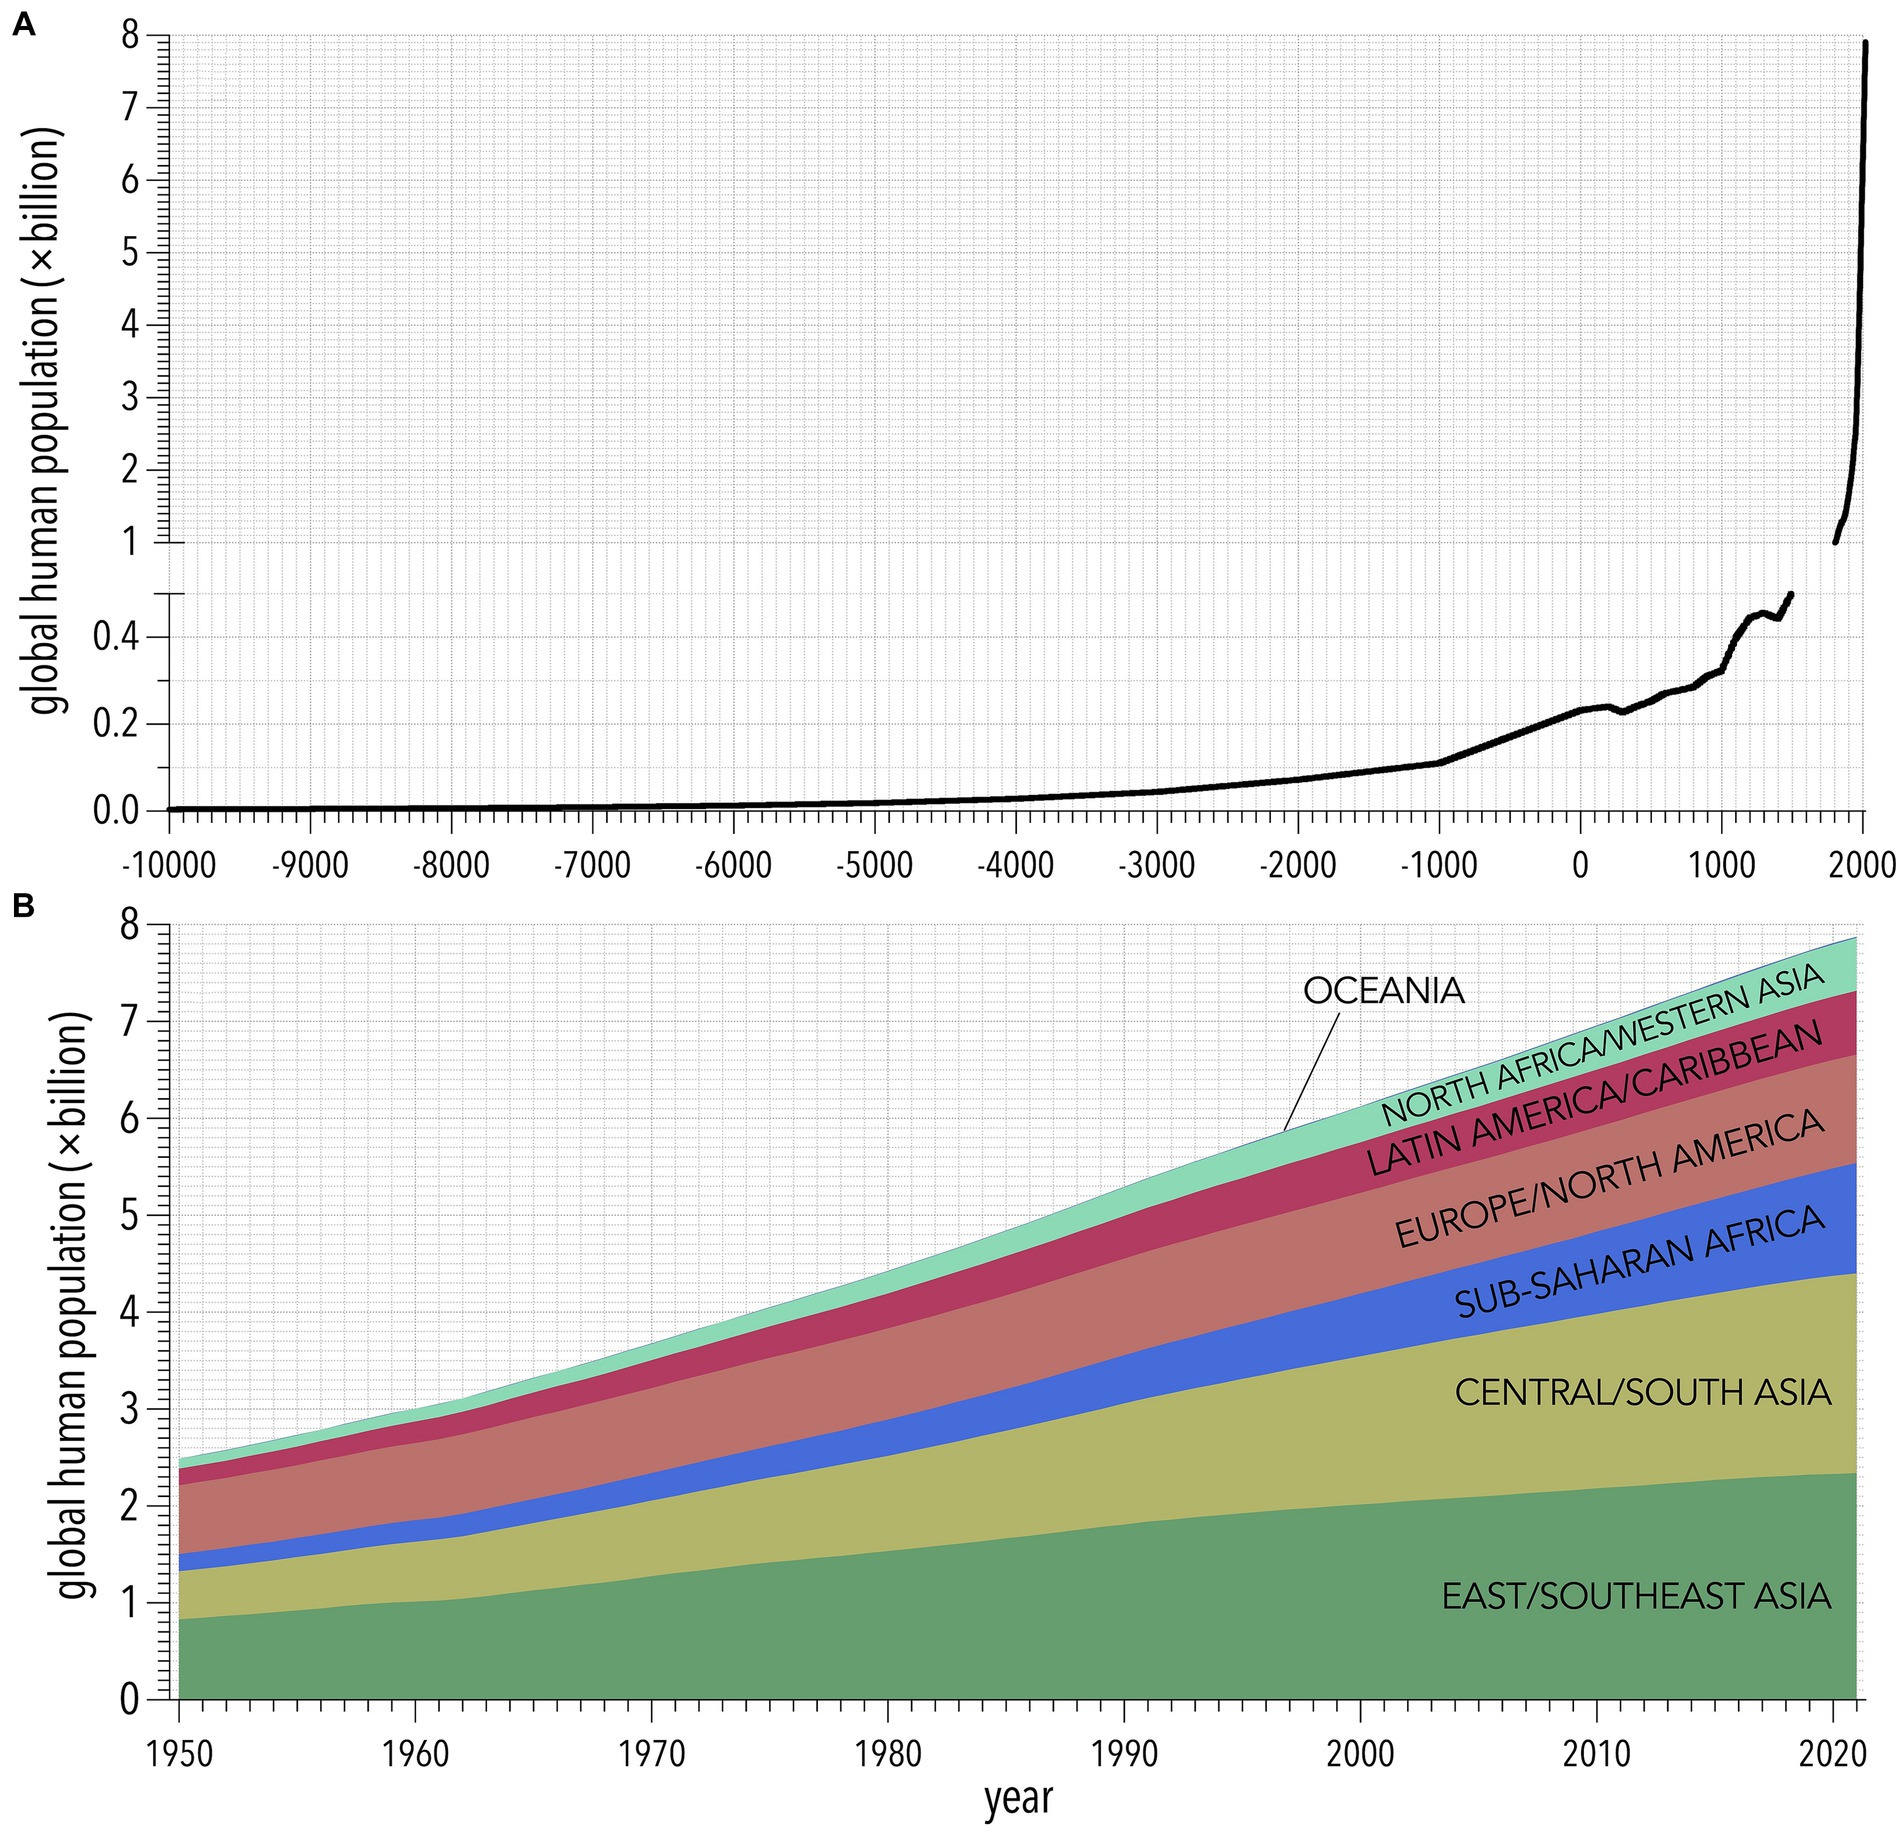
Figure 1. (A) Population growth since 10,000 BCE according to the History Database of the Global Environment and the United Nations (12). (B) Regional population trajectories from 1950 to 2021 from the United Nations Population Division (7).
Several different models project the population trajectory to 2100. The most widely cited are from the World Population Prospects produced by the Population Division of the Department of Economic and Social Affairs of the United Nations Secretariat (7). The United Nations Population Division projections have been updated regularly since 1951, and therefore have broad appeal. Alternatively, forecasts from the International Institute for Applied Systems Analysis-Wittgenstein Centre (IIASA) (13), available since the 1990s, are the most widely used for modeling the contribution of future emissions in climate-change projections (2). Another more recent forecast (from 2020) is by the International Health Metrics and Evaluation (IHME) (14), but with criticism of its methods and results (15, 16).
All population projections have the same starting point: estimates of the number of people alive today tend to be consistent among models, with birth and mortality rates derived from censuses, demographic surveys, or official registers. The differences in projected population size derive from different modeling choices and assumptions when applying estimates of fertility, mortality, and international migration parameters. Some of the main differences in projected outcomes depend on the expectation of how fertility, mortality, and migration will change with anticipated economic development, as well as how quickly each country might progress through the demographic transition—the theory (17) proposing how nations move from high fertility prior to a decline, followed by a rapid decline in fertility, to plateau eventually at a low fertility.
United Nations Population Division projections use the cohort-component method (18), where existing population dynamics are constructed for each country and projected to 2100. Future survival probabilities, future number of births, and future net migration are projected in five-year intervals using nine projection variants, with five of these variants differing in fertility assumptions (low, medium, high, constant fertility, or instant-replacement fertility), but assuming constant mortality and net migration. The other four variants assume medium fertility but vary mortality and net migration. The 2022 report projects the global population to peak at 10.4 billion people in the 2080s and to remain there until 2100 under its medium variant, and assumes that total fertility rates will continue to decline (7). The lowest-rate variant projects the global population to decline to 8.9 billion by 2100, and the highest-rate variant projects it to rise to 12.4 billion, with this variability arising from an uncertain projection of fertility rates (7). The increasing frequency of pandemics (19) might add uncertainty to forecasts of fertility rate due to the accompanying pattern of a steep initial decline in fertility, followed by gradual increases and a baby boom (20).
The IIASA forecasts take educational attainment into account, in addition to the conventional age and sex structures (13, 21), to project populations in three scenarios based on shared socio-economic pathways derived from both expert opinions and statistical modeling. The Medium scenario forecasts a medium pathway for fertility and mortality rates, generally viewed as the most likely from today’s perspective. The Rapid Social Development scenario assumes rapid increases in life expectancy, a faster decline of fertility rates in currently high-fertility countries, and a fulfillment of the education goals in the United Nations’ Sustainability Development Goals. The Stalled Social Development scenario assumes a stall in education attainment within developing countries, and continued high fertility and mortality. The 2018 Medium projection predicts a global population of 9.8 billion achieved between 2070 and 2080 before slowly declining to 9.5 billion people by 2100. In the Rapid Social Development scenario, a peak population of 8.9 billion is projected for 2055–2060 before declining to 7.8 billion by 2100. Assuming the Stalled Social Development conditions, the world population is forecasted to be 10 billion people in 2045, with a continued growth to 13.4 billion by 2100.
The main difference between the IHME projections and those from the United Nations Population Division and IIASA is the quantification of fertility. Instead of the conventional total fertility rate, defined by the World Health Organization as the “… total number of children that a hypothetical cohort of women would have at the end of their reproductive period if they were subject during their whole lives to the fertility rates of a given period and if they were not subject to mortality” (22), the IHME instead applies the completed cohort fertility at age 50 (CCF50), defined as the “… average number of children born to an individual female from an observed birth cohort if she lived to the end of her reproductive lifespan” (14). The CCF50 has been proposed as a more stable forecasting method because it corrects for changes in total fertility rate over time rather than assuming the raw values that fluctuate considerably over time, due to lags in the influence of changing age structure, educational attainment, and meeting contraceptive needs. While using CCF50 might improve the stability of projections, larger influences on variation among models are the specific assumptions regarding the trajectories of future fertility, education, age structure, and other development indicators. The IMHE projections consider four alternative scenarios with differences in education and family-planning policies. De-prioritizing education and family planning through policy changes increased projected population sizes. The lowest-rate forecast assumed increased female empowerment through better education attainment and increased access to contraception (14), resulting in a lower growth rate than the Medium variant of the United Nations Population Division projections—this projects the global population to peak at 9.73 billion just after mid-century and then a decline to 8.79 billion people by 2100 (14).
Accurate population projections are an important tool in shaping the future of human societies primarily through their effects on national policies—for example, planning for health care, housing, childcare, and schools, or anticipating economic development (15, 16, 23). We discuss the interaction between projections of population size and these policy dimensions below. Of the three projections highlighted, the IHME’s has been most criticized for proposing less-realistic and least-verifiable assumptions (24). The corollary is that unsubstantiated lower projections to 2100 could potentially mislead governments to implement coercive policies such as restricting access to contraception to increase fertility to a replacement rate. The argument for this is usually driven by a misplaced fear of stagnation in the country’s economy, the arguments against which we discuss in subsequent sections.
There is a lack of rigorous evaluation of existing population projections in terms of relative assumptions and realism of proposed scenarios. A necessary analysis of existing projections under various scenarios would clarify the relative likelihood of different population trajectories over the course of the coming century. While the three institutions responsible for the described projections include working groups of experts, an external and independent evaluation would guide future improvements and provide more realism. Regardless, the most likely outcomes based on mid-range assumptions and scenarios indicate that a global population between 9 and > 10 billion by the end of this century is the most parsimonious.
3.2 Risks from increasing population sizes
3.2.1 Consequences of a growing human population
Large human populations pose a risk of global catastrophe due to their influence on increasing environmental risks such as changes in atmosphere and climate, land degradation, and threats to biodiversity. Fundamentally, continued population growth leads to an increase in human economic activity, which puts pressure on the planet’s ability to renew resources (25). Population growth increases pressure and competition for finite resources such as food, water, and land; to compensate, production must rise, resulting in even greater environmental damage (26–28). With fewer people in the past, whenever environmental damage occurred, groups of people usually colonized other places or otherwise survived at lower densities (25). With today’s already large global population, the option to colonize new regions is unfeasible and instead drives additional environmental damage (26, 28). The causes for these global environmental risks are not necessarily clear, so we consider the following main environmental problems arising from population growth: (i) greenhouse-gas emissions and temperature increases, (ii) pollution, (iii) loss of biodiversity, and (iv) spread of infectious diseases and general worsening health outcomes.
There is a strong theoretical basis for expecting a positive relationship between human population size and the risk of environmental erosion that are encapsulated by several mathematical concepts. Existing models built to quantify environmental impact arising from population pressures, such as the IPAT (Impact [emissions] = Population × Affluence × Technology) (29), ImPACT (Impact = Population × Affluence × Consumption [intensity of use] × Efficiency [emissions per unit energy used]) (30), and STIRPAT (a stochastic variant of IPAT) (31), were developed mainly to determine the role of factors such as population growth and technological change in affecting environmental degradation. These equations and their variants can ideally predict the environmental outcomes of particular policy adjustments (32, 33). For example, the ImPACT equation was constructed to assess total emissions as a function of population size, per capita gross domestic product, energy consumption per unit gross domestic product, and CO2 emissions per unit energy consumption (30). The following subsections reveal the extent to which the population component of impact equations cannot be neglected.
3.2.2 Greenhouse-gas emissions and climate disruption
It is axiomatic that an increasing population produces more emissions, but this simple relationship belies a complex interplay between consumption rate itself, and the total number of consumers. We explore this concept contextually before considering the consumption and production pathways resulting in different emissions profiles.
Increased concentrations of greenhouse gases generated from energy consumption, predominantly from burning fossil fuels, have contributed greatly to global environmental degradation. The Intergovernmental Panel on Climate Change (IPCC) Assessment Reports show that increasing emissions translate to additional global warming, reduced air quality, changes in the global water cycle, and increased prevalence of extreme climate events such as high rainfall and flooding, fires, droughts, and cyclones (34), with all the associated secondary adverse health impacts. Population growth has resulted in more human enterprise, and therefore, more intensive energy consumption (35). As new technology is developed, the energy consumption per capita also grows (27, 28). Indeed, the annual per-capita rate of global primary energy consumption increased 1.62 times since 1965 to today (46.7–75.6 GJ person−1), or an average increase of 0.41 GJ person−1 year−1 (Figure 2) (36). During that same interval, the global human population increased from 3.3 to 8.0 billion (Figure 1) and total annual greenhouse-gas emissions increased from 11.2 Gt to 33.0 Gt CO2-e (36).
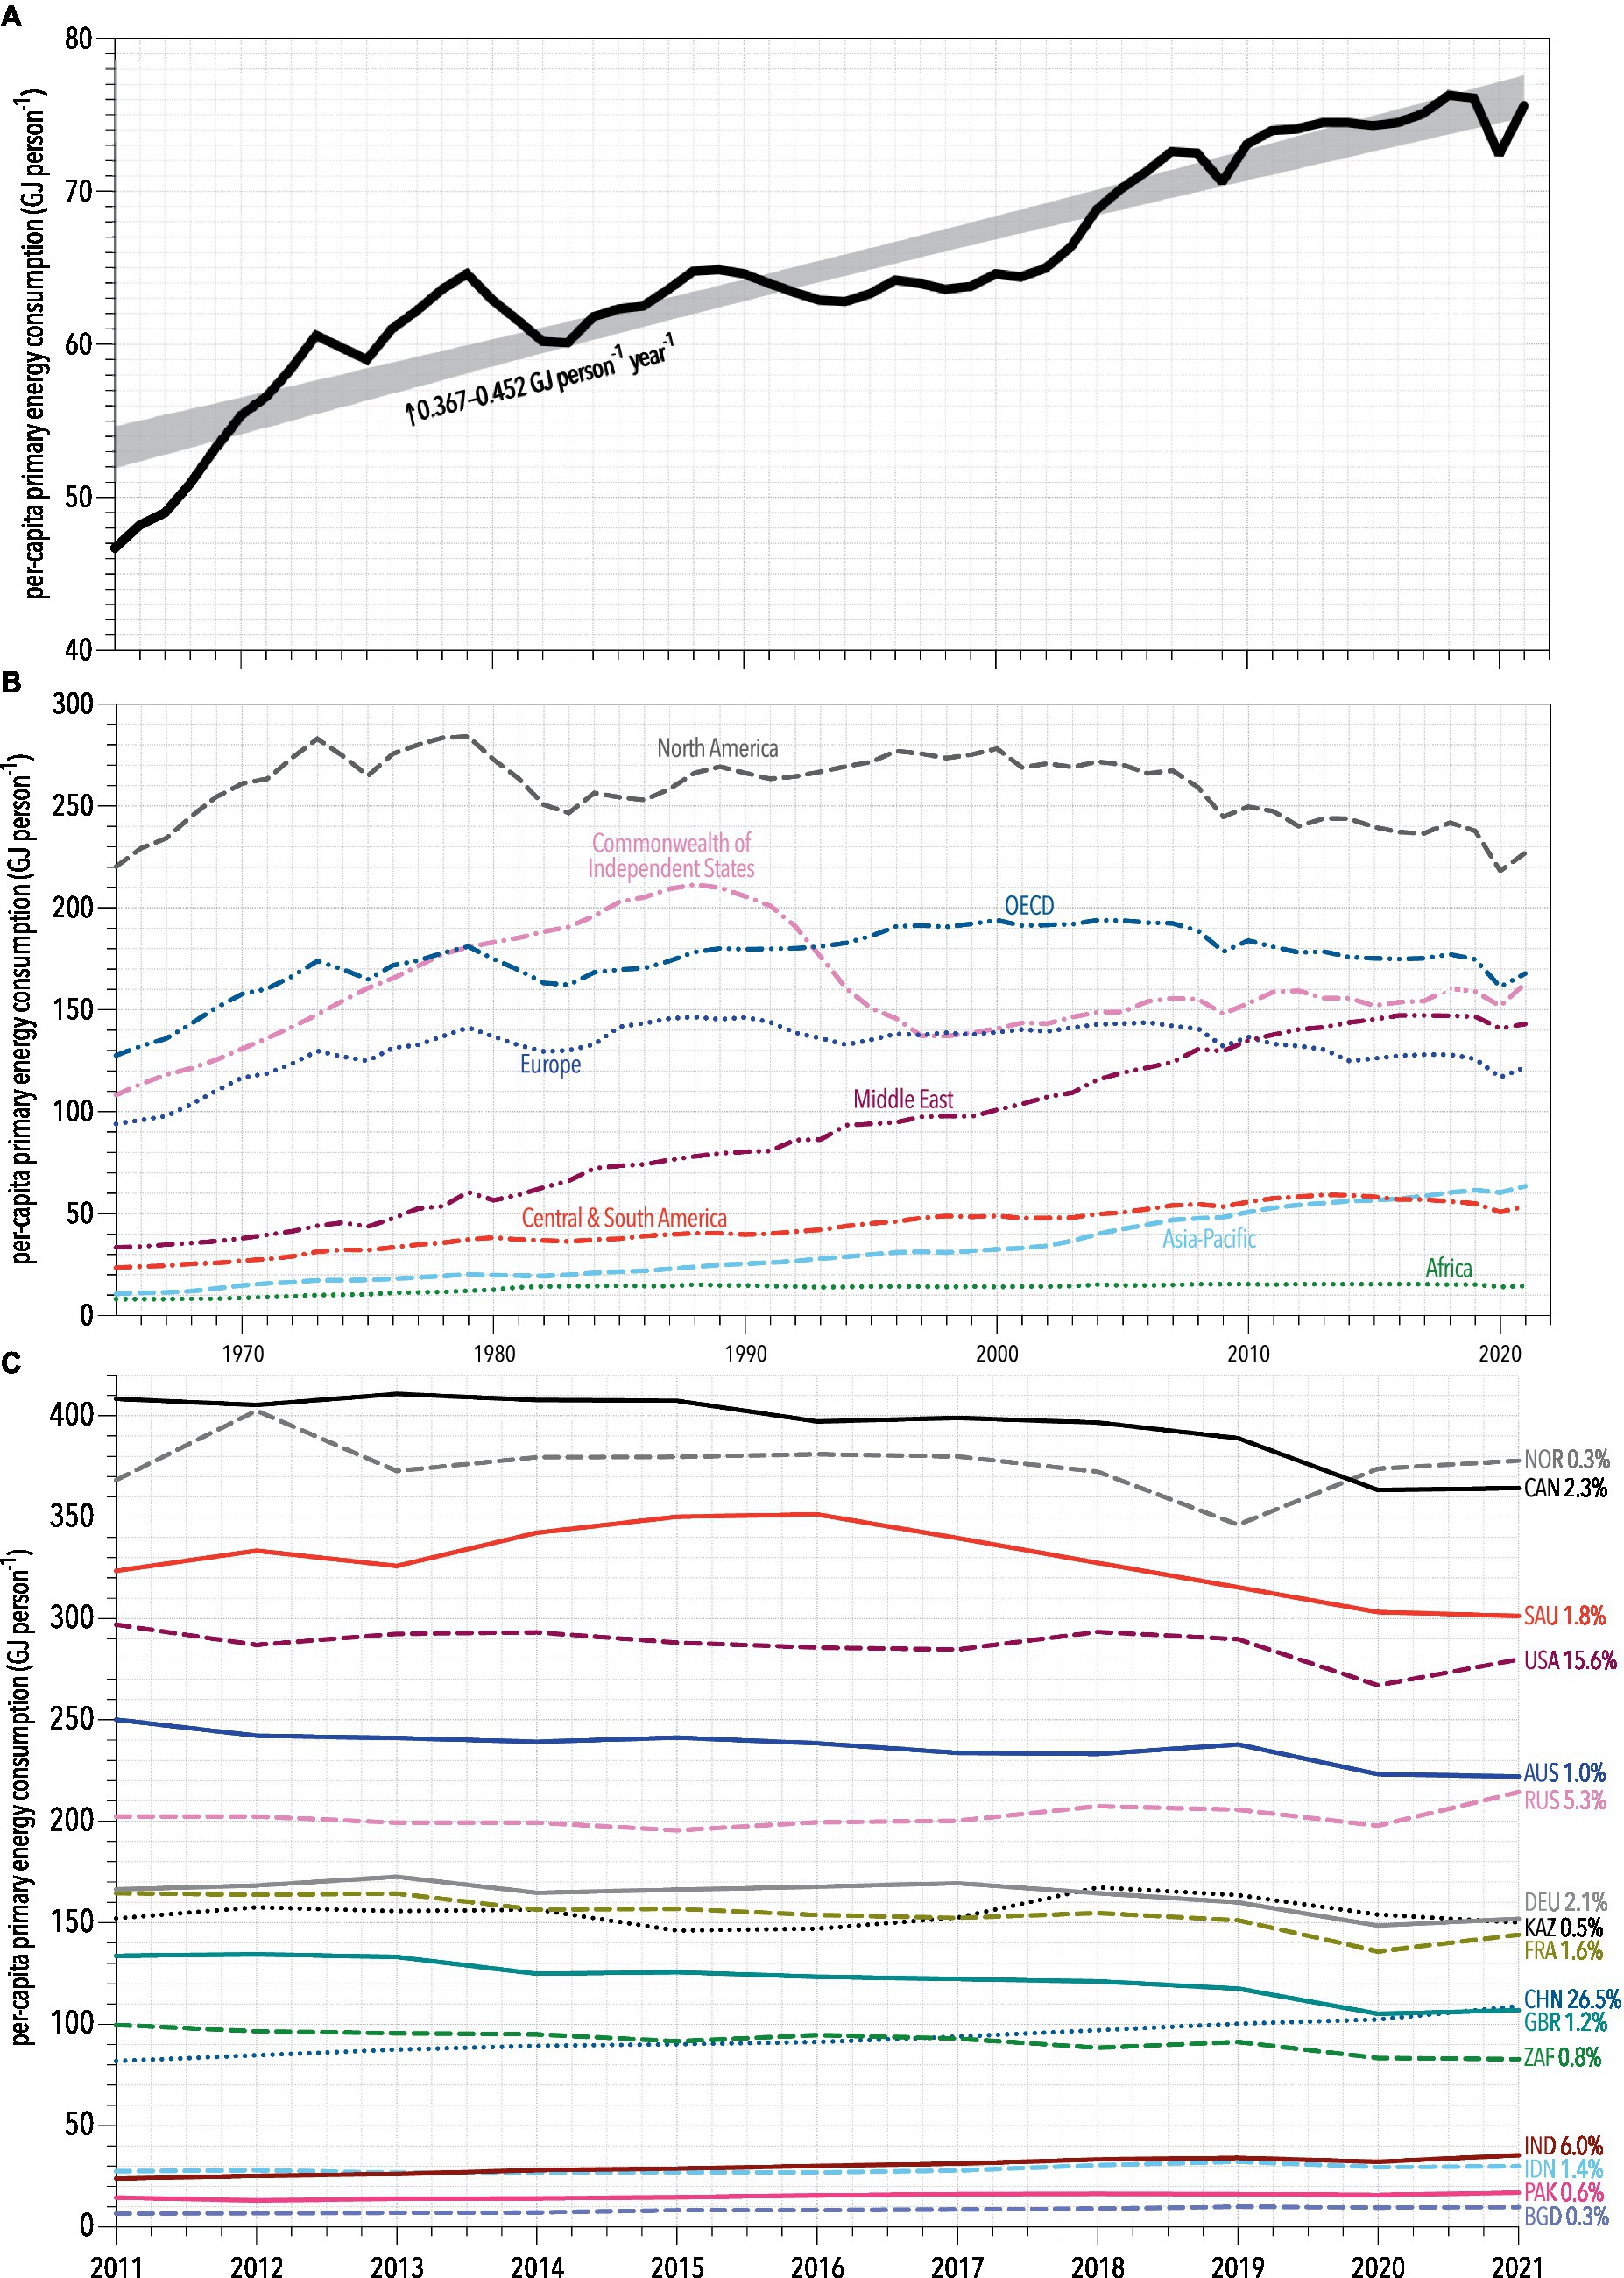
Figure 2. (A) Per-capita annual primary energy consumption from 1965 to 2022 (36), equating to an average increase of 0.41 GJ person−1 year−1 (95% confidence interval: 0.367–0.452 GJ person−1 year−1). (B) Regional per-capita annual primary energy consumption over the same interval. (C) Trajectories of per-capita primary energy consumption from example countries covering the broad range. Percentages next to the country abbreviations indicate the share of total global consumption in 2021 (36). Countries shown: NOR, Norway; CAN, Canada; SAU, Saudi Arabia; USA, United States; AUS, Australia; RUS, Russia; DEU, Germany; KAZ, Kazakhstan; FRA, France; CHN, China; GBR, United Kingdom; ZAF, South Africa; IND, India; IDN, Indonesia; PAK, Pakistan; BGD, Bangladesh.
A combination of more consumers and higher consumption rates drive the growth in greenhouse-gas emissions, rather than population growth alone (37). Nations with low per-capita emissions tend to have the highest population growth rates (38), meaning that if they follow the development trajectories of high-income nations today, emissions will also continue to grow. The latest IPCC report predicts a 1.7°C increase in global temperatures relative to pre-industrial temperatures (i.e., average of the 51-year period from 1850 to 1900) by 2060 under a scenario of low population growth versus 2.8°C warming with a medium-high scenario of population growth (34, 39).
Consistently throughout history, there is a concomitant rise in per-capita energy consumption with population growth (35). As people gradually deplete resources in their environment, innovators find new ways to extract energy from previously unused resources or import resources from less-depleted locations. Increased energy use from these new resources facilitates improvements in diet and living standards, which stimulates even more population growth (26, 35, 40). This phenomenon is summarized succinctly by the concept of the ecological footprint, which describes how much biologically productive area is required to provide for all the competing demands of the people it services, such as space for agricultural and fiber production, timber, sequestration of carbon dioxide emitted from burning fossil fuels, and built infrastructure (41) (Figure 3). This area can be calculated for the entire globe, or individual nations, leading to the estimate of biocapacity, which is the amount of biologically productive land and sea available to provide the resources a particular population consumes and to absorb its wastes (given current technology and management). Globally, we are operating on a biocapacity deficit that is consuming Earth’s ecosystems 1.7 times more rapidly than they can be renewed.
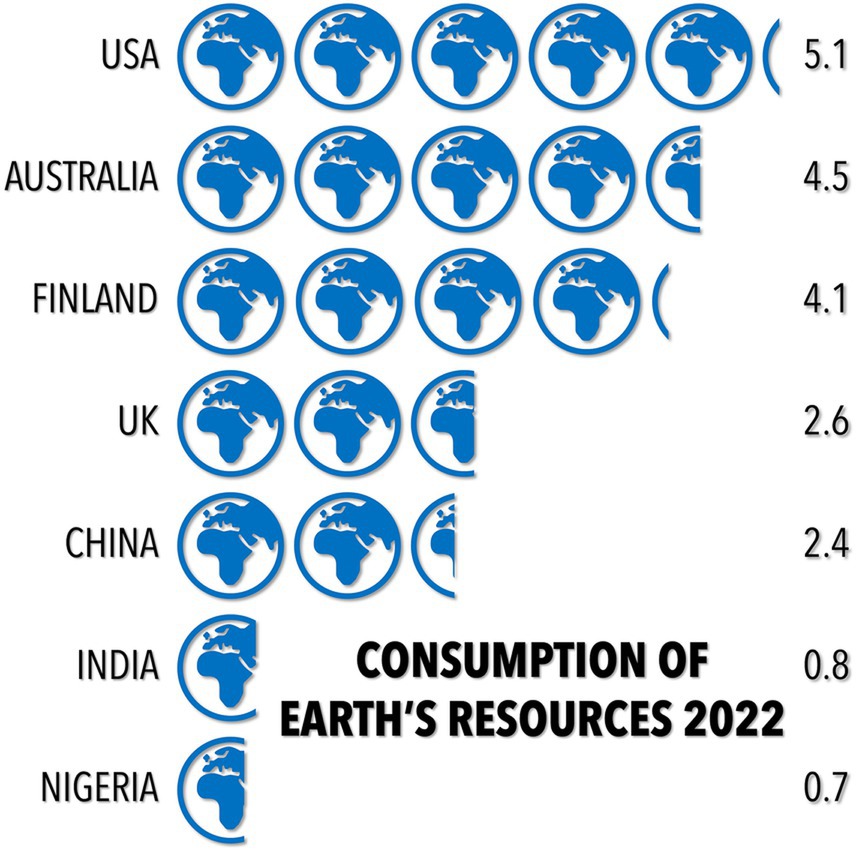
Figure 3. Our global ecological footprint using seven example nations: USA, Australia, Finland, United Kingdom, China, India, and Nigeria (41, 42). The numbers on the right indicate how many Earths would be required if everyone on Earth consumed renewable resources at the same rate as the nation indicated.
Greater consumption of manufactured goods increases waste and subsequently leads to increased consumption of resources to manage that waste, creating a self-perpetuating, vicious cycle. Food-waste management alone accounts for 8–10% of global human-produced greenhouse-gas emissions year−1 (approximately half of that emitted by the entire global food system) (43, 44). Solid waste management adds another 5% (45). Carbon-removal technologies such as carbon capture, carbon sequestering, and other proposed “net zero” solutions will not themselves counter increasing consumption. While appealing in principle, these technologies are logistically difficult to implement at scale such that net emissions decline. Relying on such technologies is dangerous because it diminishes the sense of urgency to reduce consumption and emissions now (46).
Population growth is the main driver of water scarcity because larger populations have higher water demand (47, 48) in the absence of major technological and policy shifts to disrupt the dependency of demand and supply (49, 50). Freshwater resources are finite, but the demand for water in food production continues to grow. Irrigated agriculture, rain-fed agriculture, and livestock production on pastureland all require freshwater. Subsequently, population growth exacerbates environmental risks by requiring greater food production (40, 51).
The agriculture sector contributes over a quarter of the world’s greenhouse-gas emissions, from agriculture, forestry, and land-use change (52–55). Agriculture accounts for approximately 20% of global, human-produced greenhouse-gas emissions annually (55), while livestock contributes 14.5% (56). Food production emits 45% of total methane (CH4) globally, where 80% is from livestock production, and rice production is the next-largest emitter. Agriculture is also responsible for 80% of nitrous oxide (N2O) emissions globally, mainly from fertilizer application (57). Methane and nitrous oxide are more powerful than carbon dioxide (CO2) in forcing temperature increases over a span of 20 years by a multiple of 84 times and 264 times (55), respectively. Together, CO2, CH4 and N2O concentrations have increased over the industrial era from human activity, resulting in unequivocal warming of the global climate system (34).
Reducing emissions in agriculture is challenging because the sector (i) is slower to change than other major industries, (ii) is fragmented, and (iii) has a complicated set of objectives. Unlike the electricity sector, where it is possible to displace coal and gas with low-emissions technologies (58, 59), these options are not available for agriculture. Another contributing deterrent of rapid, broad-scale change is the large proportion of small stakeholders. Most farmers (2 billion globally) are employed on small farms (smallholders) in developing countries (60), meaning 65% of working adults in low-income countries make a living through agriculture. The risk of failure or lower yields in the short term is therefore untenable despite potential long-term gains for reducing emissions at the farm scale (60). Most emissions-reduction measures, such as more sustainable farming practices, would either reduce costs or be cost-neutral; however, they are not implemented due to capital constraints, limited access to technology, and adherence to local traditional practices, all exacerbated by the scale of smallholdings (53). Additionally, agriculture impacts biodiversity preservation, nutritional needs, food security, and livelihoods. Forests in developing countries are, on average, cleared twice as fast as they can grow back (61), leading to the concern that soil erosion and desertification from deforestation combined with intensive agriculture threatens up to a third of the Earth’s total land surface. Financial support and capacity building for smallholders are essential to bring the agricultural sector to a more sustainable path and to fulfill its goals of reducing emissions.
As the human population continues to increase, awareness of what we eat and how much food we waste (consumption-side management) is essential. Managing food waste is the most impactful because approximately one-third of all food produced is never consumed (62). Wastage occurs across the supply chain during production, transportation, and storage due to lack of access to technology and cold-storage infrastructure. It also occurs at the retail and consumption phases, especially in higher-income regions due to aesthetic preferences, purchasing more food than needed, and poor portion control. If food waste were to fall to <30% by 2030 and < 20% by 2050, there would be an overall reduction in greenhouse-gas emissions from food waste by about 40% globally (62).
Although a much smaller effect, consumption should be considered when reducing the sector’s emissions. As people become wealthier, demand for meat consumption tends to grow (63). High-income countries consume between 60 and 91 g day−1 of meat, while countries in Asia and Africa consume only 4–7 and 7–34 g day−1, respectively (64). Meat consumption and production are environmentally costly; food systems are responsible for 21–37% of global greenhouse gas emissions, and of that, 52% is caused by cattle products alone (65).
The common denominator for all these issues is population growth. Despite implementing the solutions proposed above specific to each outlined problem, if the global population keeps growing beyond a safe space for the planet, we will still experience disastrous consequences. Indeed, the most effective individual action in addressing the emission and consumption issue is to have one fewer child (66).
3.2.3 Pollution
Despite ongoing efforts by United Nations agencies, committed groups and individuals, and some national governments (mostly in high-income countries), little real progress against both air and water pollution is being made overall, particularly in the low-income and middle-income countries where pollution impacts are most severe (67). Deaths from ambient air pollution have increased over the last two decades, accounting for 2.9 million premature deaths in 2000, increasing to 4.2 million in 2015, and 4.5 million in 2019 (67). Premature deaths due to all forms of pollution have remained unchanged at 9 million from 2015 to 2019 (67). The Lancet Commission on Pollution and Health cited pollution as “… the world’s largest environmental risk factor for disease and premature death” (67).
There is also a growing concern for water quality—population pressure, unsustainable consumption, and unsustainable production stress can degrade freshwater resources (47). In the past, smaller settlements relied on the self-cleansing and dilution potential of rivers when disposing effluent. These natural functions reach their limits with greater population density and increased industrial production, calling for increased regulation of effluent disposal (47).
More waste resulting from an increase in consumption of manufactured goods also increases pollution, with low- and middle-income countries disproportionately burdened by environmental destruction through pollution due to inadequate infrastructure for waste management—up to 93% of all waste in low-income countries is dumped without further processing (45). This poor management of waste through open dumping or uncontrolled burning pollutes soil, water (68), and the air, subsequently reducing crop growth (69), increasing water scarcity, and damaging human health (45).
3.2.4 Loss of biodiversity
Resource extraction beyond the regenerative potential of Earth is responsible for biodiversity loss, but work remains to identify the relative impact of different mechanisms, and temporal and spatial scales, of the degradation ensuing. The challenge is teasing apart the effects of consumption per se, and overall population size—as in all forms of anthropogenic damage to the biosphere, the product of consumption and number of consumers is the combined driver of biodiversity loss. Currently, an annihilation of Earth’s biodiversity is underway because of human endeavor, such that we are now firmly within the sixth mass extinction event (70, 71).
An increase in human population size is generally correlated with worse outcomes for biodiversity health in protected areas (72). Human population density and growth rates are disproportionately higher in Biodiversity Hotspots (areas with exceptionally high species endemism and concomitant threats from human agency) (73, 74), which subsequently leads to higher deforestation rates and species loss (75). Historically, an increase in human population size is associated with greater threats to biodiversity (76, 77), and strongly associated with an increased number of threatened species (78–80). Factors contributing to species threat include habitat destruction and degradation (71), direct exploitation such as hunting (81), invasive species (82–84), pollution (85, 86), diseases (87, 88), climate change (89, 90), and the synergies emerging from these different drivers (91).
Another component of biodiversity loss is land-use conversion for human activities such as agriculture, mining, logging, establishing transport networks, and urbanization. Eight times as much temperate grassland is converted for human purposes than is protected (92). Agriculture is the largest driver of biodiversity loss worldwide (52, 93), with a third of the world’s land surface already converted for agriculture (94, 95), and over half of the world’s wetlands drained and repurposed for agriculture in the last century (96, 97). The global livestock sector is rapidly growing and intensifying, with livestock usually displacing local fauna (56, 98). The expansion of plantations and pastoralism since the 1980s has resulted in tropical deforestation (99, 100). Large herbivore and carnivore species on land also have declining populations due to agriculture (101–103); for large carnivores such as lions, most are pre-emptively hunted because they are threats to humans and livestock (104, 105). In the ocean, examples of destruction of the environment include overfishing (106), trawlers destroying ocean habitats (107–109), and the extinction of large fish species (110). The indirect driver of all this destruction is population growth as we ramp up agricultural production to keep pace; the World Resources Institute has estimated that we need to close a 56% food gap between calories produced (as of 2010) and those needed in 2050 if the global population was to rise to 10 billion people (111).
3.2.5 Spread of disease
Increasing human population means more people living in urban areas (from 43% in 1990 to 54% in 2015) (112). If population growth continues at a similar rate, around 68% of all people will reside in urban communities by 2050, with most urbanization occurring in African countries (112). Rapid urbanization underlies an increasing prevalence of non-communicable diseases in low- and middle-income countries, which account for 85% of premature deaths (between the ages of 30 and 69 years) from noncommunicable diseases worldwide (113). The most prevalent of these include cardiovascular disease, cancers, chronic respiratory disease, and diabetes, all of which have common behavioral risk factors such as poor diet, limited exercise, smoking, and drinking alcohol (114, 115). Additionally, people with a non-communicable disease are at increased risk of some infectious diseases such as tuberculosis or COVID-19, or experience worse health outcomes, such as antiretroviral therapy-treated people living with HIV infection (114). This burden of disease is a threat to economic development by affecting the productivity of working-age people (114).
Urbanization affects the young through a reduction in fertility rates and reduced risk of child undernutrition (115, 116), but an increased risk of becoming overweight (115). Modeled outcomes from 73 countries showed that while children living in urban slums have better health outcomes than rural children, they are not as good as children living in better-off urban environments (116). Urban children, both poor and rich, have reduced mortality and stunting compared to rural children, but increased recent episodes of illness (116).
The associations between urbanization and infectious disease are many and complicated, leading to either increased or reduced risk depending on context (112, 115). Rapid urbanization is strongly linked to informal settlements (slums) that lack basic infrastructure (water and sewerage access) and are overcrowded (higher population density), which can heighten the spread of infectious pathogens (112). Yet, urban communities can provide more accessible health-care facilities and socio-economic opportunities that can lead to improved health outcomes (115). Urban risk factors encompass two main groups: (i) geographic, including population density, the built environment, municipal services, and the natural environment; and (ii) behavioral, including hygiene and sanitation, education and employment, sexual behaviors, and socioeconomic conditions (112).
With rising urbanization comes increased population density and higher prevalence or transmission of infectious diseases including tuberculosis (117, 118), yellow fever (119), Ebola (120), and HIV (121, 122), particularly in slums. Even within households, risk increases directly with household size (112). Human-to-human disease transmission increases largely due to close contact, while high population density can expose more people to vectors of disease. For example, despite highly effective mosquito-control programs in the high-income nation of Singapore, human population growth and rapid urbanization have enabled far fewer mosquitos to infect the overcrowded population and increase the prevalence of dengue fever (123). Furthermore, as global warming extends the length of the transmission season of mosquito-borne diseases, urban communities will be disproportionately burdened (124). Climate change poses a novel situation in which vector-borne diseases are able to be introduced to and survive in immunologically naïve populations (125). This is reflected in dengue becoming the most rapidly spreading mosquito-borne disease worldwide, with a 30-fold increase over that last 50 years as climates on the fringes of tropical and subtropical regions change to facilitate its spread (126). Within Australia, this is mirrored in migration and increasing burden of Murray Valley viral encephalitis and Ross River virus (127).
The built environment has differing impacts on the risk of infectious disease in humans. Irregularly or sparsely built-up urban areas have higher malaria risk, while densely built areas closer to the city center have reduced malaria risk (128). However, the magnitude of this disparity depends on localized environmental conditions such as proximity to dense vegetation, bodies of water (hydrographic network (128), artificial lakes and dams), or swampy areas, which all increase malaria risk (129). The risk of dengue fever is magnified in urban slums through inadequate drinking water, rubbish collection, and drainage of surface water, leading to increased mosquito breeding and consequent pathogen transmission (130). Conversely, improved health-care access in urban areas compared to rural can improve health outcomes. Malaria is an example of an infectious disease whose expansion has been aided by climate change, global temperature rise in particular. A 1°C increase in mean and minimum temperatures in Nepal led to a 27% incidence increase of malaria countrywide and 25% increase in geographical regions impacted by the disease (131). Likewise, warming is pushing upwards the maximum elevation of malaria in the highlands of countries like Ethiopia and Colombia (132).
Multiple aspects of the quality of house-building have been implicated in the prevalence of infectious disease, with irregularly or poorly built homes associated with increases in respiratory diseases, malaria, and helminth infections (112). Furthermore, rapid urbanization often goes hand in hand with a lack of municipal services such as hygiene (rubbish collection and waste management/disposal), sanitation, and healthcare services, which greatly increase the risk of some infectious diseases. A lack of household latrine and drainage systems has been associated with increased incidence of cholera (133, 134), bacterial and protozoal enteric infections (135), and diarrhea in children (136).
Higher population densities in urban areas can directly increase the risk of poor health outcomes. Increasing urbanization across Africa in particular has been associated with more deaths from air pollution as countries develop economically with increasing industrialization (67). While factors of the natural environment such as wetness and temperature can increase the risk of infectious diseases in urban and rural areas alike, population density in urban areas can increase transmission (112, 133, 137).
Zoonotic transmission of diseases accounts for an estimated 61% of human pathogens and 75% of pathogens that are deemed emerging (138). The occurrence of zoonotic transmission in regions experiencing rapid urbanization is becoming commonplace with expanding consequences. The severe acute respiratory syndrome (SARS) outbreak in 2003 (139), H1N1 influenza pandemic of 2009, Middle Eastern respiratory syndrome (MERS) outbreak in 2012, and of course, the COVID-19 pandemic, are well-documented diseases that have all been facilitated by rapid urbanization (140). Migration and travel both between rural and urban areas, and more globally, can swiftly disseminate disease. Proximity of an urban community to some animal populations, exacerbated by deforestation, forest degradation, and biodiversity loss more generally (141), can have profound impacts on the epidemiology of infectious diseases. Waste accumulation from human habitation encourages rodents and stray animals, plus water storage can enable mosquito proliferation, both of which can increase the chance of spreading a zoonotic disease in urban areas (142). Emergence or re-emergence of infectious diseases through increased interaction at the wildlife-livestock-human interface, at areas of steep transition between ecosystems (known as “ecotones”), can increase the likelihood of disease transmission between species. This is confounded by climate change and biodiversity collapse, both associated with large population sizes, which increase the risk of pathogen exchange at the human-animal interface (125). Evidence of disease emergence at ecotones has been documented for yellow fever, Nipah virus encephalitis, influenza, rabies, hantavirus pulmonary syndrome, Lyme disease, cholera, Escherichia coli infection, and African trypanosomiasis (143). Land-use change, particularly deforestation, has increased proximity of humans with wildlife directly, or through livestock that interact with wildlife (142). Livestock production that overuses and misuses antibiotics can increase antibiotic-resistant bacterial strains, which are transferable to humans through direct contact with infected animals, consumption of contaminated food, or via the environment (water, soil, air) contaminated by animal waste (144).
Rapid urbanization often occurs without adequate planning, leading to more violence, conflict, and crime. This burden disproportionately affects women, migrants, and refugees, with impacts on security, livelihoods, health and access to services (145) (Figure 4).
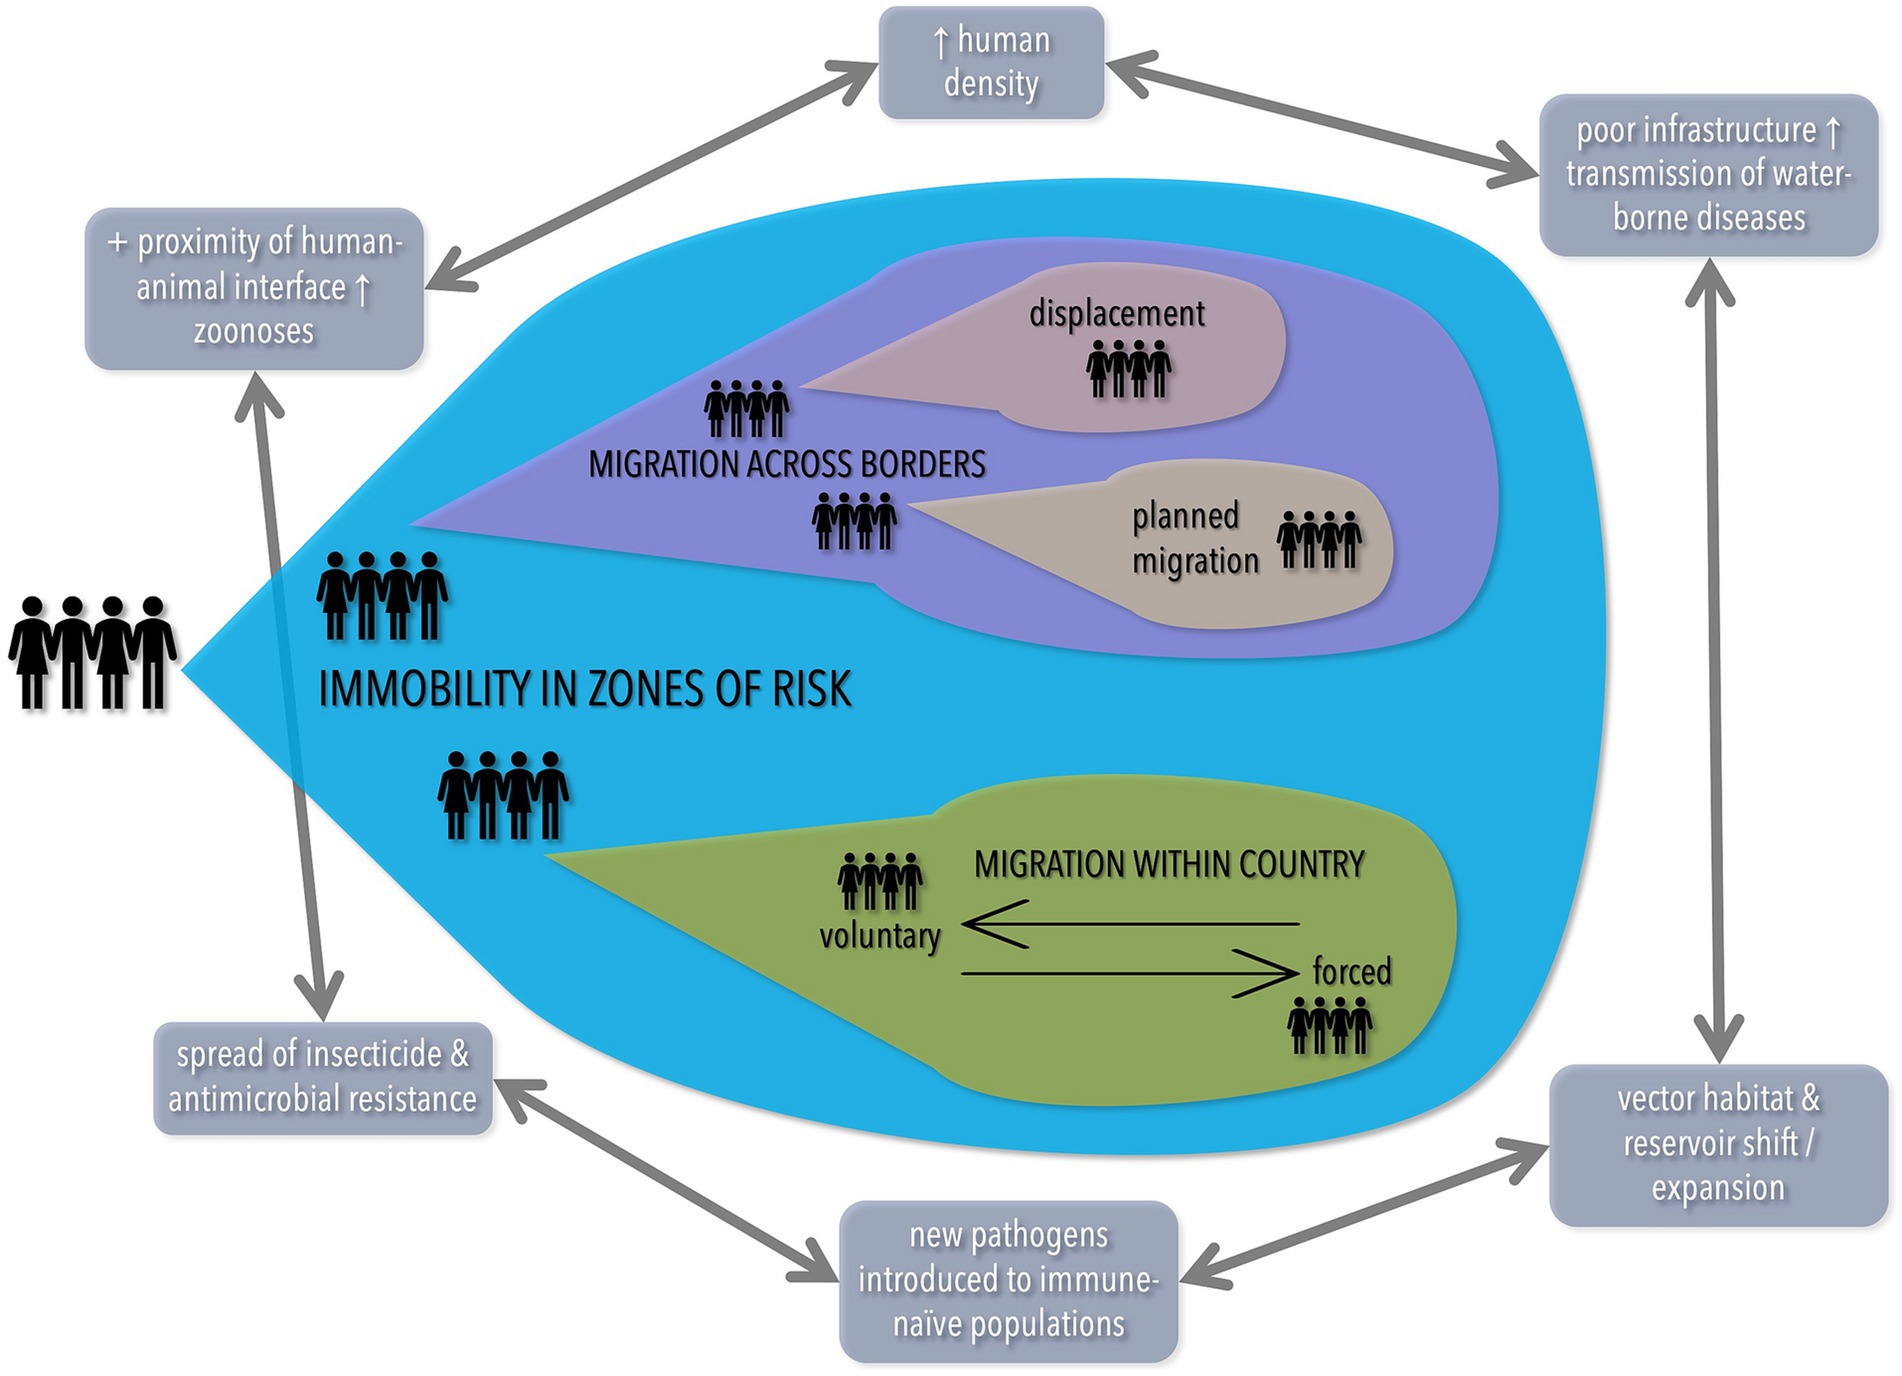
Figure 4. Population density, climate change, and poor infrastructure/planning all interact to lead to increased risk of disease. Adapted with permission from Wiley (Ref. 125), © 2021 Paediatrics and Child Health Division (The Royal Australasian College of Physicians), https://doi.org/10.1111/jpc.15681.
Increasing prevalence of urbanization can be expected to continue and can be beneficial to delivery of health services if accompanied by informed planning and policy. The faster urbanization occurs (with a rapidly increasing world population), the less planning will happen (slums emerge much faster than planned urban developments, especially in sub-Saharan Africa) and therefore, more of the negative effects of urbanization are likely. This is complicated by climate change that increases the prevalence of many infectious and non-infectious diseases (125). In short, the 2021 Australian State of the Environment report stated it best: “Environmental degradation is now considered a threat to humanity, which could bring about societal collapses” (146).
3.3 Risk of overshoot
The steady rise of publications investigating human fertility and population that we identified using a search of the online engine PubMed (date range 01.01.1970 to 31.12.2022) dwindled sharply following the landmark 1994 International Conference on Population and Development held in Cairo (32) (Figure 5). That conference sparked a pivotal change in international discussions regarding population from the starting perspective of global population “control” through increased access and quality of family planning, to an individual-based model focused on improving the rights of women and girls through access to education and reproductive health services (33, 147). However, the meeting was dominated by voices from the Vatican and their views around contraception and abortion, which denuded discussion of topics such as the environmental impacts of population growth. This remains an ongoing issue because international policy discussions today still stifle the conversation on population. The United Nations Sustainable Development Goals do not mention slowing population growth, with only one Goal (3.7 Good Health and Wellbeing) mentioning universal access to sexual and reproductive health-care services (148). This lack of prioritization is further demonstrated because the role of population in international policies today is analyzed by a subsidiary group of the United Nations (United Nations Population Fund), who are supported only through voluntary contributions from governments and not through a regular budget (149).
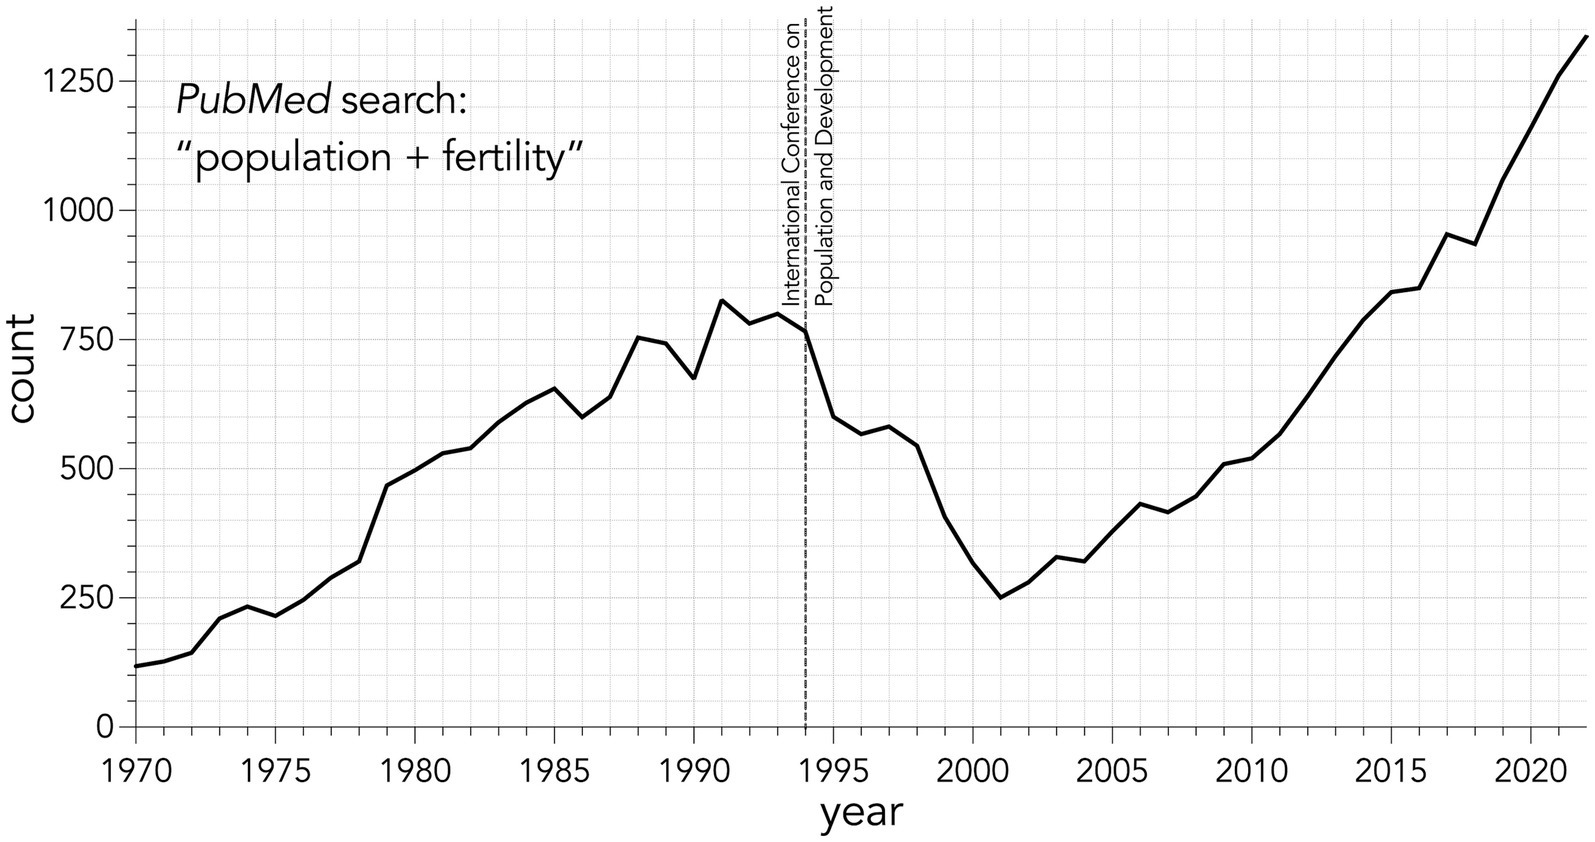
Figure 5. Annual total number of articles identified from PubMed using the search string “population + fertility” from 1970 to 2022.
Projections of population increase are inherently unreliable because the ultimate expression of future population depends heavily on even small changes in total fertility rate per country (see section 3.1.1). Intelligent discussion on overpopulation has also been inhibited due to concerns of “population control” related to past abuses arising from autocratic measures to limit fertility (150). Providing women and men the opportunity to determine the number and spacing of their children, free of coercion is not, by definition, “population control,” and was internationally recognized as a basic human right in 1968 (151). In particular, empowering women, especially disadvantaged women, to be able to make decisions about when and how many children they intend to have, improves their own lives as well as those of their children, and is a proven path to successful development (152). In 2006, only around half of the world’s population lived in countries with fertility rates at or below replacement, notably only in high-income countries (153).
Below we discuss some of the factors that lead to women choosing to have more children, thereby increasing fertility rates. There are many influences on a woman’s total fertility rate; we distill these into the following main categories: (i) demographic drivers, (ii) lack of access to contraceptives, (iii) child and maternal health, (iv) maternal education, and (v) social and cultural factors. We also discuss the principle that determining the optimal, case-by-case family size should not be left to women alone; men should also be provided with the education and free access to effective male contraception, allowing them to contribute actively in family-planning decisions.
3.3.1 Demography
The age at which women first give birth has a large impact on fertility rates, with an average younger age at first birth reducing the intergenerational gap, and increasing fertility rates over time (153). For example, if all women in a society started having children at the age of 20 years as opposed to 25, the population would be at least 20% larger in 100 years (assuming other factors remain unchanged) (154, 155). However, exceptions to this pattern have been observed within East Africa and Afghanistan, where subnationally, the highest teenage fertility rates do not always correspond with the highest fertility rates (152). This indicates the influence of additional behaviors and social norms, bearing in mind that East Africa and Afghanistan have some of the highest total fertility rates globally (152). Conversely, older average maternal age at first birth reduces reproductive lifespan, producing a lower average number of total children and lowering fertility rates overall (153, 156). Population (or “demographic”) momentum, a natural consequence of the demographic transition (154), where high fertility rates of the previous generation increase population growth in the current generation even when fertility rates are declining (157), is another contributor to higher population growth rates (158).
3.3.2 Lack of access to contraceptives and unintended pregnancies
An estimated 270 million women had an unmet need for family planning in 2019 (159), 85 million of which used traditional rather than modern methods of contraception (160). This number rose from 232 million in 1990 and is expected to rise to 272 million by 2030, mainly due to family-planning services in developing countries not keeping pace with the rapid population increase (159). Globally, approximately half of all pregnancies in 2015–2019 were unintended, which equates to 121 million unintended pregnancies annually (161). There is a strong inverse relationship between unintended pregnancy and World Bank income group, with sub-Saharan Africa experiencing the highest rate of unintended pregnancy, and Europe and North America, the lowest (161). Not every unintended pregnancy is unwanted; however, an estimated 61% of unintended pregnancies end in abortion, totaling 73.3 million abortions annually (161). In countries where abortion is restricted, the proportion of unintended pregnancies that end in abortion has increased since the early 1990s, and their rates of unintended pregnancy were higher than in countries where abortion was legal (161).
The post-Cairo framing on women’s rights primarily had an unintentional negative impact of taking the focus off access to family planning, and thus led to some governments deprioritizing family planning. This has occurred recently, with the UK government cutting 85% of its annual funding to the United Nations Population Fund (162). Domestic politics can also play a large role on global family planning services; for example, the major global funder, the United States Agency for International Development (USAID) has precluded the provision of abortion since 1984 under the “global gag rule” by anyone receiving those funds (163), depending on the sitting US president.
Access to contraceptives and non-coercive, quality family-planning services are mechanisms to help populations from attaining a size that generally reduces the standard of living, health, and wellbeing. Indeed, in sub-Saharan Africa where large families are common, the availability and quality of family-planning services had the largest effect on fertility of any explanatory variable (0.83 fewer births per woman) (164). However, subsequent research demonstrates that most variation in fertility among low- and middle-income nations can be explained by variation in child mortality, followed by household size (a proxy for population density), and then access to any form of contraception (165). That family-planning services educate parents about the benefits of investing in fewer children has been observed previously (164).
In addition to lowering fertility, family planning also improves the health of mothers and children. Contraceptive use, by reducing the number of births, therefore reduces the number of times a woman is exposed to birth-related mortality risks, and also reduces the incidence of problems arising from high-risk, high-parity births (166). Maternal mortality remains the leading cause of death and disability in reproductive-age women in low- and middle-income countries (167), with one study estimating over 1 million maternal deaths were averted between 1990 and 2005 in low- and middle-income countries through access to contraception (166). In 2008, an estimated 342,203 women worldwide died of maternal causes, with contraceptive use averting 272,040 deaths (preventing 44% of probable mortality), and if the unmet need for contraception was satisfied, another 104,000 maternal deaths could have been avoided (29%) (168). In Indonesia, contraceptive use averted an estimated 523,885–663,146 maternal deaths between 1970 and 2017 (169).
Contraceptives and other family-planning services allow women to modify the risks that come with pregnancies that are “… too early, too late, too many, or too frequent” (170). Shorter birth intervals were associated with higher infant and child mortality in a large longitudinal study in Bangladesh (171), thereby supporting the maternal depletion hypothesis where high fertility does not allow a woman to recuperate sufficiently from the nutrient/energy depletion caused by the first pregnancy or breastfeeding event to support a subsequent pregnancy (171). Longer birth intervals can increase the probability of nutrition repletion, which can positively affect fetal growth and newborn survival, although the results are equivocal among studies (172). Birth spacing of >24 months reduced the probability of child stunting in Indigenous communities of India, with increased access to family planning suggested as a major intervention to enable improved child health (173). Other mechanisms that might influence mortality risk of a short birth interval include sibling competition for parental time and resources, maternal wellbeing, and increased risk of disease transmission among similarly aged siblings (171). Furthermore, a short birth interval reduces infant survival (174, 175), thereby simultaneously increasing the woman’s probability of having another child, and reducing the time to the next birth (consistent with “replacement” behavior (176), whereby infant death truncates breastfeeding and reduces protection against fertility) (177).
When a young mother dies, there are cascading effects beyond the motherless infant. In 1990, 585,000 women died from pregnancy-related causes, leaving behind at least 1 million motherless children (170) who have twice the risk of dying compared to children whose father had died only, and daughters almost twice as likely to die compared to sons (170). Similarly, an Ethiopian study concluded that a maternal death imposed an increased chance of the infant dying 46 times higher than if the mother had survived (167). The HIV/AIDS epidemic has resulted in approximately 17 million children who lost one or both parents, with 90% of those children living in sub-Saharan Africa (178), and devastating consequences for individuals and communities (179). Given the dire consequences, it is surprising that access to safe, effective, affordable, and acceptable family-planning services has not improved since the 1994 Cairo meeting. In response, the 2012 London Summit on Family Planning developed goals for improved access, which have not yet been met (180).
Despite the overall stalling of family planning globally, there are successful examples in low- and middle-income nations due to political will and government leadership. Between 2005 and 2015, the Rwandan Government expanded and promoted family planning, increasing the use of contraceptives from 17 to 53% (181). Similarly, the Ugandan Government also recognized the immediate need for access to family planning and has pledged to increase funding (182), given that rapid population growth coupled with a high young-age dependency ratio (more young people than working-age people) is economically unsustainable and will prevent Uganda attaining middle-income status (182). Policy implemented over 5 years has already provided 1.5 million women with family-planning services and averted 8,000 maternal and 100,000 child deaths, and saved over US$300 million in pregnancy-related health-care costs.
3.3.3 Child health
Infant and child mortality has declined rapidly, with global infant mortality moving from 98.5 deaths/1000 live births in 1970 to 27.9 deaths/1000 live births in 2021 (i.e., a 3.5-fold reduction) (7). However, this impressive reduction belies high regional variability, with low- and middle-income countries disproportionately concentrating up to 99% of the world’s child mortality (sub-Saharan Africa 49 deaths/1000 live births, and South Asia 30 deaths/1000 live births) as of 2021 (7). Additionally, both climate change and the continuing rapid increase in population are expected to limit the rate of future mortality reduction. A complex and multifaceted relationship exists between population pressures, climate change, and child health. Because these aspects interlink in unique and often poorly understood ways, the exploration of this topic can easily become misdirected and overwhelming. Relationships are also confounded by social, economic, and geographical contexts, exemplified by considering two children from vastly different socio-economic-geographical backgrounds who both face the implications of overpopulation. A child who lives in an environment with poor access to healthcare, limited economic opportunities, and a governmental/political system limiting her ability to live healthily will be at a much greater risk of overpopulation-associated issues, such as malnutrition and decreased food security. Conversely, a child living in a country with greater socio-economic-health opportunities will be better equipped to deal with the pressures of a high-population and climate-disrupted future.
The literature on overpopulation and child health can be broadly categorized into (i) direct impacts, (ii) indirect impacts, and (iii) examination of physical and behavioral changes resulting from child-health status (Figure 6). Direct impacts of overpopulation on child health include the ways in which overpopulation exacerbates food insecurity, malnutrition, and therefore, poor health outcomes. The indirect impacts include more varied mechanisms often concerned with how overpopulation drives climate change that impedes child health. The ecological footprint concept (41) demonstrates that the combination of population and consumption outstrip the planet’s ability to sustain our collective behavior. Based on United Nations data from 2005 to 2007, approximately 800 million people globally are undernourished, and food requirements will need to increase by 40% by 2030 and 70% by 2050 to maintain this proportion of malnourishment (184). But food security is threatened by an increasing population straining vulnerable food-supply systems and by a changing climate damaging and limiting food production itself (185, 186). The geographical distribution of the Earth’s undernourished population is mainly in Asia (381 million undernourished) and Africa (250 million undernourished) (8) where overpopulation exacerbates the problem (187) and is centered on large nuclear families. Having limited economic resources in large families reduces nutrition and healthcare in children (187); therefore, overpopulation threatens child health by placing strain on economic resources.
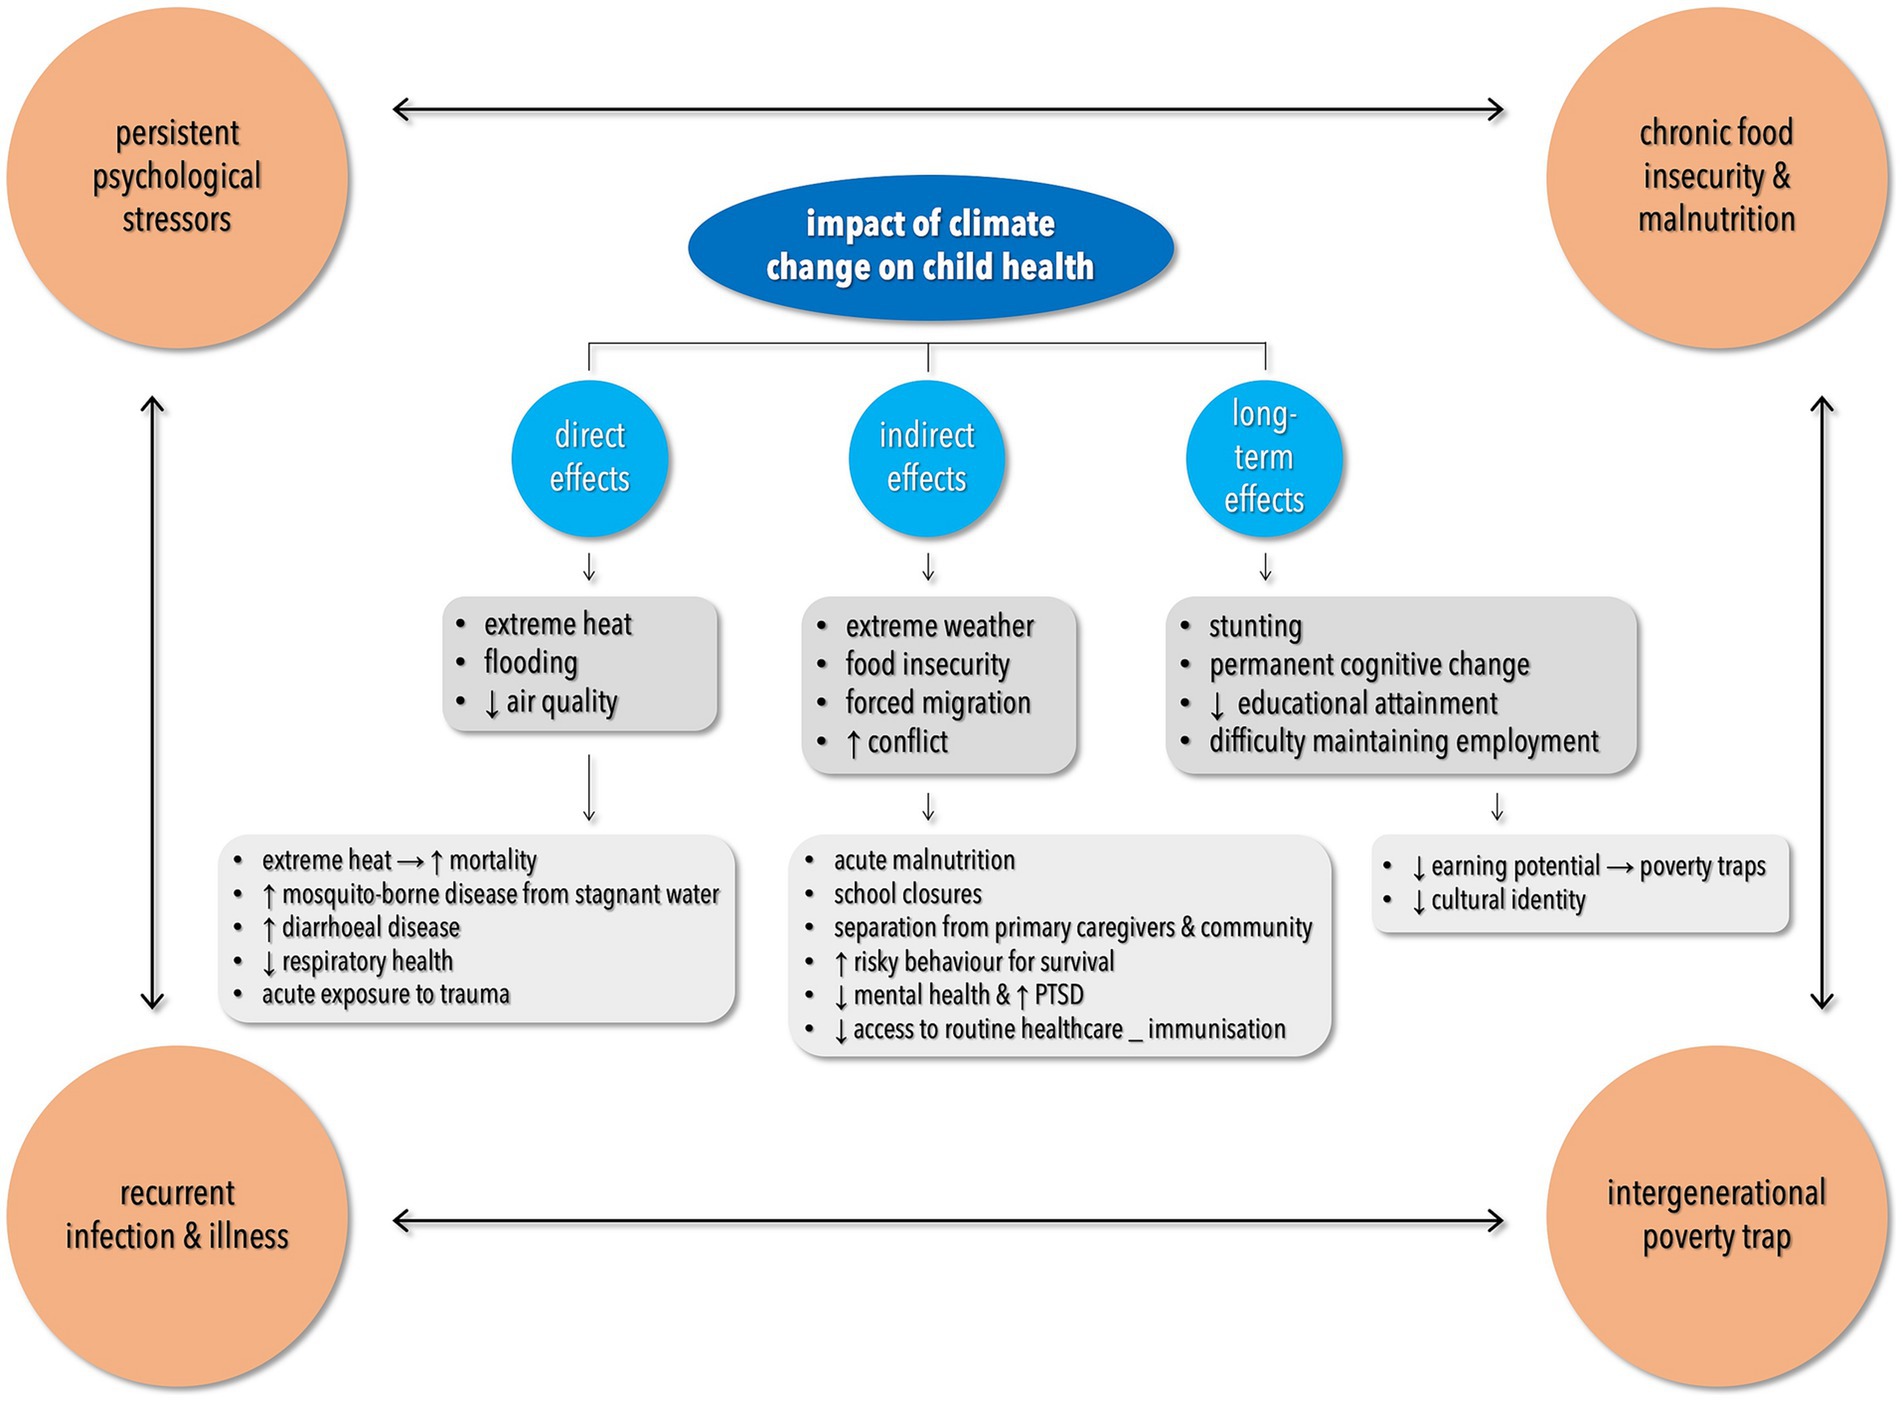
Figure 6. Climate change has direct, indirect, and long-term impacts on child health that are influenced by socio-economic and geographical conditions. Adapted with permission from Wiley (Ref. 183), © 2021 Paediatrics and Child Health Division (The Royal Australasian College of Physicians), https://doi.org/10.1111/jpc.15704.
Poor food security that begets malnutrition is not only underscored by limited economic capacity, but also by threats to the food-supply network, with climate change being one of the greatest threats operating mainly via increasing drought (186). Data based on the approximately 20% of malnourished children aged <5 years old in northern Kenya demonstrate that drought raises this percentage incrementally (188). In Ethiopia, a 1°C rise in average prenatal temperature was associated with a 28% increase in the odds of severe stunting in early life (189). Temperature increases can reduce crop yields, thereby restricting nutrition including for many pregnant women, resulting in lower birth-weight offspring and an increased prevalence of stunting and child mortality (190). In the Ethiopian context, an exception to this phenomenon exists in the cooler highlands, where a temperature increase often decreases frost damage to crops and consequently increases food security (189). Climate change alters other aspects of weather systems beyond drought. In Indonesia, a 40-day delay in the monsoon can reduce rice yield by 6.5–11% (191), while a 44-day delay led to a 6.3% decline in mean height-for-age in children (192). Such accumulative, short-term disruptions translate to losses in long-term nutritional status, regardless of the local region’s ability to recover from such an event.
Climate change affects almost every aspect of our environment, and so also affects human physiology and health, with children being one of the most vulnerable age groups (193). In fact, children will bear 88% of all health adverse consequences related to climate change given their unique physiological and behavioral characteristics, in addition to accumulated exposure (194). In New York, increased heat variability from climate change increased the prevalence of pediatric presentation to hospital (195). In the Northern Territory of Australia, temperature extremes lead to increased pneumonia presentations to hospital, especially for children (196). In both California (197) and Europe (198), heat is a risk factor for respiratory admissions, yet the causal mechanism is not well-understood. Extreme temperatures have also been associated with other undesirable health outcomes in children, namely low birth weight (199), stunting (189), low Apgar scores (200), and increased risk of stillbirth (201). Increasing humidity in wet seasons promotes transmission of respiratory infectious disease in both Brazil (202) and Indonesia (203).
Climate change-exacerbated air pollution threatens child health. Childhood exposure to oxidants (O3 and NO2) are associated with increased incidence of asthma and eczema (204), and early exposure to increased pollutant concentrations trigger atopic dermatitis in children (205). In Italy, a 10-grain m−3 rise in total aeroallergen concentration increased the risk of asthma presentation to hospital not only on the day of the event, but also 2 days afterwards (206). Bushfires are becoming more frequent due to climate change (186), producing air pollutants with detrimental health impacts. For example, a 1 μg m−3 increase in the concentration of fire-related PM2.5 is associated with a 2.17-g reduction in birth weight (207), and increases in fire-sourced air pollutants have been linked with increased risk of pregnancy loss (208).
Of the known effects of climate change on child health, preterm birth (209) is the best-described. Regions at the highest risk of preterm birth due to extreme heat are those with colder and drier climates (210). In Minnesota, USA, pregnant women exposed to a 7-day heatwave of >37°C faced greater risk of preterm birth (211). In China, pregnant women are at greatest risk of preterm delivery when exposed to extreme heat during the third trimester (212), and in Spain preterm birth risk increased up to 20% when maximum temperature exceeded the 90th percentile over the 2 days prior to delivery (213). Similar results abound in many other regions of the world—e.g., Belgium (214), Australia (215), and Israel (209). Thus, while overpopulation threatens child health directly, it also drives anthropogenic climate change that, in itself, degrades child health (216).
3.3.4 Maternal education
The effect of maternal education on human fertility is complicated and equivocal depending on which aspects of “education” are measured, and the scale of investigation. Within nations, there is evidence that higher female education lowers fertility; for example, in Nigeria each additional year of education reduced fertility by 0.26 births/woman on average, as well as increased the age at primiparity (217, 218). Likewise, data from Ethiopia, Kenya, Tanzania, and Zimbabwe revealed that fertility fell most, and birthing interval increased most, among women with secondary education from the 1970s to the 2000s (219).
At broader spatial scales (among-country), the influence of maternal education on fertility is more ambiguous. Based on Demographic and Health Survey data from 43 countries, increasing educational attainment correlated with lower fertilities (220). The most-accepted paradigm—based on ample time-series data from single countries; e.g., Brazil (221), Kenya (222), Bangladesh (223), India (224)—is that child mortality declines as a mother’s years of education increases, thereby de-incentivizing families to have more children. However, a more recent study examining data for 64 low- and middle-income nations revealed that while child mortality was the strongest predictor of variation in fertility, female education attainment (years of education completed) did not provide any additional explanatory power (165). However, it remains unclear whether education, while providing increased autonomy, is most responsible for the reduction in fertility per se (222), instead of the ability to seek medical interventions, the socioeconomic impact of higher-income employment, or a high-income earning husband. While strongly correlated, the link might not be causal, with maternal education acting more as a proxy for socio-economic status and geographic area of residence (225).
3.3.5 Social and cultural influences
Fertility is sequential, time-limited, and non-reversible, with fertility rate varying as a function of tempo components (i.e., age at primiparity, birth intervals) and quantum (e.g., whether parents can afford a large family, name continuation, potential contribution to household economies) (226). Thus, several other dimensions dictate fertility trends beyond education, infant mortality, and access to family planning. For example, a study of 70 low- and middle-income countries with high-fertility clusters determined that while low female secondary education attainment, low contraceptive use, and high unmet need for family planning were partially responsible (152), it also identified high-fertility clusters in areas crossing country borders, suggesting an influence of local cultural values rather than country-specific family-planning policies (152). Urbanization itself has been linked to lower fertility, but the quality of modernization arising from urbanization (e.g., economic opportunities) is an important element modifying the expected relationship (227). Some cultures also emphasize sons over daughters. This can manifest as shorter birth intervals when the previous child was a daughter (228), or the higher likelihood of opting for a “replacement” birth following the death of a son compared to a daughter (229).
Governments also introduce policies that affect population growth. In 1978 in China, statisticians and economists determined that population growth had to be reduced to reach the aim of quadrupling the per-capita national income, thereby laying the foundation for the one-child policy (230). Despite reaching the goal of reduced population growth, the violation of human rights was abhorrent. Similar results might have been achieved through the provision of quality, non-coercive, culturally appropriate family-planning services. Conversely, other parts of the world are currently experiencing cultural and religious barriers undermining women’s hard-won rights to exercise choice. In 2020, the USA reduced funding and access to family planning services (231, 232), and Russia has recently prioritized “population growth” as a top health priority (233). Hungary and Poland, two countries with a history of restricting women’s rights under conservative governments (234, 235), have near-total bans on abortions, reducing access in recent years (236–238).
3.4 Concerns about aging and declining populations
3.4.1 Population decline
Concerns (239–242) about population decline are rooted primarily in fears of an associated economic decline, with a potential reduction in gross domestic product a commonly used argument. Here, a population decline is assumed to lower the number of working adults, subsequently lowering productivity, and thus lowering national gross domestic product. The arguments against the validity of brute measures of market activity as reasonable indices of national wealth notwithstanding (243), a decline in gross domestic product is proposed to reduce innovation and lead to economic and fiscal challenges; indeed, traditional economic thought sees population growth as a major source of economic growth (241, 244). Lower growth of gross domestic production might also be driven by a reduction in domestic consumption as older people are thought to purchase fewer consumer durables than younger people. Another identified concern ensuing from low economic growth is a shift in geopolitical power as currently, higher gross domestic product is associated with higher geopolitical power. Other potential issues of a declining population include complexities in fiscal policies such as national health insurance and social security (245). Fears surround a contracting working population being burdened by an expanding aging population (246).
These concerns ignore existing evidence regarding the many economic and wellbeing advantages of smaller populations. First, the fear of population decline ignores that none of the existing population projections (see section 3.1.1) predict a decline in the global population (7, 13, 14). The global population is still growing (Figure 1), so the possibility of a “population collapse” over the coming century is nil. Second, stated concerns inherently assume a reduction in gross domestic product is a negative outcome, yet economic models show this indicator does not necessarily measure wellbeing, either for individuals or the planet (247). Continued growth in gross domestic product is an unconstrained, capitalist, pro-growth view that is not sustainable. Neither do lower fertility rates themselves imply lower economic growth. In fact, reduced fertility can increase capital per worker and per-capita consumption provided by human capital investments (248, 249). Lower fertility rates are also proposed to increase income per capita and lower carbon emissions through changes in total population size, age structure, and economic output (250). Assumed negative impacts also make unsupported assumptions about the continuation of past productivity trends, which are themselves mitigated by developments in technology. It is therefore difficult to quantify the potential effect of technology on future economic growth, because technology can also buffer change via low-cost labor supply (251).
More importantly, lower populations provide environmental advantages. Indeed, the available evidence shows that only 25% of the increase in greenhouse-gas emissions globally is attributable to per-capita increases in consumption, whereas 75% is due to population growth (252, 253). However, the IPCC Climate Change Synthesis Report Summary for Policymakers (1) does not mention population growth as a major diver of climate change. A decrease in population growth would reduce global emissions provided that consumption decreases at a comparable rate in the short term, but should promote large emission reductions in the long term. If the unmet need for family planning was filled, global emissions could be reduced by an estimated 0.7–1.25 Gt of carbon year−1, or approximately 8–15% of the reduction in emissions needed to avoid warming of >2°C by 2050 (254–256). Based on projections from the United Nations 2004 World Population Prospects (7.4, 8.9, and 10.6 billion by 2050 for the low, medium, and high scenarios, and 5.5, 9.1, and 14.0 billion by 2100, respectively) (257), the low-growth path would reduce emissions by 1.4 Gt year−1 by 2050 (−15%) and 5.1 Gt year−1 by 2100 (−40%) compared to the medium path (258). In contrast, the high-growth path would increase global emissions by 1.7 Gt year−1 by 2050 (+17%) and 7.3 Gt year−1 by 2100 (+60%) compared to the medium path (258). While many assumptions underlie these estimates (e.g., economic growth trends, technological shifts, energy transitions, population structure, urbanization), they do not take resource constraints or environmental degradation limiting population growth into account (257). For example, urbanization alone is expected to increase projected emissions by >25%, especially in the case of developing regions (259). However, urban living is more energy efficient than rural living after controlling for income, which can cause a net decrease in emissions (259). Additionally, rapid urbanization can hasten the transition to cleaner fuels (260, 261).
Alternatively, population growth is potentially disadvantageous to a country’s economy if it cannot keep up with the rising number of people to employ youth productively (262). For example, Angola’s population growth rate of 3% year−1 since 1970 increased the population of 6 million to 33 million today—one of the world’s highest rates of annual population growth (263, 264). Accompanying this growth is its poverty rate that increased by 15% between 2008 and 2018 (265). Angola’s youth today suffer from poor living standards that its government and economy are unable to alleviate (266).
Even those economists purporting “profound social and economic implications” (246) state that the transition to older societies in a few countries (e.g., Japan) is “manageable” via structural reforms, technological advances, and debt stabilization. No financial “crisis” is on the horizon, but there will be a requirement to adjust existing fiscal policies, including to health systems and retirement funding (245). Furthermore, such adjustments are entirely realistic in the low-corruption, high rule-of-law countries where aging populations are of concern.
In conclusion, a downward trajectory of fertility and population growth rates is in our collective interest. There is no evidence that a lower population growth rate is necessarily detrimental to an economy.
3.4.2 Aging populations
A rise in the global aging population is another argument raised to promote population growth. The concerns mirror those stated for population declines: labor shortages, increased government expenditure in health care and pension funds, and reduced consumption—all culminating in economic decline (239–242). Labor shortages are feared to drive up prices and lower living standards. The proportion of persons aged ≥65 years globally is indeed projected to rise from 10% in 2022 to 16% in 2050 (7). This changing age structure will create some demographic challenges, as existing economic and fiscal policies will need to be restructured, but these are not unsolvable; further, increasing fertility rates, commonly proposed as a solution, will only worsen the problem.
The most commonly used variant of the dependency ratio—defined as the ratio of the number of people aged ≥65 to the number people aged 15–64, is projected to increase from 16% in 2019 to 28% in 2050 (267). But this 75% increase can be misleading because it does not fully represent the number of “dependents” relative to the working population. First, workforce participation of people ≥65 years has been increasing in countries with an aging population such as USA and Japan, especially in those with the highest number of years of education (268, 269). Second, people aged ≥65 are not necessarily economically dependent. Volunteering in old age is a sizable economic sector; a study in Canada proposed that even with conservative estimates of hourly wage, the sector was worth 2 billion US dollars in 2008 (270). Third, ignoring the cost savings associated with fewer children <15 years old artificially inflates the dependency ratio (271).
Fears of an associated economic decline are unsubstantiated; investing in the health, training, and education of workers—especially older, experienced workers—in fact increases human capital, effectively making the workforce more productive (245). Concerns regarding labor shortages are also unfounded. There is no basis for an expected penury of working-age people for countries experiencing low population growth or even decline—the question reverts instead to inadequate immigration policies that limit or deny the movement of capable, working-age people from elsewhere to fill local demand. But if immigration is used to increase population growth per se (cf. fill labor vacancies), the concomitant increase in resource use and emissions resulting from immigrants increasing their per capita consumption rates upon successful migration to higher-income nations (271, 272) contribute to growing environmental damage.
While there will inevitably be economic and fiscal challenges accompanying aging populations (245, 246), their solutions rely more on wise policy responses, such as redesigning pension financing, investing in education to enlarge the effective workforce, and a delayed retirement age to promote higher income taxes, which subsequently improves healthcare (245). It is telling that few academic papers provide support for envisaged catastrophic consequences of population decline and aging populations (241); almost all papers in the field acknowledge existing policy implementations that successfully address these challenges. Unfortunately, misinformed and alarmist arguments against a sustainable global population remain mainstream tropes (240).
4 Discussion
4.1 Avoiding the risks associated with overpopulation
After discussing the risks associated with high population size and the reasons why the global population has already overshot the planet’s carrying capacity, we come to our central question: how do we prevent the worst-case scenario from occurring? First, we must consider our current economic model and its role in determining sustainable pathways forward.
The vicious cycle of population increase exacerbated by anthropogenic climate change, leading to even more climate change, and population growth, is a phenomenon not experienced equally globally. For example, the impact of climate change on food systems will affect everyone, but disadvantaged groups such as women, older adults, children and women in low-income households, Indigenous peoples, minorities, and smallholders, will be disproportionately burdened with malnutrition, livelihood loss, and rising costs exacerbating the cycle of existing inequalities (2). The principal drivers of anthropogenic climate change are also unequal—half of consumption-related emissions are generated by only 10% of people globally (273). Children are the most affected group, yet are not autonomous and must rely on the actions of adults, so it is incumbent on us to be their voice and protect their future.
Fulfilling a “safe and just space for all” (247) therefore requires empowering women, improving health and wellbeing for women and their children, and increasing economic prosperity (247)—actions that conveniently all lower fertility rates (274). Falling fertility is indicative of economic development, with delayed childbirth and fewer children consequences of education and career goals, and because of increased access to family planning. In many ways, lower fertility rates observed in developed countries are an indicator of female autonomy, empowerment, and equity. But women in low- and middle-income countries face multiple barriers to family-planning needs, as do an increasing number of women in high-income countries when laws and politics encroach on individual options. While the direct causality of education and fertility is unclear (275) (see section 3.3.4), there is a strong relationship between the years of maternal schooling and the probability of her children surviving (276–278). Given the most important, broad-scale determinant of reduced fertility is lower child mortality (165), the benefits are clear.
Improving women’s rights positively affects economic development (279, 280); therefore, addressing social and economic disparities are essential actions for nations to create a more just future. Indeed, the Global Burden of Diseases Study 2019 found overwhelming evidence that social and economic development is highly correlated with positive health outcomes, and proposed prioritization to improve the status of women, expanding access to education, and stimulating economic growth through policies and strategies (281). Put simply, a healthy population is a productive population; increasing access to education accumulates human capital and improves productivity. Improving the status of women kick-starts the process of human-capital accumulation, because maternal education both directly and indirectly affects their children’s educational attainment (282, 283).
Persistently low fertility in high-income nations cannot be attributed solely to economic stressors, unemployment, lack of progressive public policies, or popular trends (e.g., postponing reproduction) (226, 284), because the phenomenon has persisted for too long and become a structural aspect of the developed world (244). For example, the demographic transition that occurred in Europe led to greater reproductive efficiency, meaning that before the transition, women spent ~70% of their adult lives bearing and rearing children (285). The corollary was that post-transition, women were massively liberated from “wasting investments” on children who ultimately died (286). Sustained high fertility and rapid population growth therefore impede sustainable development, counter to policies adopted by some countries such as Russia to prioritize population growth (233).
Policy discussions regarding overpopulation are beset by ideologies that underlie competing perspectives (287–289). Many governments attempt to boost their economic and political advantage by promoting population growth to overwhelm their less-populous neighbors (287), and there exists an unquestioned “wisdom” that has evolved over the course of human evolution that more people equates to doing better, because it meant more food, more capability, and better defenses (290). In contrast, rapid and unsustainable population growth hinders nation-level development, with China’s one-child policy an extreme example of a country limiting population growth to boost economic development (291). There has been a long-held consensus that incorporating policies and programs to reduce high fertility in developing countries is a pathway to economic development (292–294). Many have also labeled those who identify population growth as an existential challenge as “racist” and socially irresponsible for “blaming” low-income nations for overpopulation (295–297); hence, there is a reticence to engage in emotionally charged debates on the topic (287, 289). Constructive discussion on overpopulation is further inhibited because of concerns of perceived “population control” related to past abuses arising from autocratic measures to limit fertility. Providing women and men the opportunity to determine their family size free of any form of coercion cannot be deemed “population control”—rather, it is an important human right that has been neglected. In particular, empowering women—especially disadvantaged women—to make decisions about when and how many children they have, will have positive impacts on their lives and the lives of their children, and is a proven path to development.
5 Conclusion
The many benefits associated with lower population growth and size are unassailable, especially given the necessity of mitigating the severity of climate change over the coming centuries. But achieving “optimal” human population sizes will require major social changes that are embedded within appropriate social-cultural-ecological contexts while simultaneously respecting planetary boundaries (39, 298, 299). While we conclude that smaller human populations benefit the most people, we emphasize that we are not advocating an end to childbirth. Rather, we join the globally progressive voice of promoting the empowerment of girls and women worldwide through ethical and practical solutions to determining their own fertility. Unfortunately, neocolonial attitudes still obfuscate the links between population and environmental degradation in low- and middle-income nations, so traction for quality family planning in these fastest-growing regions has stalled. We also emphasize that determining family size should not be left to women alone; men also need to be educated adequately and provided with contraceptive options to allow them to promote prosperous and just outcomes for their family. The problems of overpopulation we outline here will not be addressed entirely through family planning and education, as beneficial as these are. Working to increase child health and implementing policies that addresses food security and climate change will also help to reduce population growth further, bringing about many corollary benefits to human societies.
Author contributions
CS: Conceptualization, Data curation, Investigation, Methodology, Writing – original draft. MJ: Conceptualization, Data curation, Funding acquisition, Investigation, Methodology, Validation, Writing – original draft, Writing – review & editing. LW: Data curation, Investigation, Resources, Writing – review & editing. QB: Resources, Validation, Writing – review & editing. NP: Methodology, Validation, Writing – review & editing. PS: Conceptualization, Funding acquisition, Investigation, Resources, Supervision, Writing – original draft, Writing – review & editing. CB: Conceptualization, Formal analysis, Investigation, Methodology, Resources, Visualization, Writing – original draft, Writing – review & editing.
Funding
The author(s) declare financial support was received for the research, authorship, and/or publication of this article. Telethon Kids Institute and Population Matters provided funding to support various aspects of the project.
Acknowledgments
We thank to R. Maynard for comments on earlier drafts.
Conflict of interest
The authors declare that the research was conducted in the absence of any commercial or financial relationships that could be construed as a potential conflict of interest.
Publisher’s note
All claims expressed in this article are solely those of the authors and do not necessarily represent those of their affiliated organizations, or those of the publisher, the editors and the reviewers. Any product that may be evaluated in this article, or claim that may be made by its manufacturer, is not guaranteed or endorsed by the publisher.
References
1. IPCC. Summary for policymakers In: H-O Pörtner, DC Roberts, ES Poloczanska, K Mintenbeck, M Tignor, and A Alegría, et al., editors. Climate change 2022: impacts, adaptation, and vulnerability: contribution of working group II to the sixth assessment report of the intergovernmental panel on climate change. Cambridge: Cambridge University Press (2022). 3–33.
2. IPCC. Climate change 2022: impacts, adaptation, and vulnerability. H-O Pörtner, DC Roberts, ES Poloczansk, K Mintenbeck, M Tignor, and A Alegría, et al., editors. Contribution of working group II to the sixth assessment report of the intergovernmental panel on climate change. Cambridge: Cambridge University Press (2022).
3. Allan, J, Antonich, B, Bhandary, RR, Luomi, M, Schulz, A, and Wiseman, V. Summary of the Paris climate change conference: 29 November–13 December 2015. Earth Negot Bull. (2015) 12:1–47. Available at: https://enb.iisd.org/paris-climate-change-conference-cop21/summary-report.
4. Allan, J, Bansard, J, Jones, N, Luomi, M, Tan, JM, and Sun, Y. Glasgow climate change conference: 31 October – 13 November 2021. Earth Negot Bull. (2021) 12:1–40. Available at: https://unfccc.int/conference/glasgow-climate-change-conference-october-november-2021.
5. Kopnina, H, and Washington, H. Discussing why population growth is still ignored or denied. Chin J Pop Res Environ. (2016) 14:133–43. doi: 10.1080/10042857.2016.1149296
6. Mason, A, and Lee, Rmembers of the NTA Network. Six ways population change will affect the global economy. Pop Dev Rev. (2022) 48:51–73. doi: 10.1111/padr.12469
7. United Nations Department of Economic and Social Affairs Population Division. World population prospects 2022: summary of results. New York, NY: United Nations (2022).
8. United Nations Department of Economic and Social Affairs Sustainable Development. Goal 2: end hunger, achieve food security and improved nutrition and promote sustainable agriculture United Nations (2023) Available at: sdgs.un.org/goals/goal2.
9. Koubi, V. Climate change and conflict. Annu Rev Polit Sci. (2019) 22:343–60. doi: 10.1146/annurev-polisci-050317-070830
10. Philipsborn, RP, and Chan, K. Climate change and global child health. Pediatrics. (2018) 141:e20173774. doi: 10.1542/peds.2017-3774
11. Horton, R. The world's forgotten children. Lancet. (2023) 401:1142. doi: 10.1016/S0140-6736(23)00728-6
12. Roser, M, Ritchie, H, Ortiz-Ospina, E, and Rodés-Guirao, L. World population growth. (2023). Available at: ourworldindata.org/world-population-growth.
13. Lutz, W, Goujon, A, Samir, KC, Stonawski, M, and Stilianakis, N. Demographic and human capital scenarios for the 21st century: 2018 assessment for 201 countries. Luxembourg: Publications Office of the European Union (2018). doi: 10.2760/835878
14. Vollset, SE, Goren, E, Yuan, C-W, Cao, J, Smith, AE, Hsiao, T, et al. Fertility, mortality, migration, and population scenarios for 195 countries and territories from 2017 to 2100: a forecasting analysis for the global burden of disease study. Lancet. (2020) 396:1285–306. doi: 10.1016/S0140-6736(20)30677-2
15. Gietel-Basten, S, and Sobotka, T. Trends in population health and demography. Lancet. (2021) 398:580–1. doi: 10.1016/S0140-6736(21)01051-5
16. O'Sullivan, JN. Trends in population health and demography. Lancet. (2021) 398:580. doi: 10.1016/S0140-6736(21)01050-3
17. Bongaarts, J. Human population growth and the demographic transition. Philos Trans R Soc B. (2009) 364:2985–90. doi: 10.1098/rstb.2009.0137
18. United Nations Department of Economic and Social Affairs. Manuals on methods of estimating population. Manual III. Methods for population projections by sex and age. Population Studies No. 25. New York, NY: United Nations (1956).
19. Haileamlak, A. Pandemics will be more frequent. Ethiop J Health Sci. (2022) 32:228. doi: 10.4314/ejhs.v32i2.1
20. Ullah, MA, Moin, AT, Araf, Y, Bhuiyan, AR, Griffiths, MD, and Gozal, D. Potential effects of the COVID-19 pandemic on future birth rate. Front Pub Health. (2020) 8:578438. doi: 10.3389/fpubh.2020.578438
21. Samir, KC. Updated demographic SSP4 and SSP5 scenarios complementing the SSP1-3 scenarios published in 2018. Laxenburg: International Institute for Applied Systems Analysis (2020).
22. World Health Organization. The global health observatory. Total fertility rate (per woman). (2023). Available at: who.int/data/gho/indicator-metadata-registry/imr-details/123.
23. Adam, D. How far will global population rise? Researchers can’t agree. Nature. (2021) 597:462–5. doi: 10.1038/d41586-021-02522-6
24. Gietel-Basten, S, and Sobotka, T. Uncertain population futures: critical reflections on the IHME scenarios of future fertility, mortality, migration and population trends from 2017 to 2100. OSF Preprints. (2020). doi: 10.31235/osf.io/5syef
25. Engelman, R. Population, climate change, and women’s lives. Worldwatch report 183. Washington, DC: Worldwatch Institute (2010).
26. Engelman, R. Stabilizing the atmosphere: population, consumption and greenhouse gases. Washington, DC: Population Action International, Population and Environment Program (1994).
27. Engelman, R. Human numbers and a changing climate: reducing emissions through cost-effective strategies. Georgetown J Intl Aff. (2014) 15:10–6. Available at: https://www.jstor.org/stable/43773622.
28. Engelman, R. Imagining a stabilized atmosphere: population and consumption interactions in greenhouse gas emissions. J Environ Dev. (1995) 4:111–40. doi: 10.1177/107049659500400106
29. Ehrlich, PR, and Holdren, J. Impact of population growth. Science. (1971) 171:1212–7. doi: 10.1126/science.171.3977.1212
30. Waggoner, PE, and Ausubel, JH. A framework for sustainability science: a renovated IPAT identity. Proc Natl Acad Sci USA. (2002) 99:7860–5. doi: 10.1073/pnas.122235999
31. Dietz, T, and Rosa, EA. Rethinking the environmental impacts of population, affluence and technology. Hum Ecol Rev. (1994) 1:277–300.
32. United Nations Population Fund In: International conference on population and development (ICPD). Cairo: United Nations (1994)
33. United Nations Population Fund. Programme of Action. Adopted at the International Conference on Population and Development, Cairo, 5–13 September 1994. Cairo: United Nations (1994).
34. Pörtner, H-O, Roberts, DC, Poloczanska, ES, Mintenbeck, K, Tignor, M, Alegría, A, et al. Technical summary In: H-O Pörtner, DC Roberts, ES Poloczanska, K Mintenbeck, M Tignor, and A Alegría, et al. editors. Climate change 2022: impacts, adaptation and vulnerability. Contribution of working group II to the sixth assessment report of the intergovernmental panel on climate change. Cambridge: Cambridge University Press (2022). 37–118.
35. O’Neill, DW, Fanning, AL, Lamb, WF, and Steinberger, JK. A good life for all within planetary boundaries. Nat Sustain. (2018) 1:88–95. doi: 10.1038/s41893-018-0021-4
36. BP. Statistical review of world energy. (2022). Available at: bp.com/en/global/corporate/energy-economics/statistical-review-of-world-energy.html.
37. Satterthwaite, D. The implications of population growth and urbanization for climate change. Environ Urbaniz. (2009) 21:545–67. doi: 10.1177/0956247809344361
38. Bradshaw, CJA, Giam, X, and Sodhi, NS. Evaluating the relative environmental impact of countries. PLoS One. (2010) 5:e10440. doi: 10.1371/journal.pone.0010440
39. IPCC In: V Masson-Delmotte, P Zhai, H-O Pörtner, D Roberts, J Skea, and PR Shukla, et al., editors. Global warming of 1.5°C. Geneva: Intergovernmental Panel on Climate Change (2018)
40. Crist, E, Mora, C, and Engelman, R. The interaction of human population, food production, and biodiversity protection. Science. (2017) 356:260–4. doi: 10.1126/science.aal2011
41. Global Ecological Footprint. Global footprint network. (2023). Available at: footprintnetwork.org.
42. Population Matters. Resources and consumption (2023). Available at: populationmatters.org/the-facts-resources-consumption/.
43. Zhu, J, Luo, Z, Sun, T, Li, W, Zhou, W, Wang, X, et al. Cradle-to-grave emissions from food loss and waste represent half of total greenhouse gas emissions from food systems. Nat Food. (2023) 4:247–56. doi: 10.1038/s43016-023-00710-3
44. United Nations Environment Programme. Food waste index report 2021. Nairobi: United Nations (2021).
45. Kaza, S, Yao, L, Bhada-Tata, P, Woerden, FV, Ionkova, K, Morton, J, et al. What a waste 2.0: a global snapshot of solid waste management to 2050. Washington, DC: International Bank for Reconstruction and Development/World Bank (2018).
46. Dyke, J, Watson, R, and Knorr, W. Climate scientists: concept of net zero is a dangerous trap The Conversation (2021) Available at: theconversation.com/climate-scientists-concept-of-net-zero-is-a-dangerous-trap-157368.
47. Food and Agriculture Organization of the United Nations. The state of food and agriculture 2020: overcoming water challenges in agriculture. Rome: Food and Agriculture Organization of the United Nations (2020).
48. Veldkamp, TIE, Wada, Y, Aerts, JCJH, and Ward, PJ. Towards a global water scarcity risk assessment framework: incorporation of probability distributions and hydro-climatic variability. Environ Res Lett. (2016) 11:024006. doi: 10.1088/1748-9326/11/2/024006
49. Gleick, PH. Global freshwater resources: soft-path solutions for the 21st century. Science. (2003) 302:1524–8. doi: 10.1126/science.1089967
50. Gleick, PH. Transitions to freshwater sustainability. Proc Natl Acad Sci USA. (2018) 115:8863–71. doi: 10.1073/pnas.1808893115
51. Mancosu, N, Snyder, RL, Kyriakakis, G, and Spano, D. Water scarcity and future challenges for food production. Water. (2015) 7:975–92. doi: 10.3390/w7030975
52. Toensmeier, E, Mehra, M, Frischmann, C, and Foley, J. Farming our way out of the climate crisis. San Francisco, CA: Project Drawdown (2020).
53. Ahmed, J, Almeida, E, Aminetzah, D, Denis, N, Henderson, K, Katz, J, et al. Agriculture and climate change: reducing emissions through improved farming practices. New York: McKinsey & Company (2020).
54. Food and Agriculture Organization of the United Nations. The state of food and agriculture 2016: climate change, agriculture and food security. Rome: Food and Agriculture Organization of the United Nations (2016).
55. Gavrilova, O, Leip, A, Dong, H, MacDonald, JD, Bravo, CAG, Amon, B, et al. Chapter 10: emissions from livestock and manure management In: D Gómez and W Irving, editors. 2019 refinement to the 2006 IPCC guidelines for national greenhouse gas inventories. Geneva: Intergovernmental Panel on Climate Change (2019)
56. Gerber, PJ, Steinfeld, H, Henderson, B, Mottet, A, Opio, C, Dijkman, J, et al. Tackling climate change through livestock: a global assessment of emissions and mitigation opportunities. Rome: Food and Agriculture Organization of the United Nations (2013).
57. Reay, DS, Davidson, EA, Smith, KA, Smith, P, Melillo, JM, Dentener, F, et al. Global agriculture and nitrous oxide emissions. Nat Clim Chang. (2012) 2:410–6. doi: 10.1038/nclimate1458
58. Brook, BW, and Bradshaw, CJA. Key role for nuclear energy in global biodiversity conservation. Conserv Biol. (2015) 29:702–12. doi: 10.1111/cobi.12433
59. Heard, BP, Brook, BW, Wigley, TML, and Bradshaw, CJA. Burden of proof: a comprehensive review of the feasibility of 100% renewable-electricity systems. Renew Sust Energ Rev. (2017) 76:1122–33. doi: 10.1016/j.rser.2017.03.114
60. Lowder, SK, Skoet, J, and Raney, T. The number, size, and distribution of farms, smallholder farms, and family farms worldwide. World Dev. (2016) 87:16–29. doi: 10.1016/j.worlddev.2015.10.041
62. Scialabba, N. Food wastage footprint and climate change. Rome: Food and Agriculture Organization of the United Nations (2015).
63. Popkin, BM. The nutrition transition and its health implications in lower-income countries. Pub Health Nutr. (1998) 1:5–21. doi: 10.1079/PHN19980004
64. Godfray, HCJ, Aveyard, P, Garnett, T, Hall, JW, Key, TJ, Lorimer, J, et al. Meat consumption, health, and the environment. Science. (2018) 361:eaam5324. doi: 10.1126/science.aam5324
65. Gibbs, J, and Cappuccio, FP. Plant-based dietary patterns for human and planetary health. Nutrients. (2022) 14:14. doi: 10.3390/nu14081614
66. Wynes, S, and Nicholas, KA. The climate mitigation gap: education and government recommendations miss the most effective individual actions. Environ Res Lett. (2017) 12:074024. doi: 10.1088/1748-9326/aa7541
67. Fuller, R, Landrigan, PJ, Balakrishnan, K, Bathan, G, Bose-O'Reilly, S, Brauer, M, et al. Pollution and health: a progress update. Lancet Planet Health. (2022) 6:e535–47. doi: 10.1016/S2542-5196(22)00090-0
68. Li, J, Yang, J, Liu, M, Ma, Z, Fang, W, and Bi, J. Quality matters: pollution exacerbates water scarcity and sectoral output risks in China. Water Res. (2022) 224:119059. doi: 10.1016/j.watres.2022.119059
69. Lobell, DB, Di Tommaso, S, and Burney, JA. Globally ubiquitous negative effects of nitrogen dioxide on crop growth. Sci Adv. (2022) 8:eabm9909. doi: 10.1126/sciadv.abm9909
70. Ceballos, G, Ehrlich, PR, and Dirzo, R. Biological annihilation via the ongoing sixth mass extinction signaled by vertebrate population losses and declines. Proc Natl Acad Sci USA. (2017) 114:E6089–96. doi: 10.1073/pnas.1704949114
71. Bradshaw, CJA, Ehrlich, PR, Beattie, A, Ceballos, G, Crist, E, Diamond, J, et al. Underestimating the challenges of avoiding a ghastly future. Front Conserv Sci. (2021) 1:9. doi: 10.3389/fcosc.2020.615419
72. Bradshaw, CJA, Craigie, I, and Laurance, WF. National emphasis on high-level protection reduces risk of biodiversity decline in tropical forest reserves. Biol Conserv. (2015) 190:115–22. doi: 10.1016/j.biocon.2015.05.019
73. Williams, J. Humans and biodiversity: population and demographic trends in the hotspots. Pop Env. (2013) 34:510–23. doi: 10.1007/s11111-012-0175-3
74. Cincotta, RP, Wisnewski, J, and Engelman, R. Human population in the biodiversity hotspots. Nature. (2000) 404:990–2. doi: 10.1038/35010105
75. Jha, S, and Bawa, KS. Population growth, human development, and deforestation in biodiversity hotspots. Conserv Biol. (2006) 20:906–12. doi: 10.1111/j.1523-1739.2006.00398.x
76. Thompson, K, and Jones, A. Human population density and prediction of local plant extinction in Britain. Conserv Biol. (1999) 13:185–9. doi: 10.1046/j.1523-1739.1999.97353.x
77. Kirkland, GL, and Ostfeld, RS. Factors influencing variation among states in the number of federally listed mammals in the United States. J Mammal. (1999) 80:711–9. doi: 10.2307/1383240
78. Kerr, JT, and Currie, DJ. Effects of human activity on global extinction risk. Conserv Biol. (1995) 9:1528–38. doi: 10.1046/j.1523-1739.1995.09061528.x
79. McKinney, ML. Role of human population size in raising bird and mammal threat among nations. Anim Conserv. (2001) 4:45–57. doi: 10.1017/S1367943001001056
80. McKee, JK, Sciulli, PW, Fooce, CD, and Waite, TA. Forecasting global biodiversity threats associated with human population growth. Biol Conserv. (2004) 115:161–4. doi: 10.1016/S0006-3207(03)00099-5
81. Di Minin, E, Clements, HS, Correia, RA, Cortés-Capano, G, Fink, C, Haukka, A, et al. Consequences of recreational hunting for biodiversity conservation and livelihoods. One Earth. (2021) 4:238–53. doi: 10.1016/j.oneear.2021.01.014
82. Clavero, M, Brotons, L, Pons, P, and Sol, D. Prominent role of invasive species in avian biodiversity loss. Biol Conserv. (2009) 142:2043–9. doi: 10.1016/j.biocon.2009.03.034
83. Doherty, TS, Glen, AS, Nimmo, DG, Ritchie, EG, and Dickman, CR. Invasive predators and global biodiversity loss. Proc Natl Acad Sci USA. (2016) 113:11261–5. doi: 10.1073/pnas.1602480113
84. Intergovernmental Platform on Biodiversity and Ecosystem Services ed. Summary for policymakers of the thematic assessment report on invasive alien species and their control of the intergovernmental science-policy platform on biodiversity and ecosystem services. Bonn: Intergovernmental Platform on Biodiversity and Ecosystem Services Secretariat (2023).
85. Maiti, SK, and Chowdhury, A. Effects of anthropogenic pollution on mangrove biodiversity: a review. J Environ Protect. (2013) 4:1428–34. doi: 10.4236/jep.2013.412163
86. Cristiano, W, Giacoma, C, Carere, M, and Mancini, L. Chemical pollution as a driver of biodiversity loss and potential deterioration of ecosystem services in eastern Africa: a critical review. S Afr J Sci. (2021) 117:1–7. doi: 10.17159/sajs.2021/9541
87. Daszak, P, Cunningham, AA, and Hyatt, AD. Emerging infectious diseases of wildlife—threats to biodiversity and human health. Science. (2000) 287:443–9. doi: 10.1126/science.287.5452.443
88. Smith, KF, Sax, DF, and Lafferty, KD. Evidence for the role of infectious disease in species extinction and endangerment. Conserv Biol. (2006) 20:1349–57. doi: 10.1111/j.1523-1739.2006.00524.x
89. Urban, MC. Accelerating extinction risk from climate change. Science. (2015) 348:571–3. doi: 10.1126/science.aaa4984
90. Strona, G, and Bradshaw, CJA. Coextinctions dominate future vertebrate losses from climate and land use change. Sci Adv. (2022) 8:eabn4345. doi: 10.1126/sciadv.abn4345
91. Brook, BW, Sodhi, NS, and Bradshaw, CJA. Synergies among extinction drivers under global change. Trends Ecol Evol. (2008) 23:453–60. doi: 10.1016/j.tree.2008.03.011
92. Hoekstra, JM, Boucher, TM, Ricketts, TH, and Roberts, C. Confronting a biome crisis: global disparities of habitat loss and protection. Ecol Lett. (2005) 8:23–9. doi: 10.1111/j.1461-0248.2004.00686.x
93. Dudley, N, and Alexander, S. Agriculture and biodiversity: a review. Biodiversity. (2017) 18:45–9. doi: 10.1080/14888386.2017.1351892
94. IPBES. Global assessment report on biodiversity and ecosystem services. Paris: IPBES Secretariat (2019).
95. Díaz, S, Settele, J, Brondízio, ES, Ngo, HT, Agard, J, Arneth, A, et al. Pervasive human-driven decline of life on Earth points to the need for transformative change. Science (2019) 366:eaax3100. doi: 10.1126/science.aax3100
96. Meyer, WB, and Turner, BL. Human population growth and global land-use/cover change. Annu Rev Ecol Syst. (1992) 23:39–61. doi: 10.1146/annurev.es.23.110192.000351
97. Davidson, NC. How much wetland has the world lost? Long-term and recent trends in global wetland area. Mar Freshw Res. (2014) 65:934–41. doi: 10.1071/MF14173
98. Steinfeld, H, Gerber, P, Wassenaar, T, Castel, V, Rosales, M, and de Haan, C. Livestock’s long shadow: environmental issues and options. Rome: Food and Agriculture Organization of the United Nations (2006).
99. Gibbs, HK, Ruesch, AS, Achard, F, Clayton, MK, Holmgren, P, Ramankutty, N, et al. Tropical forests were the primary sources of new agricultural land in the 1980s and 1990s. Proc Natl Acad Sci USA. (2010) 107:16732–7. doi: 10.1073/pnas.0910275107
100. Geist, HJ, and Lambin, EF. Proximate causes and underlying driving forces of tropical deforestation. Bioscience. (2002) 52:143–50. doi: 10.1641/0006-3568(2002)052[0143:PCAUDF]2.0.CO;2
101. Ripple, WJ, Wolf, C, Newsome, TM, Betts, MG, Ceballos, G, Courchamp, F, et al. Are we eating the world's megafauna to extinction? Conserv Lett. (2019) 12:e12627. doi: 10.1111/conl.12627
102. Ripple, WJ, Estes, JA, Beschta, RL, Wilmers, CC, Ritchie, EG, Hebblewhite, M, et al. Status and ecological effects of the world’s largest carnivores. Science. (2014) 343:6167. doi: 10.1126/science.1241484
103. Estes, JA, Terborgh, J, Brashares, JS, Power, ME, Berger, J, Bond, WJ, et al. Trophic downgrading of planet earth. Science. (2011) 333:301–6. doi: 10.1126/science.1205106
104. Ikanda, D, and Packer, C. Ritual vs. retaliatory killing of African lions in the Ngorongoro conservation area, Tanzania. Endang Sp Res. (2008) 6:67–74. doi: 10.3354/esr00120
105. Bauer, H, de Iongh, H, and Sogbohossou, E. Assessment and mitigation of human-lion conflict in west and Central Africa. Mammalia. (2010) 74:363–7. doi: 10.1515/mamm.2010.048
106. Jackson, JBC. Ecological extinction and evolution in the brave new ocean. Proc Natl Acad Sci USA. (2008) 105:11458–65. doi: 10.1073/pnas.0802812105
107. Jones, JB. Environmental impact of trawling on the seabed: a review. N Z J Mar Freshw Res. (1992) 26:59–67. doi: 10.1080/00288330.1992.9516500
108. Kaiser, MJ, Collie, JS, Hall, SJ, Jennings, S, and Poiner, IR. Modification of marine habitats by trawling activities: prognosis and solutions. Fish Fisher. (2002) 3:114–36. doi: 10.1046/j.1467-2979.2002.00079.x
109. Thrush, SF, and Dayton, PK. Disturbance to marine benthic habitats by trawling and dredging: implications for marine biodiversity. Annu Rev Ecol Syst. (2002) 33:449–73. doi: 10.1146/annurev.ecolsys.33.010802.150515
110. Payne, JL, Bush, AM, Heim, NA, Knope, ML, and McCauley, DJ. Ecological selectivity of the emerging mass extinction in the oceans. Science. (2016) 353:1284–6. doi: 10.1126/science.aaf2416
111. Ranganathan, J, Waite, R, Searchinger, T, and Hanson, C. How to sustainably feed 10 billion people by 2050, in 21 charts. Washington, DC: World Resources Institute (2018).
112. Boyce, MR, Katz, R, and Standley, CJ. Risk factors for infectious diseases in urban environments of sub-Saharan Africa: a systematic review and critical appraisal of evidence. Trop Med Infect Dis. (2019) 4:123. doi: 10.3390/tropicalmed4040123
113. World Health Organization. The global health observatory: noncommunicable diseases: mortality (2023). Available at: who.int/data/gho/data/themes/topics/topic-details/GHO/ncd-mortality.
114. Unwin, N, and Alberti, KGMM. Chronic non-communicable diseases. Ann Trop Med Parasitol. (2006) 100:455–64. doi: 10.1179/136485906X97453
115. Sophie, E, and Stefan, K. Urbanization and health in developing countries: a systematic review. World Health Pop. (2014) 15:7–20. doi: 10.12927/whp.2014.23722
116. Fink, G, Günther, I, and Hill, K. Slum residence and child health in developing countries. Demography. (2014) 51:1175–97. doi: 10.1007/s13524-014-0302-0
117. Gustafson, P, Gomes, VF, Vieira, CS, Rabna, P, Seng, R, Johansson, P, et al. Tuberculosis in Bissau: incidence and risk factors in an urban community in sub-Saharan Africa. Int J Epidemiol. (2004) 33:163–72. doi: 10.1093/ije/dyh026
118. Bekker, L-G, and Wood, R. The changing natural history of tuberculosis and HIV coinfection in an urban area of hyperendemicity. Clin Infect Dis. (2010) 50:S208–14. doi: 10.1086/651493
119. Kraemer, MUG, Faria, NR, Reiner, RC Jr, Golding, N, Nikolay, B, Stasse, S, et al. Spread of yellow fever virus outbreak in Angola and the Democratic Republic of the Congo 2015-16: a modelling study. Lancet Infect Dis. (2017) 17:330–8. doi: 10.1016/S1473-3099(16)30513-8
120. Levy, B, and Odoi, A. Exploratory investigation of region level risk factors of Ebola virus disease in West Africa. PeerJ. (2018) 6:e5888. doi: 10.7717/peerj.5888
121. Buvé, A, Bishikwabo-Nsarhaza, K, and Mutangadura, G. The spread and effect of HIV-1 infection in sub-Saharan Africa. Lancet. (2002) 359:2011–7. doi: 10.1016/S0140-6736(02)08823-2
122. Smith, CJ. Social geography of sexually transmitted diseases in China: exploring the role of migration and urbanisation. Asia Pac Viewp. (2005) 46:65–80. doi: 10.1111/j.1467-8373.2005.00260.x
123. Struchiner, CJ, Rocklöv, J, Wilder-Smith, A, and Massad, E. Increasing dengue incidence in Singapore over the past 40 years: population growth, climate and mobility. PLoS One. (2015) 10:e0136286. doi: 10.1371/journal.pone.0136286
124. Colón-González, FJ, Sewe, MO, Tompkins, AM, Sjödin, H, Casallas, A, Rocklöv, J, et al. Projecting the risk of mosquito-borne diseases in a warmer and more populated world: a multi-model, multi-scenario intercomparison modelling study. Lancet Planet Health. (2021) 5:e404–14. doi: 10.1016/S2542-5196(21)00132-7
125. Williams, PCM, Bartlett, AW, Howard-Jones, A, McMullan, B, Khatami, A, Britton, PN, et al. Impact of climate change and biodiversity collapse on the global emergence and spread of infectious diseases. J Paediatr Child Health. (2021) 57:1811–8. doi: 10.1111/jpc.15681
126. Hay, SI, Abajobir, AA, Abate, KH, Abbafati, C, Abbas, KM, Abd-Allah, F, et al. Global, regional, and national disability-adjusted life-years (DALYs) for 333 diseases and injuries and healthy life expectancy (HALE) for 195 countries and territories, 1990-2016: a systematic analysis for the global burden of disease study 2016. Lancet. (2017) 390:1260–344. doi: 10.1016/S0140-6736(17)32130-X
127. Mackenzie, JS, Lindsay, MDA, Smith, DW, and Imrie, A. The ecology and epidemiology of Ross River and Murray Valley encephalitis viruses in Western Australia: examples of one health in action. Trans R Soc Trop Med Hyg. (2017) 111:248–54. doi: 10.1093/trstmh/trx045
128. Baragatti, M, Fournet, F, Henry, M-C, Assi, S, Ouedraogo, H, Rogier, C, et al. Social and environmental malaria risk factors in urban areas of Ouagadougou, Burkina Faso. Malar J. (2009) 8:13. doi: 10.1186/1475-2875-8-13
129. Kabaria, CW, Molteni, F, Mandike, R, Chacky, F, Noor, AM, Snow, RW, et al. Mapping intra-urban malaria risk using high resolution satellite imagery: a case study of Dar Es Salaam. Intl J Health Geogr. (2016) 15:26. doi: 10.1186/s12942-016-0051-y
130. Chang, AY, Fuller, DO, Carrasquillo, O, and Beier, JC. Social justice, climate change, and dengue. Health Hum Rights. (2014) 16:93–104. Available at: https://www.hhrjournal.org/2014/07/social-justice-climate-change-and-dengue/.
131. Dhimal, M, Ahrens, B, and Kuch, U. Climate change and spatiotemporal distributions of vector-borne diseases in Nepal – a systematic synthesis of literature. PLoS One. (2015) 10:e0129869. doi: 10.1371/journal.pone.0129869
132. Siraj, AS, Santos-Vega, M, Bouma, MJ, Yadeta, D, Carrascal, DR, and Pascual, M. Altitudinal changes in malaria incidence in highlands of Ethiopia and Colombia. Science. (2014) 343:1154–8. doi: 10.1126/science.1244325
133. Sasaki, S, Suzuki, H, Fujino, Y, Kimura, Y, and Cheelo, M. Impact of drainage networks on cholera outbreaks in Lusaka, Zambia. Am J Public Health. (2009) 99:1982–7. doi: 10.2105/AJPH.2008.151076
134. Sasaki, S, Suzuki, H, Igarashi, K, Tambatamba, B, and Mulenga, P. Spatial analysis of risk factor of cholera outbreak for 2003–2004 in a peri-urban area of Lusaka, Zambia. Am J Trop Med Hyg. (2008) 79:414–21. doi: 10.4269/ajtmh.2008.79.414
135. Berendes, D, Leon, J, Kirby, A, Clennon, J, Raj, S, Yakubu, H, et al. Household sanitation is associated with lower risk of bacterial and protozoal enteric infections, but not viral infections and diarrhoea, in a cohort study in a low-income urban neighbourhood in Vellore, India. Trop Med Int Health. (2017) 22:1119–29. doi: 10.1111/tmi.12915
136. Semba, RD, Kraemer, K, Sun, K, de Pee, S, Akhter, N, Moench-Pfanner, R, et al. Relationship of the presence of a household improved latrine with diarrhea and under-five child mortality in Indonesia. Am Soc Trop Med Hyg. (2011) 84:443–50. doi: 10.4269/ajtmh.2011.10-0244
137. Kabaria, CW, Gilbert, M, Noor, AM, Snow, RW, and Linard, C. The impact of urbanization and population density on childhood plasmodium falciparum parasite prevalence rates in Africa. Malar J. (2017) 16:49. doi: 10.1186/s12936-017-1694-2
138. Woolhouse, MEJ, Dye, C, Taylor, LH, Latham, SM, and MEJ, W. Risk factors for human disease emergence. Philos Trans R Soc B. (2001) 356:983–9. doi: 10.1098/rstb.2001.0888
139. Wilder-Smith, A, Chiew, CJ, and Lee, VJ. Can we contain the COVID-19 outbreak with the same measures as for SARS? Lancet Infect Dis. (2020) 20:e102–7. doi: 10.1016/S1473-3099(20)30129-8
140. Connolly, C, Ali, SH, and Keil, R. On the relationships between COVID-19 and extended urbanization. Dial Hum Geogr. (2020) 10:213–6. doi: 10.1177/2043820620934209
141. Tollefson, J. Why deforestation and extinctions make pandemics more likely. Nature. (2020) 584:175–6. doi: 10.1038/d41586-020-02341-1
142. Liu, Q, Cao, L, and Zhu, X-Q. Major emerging and re-emerging zoonoses in China: a matter of global health and socioeconomic development for 1.3 billion. Intl J Infect Dis. (2014) 25:65–72. doi: 10.1016/j.ijid.2014.04.003
143. Hassell, JM, Begon, M, Ward, MJ, and Fèvre, EM. Urbanization and disease emergence: dynamics at the wildlife–livestock–human interface. Trends Ecol Evol. (2017) 32:55–67. doi: 10.1016/j.tree.2016.09.012
144. Maynard, R, and Turner, J. Case study of a health crisis: how human health is under threat from over-use of antibiotics in intensive livestock farming. Surrey: Alliance to Save Our Antibiotics (2011).
145. Patel, RB, and Burkle, FM. Rapid urbanization and the growing threat of violence and conflict: a 21st century crisis. Prehosp Disast Med. (2012) 27:194–7. doi: 10.1017/S1049023X12000568
146. Cresswell, I, Janke, T, and Johnston, E. Australia state of the Environment 2021. Canberra: Commonwealth Department of Agriculture, Water, and the Environment (2021).
147. Bill and Melinda Gates Foundation. Goalkeepers report 2018. Seattle: Bill and Melinda Gates Foundation (2018).
148. United Nations Department of Economic and Social Affairs Sustainable Development. Goal 3: ensure healthy lives and promote well-being for all at all ages United Nations (2023) Available at: sdgs.un.org/goals/goal3.
150. Gordon, L. The politics of population: birth control and the eugenics movement. Rad Am. (1974) 8:61–98.
151. United Nations. Final act of the international conference on human rights. New York, NY: United Nations (1968).
152. Pezzulo, C, Nilsen, K, Carioli, A, Tejedor-Garavito, N, Hanspal, SE, Hilber, T, et al. Geographical distribution of fertility rates in 70 low-income, lower-middle-income, and upper-middle-income countries, 2010-16: a subnational analysis of cross-sectional surveys. Lancet Glob Health. (2021) 9:e802–12. doi: 10.1016/S2214-109X(21)00082-6
153. Roustaei, Z, Räisänen, S, Gissler, M, and Heinonen, S. Fertility rates and the postponement of first births: a descriptive study with Finnish population data. BMJ Open. (2019) 9:e026336. doi: 10.1136/bmjopen-2018-026336
154. Ezeh, AC, Bongaarts, J, and Mberu, B. Global population trends and policy options. Lancet. (2012) 380:142–8. doi: 10.1016/S0140-6736(12)60696-5
155. Ezeh, A, Kissling, F, and Singer, P. Why sub-Saharan Africa might exceed its projected population size by 2100. Lancet. (2020) 396:1131–3. doi: 10.1016/S0140-6736(20)31522-1
156. Morgan, SP, and Taylor, MG. Low fertility at the turn of the twenty-first century. Annu Rev Sociol. (2006) 32:375–99. doi: 10.1146/annurev.soc.31.041304.122220
157. Blue, L, and Espenshade, TJ. Population momentum across the demographic transition. Pop Dev Rev. (2011) 37:721–47. doi: 10.1111/j.1728-4457.2011.00454.x
158. Bradshaw, CJA, and Brook, BW. Human population reduction is not a quick fix for environmental problems. Proc Natl Acad Sci USA. (2014) 111:16610–5. doi: 10.1073/pnas.1410465111
159. Kantorová, V, Wheldon, MC, Ueffing, P, and Dasgupta, ANZ. Estimating progress towards meeting women’s contraceptive needs in 185 countries: a Bayesian hierarchical modelling study. PLoS Med. (2020) 17:e1003026. doi: 10.1371/journal.pmed.1003026
160. United Nations Department of Economic and Social Affairs. World family planning 2020: highlights. New York: United Nations (2020).
161. Bearak, J, Popinchalk, A, Ganatra, B, Moller, A-B, Tunçalp, Ö, Beavin, C, et al. Unintended pregnancy and abortion by income, region, and the legal status of abortion: estimates from a comprehensive model for 1990-2019. Lancet Glob Health. (2020) 8:e1152–61. doi: 10.1016/S2214-109X(20)30315-6
162. United Nations. UK’s 85% family planning aid cut will be devastating for women and girls says UNFPA, while UNAIDS also 'deeply regrets' cuts UN News Global Perspecdtive Human Stories (2021) Available at: news.un.org/en/story/2021/04/1090892.
163. Crane, BB, and Dusenberry, J. Power and politics in international funding for reproductive health: the US global gag rule. Reprod Health Matt. (2004) 12:128–37. doi: 10.1016/S0968-8080(04)24140-4
164. Bongaarts, J. Trends in fertility and fertility preferences in sub-Saharan Africa: the roles of education and family planning programs. Genus. (2020) 76:32. doi: 10.1186/s41118-020-00098-z
165. Bradshaw, CJA, Perry, C, Judge, MA, Saraswati, CM, Heyworth, J, and Le Souëf, PN. Lower infant mortality, lower household size, and more access to contraception reduce fertility in low- and middle-income nations. PLoS One. (2023) 18:e0280260. doi: 10.1371/journal.pone.0280260
166. Stover, J, and Ross, J. How increased contraceptive use has reduced maternal mortality. Matern Child Health J. (2010) 14:687–95. doi: 10.1007/s10995-009-0505-y
167. Moucheraud, C, Worku, A, Molla, M, Finlay, JE, Leaning, J, and Yamin, AE. Consequences of maternal mortality on infant and child survival: a 25-year longitudinal analysis in Butajira Ethiopia (1987-2011). Reprod Health. (2015) 12:S4. doi: 10.1186/1742-4755-12-S1-S4
168. Ahmed, S, Li, Q, Liu, L, and Tsui, AO. Maternal deaths averted by contraceptive use: an analysis of 172 countries. Lancet. (2012) 380:111–25. doi: 10.1016/S0140-6736(12)60478-4
169. Utomo, B, Sucahya, PK, Romadlona, NA, Robertson, AS, Aryanty, RI, and Magnani, RJ. The impact of family planning on maternal mortality in Indonesia: what future contribution can be expected? Pop Health Metr. (2021) 19:2. doi: 10.1186/s12963-020-00245-w
170. O'Loughlin, J. Safe motherhood: impossible dream or achievable reality? Med J Aust. (1997) 167:622–5. doi: 10.5694/j.1326-5377.1997.tb138915.x
171. Davanzo, J, Hale, L, Razzaque, A, and Rahman, M. The effects of pregnancy spacing on infant and child mortality in Matlab, Bangladesh: how they vary by the type of pregnancy outcome that began the interval. Pop Stud. (2008) 62:131–54. doi: 10.1080/00324720802022089
172. Dewey, KG, and Cohen, RJ. Does birth spacing affect maternal or child nutritional status? A systematic literature review. Matern Child Nutr. (2007) 3:151–73. doi: 10.1111/j.1740-8709.2007.00092.x
173. Saxton, J, Rath, S, Nair, N, Gope, R, Mahapatra, R, Tripathy, P, et al. Handwashing, sanitation and family planning practices are the strongest underlying determinants of child stunting in rural indigenous communities of Jharkhand and Odisha, eastern India: a cross-sectional study. Matern Child Nutr. (2016) 12:869–84. doi: 10.1111/mcn.12323
174. Kozuki, N, and Walker, N. Exploring the association between short/long preceding birth intervals and child mortality: using reference birth interval children of the same mother as comparison. BMC Pub Health. (2013) 13:S6. doi: 10.1186/1471-2458-13-S3-S6
175. Islam, MZ, Billah, A, Islam, MM, Rahman, M, and Khan, N. Negative effects of short birth interval on child mortality in low- and middle-income countries: a systematic review and meta-analysis. J Glob Health. (2022) 12:04070. doi: 10.7189/jogh.12.04070
176. van Soest, A, and Saha, UR. Relationships between infant mortality, birth spacing and fertility in Matlab, Bangladesh. PLoS One. (2018) 13:e0195940. doi: 10.1371/journal.pone.0195940
177. Preston, SH. Health programs and population growth. Pop Dev Rev. (1975) 1:189–99. doi: 10.2307/1972220
178. United States Agency for International Development. Orphans and vulnerable children affected by HIV and AIDS. Washington, DC: United States Agency for International Development (2016).
179. Leyenaar, JK. HIV/AIDS and Africa's orphan crisis. Paediatr Child Health. (2005) 10:259–60. doi: 10.1093/pch/10.5.259
180. Ahmed, S, Choi, Y, Rimon, JG, Alzouma, S, Gichangi, P, Guiella, G, et al. Trends in contraceptive prevalence rates in sub-Saharan Africa since the 2012 London summit on family planning: results from repeated cross-sectional surveys. Lancet Glob Health. (2019) 7:e904–11. doi: 10.1016/S2214-109X(19)30200-1
181. Schwandt, HM, Feinberg, S, Akotiah, A, Douville, TY, Gardner, EV, Imbabazi, C, et al. “Family planning in Rwanda is not seen as population control, but rather as a way to empower the people”: examining Rwanda’s success in family planning from the perspective of public and private stakeholders. Contracept Reprod Med. (2018) 3:18. doi: 10.1186/s40834-018-0072-y
182. Odokonyero, T, Mwesigye, F, Adong, A, and Mbowa, S. Universal health coverage in Uganda: the critical health infrastructure, healthcare coverage and equity. Kampala: Economic Policy Research Centre (2017).
183. Williams, PCM, Marais, B, Isaacs, D, and Preisz, A. Ethical considerations regarding the effects of climate change and planetary health on children. J Paediatr Child Health. (2021) 57:1775–80. doi: 10.1111/jpc.15704
184. Alexandratos, N, and Bruinsma, J. World agriculture towards 2030/2050. The 2012 revision. ESA working paper no. 12-03. Rome: Food and Agriculture Organization of the United Nations, Agricultural Development Economics Division (2012).
185. Miller, GD, Kanter, M, Rycken, L, Comerford, KB, Gardner, NM, and Brown, KA. Food systems transformation for child health and well-being: the essential role of dairy. Intl J Env Res Pub Health. (2021) 18:10535. doi: 10.3390/ijerph181910535
186. World Meteorological Association. State of the global climate 2021. Geneva: World Meteorological Association (2022).
187. Owolade, AJ-J, Abdullateef, RO, Adesola, RO, and Olaloye, ED. Malnutrition: an underlying health condition faced in sub Saharan Africa: challenges and recommendations. Ann Med Surg. (2022) 82:82. doi: 10.1016/j.amsu.2022.104769
188. Bauer, JM, and Mburu, S. Effects of drought on child health in Marsabit District, northern Kenya. Econ Hum Biol. (2017) 24:74–9. doi: 10.1016/j.ehb.2016.10.010
189. Randell, H, Gray, C, and Grace, K. Stunted from the start: early life weather conditions and child undernutrition in Ethiopia. Soc Sci Med. (2020) 261:113234. doi: 10.1016/j.socscimed.2020.113234
190. Belesova, K, Gasparrini, A, Wilkinson, P, Sié, A, and Sauerborn, R. Child survival and annual crop yield reductions in rural Burkina Faso: critical windows of vulnerability around early-life development. Am J Epidemiol. (2023) 192:1116–27. doi: 10.1093/aje/kwad068
191. Naylor, RL, Battisti, DS, Vimont, DJ, Falcon, WP, and Burke, MB. Assessing risks of climate variability and climate change for Indonesian rice agriculture. Proc Natl Acad Sci USA. (2007) 104:7752–7. doi: 10.1073/pnas.0701825104
192. Thiede, BC, and Gray, C. Climate exposures and child undernutrition: evidence from Indonesia. Soc Sci Med. (2020) 265:113298. doi: 10.1016/j.socscimed.2020.113298
193. Council on Environmental HealthPaulson, JA, Ahdoot, S, Baum, CR, Bole, A, Brumberg, HL, et al. Global climate change and children’s health. Pediatrics. (2015) 136:992–7. doi: 10.1542/peds.2015-3232
194. Zhang, Y, Bi, P, and Hiller, JE. Climate change and disability-adjusted life years. J Env Health. (2007) 70:32–8. Available at: https://www.jstor.org/stable/26327425.
195. Sheffield, PE, Herrera, MT, Kinnee, EJ, and Clougherty, JE. Not so little differences: variation in hot weather risk to young children in new York City. Public Health. (2018) 161:119–26. doi: 10.1016/j.puhe.2018.06.004
196. Green, D, Bambrick, H, Tait, P, Goldie, J, Schultz, R, Webb, L, et al. Differential effects of temperature extremes on hospital admission rates for respiratory disease between indigenous and non-indigenous Australians in the Northern Territory. Intl J Env Res Pub Health. (2015) 12:15352–65. doi: 10.3390/ijerph121214988
197. Green, RS, Basu, R, Malig, B, Broadwin, R, Kim, JJ, and Ostro, B. The effect of temperature on hospital admissions in nine California counties. Int J Publ Health. (2010) 55:113–21. doi: 10.1007/s00038-009-0076-0
198. D'Ippoliti, D, Michelozzi, P, Marino, C, De'donato, F, Menne, B, Katsouyanni, K, et al. The impact of heat waves on mortality in 9 European cities: results from the EuroHEAT project. Environ Health. (2010) 9:37. doi: 10.1186/1476-069X-9-37
199. Lawrence, WR, Soim, A, Zhang, W, Lin, Z, Lu, Y, Lipton, EA, et al. A population-based case–control study of the association between weather-related extreme heat events and low birthweight. J Dev Orig Health Dis. (2021) 12:335–42. doi: 10.1017/S2040174420000392
200. Tang, Z, Wu, M, Song, G, Yang, R, and Wang, Y. Impact of ambient temperature exposure on newborns with low Apgar scores in Northwest China. Environ Sci Pollut Res. (2021) 28:36367–74. doi: 10.1007/s11356-021-13340-8
201. Ha, S, Liu, D, Zhu, Y, Soo Kim, S, Sherman, S, Grantz Katherine, L, et al. Ambient temperature and stillbirth: a multi-center retrospective cohort study. Environ Health Perspect. (2017) 125:067011. doi: 10.1289/EHP945
202. Smith, LT, Aragão, LEOC, Sabel, CE, and Nakaya, T. Drought impacts on children's respiratory health in the Brazilian Amazon. Sci Rep. (2014) 4:3726. doi: 10.1038/srep03726
203. Budiyono, R, Jati, SP, and Ginandjar, P. Potential impact of climate variability on respiratory diseases in infant and children in Semarang. IOP Conf Ser Earth Environ Sci. (2017) 55:012049. doi: 10.1088/1755-1315/55/1/012049
204. Teresa, T, Jingqin, Z, Dave, S, Natasha, G, Ivy, F, Lauren, P, et al. Early life exposure to air pollution and incidence of childhood asthma, allergic rhinitis and eczema. Eur Respir J. (2020) 55:1900913. doi: 10.1183/13993003.00913-2019
205. di Grieco, T, Faina, V, Milana, M, Dies, L, Bianchini, D, and Calvieri, S. Allergic diseases and climate changes: our experience and an update. Clin Ter. (2013):164. doi: 10.7417/CT.2013.1515
206. Di Cicco, M, Del Tufo, E, Fasola, S, Gracci, S, Marchi, MG, Fibbi, L, et al. The effect of outdoor aeroallergens on asthma hospitalizations in children in North-Western Tuscany, Italy. Intl J Env Res Pub Health. (2022) 19:3586. doi: 10.3390/ijerph19063586
207. Li, J, Guan, T, Guo, Q, Geng, G, Wang, H, Guo, F, et al. Exposure to landscape fire smoke reduced birthweight in low- and middle-income countries: findings from a siblings-matched case-control study. eLife. (2021) 10:e69298. doi: 10.7554/eLife.69298
208. Xue, T, Geng, G, Han, Y, Wang, H, Li, J, Li, H-t, et al. Open fire exposure increases the risk of pregnancy loss in South Asia. Nat Commun. (2021) 12:3205. doi: 10.1038/s41467-021-23529-7
209. Spolter, F, Kloog, I, Dorman, M, Novack, L, Erez, O, and Raz, R. Prenatal exposure to ambient air temperature and risk of early delivery. Environ Int. (2020) 142:105824. doi: 10.1016/j.envint.2020.105824
210. Sun, S, Weinberger, KR, Spangler, KR, Eliot, MN, Braun, JM, and Wellenius, GA. Ambient temperature and preterm birth: a retrospective study of 32 million US singleton births. Environ Int. (2019) 126:7–13. doi: 10.1016/j.envint.2019.02.023
211. Smith, ML, and Hardeman, RR. Association of summer heat waves and the probability of preterm birth in Minnesota: an exploration of the intersection of race and education. Int J Env Res Pub Health. (2020) 17:6391. doi: 10.3390/ijerph17176391
212. Wang, Y-Y, Li, Q, Guo, Y, Zhou, H, Wang, Q-M, Shen, H-P, et al. Ambient temperature and the risk of preterm birth: a national birth cohort study in the mainland China. Environ Int. (2020) 142:105851. doi: 10.1016/j.envint.2020.105851
213. Vicedo-Cabrera, AM, Iñíguez, C, Barona, C, and Ballester, F. Exposure to elevated temperatures and risk of preterm birth in Valencia, Spain. Environ Res. (2014) 134:210–7. doi: 10.1016/j.envres.2014.07.021
214. Bianca, C, Ana, MV-C, Antonio, G, Harry, AR, Evelyne, M, Jaco, V, et al. Ambient temperature as a trigger of preterm delivery in a temperate climate. J Epidemiol Comm Health. (2016) 70:1191–9. doi: 10.1136/jech-2015-206384
215. Wang, J, Williams, G, Guo, Y, Pan, X, and Tong, S. Maternal exposure to heatwave and preterm birth in Brisbane, Australia. BJOG. (2013) 120:1631–41. doi: 10.1111/1471-0528.12397
216. Weeda, LJZ, Bradshaw, CJA, Judge, MA, Saraswati, CM, and Le Souëf, PN. How climate change degrades child health: a systematic review and meta-analysis. Sci. Total Environ. (2024). doi: 10.1016/j.scitotenv.2024.170944
217. Osili, UO, and Long, BT. Does female schooling reduce fertility? Evidence from Nigeria. J Dev Econ. (2008) 87:57–75. doi: 10.1016/j.jdeveco.2007.10.003
218. Wusu, O. A reassessment of the effects of female education and employment on fertility in Nigeria. Vienna Yearb Pop Res. (2012) 10:31–48. doi: 10.1553/populationyearbook2012s031
219. Towriss, CA, and Timæus, IM. Modelling period fertility: schooling and intervals following a birth in eastern Africa. Pop Stud. (2018) 72:75–90. doi: 10.1080/00324728.2017.1370121
220. Bongaarts, J, Mensch, BS, and Blanc, AK. Trends in the age at reproductive transitions in the developing world: the role of education. Pop Stud. (2017) 71:139–54. doi: 10.1080/00324728.2017.1291986
221. Curtis, SL, Diamond, I, and McDonald, JW. Birth interval and family effects on postneonatal mortality in Brazil. Demography. (1993) 30:33–43. doi: 10.2307/2061861
222. Omariba, DWR, Beaujot, R, and Rajulton, F. Determinants of infant and child mortality in Kenya: an analysis controlling for frailty effects. Pop Res Policy Rev. (2007) 26:299–321. doi: 10.1007/s11113-007-9031-z
223. Saha, UR, and van Soest, A. Infant death clustering in families: magnitude, causes, and the influence of better health services, Bangladesh 1982–2005. Pop Stud. (2011) 65:273–87. doi: 10.1080/00324728.2011.602100
224. Whitworth, A, and Stephenson, R. Birth spacing, sibling rivalry and child mortality in India. Soc Sci Med. (2002) 55:2107–19. doi: 10.1016/S0277-9536(02)00002-3
225. Desai, S, and Alva, S. Maternal education and child health: is there a strong causal relationship? Demography. (1998) 35:71–81. doi: 10.2307/3004028
226. Bongaarts, J, and Feeney, G. On the quantum and tempo of fertility. Pop Dev Rev. (1998) 24:271–91. doi: 10.2307/2807974
227. Gries, T, and Grundmann, R. Fertility and modernization: the role of urbanization in developing countries. J Intl Dev. (2018) 30:493–506. doi: 10.1002/jid.3104
228. Pimentel, J, Ansari, U, Omer, K, Gidado, Y, Baba, MC, Andersson, N, et al. Factors associated with short birth interval in low- and middle-income countries: a systematic review. BMC Preg Childb. (2020) 20:156. doi: 10.1186/s12884-020-2852-z
229. Hossain, MB, Phillips, JF, and Legrand, TK. The impact of childhood mortality on fertility in six rural thanas of Bangladesh. Demography. (2007) 44:771–84. doi: 10.1353/dem.2007.0047
230. White, T. Two kinds of production: the evolution of China's family planning policy in the 1980s. Pop Dev Rev. (1994) 20:137–58. doi: 10.2307/2807944
231. Liptak, A. Supreme court upholds Trump Administration regulation letting employers opt out of birth control coverage. New York, NY: New York Times (2020).
232. KFF Health News. The U.S. government and international family planning and reproductive health efforts. San Francisco: KFF (2021).
233. The Kremlin. The president signed executive order on national goals and strategic objectives of the Russian Federation through to 2024. Moscow: The Kremlin (2018).
234. Center for Reproductive Rights. UN body slams abortion laws. New York: Center for Reproductive Rights (2013).
236. Zámbó, L, Bakacs, M, Illés, É, Varga, A, Sarkadi Nagy, E, Zentai, A, et al. Impact assessment of the public health product tax in Hungary. Eur J Publ Health. (2020) 30:ckaa166.1231. doi: 10.1093/eurpub/ckaa166.1231
237. International Planned Parenthood Federation. Abortion care: Hungary’s heartless move will humiliate and harm women. Brussels: International Planned Parenthood Federation, European Network (2022).
238. Margolis, H. “The Breath of the government on my back”: attacks on women’s rights in Poland. New York, NY: Human Rights Watch (2019).
239. Nargund, G. Declining birth rate in developed countries: a radical policy re-think is required. Fact View Vis ObGyn. (2009) 1:191–3.
240. Population Matters. Which planet is he on? Elon musk and the population apocalypse. London: Population Matters (2022).
242. Australian Financial Review. Australia’s stalled population growth must be resumed. Sydney, Australia: Australian Financial Review (2021).
243. Kubiszewski, I, Costanza, R, Franco, C, Lawn, P, Talberth, J, Jackson, T, et al. Beyond GDP: measuring and achieving global genuine progress. Ecol Econ. (2013) 93:57–68. doi: 10.1016/j.ecolecon.2013.04.019
244. Reher, DS. Towards long-term population decline: a discussion of relevant issues. Eur J Pop. (2007) 23:189–207. doi: 10.1007/s10680-007-9120-z
245. Bloom, DE, Chatterji, S, Kowal, P, Lloyd-Sherlock, P, McKee, M, Rechel, B, et al. Macroeconomic implications of population ageing and selected policy responses. Lancet. (2015) 385:649–57. doi: 10.1016/S0140-6736(14)61464-1
246. Faruqee, H, and Mühleisen, M. Population aging in Japan: demographic shock and fiscal sustainability. Jpn World Econ. (2003) 15:185–210. doi: 10.1016/S0922-1425(02)00017-8
247. Oxfam International. A safe and just space for humanity: can we live within the doughnut?. Nairobi, Kenya: Oxfam International (2012).
248. Lee, R, and Mason, A. Fertility, human capital, and economic growth over the demographic transition. Eur J Pop. (2010) 26:159–82. doi: 10.1007/s10680-009-9186-x
249. Prettner, K, Bloom, DE, and Strulik, H. Declining fertility and economic well-being: do education and health ride to the rescue? Lab Econ. (2013) 22:70–9. doi: 10.1016/j.labeco.2012.07.001
250. Casey, G, and Galor, O. Is faster economic growth compatible with reductions in carbon emissions? The role of diminished population growth. Environ Res Lett. (2017) 12:014003. doi: 10.1088/1748-9326/12/1/014003
251. Adams, A. Technology and the labour market: the assessment. Oxford Rev Econ Policy. (2018) 34:349–61. doi: 10.1093/oxrep/gry010
252. Gerlagh, R, Lupi, V, and Galeotti, M. Family planning and climate change. CESifo working paper No. 7421. SSRN. (2018). doi: 10.2139/ssrn.3338775
253. Rees, WE. The human eco-predicament: overshoot and the population conundrum. Vienna Yearb Pop Res. (2023) 21:1. doi: 10.1553/p-eznb-ekgc
254. O'Neill, BC, Dalton, M, Fuchs, R, Jiang, L, Pachauri, S, and Zigova, K. Global demographic trends and future carbon emissions. Proc Natl Acad Sci USA. (2010) 107:17521–6. doi: 10.1073/pnas.1004581107
255. Fry, L, and Lei, P. A greener, fairer future: why leaders need to invest in climate and girls’ education. New York: United Nations Girls Education Initiative/Malala Fund (2021).
256. Ehlers, S, Husain, S, Karboul, A, Kwauk, C, Lovett, S, McBride, L, et al. Education for climate action: why education is critical for climate progress. Washington, DC: Malala Fund (2022).
257. United Nations Population Division. World population prospects: the 2004 revision volume III: analytical report. New York, NY: United Nations Population Division (2004).
258. O'Neill, BC, Liddle, B, Jiang, L, Smith, KR, Pachauri, S, Dalton, M, et al. Demographic change and carbon dioxide emissions. Lancet. (2012) 380:157–64. doi: 10.1016/S0140-6736(12)60958-1
259. Dodman, D. Blaming cities for climate change? An analysis of urban greenhouse gas emissions inventories. Environ Urbaniz. (2009) 21:185–201. doi: 10.1177/0956247809103016
260. Krey, V, O'Neill, BC, van Ruijven, B, Chaturvedi, V, Daioglou, V, Eom, J, et al. Urban and rural energy use and carbon dioxide emissions in Asia. Energ Econ. (2012) 34:S272–83. doi: 10.1016/j.eneco.2012.04.013
261. Sadorsky, P. The effect of urbanization on CO2 emissions in emerging economies. Energ Econ. (2014) 41:147–53. doi: 10.1016/j.eneco.2013.11.007
262. The Economist Which countries are driving the world’s population growth? (2022). Available at: economist.com/the-economist-explains/2022/07/11/which-countries-are-driving-the-worlds-population-growth
263. World Bank. Population growth (annual %). (2023). Available at: data.worldbank.org/indicator/SP.POP.GROW
264. World Bank. Population total. (2023). Available at: data.worldbank.org/indicator/SP.POP.TOTL
265. World Bank. Poverty and equity data portal. (2023). Available at: povertydata.worldbank.org/poverty/home
267. United Nations Department of Economic and Social Affairs Population Division. World population ageing 2019: highlights. New York, NY: United Nations (2019).
268. Burtless, G, and Aaron, HJ. Closing the deficit: how much can later retirement help? Washington, DC: The Brookings Institute Press (2013) Available at: jstor.org/stable/10.7864/j.ctt4cg858.
269. Coulmas, F. Population decline and ageing in Japan - the social consequences. London: Routledge (2007).
270. Gottlieb, BH, and Gillespie, AA. Volunteerism, health, and civic engagement among older adults. Can J Aging. (2008) 27:399–406. doi: 10.3138/cja.27.4.399
271. Bradshaw, CJA, and Brook, BW. Implications of Australia's population policy for future greenhouse-gas emissions targets. Asia Pac Pol Stud. (2016) 3:249–65. doi: 10.1002/app5.135
272. Camarota, SA, and Kolankiewicz, L. Immigration to the United States and world-wide greenhouse gas emissions. Washington, DC: Center for Immigration Studies (2008).
273. Gore, T. Confronting carbon inequality: putting climate justice at the heart of the COVID-19 recovery. Washington, DC: Oxfam International (2020).
275. Psaki, SR, Chuang, EK, Melnikas, AJ, Wilson, DB, and Mensch, BS. Causal effects of education on sexual and reproductive health in low and middle-income countries: a systematic review and meta-analysis. SSM Pop Health. (2019) 8:100386. doi: 10.1016/j.ssmph.2019.100386
276. Viner, RM, Hargreaves, DS, Ward, J, Bonell, C, Mokdad, AH, and Patton, G. The health benefits of secondary education in adolescents and young adults: an international analysis in 186 low-, middle- and high-income countries from 1990 to 2013. SSM Pop Health. (2017) 3:162–71. doi: 10.1016/j.ssmph.2016.12.004
277. Gakidou, E, Cowling, K, Lozano, R, and Murray, CJL. Increased educational attainment and its effect on child mortality in 175 countries between 1970 and 2009: a systematic analysis. Lancet. (2010) 376:959–74. doi: 10.1016/S0140-6736(10)61257-3
278. Cleland, J. The benefits of educating women. Lancet. (2010) 376:933–4. doi: 10.1016/S0140-6736(10)61417-1
279. Duflo, E. Women empowerment and economic development. J Econ Lit. (2012) 50:1051–79. doi: 10.1257/jel.50.4.1051
280. Doepke, M, Tertilt, M, and Voena, A. The economics and politics of women's rights. Annu Rev Econ. (2011) 4:339–72. doi: 10.1146/annurev-economics-061109-080201
281. Wang, H, Abbas, KM, Abbasifard, M, Abbasi-Kangevari, M, Abbastabar, H, Abd-Allah, F, et al. Global age-sex-specific fertility, mortality, healthy life expectancy (HALE), and population estimates in 204 countries and territories, 1950-2019: a comprehensive demographic analysis for the global burden of disease study 2019. Lancet. (2020) 396:1160–203. doi: 10.1016/S0140-6736(20)30977-6
282. Kamanda, M, Madise, N, and Schnepf, S. Does living in a community with more educated mothers enhance children's school attendance? Evidence from Sierra Leone. Intl J Educ Dev. (2016) 46:114–24. doi: 10.1016/j.ijedudev.2015.09.008
283. Hu, Y, and Qian, Y. Gender, education expansion and intergenerational educational mobility around the world. Nat Hum Behav. (2023) 7:583–95. doi: 10.1038/s41562-023-01545-5
284. Bongaarts, J. Fertility and reproductive preferences in post-transitional societies In: RA Bulatao and JB Casterline, editors. Global fertility transition, a supplement to Vol. 27 (2001) of population and development review. New York, NY: Population Council (2001). 260–81.
285. Lee, R. The demographic transition: three centuries of fundamental change. J Econ Persp. (2003) 17:167–90. doi: 10.1257/089533003772034943
286. David, R. Wasted investments: some economic implications of childhood mortality patterns. Pop Stud. (1995) 49:519–36. doi: 10.1080/0032472031000148806
287. Washington, H, Lowe, I, and Kopnina, H. Why do society and academia ignore the ‘scientists warning to humanity’ on population? J Future Stud. (2020) 25:93–106. doi: 10.6531/JFS.202009_25(1).0009
288. Washington, H. Questioning the assumptions, sustainability and ethics of endless economic growth. J Risk Financ Manag. (2021) 14:497. doi: 10.3390/jrfm14100497
289. Washington, H, and Kopnina, H. Discussing the silence and denial around population growth and its environmental impact. How do we find ways forward? World. (2022) 3:1009–27. doi: 10.3390/world3040057
290. Washington, H. Ecosolutions: solving environmental problems for the world and Australia. Tea Gardens: Boobook Publications (1991).
291. Greenhalgh, S. Science, modernity, and the making of China's one-child policy. Pop Dev Rev. (2003) 29:163–96. doi: 10.1111/j.1728-4457.2003.00163.x
292. Sinding, SW. Population, poverty and economic development. Philos Trans R Soc B. (2009) 364:3023–30. doi: 10.1098/rstb.2009.0145
293. Dao, MQ. Population and economic growth in developing countries. Int J Acad Res Bus Soc Sci. (2012) 2:6.
294. Sibt e Ali, M, SMF, R, Nu, D, and Abidin, SZ. Population, poverty and economic development nexus: empirical study of some selected developing countries. Pak J Huma Soc Sci. (2018) Available at: ssrn.com/abstract=3331586
295. Fletcher, R, Breitlin, J, and Puleo, V. Barbarian hordes: the overpopulation scapegoat in international development discourse. Third World Q. (2014) 35:1195–215. doi: 10.1080/01436597.2014.926110
297. White, R. Green politics and the question of population. J Austr Stud. (1994) 18:27–43. doi: 10.1080/14443059409387164
298. Ellis, EC. The Anthropocene condition: evolving through social–ecological transformations. Philos Trans R Soc B. (2023) 379:20220255. doi: 10.1098/rstb.2022.0255
299. IPCC. Climate Change 2022: mitigation of climate change. PR Shukla, J Skea, A Reisinger, R Slade, R Frader, and M Pathak, et al., editors. Cambridge: Cambridge University Press (2022). (Climate change 2022: mitigation of climate change. contribution of working group III to the sixth assessment report of the intergovernmental panel on climate change).
Keywords: air pollution, child health, climate change, consumption, environment, overshoot, pediatrics, sustainability
Citation: Saraswati CM, Judge MA, Weeda LJZ, Bassat Q, Prata N, Le Souëf PN and Bradshaw CJA (2024) Net benefit of smaller human populations to environmental integrity and individual health and wellbeing. Front. Public Health. 12:1339933. doi: 10.3389/fpubh.2024.1339933
Edited by:
Paolo Vineis, Imperial College London, United KingdomReviewed by:
Hassan Heshmati, Endocrinology Metabolism Consulting, LLC, United StatesLuca Carra, Zadig, Italy
Copyright © 2024 Saraswati, Judge, Weeda, Bassat, Prata, Le Souëf and Bradshaw. This is an open-access article distributed under the terms of the Creative Commons Attribution License (CC BY). The use, distribution or reproduction in other forums is permitted, provided the original author(s) and the copyright owner(s) are credited and that the original publication in this journal is cited, in accordance with accepted academic practice. No use, distribution or reproduction is permitted which does not comply with these terms.
*Correspondence: Corey J. A. Bradshaw, Y29yZXkuYnJhZHNoYXdAZmxpbmRlcnMuZWR1LmF1