 Keli Ma1
 Haiyang Liu2Leilei Guo3Jinlong Li4Yunxiao Lei5Xiaoping Li6Lu Sun6Liu Yang7
 Ting Yuan5Congzhi Wang7
 Dongmei Zhang8Jing Li9Mingming Liu9Ying Hua10
 Lin Zhang7*
- 1Department of Graduate School, Wannan Medical College, Wuhu, Anhui, China
- 2Student Health Center, Wannan Medical College, Wuhu, Anhui, China
- 3Department of Surgical Nursing, School of Nursing, Jinzhou Medical University, Jinzhou, Liaoning, China
- 4Key Laboratory of Occupational Health and Safety for Coal Industry in Hebei Province, Department of Occupational and Environmental Health, School of Public Health, North China University of Science and Technology, Tangshan, Hebei, China
- 5Obstetrics and Gynecology Nursing, School of Nursing, Wannan Medical College, Wuhu, Anhui, China
- 6Department of Emergency and Critical Care Nursing, School of Nursing, Wannan Medical College, Wuhu, Anhui, China
- 7Department of Internal Medicine Nursing, School of Nursing, Wannan Medical College, Wuhu, Anhui, China
- 8Department of Pediatric Nursing, School of Nursing, Wannan Medical College, Wuhu, Anhui, China
- 9Department of Surgical Nursing, School of Nursing, Wannan Medical College, Wuhu, Anhui, China
- 10Rehabilitation Nursing, School of Nursing, Wannan Medical College, Wuhu, Anhui, China
Background: Metabolic syndrome (MetS) is on the rise in developing countries and is characterized by a series of indications of metabolic disturbance. However, the prevalence of MetS varies under different definitions. The study aimed to compare five definitions of MetS in the China adult population, to explore their prevalence, characteristics and agreement.
Methods: The data for the retrospective study came from the China Health and Retirement Longitudinal Study (CHARLS), consisting of 9,588 participants (≥45). MetS definitions from International Diabetes Federation (IDF) (2006), National Cholesterol Education Program Adult Treatment Panel III (ATPIII) (2005), National Cholesterol Education Program Adult Treatment Panel III (ATPIII) (2001), Chinese Diabetes society (CDS) (2004) and the World Health Organization (WHO) (1999). We used binary and multivariable logistic analysis to explore factors connected with MetS.
Results: The five definitions of MetS led to different prevalence of MetS:34.52% by IDF (2006), 38.63% by ATP (2005), 25.94% by ATP (2001), 26.31% by CDS (2004), 21.57% by WHO (1999). According to the definition of IDF (2006) (22.32% vs. 45.06%), ATPIII (2005) definition (27.99% vs. 47.82%), ATPIII (2001) definition (15.37% vs. 35.07%), CDS (2004) definition (19.96% vs. 31.80%), and WHO (1999) definition (17.44% vs. 25.14%), the prevalence of MetS in men was low but in women was high. The agreement between the five definitions for men was good except for the IDF (2006) definition and ATPIII (2001) definition (kappa = 0.51), with kappa values from 0.64 to 0.85. For women, the agreement between the five definitions was good ranging from 0.67 to 0.95, however, except for the definition of CDS (2004) and the definition of IDF (2006) (kappa = 0.44), the definition of WHO (1999) and the definition of IDF (2006) (kappa = 0.55), and the definition of WHO (1999) and the definition of ATPIII (2005) (kappa = 0.54). Binary logistic analysis indicated that although the impact and relevance varied by sex and definition, age, education, marital status, current residence, current smoking, alcohol using, taking activities and number of chronic diseases were factors connected to MetS.
Conclusion: the prevalence and characteristics of the five definitions of MetS are different in the Chinese population. Therefore, it is vital to use the same definition for a country to diagnose MetS. On the other side, a lower prevalence in men than in women and the consistency of five MetS definitions are good in men but relatively poor in women.
Background
Metabolic syndrome (MetS) is a cluster of syndromes consisting of a variety of abnormal metabolic conditions associated with cardiovascular diseases (CVDs), including insulin resistance, elevated blood pressure and dyslipidemia (1, 2). Metabolic syndrome, the incidence of which continues to rise in developing countries, is a serious public health problem of increasing global importance (3). Approximately one quarter of the world’s population suffers from MetS (4). MetS consists mainly of central or abdominal obesity, diabetes mellitus, hypertension, and dyslipidemia characterized by hypertriglyceridemia (TG) and low high-density lipoprotein cholesterol (HDL-C) disorders. The mortality rate for cardiovascular events is higher in patients with MetS (5–7). Therefore, exploring the prevalence, characteristics and associated factors of metabolic syndrome is important for the prevention of cardiovascular diseases (CVDs) and slowing the increase in prevalence (8–10).
Currently there are different diagnostic criteria for MetS globally, in which the diagnostic criteria vary. In this study, the definitions of MetS provided by several international organizations were examined. The International Diabetes Federation (IDF) proposed a new definition in 2006 (11). The World Health Organization (WHO) proposed a definition of metabolic syndrome in 1999 (12). The definition published by the Adult Treatment Panel III (ATPIII) of the US National Cholesterol Education Program in 2001 was updated in 2005 (13, 14). The Chinese Diabetes Society (CDS) also proposed a definition of MetS in 2004 (15).
The prevalence of MetS varies globally according to different definitions, populations and geographical locations (16). According to studies, the global prevalence of MetS ranges from 12.5 to 31.4% (17). In China, the prevalence varies from 9.82 to 48.8% according to different criteria (16), and according to criteria of ATP III, the prevalence of MetS is 24.6% in men and 23.8% in women (18). In Peru, the prevalence of MetS was 30% according to a cross-sectional study by the Institute of Diabetes (IDF) (19), and in the United States, 32.8% of men and 36.6% of women had MetS according to ATP III 2011–2012 (20). This shows that the prevalence of MetS varies in the same country even when the same criteria are used. Thus, it is important to study the prevalence of MetS under different definitions, which may help researchers better define MetS.
Methods
Design and study participants
The data for this study came from the 2011 China Health and Retirement Longitudinal Survey wave (CHARLS Wave2011) conducted by the China Center for Economic Research at Peking University, a nationally representative longitudinal investigation (21, 22). This study area was conducted in 28 provinces and cities across China. The survey covered 450 villages or communities in 150 counties and districts. Subsequently, we collected data of metabolic syndrome for 2015, and the baseline data was chosen to be 2011 in CHARLS Wave 2011, We excluded individuals who met any of the following criteria at baseline: (1) participants with MetS, (2) one of the 6 indices (BMI, WC, Blood pressure, Hyperglycemia, TG, HDL-C) missing, and (3) Age/Sex/Educational level/Marital status/ Current residence/Current smoking/Alcohol drinking/Taking activities/Having regular exercises/Chronic diseases missing, a total of 9,588 participants who were aged 45 and above were included in our analyses after excluding missing data respondents, and without any direct interaction with people, all data were presented in the open as microdata at http://charls.pku.edu.cn/index/zh-cn.html. We obtained written informed consent from each of the participants, and the study was approved by the Ethics Committee of the China Center for Economic Research at Peking University.
Data collection and measurement
The study subjects for this investigation were chosen from the China Health and Retirement Longitudinal Study (CHARLS), Wave 1 (2011) (22). The CHARLS Wave 2011 was used to select participants for this study for demographic characteristics and factors, such as age (four sections: 45–54, 55–64, 65–74, and above 75 years old), education (five sections: Illiterate, Less than elementary school, High school, Above vocational school), marital status (Single, or Married), current residence (Rural, or Urban), smoking (three sections: no, Former smoke, Current smoke) and alcohol using (three sections: no, Less than once a month, More than once a month), taking activity (two sections: no or yes)including interacting with friends/providing help to family, friends or neighbors who do not live with you/attending a sports, social or other type of club/playing mahjong, chess, cards; or going to a community club/participating in a community-related organization/doing volunteer or charity work/caring for an adult who is sick or disabled, who does not live with you and does not pay you/attending an education or training course/investing in stocks and shares/ Using the internet (23), having regular exercises (three sections: No exercise, Less than regular exercises, Regular exercises), regular physical exercise was defined as exercising at least 3 days per week and more than 30 min per day, including moderate to vigorous physical activity and walking and chronic disease counts (three sections:0, 1–2, 3–14) including (1) hypertension, (2) cancer or malignant neoplasm (excluding minor skin cancers), (3) diabetes mellitus or hyperglycemia, (4) chronic lung disease, (5) dyslipidaemia, (6) diseases of the liver (other than fatty liver, neoplasm, and cancer), (7) diseases of the kidneys (other than tumors or cancer), (8) stroke, (9) heart attack, coronary heart disease, angina pectoris, congestive heart failure, or other heart problems, (10) stomach or other digestive disorders (except tumors or cancers), (11) memory-related disorders, (12) emotional, nervous, or psychiatric problems, (13) arthritis or rheumatism, and (14) asthma as reported by the respondent (diagnosed by a doctor) (24).
The Chinese Center for Disease Control and Prevention (CDC) in Beijing received venous blood samples within 2 weeks of their departure from the Centers for Disease Control and Prevention (CDC) station, processed and ready for refrigeration. Fasting plasma glucose (FPG), triglycerides (TG) and high-density lipoprotein cholesterol (HDL-C) were measured using an enzyme colorimetric method. All samples were performed in the Youanmen Clinical Laboratory of Capital Medical University (25). Body mass index (BMI) was calculated by dividing the body weight (kg) by the square of the height (m2) (26–28). The waist circumference was measured at the end of expiration by standing straight with the feet 25–30 cm apart and measuring the horizontal position of the midpoint between the lower edge of the ribcage and the midpoint of the line connecting the upper iliac crest spine (29). Subjects rested for half an hour and then their blood pressure was measured in a quiet environment, blood pressure was measured on the subject’s left arm using an Omron TM HEM-7112 Monitor (Manufacturer: Omron Co., Ltd., Dalian, China) (30). Support the subject’s left arm comfortably, palm up, and take the average of three measurements at 45-s intervals.
Diagnosing standard of MetS
According to the definition of IDF (2006), the diagnosis of MetS is based on central obesity (Chinese definition, the waist circumference (WC) for central obesity was ≥90 cm for men and WC ≥85 for women) plus any two or more of the following components: (1) Elevated blood pressure: systolic blood pressure (SBP) ≥130 mmHg and/or diastolic blood pressure (DBP) ≥85 mmHg or treatment of previously diagnosed hypertension; (2) Hyperglycemia: FPG ≥100 mg/dL or using antidiabetic medications or previously diagnosed type 2 diabetes; (3) High TG: TG ≥150 mg/dL or specific treatment for this lipid.
abnormality at high-density; (4) Low HDL-C: HDL-C < 40 mg/dL for men and < 50 mg/dL for women or specific treatment for this lipid abnormality (4, 11).
According to the ATP III (2005) definition, the diagnosis of MetS is based on three or more of the following abnormalities: (1) Central obesity (WC ≥90 cm for men and ≥ 80 cm for women); (2) Elevated blood pressure (BP): systolic blood pressure (SBP) ≥130 mmHg and/or diastolic blood pressure (DBP) ≥85 mmHg or on antihypertensive drug treatment in a patient with a history of hypertension; (3) Hyperglycemia: FPG ≥100 mg/dL or on drug treatment for elevated glucose; (4) High TG: TG ≥150 mg/dL or on drug treatment for elevated triglycerides; (5) Low HDL-C: HDL-C < 40 mg/dL for men and < 50 mg/dL for women or on drug treatment for reduced HDL (31, 32).
According to the definition of ATP III (2001), the diagnosis of MetS is based on three or more of the following abnormalities: (1) Central obesity (WC ≥102 cm for men and ≥ 88 cm for women); (2) Elevated blood pressure: systolic blood pressure (SBP) ≥130 mmHg and/or diastolic blood pressure (DBP) ≥85 mmHg or on antihypertensive drug treatment in a patient with a history of hypertension; (3) Hyperglycemia: FPG ≥110 mg/dL or on drug treatment for elevated glucose; (4) High TG: TG ≥150 mg/dL or on drug treatment for elevated triglycerides; (5) Low HDL-C: HDL-C < 40 mg/dL for men and < 50 mg/dL for women or on drug treatment for reduced HDL (33).
According to the definition of CDS (2004), the diagnosis of MetS is based on three or more of the following abnormalities: (1) Central obesity: BMI ≥25 kg/m2 (BMI was classified according to the recommendations of Working Group of Obesity in China, <18.5 kg/ m2 (underweight), 18.5–23.9 kg/m2 (normal range), 24–27.9 kg/m2 (overweight), ≥28 kg/m2 (obesity)); (2) Elevated blood pressure: systolic blood pressure (SBP) ≥140 mmHg and/or diastolic blood pressure (DBP) ≥90 mmHg or on antihypertensive drug treatment in a patient with a history of hypertension; (3) Hyperglycemia: FPG ≥110 mg/dL or on drug treatment for elevated glucose; (4) High TG: TG ≥150 mg/dL or on drug treatment for elevated triglycerides; (5) Low HDL-C: HDL-C < 40 mg/dL for men and < 50 mg/dL for women or on drug treatment for reduced HDL (34).
According to the WHO (1999) definition, (1) Central obesity (WC ≥90 cm or BMI ≥30 kg/m2 for men and ≥ 85 cm for women); (2) Elevated blood pressure: systolic blood pressure (SBP) ≥140 mmHg and/or diastolic blood pressure (DBP) ≥90 mmHg or on antihypertensive drug treatment in a patient with a history of hypertension; (3) Hyperglycemia: FPG ≥110 mg/dL or on drug treatment for elevated glucose; (4) High TG: TG ≥150 mg/dL or on drug treatment for elevated triglycerides; (5) Low HDL-C: HDL-C < 35 mg/dL for men and <39 mg/dL for women or on drug treatment for reduced HDL (35).
Statistical analysis
We used Statistical Product Service Solutions (SPSS) software, version 22.0, to conduct the analyses (IBM SPSS, Armonk, NY, USA). The basic characteristics of the study population were expressed as number of cases and percentage (%), and the chi-square test was used to understand the distribution of categorical variables. Differences between groups for continuous and categorical variables were assessed using t-tests and x2 tests. The kappa value (kappa ≤0.20, poor; kappa = 0.21–0.40, fair; kappa = 0.41–0.60, moderate; kappa = 0.61–0.80, substantial; kappa > 0.80, very good) was used to assess the differences and consistency between the five definitions (36). Variables potentially associated with any defined MetS were assessed using binary and multivariable logistic regression, and those with p < 0.10 were included in multivariable logistic regression. Ratio ratios (ORs) and 95% confidence intervals (95% CIs) were calculated by sex for each of the five definitions of age, education, marital status, place of residence, current smoking, alcohol consumption, activity level, regular exercise, and chronic disease. Statistically significant, p < 0.05.
Result
Table 1 shows the demographic characteristics of the subjects, which consisted of 9,588 subjects, of whom 4,444 (46.35%) were males and 5,144 (53.65%) were females. The overall mean age was 58.4 years with a standard deviation (SD) of 9.04, 59.3 years for males (SD = 8.78) and 57.5 years for females (SD = 9.17). The age range was 45–98 years. The majority (92.70%) lived in rural areas, and 62.61% had primary education or less, with 73.31% males and 53.36% females. The vast majority were married (89.18%) and a few were single (10.82%); 49.18% had one or two chronic diseases, and 60.51% of males were current smokers and 46.22% drinkers, while only 5.99% of females and 6.82% of females were current smokers and drinkers. Among them, the differences between males and females in terms of age, education level, marital status, current smoking, alcohol drinking, having regular exercises and number of chronic diseases were statistically significant (p < 0.05). However, the differences were not statistically significant (p > 0.05) in terms of current residence and taking activities.
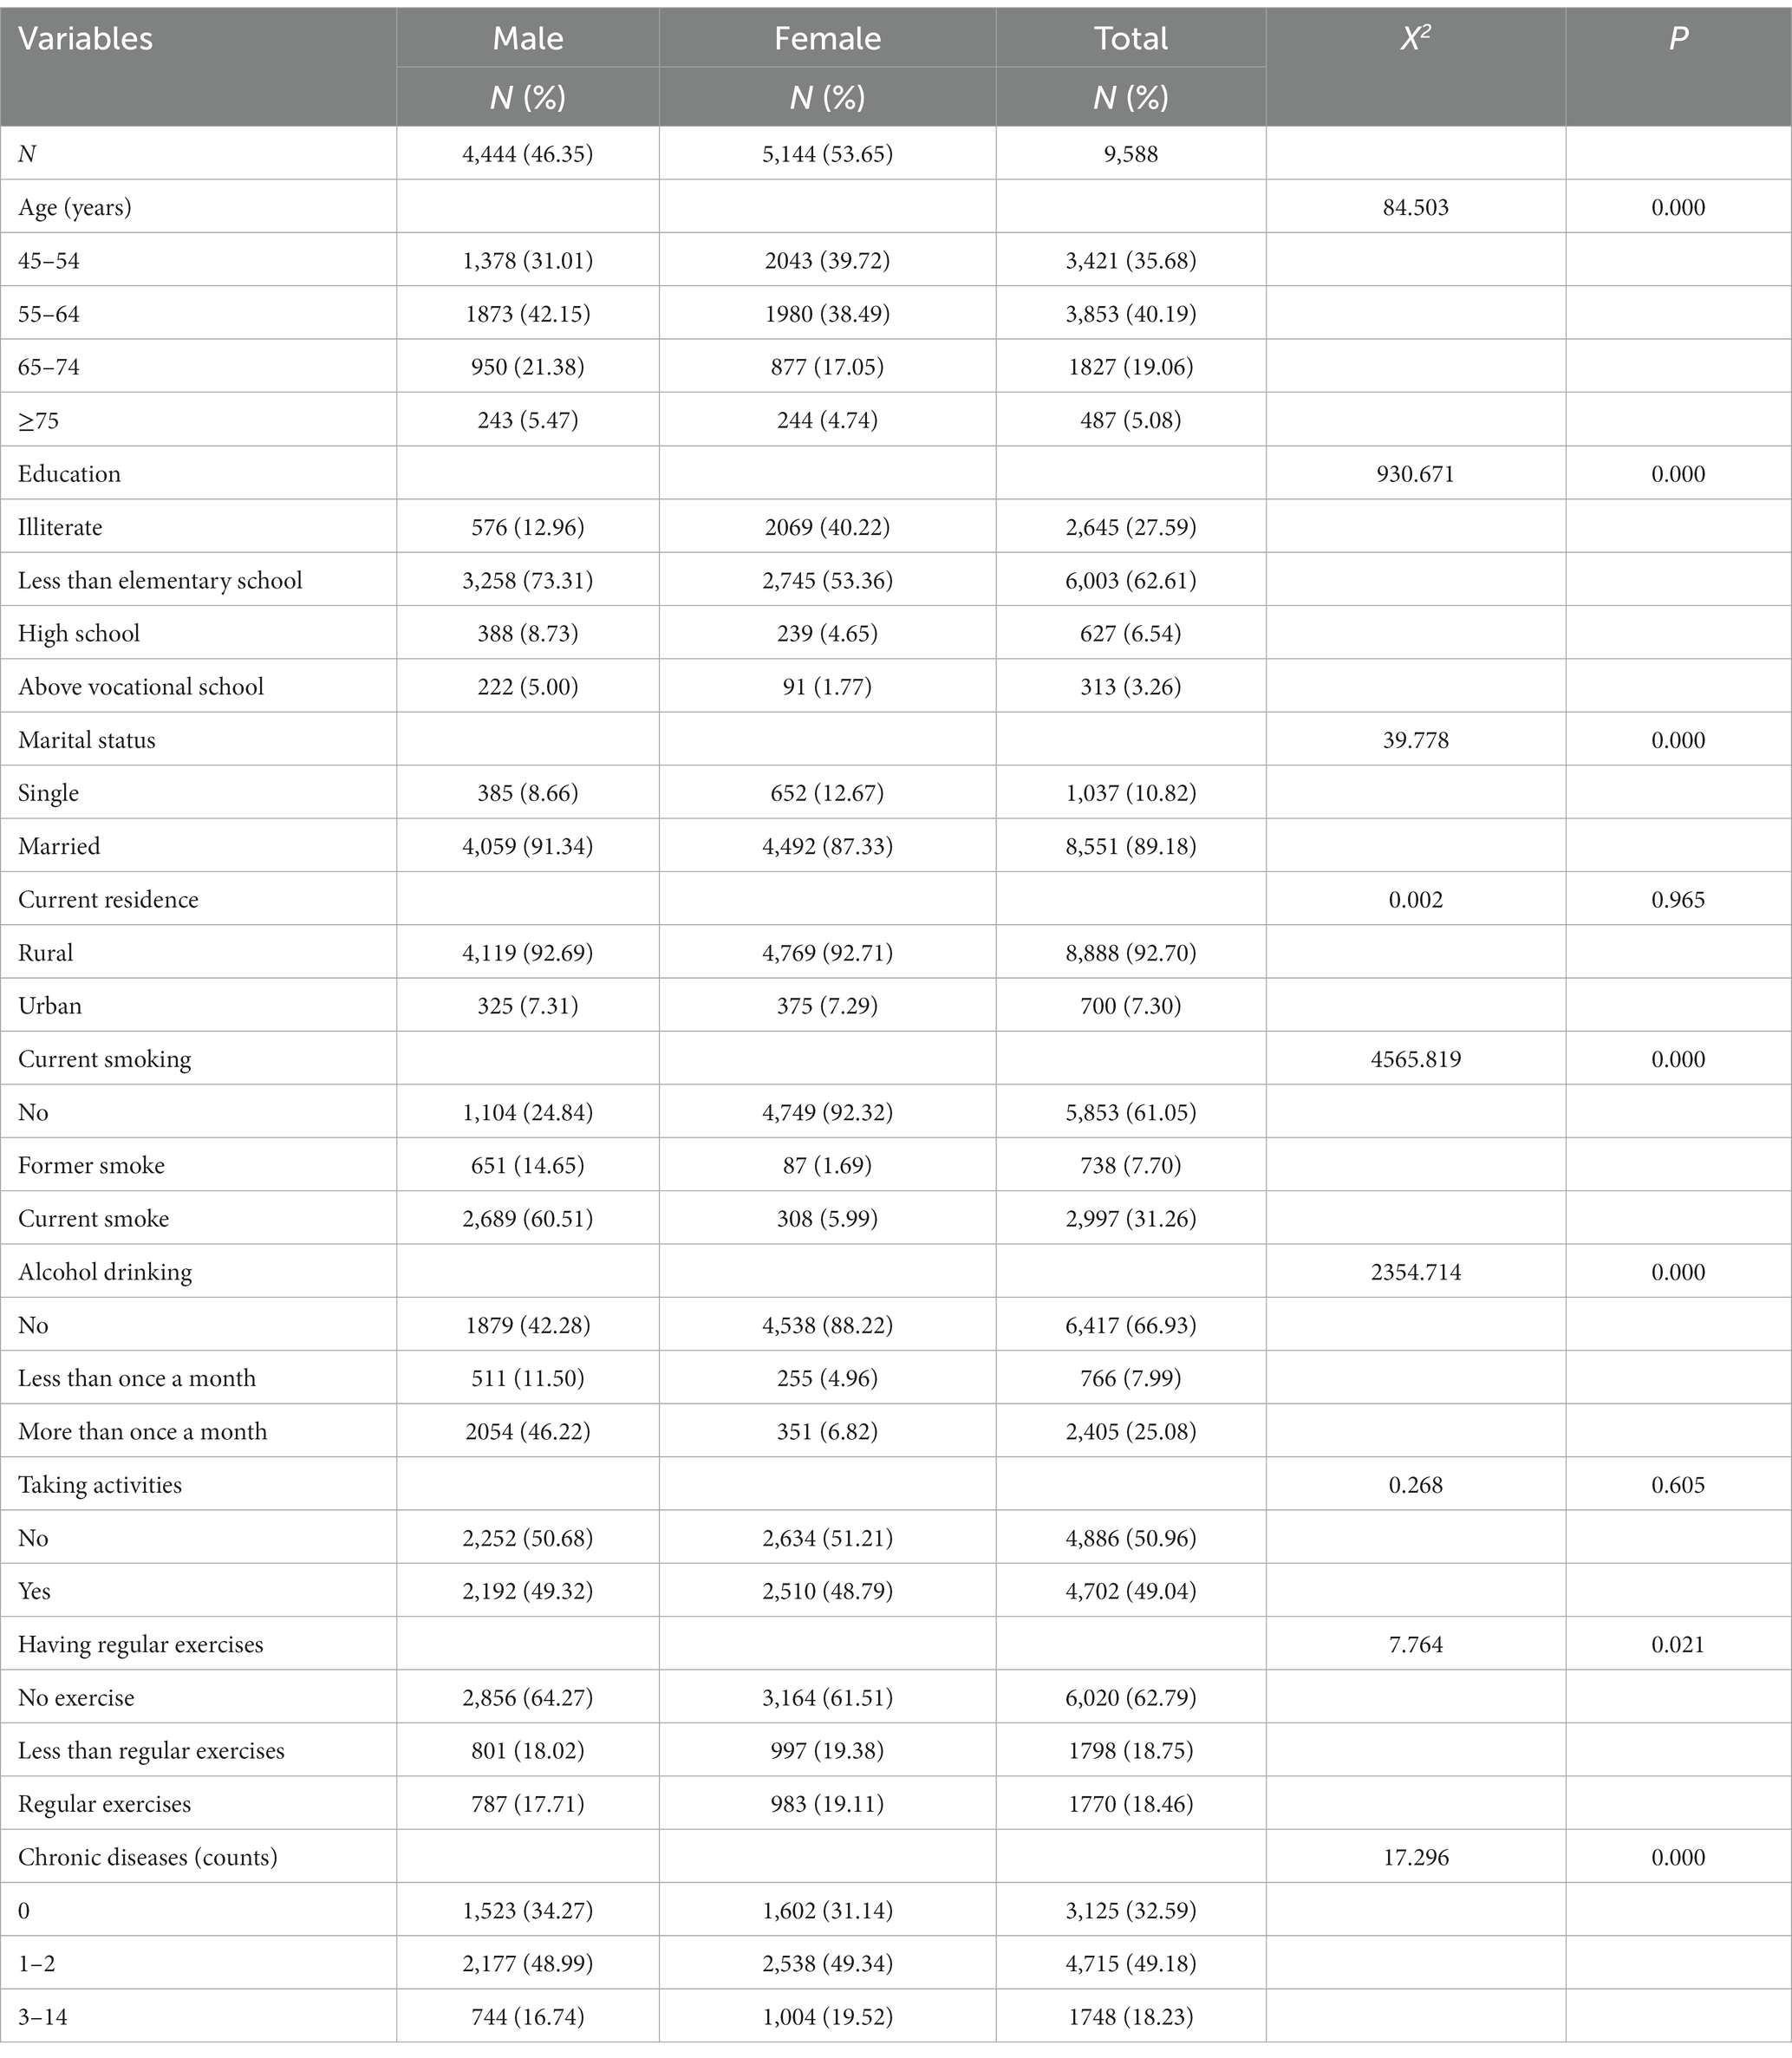
Table 1. Characteristics of participants with full samples (N = 9,588).
Table 2 shows the prevalence of MetS according to the criteria of IDF (2006), ATP III (2005), ATP III (2001), CDS (2004), and WHO (1999). The overall population reveals a prevalence of MetS of 34.52% (22.32% among males and 45.06% among females) according to the standards of IDF (2006); 38.63% (27.99% among males and 47.82% among females) according to the rules of ATP III (2005); 25.94% (15.37% for males, 35.07% for females) according to the standards of ATP III (2001); 26.31% (19.96% for males and 31.80% for females) based on data from CDS (2004); and 21.57% (17.44% for males and 25.14% for females) according to WHO (1999). Based on the five definitions, there are subtle variations in the association between specific variables and MetS, although the similarity remains evident. Regardless of the definition used, having a primary school education or lower, being married, residing in rural areas, lack of exercise, and having one or two chronic diseases are significantly associated with higher prevalence rates among the general population (both genders). The prevalence of metabolic equivalent of task (MET) reaches its peak in the 55–64 age group among both genders of the general population, and decreases with age under all definitions. Regardless of the definition used, a higher prevalence of metabolic syndrome is associated with smoking in men, and with smoking a lower prevalence of metabolic syndrome is associated in women according to IDF (2006), ATP III (2005), and WHO (1999). Meanwhile, alcohol consumption shows a lower prevalence in women and a higher prevalence in men across ATP III (2005), CDS (2004), and WHO (1999).

Table 2. The prevalence of MetS defined by different definitions.
Table 3 demonstrates consistency and variability in diagnoses using IDF (2006), ATP III (2005), ATP III (2001), CDS (2004) and WHO (1999) criteria. It also displays the kappa values between two definitions for males and females. Among males, only the agreement between IDF (2006) and ATP III (2001) (kappa = 0.51) was poor. The kappa values ranged from 0.64 to 0.85 with good agreement for any two other definitions. Among women, there was good agreement between IDF (2006) and both ATP III (2005) (kappa = 0.95) and ATP III (2001) (kappa = 0.71); ATP III (2005) also showed good agreement with ATP III (2001) (kappa = 0.74) and CDS (2004) (kappa = 0.67). Additionally, ATP III (2001) demonstrated good agreement with CDS (2004) (kappa = 0.85) and WHO (1999) (kappa = 0.71); and there was good agreement observed between CDS (2004) and WHO (1999) (kappa = 0.73). Moderate agreement was found between IDF (2006) and CDS (2004) (kappa = 0.44), and WHO (1999) (kappa = 0.55); as well as between ATP III (2005) and WHO (1999) (kappa = 0.54).
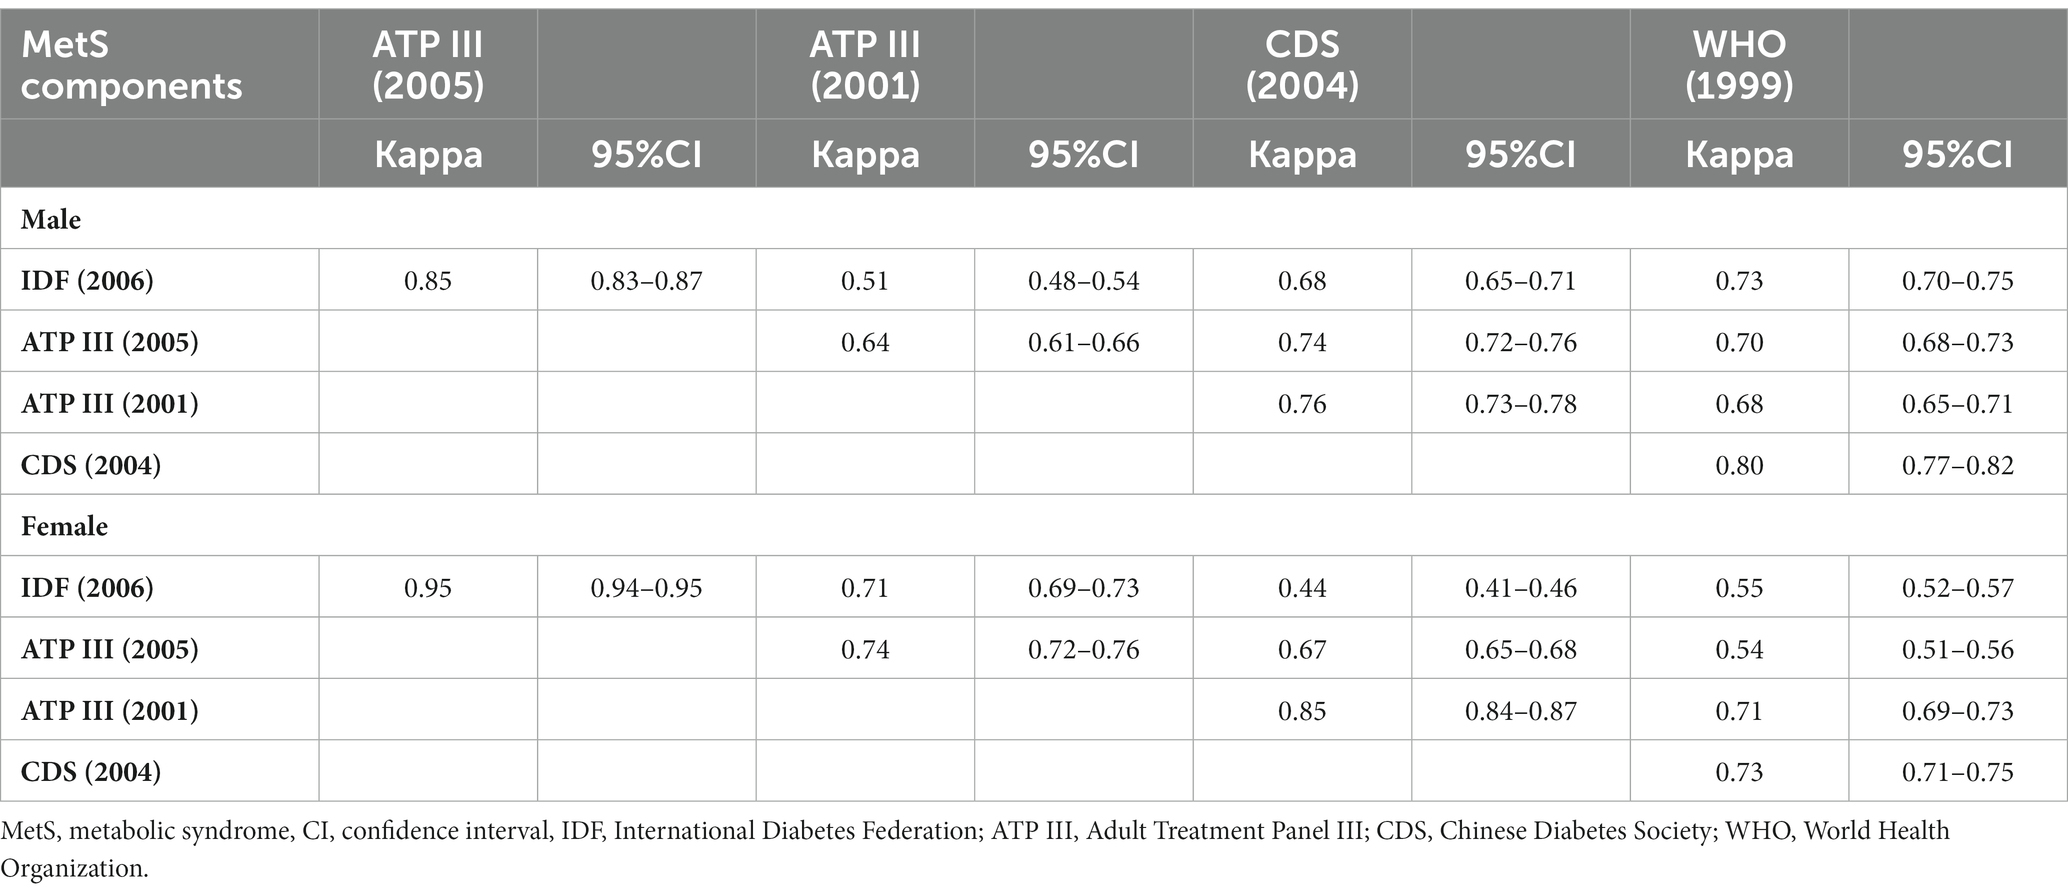
Table 3. The agreement between the various definitions of the MetS.
Table 4 analyzes the factors connected with MetS in men and women under different definitions. The study suggested that age, education, marital status, current residence, smoking, alcohol consumption, taking activities and number of chronic diseases were associated with MetS. However, the relationship between these factors varies by definition and by gender. Under all five definitions of MetS, being married, living in the city, and having a chronic disease were remarkably associated with a high prevalence of MetS in both male and female. Among men under any of the definitions, being 75 years of age and older was associated with a lower prevalence of MetS, while having a college degree and older was significantly associated with a higher prevalence of MetS. In contrast, among women, all ages 55 and older were conspicuously connected with a higher prevalence of MetS under all five definitions, however, education did not have a significant relationship in women. For men, smoking was obviously related to a lower prevalence of MetS in all five definitions, and not with MetS in women. For men, alcohol consumption was significantly associated with a lower prevalence of MetS only under the ATP (2001) and CDS (2004) definitions, and in women, alcohol consumption was significantly associated with a lower prevalence of MetS under the five definitions. In women, activity was significantly associated with a higher prevalence of MetS than MetS in men. Exercise was not associated with MetS in men and did not play a role in MetS in women.
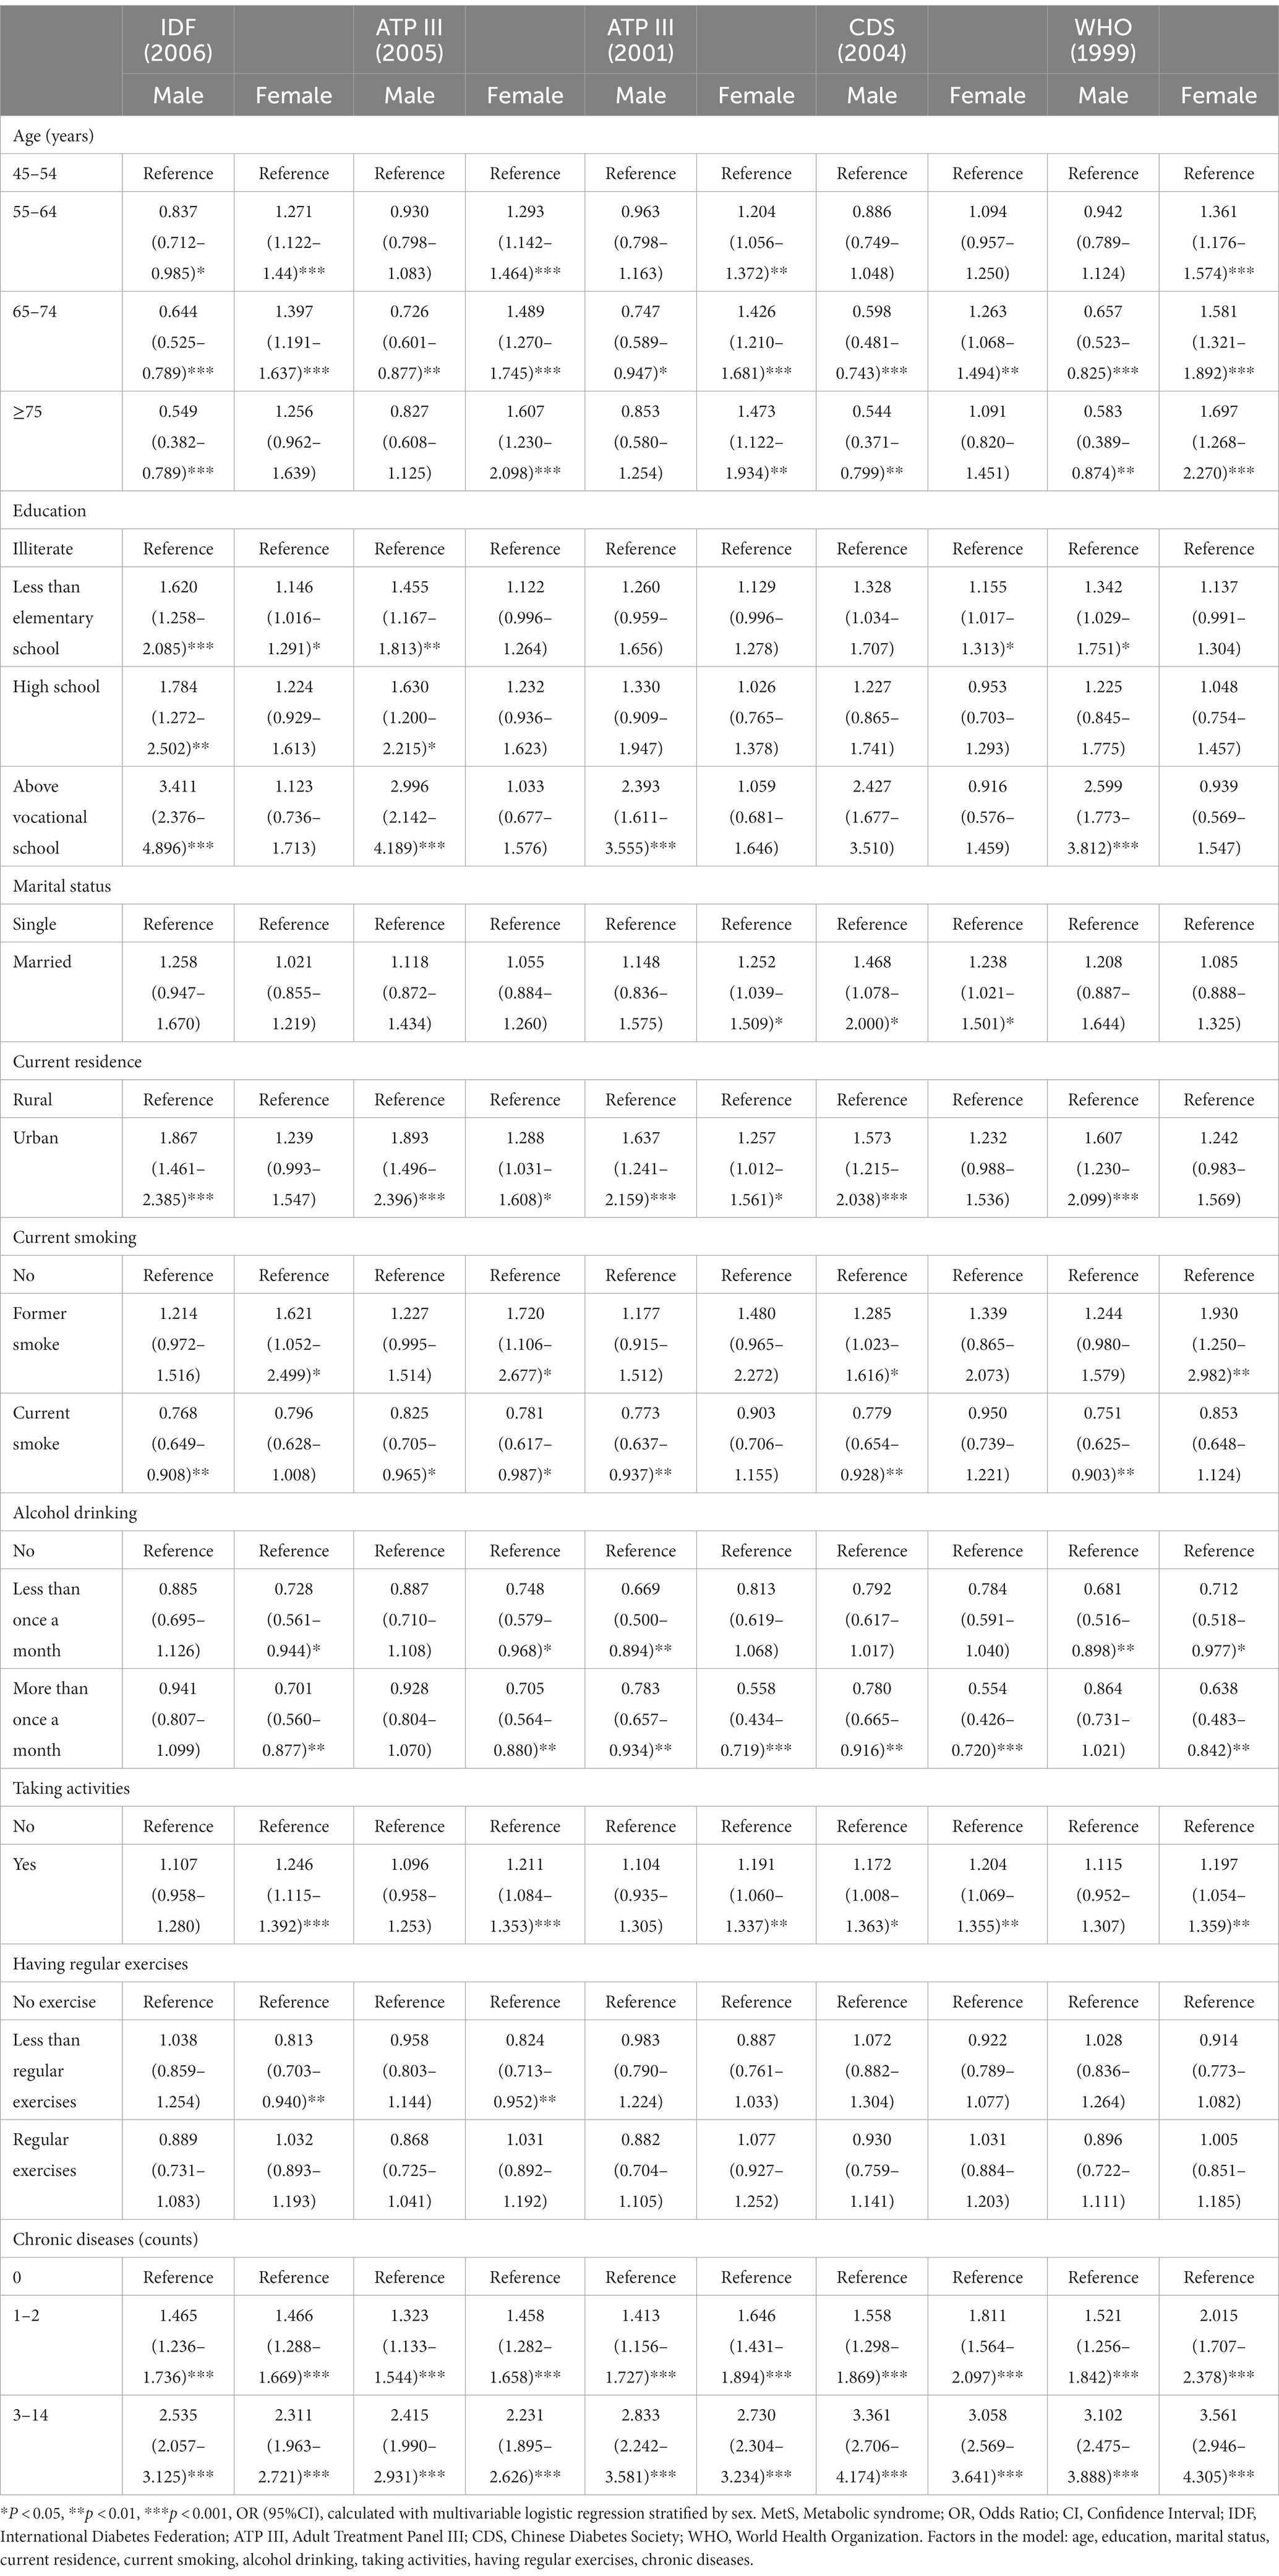
Table 4. Factors related to MetS defined by IDF (2006), ATPIII (2005), ATPIII (2001), CDS (2004) and WHO (1999).
Discussion
This study has found that the binary logistic regression showed that age, education, marital status, current residence, current smoking, alcohol drinking, having regular exercises and number of chronic diseases were associated with MetS. However, the strength of this association varied by gender and definition. Examining the relationship between these factors and MetS will help in better management of MetS; therefore, understanding the differences between definitions will help correctly analyze the differences in the prevalence of MetS. Studies have shown that the prevalence in our population is consistent with previous Chinese data (37, 38). In a study of people 45 years and older, the prevalence of MetS was 38.4 and 39.7% according to IDF (2006) and ATP III (2005), respectively (39). In a study of people 35 years and older, the prevalence of MetS was 18.57% according to the criteria of CSD (2004) (40), and in a study of people 20 years and older, the prevalence of MetS was 14.7% according to the criteria of World Health Organization (1999) (41). The study showed a significantly higher prevalence of MetS according to the ATP III (2005) diagnostic criteria. This indicates that the ATP III (2005) criteria are more stringent than the other criteria.
Previous studies have shown that the prevalence of MetS increases with age, with gender differences (42). In the current study, the prevalence of MetS climbed to a peak at the age of 55–64 years, which is close to the findings of the study that peaked at the age of 60–69 years (43). In addition to this, gender also has a different effect on the prevalence of MetS, with age of the females significantly associated with a high prevalence of MetS, which may be related to menopause in women, where hormones in the body are reduced and lose their protective effect on the heart and kidneys, which may lead to increased blood pressure and a sharp increase in cardiovascular disease. In this study, the prevalence of MetS in men peaked at 55–64 years of age and then declined, becoming a protective factor above 65 years of age, which may be related to the fact that men tend to refuse or die before 75 years (16, 44).
In addition to sex and age, there are a number of other factors associated with MetS. The association of education with MetS varies, being negatively associated with men and not so much with women. This is consistent with males in a Korean study (45). The possible explanation for this is that the number of females in this study was higher in rural areas and in this era, females had less access to education than males. Men, on the other hand, have improved living conditions with higher education and were more tended to consume high-calorie foods while engaging in low physical work. Individuals who are married and live in urban areas have a higher risk of MetS, and it has been shown that this may be related to the fact that married people, as well as those living in urban areas, are more economically developed compared to rural areas, where there has been a dramatic increase in high-fat, high-purine fast food (46), and that married people may increase their intake of high-fat, high-purine foods due to their sense of well-being. In this study, according to the classification used (24), chronic diseases mainly include 14 types of disease, having chronic diseases were a high risk factor for MetS, and more attention should be given individuals with chronic diseases. The results of this study also showed that there was a significant negative correlation between smoking and MetS in men and not significant with MetS in women. The possible explanation for this is that the number of smokers in females is lower and the detection is not strong enough, and in males, due to the metabolic effects of nicotine in cigarettes, leading to weight loss in smokers, thereby affecting the diagnosis of MetS (47). In the IDF (2006), ATP III (2005), and WHO (1999) definitions, former smokers were significantly associated with MetS in women, whereas the association was not significant in men. In addition, we found two controversial results, alcohol consumption as a protective factor in women and no significant correlation in men. This is consistent with the results of Huang (16), Huang et al. demonstrated that alcohol consumption has a protective effect for women and a risk factor for men. Sun’s study also found that heavy alcohol consumption (>35 g/day) is associated with a high prevalence of MetS. According to relevant guidelines (13), small amounts of alcohol consumption can increase HDL-C levels, which may lower the risk of cardiovascular disease. The study found that alcohol consumption among women was a protective factor, possibly due to the low number of women who consume alcohol (88.22% of women in this study did not drink alcohol) and the small amount of alcohol consumed. Walker et al. demonstrated that small amounts of alcohol consumption have a cardioprotective effect on the heart (48). Whereas alcohol consumption was not significantly associated among males, this may be related to the fact that the male drinkers in this study were relatively small and alcohol consumpted relatively low due to limited economic conditions in that era. Another is that taking activity is a risk factor in women and not significant in men. The possible reason for this was that the activities in this study were not based on physical exertion and were mainly recreational activities that do not reduce the prevalence of MetS and further research is needed (23).
The purpose of this study was to investigate the prevalence and characteristics of five different definitions of metabolic syndrome (MetS) in China. The results of the analysis showed that the overall prevalence of MetS in the Chinese population aged 45 years and older, as defined by IDF (2006), ATP III (2005), ATP III (2001), CDS (2004) and WHO (1999), was 34.52, 38.63, 25.94, 26.31, and 21.57%. The results of our study showed that the prevalence of MetS was lower in men than in women in all definitions. This may be related to the fact that the indicators were higher in females than in males in this study. The prevalence and attributes of metabolic syndrome (MetS) in China varied greatly between definitions, ranging from 21.57 to 38.63%. Therefore, it is necessary to implement targeted interventions for different categories of metabolic syndrome.
There are limitations to our study: firstly, several definitions were compared, but they were less consistent among women, which may confuse researchers; secondly, this study was cross-sectional and did not adequately investigate the causal relationship between various MetS correlates; thirdly, factors could not be concluded due to the insufficient sample size, and some potentially relevant factors were not included in the study; fourthly, we did not have data on passive smokers in our study to conduct passive smoker exposure analyses; finally, this study included a significant number of middle-aged and older adults. However, only the surviving subjects were analyzed, which may have introduced bias into our preliminary findings. As well as the fact that our sample years may be too lengthy, further survey data is necessary for additional analysis. There are some strengths to this study. Firstly, the sample size was large, with 9,588 participants included, enabling a better estimation of MetS prevalence. Furthermore, to ensure accurate data, lipid and blood glucose measurements were taken at the Capital Medical University Youanmen Clinical Laboratory. Thirdly, we used five distinct definitions of MetS, which allows comparisons with data from other regions and offers a more comprehensive overview of the prevalence and features of MetS.
Conclusion
According to the retrospective study, the prevalence of MetS varied when different definitions were used. The highest prevalence of MetS was 38.36% using the ATP III (2005) definition, followed by IDF (2006) (34.52%), CDS (2004) (26.31%), ATP III (2001) (25.94%), and WHO (1999) (21.57%). The agreement between the five definitions was good in men, but in women there was a large variability between CDS (2004) and IDF (2006), WHO (1999) and IDF (2006), and WHO (1999) and ATP III (2005). The prevalence of MetS in the Chinese population differs when different definitions are used, so it is necessary to investigate the reasons for the differences in the prevalence of MetS under different definitions and the factors associated with them.
Data availability statement
The original contributions presented in the study are included in the article/supplementary material, further inquiries can be directed to the corresponding author.
Author contributions
KM: Writing – original draft. HL: Writing – review & editing. LG: Writing – review & editing. JLL: Writing – review & editing. YL: Writing – review & editing. XL: Writing – review & editing. LS: Writing – review & editing. LY: Writing – review & editing. TY: Writing – review & editing. CW: Writing – review & editing. DZ: Writing – review & editing. JL: Writing – review & editing. ML: Writing – review & editing. YH: Writing – review & editing. LZ: Writing – review & editing.
Funding
The author(s) declare financial support was received for the research, authorship, and/or publication of this article. The study was funded by National Natural Science Foundation of China (70910107022 and 71130002), the National Institute of Aging (R03TW008358–01 and R01-AG037031-03S1), and the World Bank (7159234). The publication fee was supported by the Support Program for Outstanding Young Talents from the Universities and Colleges of Anhui Province (GxyqZD2021118), the Research Practice of Elderly Nursing (2021shsjkc030), the National Innovation and Entrepreneurship Training Program for College Students (202210368016, S202210368025, and 202310368032), and Internal Medicine Nursing Teaching Team (2021jxtd02).
Acknowledgments
The authors thank the members of the CHARLS and all participants for their contribution.
Conflict of interest
The authors declare that the research was conducted in the absence of any commercial or financial relationships that could be construed as a potential conflict of interest.
Publisher’s note
All claims expressed in this article are solely those of the authors and do not necessarily represent those of their affiliated organizations, or those of the publisher, the editors and the reviewers. Any product that may be evaluated in this article, or claim that may be made by its manufacturer, is not guaranteed or endorsed by the publisher.
Abbreviations
CHARLS, China Health and Retirement Longitudinal Study; MetS, metabolic syndrome; CVDs, cardiovascular diseases; IDF, The International Diabetes Federation; ATP III, Adult Treatment Panel III; CDS, Chinese Diabetes Society; WHO, The World Health Organization; CDC, The Chinese Center for Disease Control; WC, waist circumference; BMI, body mass index; BP, blood pressure; SBP, systolic blood pressure; DBP, diastolic blood pressure; TG, triglycerides; FPG, fasting plasma glucose; HDL-C, high-density lipoprotein cholesterol; SPSS, Statistical Product Service Solutions; ORs, odds ratios; CI, confidence interval
References
1. Rochlani, Y, Pothineni, NV, Kovelamudi, S, and Mehta, JL. Metabolic syndrome: pathophysiology, management, and modulation by natural compounds. Ther Adv Cardiovasc Dis. (2017) 11:215–25. doi: 10.1177/1753944717711379
2. Fan, W, Huang, Y, Zheng, H, Li, S, Li, Z, Yuan, L, et al. Ginsenosides for the treatment of metabolic syndrome and cardiovascular diseases: pharmacology and mechanisms. Biomed Pharmacotherapy. (2020) 132:110915. doi: 10.1016/j.biopha.2020.110915
3. Mottillo, S, Filion, KB, Genest, J, Joseph, L, Pilote, L, Poirier, P, et al. The metabolic syndrome and cardiovascular risk a systematic review and meta-analysis. J Am Coll Cardiol. (2010) 56:1113–32. doi: 10.1016/j.jacc.2010.05.034
4. Saklayen, MG. The global epidemic of the metabolic syndrome. Curr Hypertens Rep. (2018) 20:12. doi: 10.1007/s11906-018-0812-z
5. Galassi, A, Reynolds, K, and He, J. Metabolic syndrome and risk of cardiovascular disease: a meta-analysis. Am J Med. (2006) 119:812–9. doi: 10.1016/j.amjmed.2006.02.031
6. Ranasinghe, P, Mathangasinghe, Y, Jayawardena, R, Hills, AP, and Misra, A. Prevalence and trends of metabolic syndrome among adults in the Asia-Pacific region: a systematic review. BMC Public Health. (2017) 17:101. doi: 10.1186/s12889-017-4041-1
7. Baltali, M, Gokcel, A, Kiziltan, HT, Korkmaz, ME, Topcu, S, Yalcin, F, et al. Association between the metabolic syndrome and newly diagnosed coronary artery disease. Diabetes Nutr Metab. (2003) 16:169–75. doi: 10.1016/S0261-5614(03)00032-3
8. Li, W, Ma, D, Liu, M, Liu, H, Feng, S, Hao, Z, et al. Association between metabolic syndrome and risk of stroke: a meta-analysis of cohort studies. Cerebrovasc Diseases. (2008) 25:539–47. doi: 10.1159/000131672
9. Giampaoli, S, Stamler, J, Donfrancesco, C, Panico, S, Vanuzzo, D, Cesana, G, et al. The metabolic syndrome: a critical appraisal based on the CUORE epidemiologic study. Prev Med. (2009) 48:525–31. doi: 10.1016/j.ypmed.2009.03.017
10. Lonardo, A, Ballestri, S, Marchesini, G, Angulo, P, and Loria, P. Nonalcoholic fatty liver disease: a precursor of the metabolic syndrome. Digestive Liver Disease. (2015) 47:181–90. doi: 10.1016/j.dld.2014.09.020
11. Alberti, KG, Zimmet, P, and Shaw, J. The metabolic syndrome--a new worldwide definition. Lancet. (2005) 366:1059–62. doi: 10.1016/s0140-6736(05)67402-8
12. Rawat, D, Zangmo, R, Chowdhury, SR, Yadav, AK, Sharma, KA, Singh, N, et al. Diabetes in pregnancy study group India (DIPSI) and WHO (1999) diagnostic criteria for GDM: a meta-analysis. Diabetes Metab Syndrome. (2022) 16:102622. doi: 10.1016/j.dsx.2022.102622
13. Expert Panel on Detection, Evaluation, and Treatment of High Blood Cholesterol in Adults. Executive Summary of The Third Report of The National Cholesterol Education Program (NCEP) Expert Panel on Detection, Evaluation, And Treatment of High Blood Cholesterol In Adults (Adult Treatment Panel III). JAMA. (2001) 285:2486–97. doi: 10.1001/jama.285.19.2486
14. Grundy, SM, Cleeman, JI, Daniels, SR, Donato, KA, Eckel, RH, Franklin, BA, et al. Diagnosis and management of the metabolic syndrome: an American Heart Association/National Heart, Lung, and Blood Institute scientific statement. Circulation. (2005) 112:2735–52. doi: 10.1161/circulationaha.105.169404
15. Zhou, H, Hu, XS, Guo, ZR, Shi, ZM, Wu, M, Zhang, J, et al. Study on the comparison of three diagnostic criteria of metabolic syndrome in Jiangsu population. Zhonghua Liu Xing Bing Xue Za Zhi. (2006) 27:1043–7.
16. Huang, Y, Zhang, L, Wang, Z, Wang, X, Chen, Z, Shao, L, et al. The prevalence and characteristics of metabolic syndrome according to different definitions in China: a nationwide cross-sectional study, 2012-2015. BMC Public Health. (2022) 22:1869. doi: 10.1186/s12889-022-14263-w
17. Noubiap, JJ, Nansseu, JR, Lontchi-Yimagou, E, Nkeck, JR, Nyaga, UF, Ngouo, AT, et al. Geographic distribution of metabolic syndrome and its components in the general adult population: a meta-analysis of global data from 28 million individuals. Diabetes Res Clin Pract. (2022) 188:109924. doi: 10.1016/j.diabres.2022.109924
18. Shen, M, Wang, C, Zhang, W, Yang, L, Pan, J, and Hu, D. Comparison of different diagnostic criteria for metabolic syndrome. J Hygiene Res. (2010) 39:302–5.
19. Adams, KJ, and Chirinos, JL. Prevalence of risk factors for metabolic syndrome and its components in community kitchen users in a district in Lima, Peru. Revista Peruana Med Experiment Salud Publica. (2018) 35:39–45. doi: 10.17843/rpmesp.2018.351.3598
20. Aguilar, M, Bhuket, T, Torres, S, Liu, B, and Wong, RJ. Prevalence of the metabolic syndrome in the United States, 2003-2012. JAMA. (2015) 313:1973–4. doi: 10.1001/jama.2015.4260
21. Li, Y, Gui, J, Zhang, X, Wang, Y, Mei, Y, Yang, X, et al. Predicting hypertension by obesity- and lipid-related indices in mid-aged and elderly Chinese: a nationwide cohort study from the China health and retirement longitudinal study. BMC Cardiovasc Disord. (2023) 23:201. doi: 10.1186/s12872-023-03232-9
22. Li, C, Liu, T, Sun, W, Wu, L, and Zou, ZY. Prevalence and risk factors of arthritis in a middle-aged and older Chinese population: the China health and retirement longitudinal study. Rheumatology (Oxford). (2015) 54:697–706. doi: 10.1093/rheumatology/keu391
23. Liu, H, Yang, X, Guo, LL, Li, JL, Xu, G, Lei, Y, et al. Frailty and incident depressive symptoms during short- and long-term follow-up period in the middle-aged and elderly: findings from the Chinese Nationwide cohort study. Front Psych. (2022) 13:848849. doi: 10.3389/fpsyt.2022.848849
24. Zhang, L, Li, JL, Guo, LL, Li, H, Li, D, and Xu, G. The interaction between serum uric acid and triglycerides level on blood pressure in middle-aged and elderly individuals in China: result from a large national cohort study. BMC Cardiovasc Disord. (2020) 20:174. doi: 10.1186/s12872-020-01468-3
25. Li, Y, Gui, J, Liu, H, Guo, LL, Li, J, Lei, Y, et al. Predicting metabolic syndrome by obesity- and lipid-related indices in mid-aged and elderly Chinese: a population-based cross-sectional study. Front Endocrinol. (2023) 14:1201132. doi: 10.3389/fendo.2023.1201132
26. Zhou, BF. Predictive values of body mass index and waist circumference for risk factors of certain related diseases in Chinese adults--study on optimal cut-off points of body mass index and waist circumference in Chinese adults. Biomed Environment Sci. (2002) 15:83–96.
27. Lee, JJ, Ahn, J, Hwang, J, Han, SW, Lee, KN, Kim, JB, et al. Relationship between uric acid and blood pressure in different age groups. Clin Hypertension. (2015) 21:14. doi: 10.1186/s40885-015-0022-9
28. Zhou, BF. Effect of body mass index on all-cause mortality and incidence of cardiovascular diseases--report for meta-analysis of prospective studies open optimal cut-off points of body mass index in Chinese adults. Biomed Environment Sci. (2002) 15:245–52.
29. Kerner, W, and Brückel, J. Definition, classification and diagnosis of diabetes mellitus. Experiment Clin Endocrinol Diabetes. (2014) 122:384–6. doi: 10.1055/s-0034-1366278
30. Haverinen, E, Paalanen, L, Palmieri, L, Padron-Monedero, A, Noguer-Zambrano, I, Sarmiento Suárez, R, et al. Comparison of metabolic syndrome prevalence using four different definitions - a population-based study in Finland. Archives Public Health. (2021) 79:231. doi: 10.1186/s13690-021-00749-3
31. De Luis, DA, Lopez Mongil, R, Gonzalez Sagrado, M, Lopez Trigo, JA, Mora, PF, and Castrodeza, SJ. Prevalence of metabolic syndrome with international diabetes federation criteria and ATP III program in patients 65 years of age or older. J Nutr Health Aging. (2010) 14:400–4. doi: 10.1007/s12603-010-0087-9
32. Ramachandran, A, Snehalatha, C, Satyavani, K, Sivasankari, S, and Vijay, V. Metabolic syndrome in urban Asian Indian adults--a population study using modified ATP III criteria. Diabetes Res Clin Pract. (2003) 60:199–204. doi: 10.1016/s0168-8227(03)00060-3
33. McEvoy, LK, Laughlin, GA, Barrett-Connor, E, Bergstrom, J, Kritz-Silverstein, D, Der-Martirosian, C, et al. Metabolic syndrome and 16-year cognitive decline in community-dwelling older adults. Ann Epidemiol. (2012) 22:310–7. doi: 10.1016/j.annepidem.2011.12.003
34. Sun, F, Tao, QS, and Zhan, SY. Comparison of five different diagnostic criteria on metabolic syndrome applied during physical check-up programs among population aged 35-74, in Taiwan. Zhonghua Liu Xing Bing Xue Za Zhi. (2008) 29:925–9.
35. Vanlancker, T, Schaubroeck, E, Vyncke, K, Cadenas-Sanchez, C, Breidenassel, C, González-Gross, M, et al. Comparison of definitions for the metabolic syndrome in adolescents. The HELENA study. Eur J Pediatr. (2017) 176:241–52. doi: 10.1007/s00431-016-2831-6
36. Echevarria-Castro, N, Silva-Parra, K, Polar-Trinidad, M, Sánchez-Vicente, JC, Salinas-Sedo, G, and Toro-Huamanchumo, CJ. Concordance between different criteria for metabolic syndrome in peruvian adults undergoing bariatric surgery. J Clin Med. (2022) 11:4692. doi: 10.3390/jcm11164692
37. Li, Y, Zhao, L, Yu, D, Wang, Z, and Ding, G. Metabolic syndrome prevalence and its risk factors among adults in China: a nationally representative cross-sectional study. PLoS One. (2018) 13:e0199293. doi: 10.1371/journal.pone.0199293
38. Liu, B, Chen, G, Zhao, R, Huang, D, and Tao, L. Temporal trends in the prevalence of metabolic syndrome among middle-aged and elderly adults from 2011 to 2015 in China: the China health and retirement longitudinal study (CHARLS). BMC Public Health. (2021) 21:1045. doi: 10.1186/s12889-021-11042-x
39. Liu, Q, Li, YX, Hu, ZH, Jiang, XY, Li, SJ, and Wang, XF. Comparing associations of different metabolic syndrome definitions with ischemic stroke in Chinese elderly population. Eur J Intern Med. (2018) 47:75–81. doi: 10.1016/j.ejim.2017.10.010
40. Cheng, L, Yan, W, Zhu, L, Chen, Y, Liu, J, Xu, Y, et al. Comparative analysis of IDF, ATPIII and CDS in the diagnosis of metabolic syndrome among adult inhabitants in Jiangxi Province, China. PLoS One. (2017) 12:e0189046. doi: 10.1371/journal.pone.0189046
41. Fei, YF, Wang, C, Liu, GJ, Gao, Y, Chen, T, Tian, HM, et al. Comparison of different diagnostic criteria for metabolic syndrome in Sichuan population. J Hyg Res. (2010) 39:302. doi: 10.3724/SP.J.1231.2010.06768
42. Patni, R, and Mahajan, A. The metabolic syndrome and menopause. J Mid-Life Health. (2018) 9:111–2. doi: 10.4103/0976-7800.241951
43. Wu, LT, Shen, YF, Hu, L, Zhang, MY, and Lai, XY. Prevalence and associated factors of metabolic syndrome in adults: a population-based epidemiological survey in Jiangxi province, China. BMC Public Health. (2020) 20:133. doi: 10.1186/s12889-020-8207-x
44. Zamboni, M, Mazzali, G, Zoico, E, Harris, TB, Meigs, JB, Di Francesco, V, et al. Health consequences of obesity in the elderly: a review of four unresolved questions. Int J Obes. (2005) 29:1011–29. doi: 10.1038/sj.ijo.0803005
45. Yang, JJ, Yoon, HS, Lee, SA, Choi, JY, Song, M, Han, S, et al. Metabolic syndrome and sex-specific socio-economic disparities in childhood and adulthood: the Korea National Health and nutrition examination surveys. Diabetic Med. (2014) 31:1399–409. doi: 10.1111/dme.12525
46. Yu, S, Yang, H, Guo, X, Zhang, X, Zhou, Y, Ou, Q, et al. Prevalence of hyperuricemia and its correlates in rural northeast Chinese population: from lifestyle risk factors to metabolic comorbidities. Clin Rheumatol. (2016) 35:1207–15. doi: 10.1007/s10067-015-3051-6
47. Winsløw, UC, Rode, L, and Nordestgaard, BG. High tobacco consumption lowers body weight: a Mendelian randomization study of the Copenhagen general population study. Int J Epidemiol. (2015) 44:540–50. doi: 10.1093/ije/dyu276
Keywords: metabolic syndrome, prevalence, characteristics, China, retrospective study
Citation: Ma K, Liu H, Guo L, Li J, Lei Y, Li X, Sun L, Yang L, Yuan T, Wang C, Zhang D, Li J, Liu M, Hua Y and Zhang L (2024) Comparison of metabolic syndrome prevalence and characteristics using five different definitions in China: a population-based retrospective study. Front. Public Health. 12:1333910. doi: 10.3389/fpubh.2024.1333910
Edited by:
Aleksandra Klisic, Primary Health Care Centre Podgorica, MontenegroReviewed by:
Wenke Cheng, Leipzig University, GermanySueziani Binte Zainudin, Sengkang General Hospital, Singapore
Copyright © 2024 Ma, Liu, Guo, Li, Lei, Li, Sun, Yang, Yuan, Wang, Zhang, Li, Liu, Hua and Zhang. This is an open-access article distributed under the terms of the Creative Commons Attribution License (CC BY). The use, distribution or reproduction in other forums is permitted, provided the original author(s) and the copyright owner(s) are credited and that the original publication in this journal is cited, in accordance with accepted academic practice. No use, distribution or reproduction is permitted which does not comply with these terms.
*Correspondence: Lin Zhang, eWFvcmFuMjAwOEAxNjMuY29t