 Zijing Ding1
 Chen Li
- 1School of Economic and Management, Wuhan University, Wuhan, China
- 2School of Management, Shanghai University of Engineering Science, Shanghai, China
The high-quality development of the healthcare industry is of great significance for improving people’s health and promoting the construction of a harmonious society. This paper focuses on the relationship between the development of China’s digital economy and the high-quality development of the healthcare industry. Based on the panel data of 30 provinces in China from 2011 to 2020, this paper empirically studies whether the development of the digital economy promotes the high-quality development of the healthcare industry. This study finds that the development of digital economy has significantly promoted the high-quality development of the medical and health industry. The results of this study are still valid after a series of robustness tests including variable substitution, sample adjustment, and endogenous problem mitigation. Heterogeneity analysis shows that the effect of this policy is more significant in the eastern region and southern areas. The results of spatial econometric analysis show that the development of digital economy has obvious spatial spillover effect. The research in this paper can provide reference for developing countries to enhance the development level of digital health industry and improve people’s lives.
1 Introduction
The outbreak of COVID-19 in 2020 has greatly affected the safety of people’s lives and property around the world (1–3). In the face of numerous public health emergencies and global population aging trend, the establishment and improvement of medical care system is of great significance and key role for economic growth. On the other hand, the digital wave is sweeping the world (4, 5). With information technology as the core and mobile payment, 5G, cloud computing, and other representatives of the new generation of digital economy (DE), it is reshaping the industrial structure and production mode (6–8), profoundly changing the comparative advantage between countries, and then affecting the global economic and geographical pattern (9).
China is the most populous country in the world, and the aging of the population is obvious. According to the seventh census released by the government of China, the older adult population in China accounts for 13.5 percent of the total, and the older adult dependency ratio is close to 20 percent (10). In the context of high demand for healthcare, the rapidly expanding market demand for healthcare calls for the development of a higher level of healthcare industry, and new opportunities have been ushered in for the development of healthcare industry (11–14). Especially at the dawn of the DE, how the healthcare industry can better apply information technology to the industrial growth, and then promote the high-quality development of the healthcare industry (HDHI). How the development of the DE promotes the transformation and upgrading of the healthcare industry and summarizes the characteristic facts and general laws are the important premise and basis for achieving HDHI.
Previous studies have posited that the integration of technology and healthcare has the potential to enhance the healthcare sector and offer improved and superior services (15). Digital technology has the potential to enhance customer service by leveraging extensive data to better comprehend individual needs and provide tailored experiences (16). Additionally, digital technology’s capacity to disseminate information across temporal and spatial boundaries can serve as a means to reduce social isolation among service recipients, thereby enhancing social integration for marginalized populations (17). The progress in information technology has significant prospects for the healthcare sector, although it also entails certain possible challenges that warrant careful consideration. The field of information technology exhibits a significant level of novelty, necessitating a particular level of group learning ability in order to efficiently acquire mastery. Nevertheless, it is important to acknowledge that the implementation of such measures may result in a “digital divide” phenomenon, particularly impacting certain demographics such as the older adult (18). The progress of the digital health sector is contingent upon the utilization of extensive data for informed decision-making. However, this reliance on data presents a significant obstacle to safeguarding personal privacy and ensuring the security of data assets, particularly within the healthcare domain (19, 20).
Compared to the high quality development-related research that has been published (21–23), this paper argues that high-quality development of healthcare industry (HDHI) has multi-dimensional characteristics. The HDHI is driven by the government and the market, taking innovation, coordination, green, open, and share as the development goals, and aiming at the resources allocation of the healthcare industry. Different from previous studies, this study mainly focuses on the relationship between DE and the HDHI, that is, whether the DE promotes or inhibits HDHI. We further explored the heterogeneous effects that different levels of DE development and geographical locations may have on the HDHI. Due to the possible spatial spillover effect of the development of DE, we further explore this spatial linkage relationship from the perspective of spatial econometrics.
The present study primarily investigates the following three facets. First, the HDHI in China was thoroughly assessed, and the index system was built using four dimensions: medical service, drug service, technical service, and upgrade service. Subsequently, an econometric model is built to determine the correlation between the DE and HDHI. Thirdly, the spatial econometric model is utilized to discover and validate the spatial spillover effect of the development of DE on the HDHI.
2 Methods
2.1 Benchmark regression model
On the basis of previous research (9), we construct the following econometric model (1) to identify the relationship between DE and HDHI:
HDHI represents high-quality development of the healthcare industry. DE represents the level of DE development. X is a set of control variables. α is the estimated coefficient, and the coefficient we are most concerned about in this paper is α1. provincei represents the fixed effect of the province, yeart represents the fixed effect of the year, and ε is the random disturbance term.
2.2 Quantile regression model
In order to explore the possible differential impact of different levels of DE development on HDHI, we built a quantile regression model in the following form:
In model (2), is the dependent variable, representing the HDHI at different quantile levels. represent the explanatory variables at different quantile levels. Where, is the quantile regression coefficient which we are concerned about.
2.3 Spatial Durbin model
There is a spatial correlation and clustering relationship between the DE and the HDHI. According to existing research (24–27), this paper uses the global Moran index to measure this degree of focus and correlation, so as to reflect its overall characteristics.
In formula (3), is the variance of the sample, which is used to represent the degree of dispersion of the sample. represents a two-dimensional element of a space vector matrix (i, j). When the index is greater than 0, it indicates that there is a positive spatial correlation between provinces. When the index is less than 0, it indicates that there is a negative spatial correlation between provinces. When the index is 0, there is no spatial correlation.
On this basis, the paper further constructs a spatial Durbin model to identify the spatial correlation between the DE and the HDHI formula (4).
is the space vector weight matrix. is the spatial autocorrelation coefficient of the explained variable. , spatial Durbin model degenerates into spatial lag model (SAR). , spatial Durbin model degenerates into spatial error model (SEM).
3 Data sources
3.1 Dependent variable: high-quality development of the healthcare industry
In the measurement of the HDHI, we have carried out measurement from four aspects, including medical service, drug service, technical service, and upgrade service. In this index system, a total of 12 indicators are selected for measurement, in order to reflect the HDHI in China. Since this paper chooses a multi-index measurement method, it is necessary to measure the comprehensive level. Therefore, this paper adopts entropy weight method to synthesize the indicators in the index system (Table 1).
The use of entropy weight method first needs to judge the attribute of the index, that is, whether the index is positive or negative. Secondly, standardize the index. Thirdly, the weight of the whole index system is obtained. Finally, the comprehensive score of the index is obtained by multiplying the standardized index value and the calculated index weight. For the specific calculation steps of entropy weight method, see formula (5)–(7).
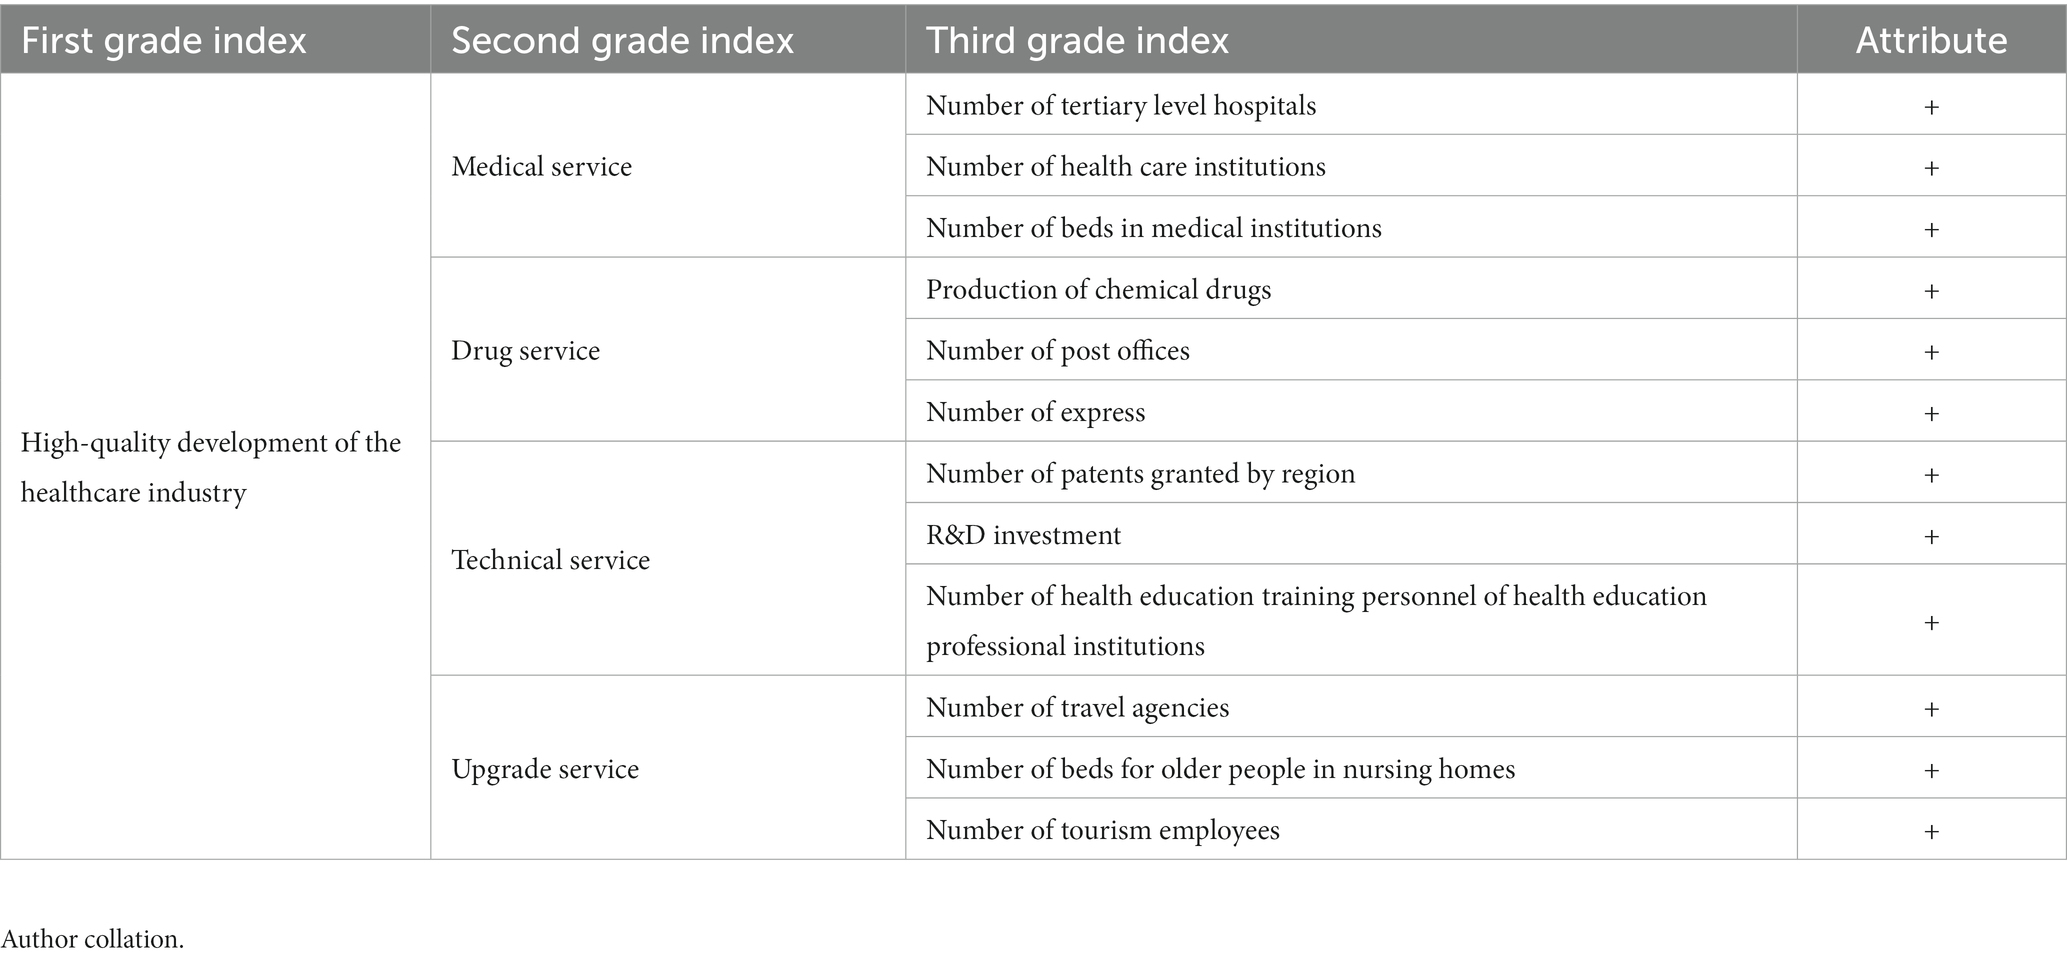
Table 1. Evaluation index system of high-quality development of the healthcare industry.
3.2 Independent variable: digital economy
The independent variable is each province’s DE in China. The development of DE has always been centered on the internet, an essential carrier (28), and has a profound impact on economic growth in China. In the indicators of DE constructed in this paper, we focus on the two dimensions of internet development and digital transactions. According to existing studies (29), we select four indicators: the number of internet access users, the proportion of computer service and software employees in urban units, telecommunications traffic per capita, and the number of mobile phones among 100 people. Moreover, considering that digital transactions are booming in the era of DE, digital financial inclusion has become an important driving force for the development of DE (30). Therefore, the index of digital financial inclusion is added to the research. The above data are all from the statistical yearbook of China’s provinces. The digital financial inclusion comes from the Digital inclusive Finance Development index compiled by the Digital Finance Research Center of Peking University and Ant Financial Services Group1 (31). Through principal component analysis (PCA), the indexes were standardized and dimensionality reduced to obtain each province’s DE development level.
3.3 Control variables
Gross Domestic Product (GDP): GDP is one of the most representative indicators of economic growth. China’s huge economic scale is the basis for HDHI (32). Openness (OPEN): we use foreign direct investment to measure regional openness. Number of patents granted (PAT): technological innovation is an essential driving force to optimize industrial structure and promote economic development. HDHI cannot be separated from the technical support. Population size (POP): the number of permanent residents in each province; we also control the quadratic term of population size (POP2) to capture the nonlinear relationship. Urbanization (URB): the ratio of urban population to total population is measured in this paper. Table 2 shows descriptive statistics of variables.
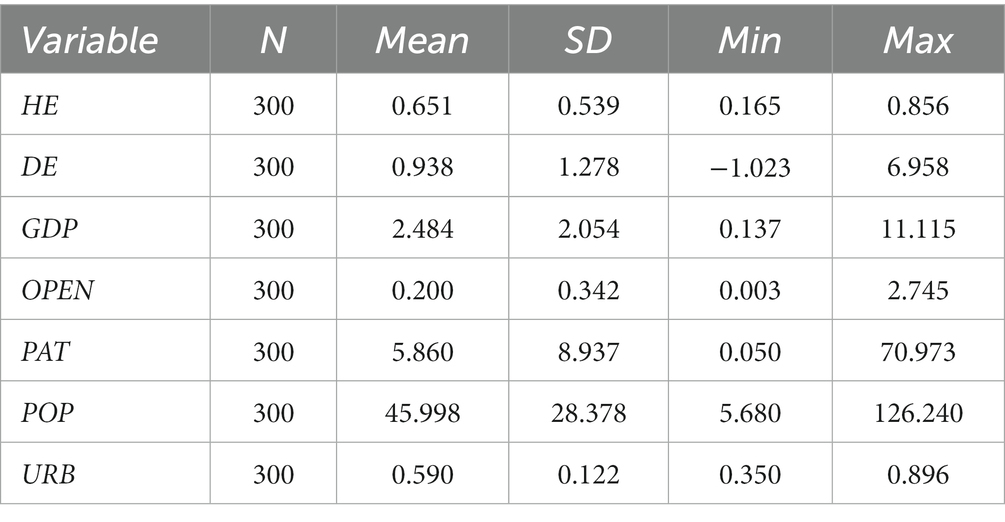
Table 2. Descriptive statistics of variables.
The research data in this paper come from China’s national statistical data, including China Statistical Yearbook, statistical yearbook, and statistical bulletin issued by Chinese provinces, China Health and Family Planning Statistical Yearbook, China Culture and Tourism Statistical Yearbook, etc. When there are missing values in the panel data we construct, we supplement the missing data with interpolation method to ensure that the panel data we construct is a balanced one. Due to the limitation of research data, the research period of this paper is selected from 2011 to 2020. The research region covers 30 provinces (autonomous regions and municipalities directly under the Central Government) in China, among which Tibet, Hong Kong Special Administrative Region, Macao Special Administrative Region, and Taiwan Province were not included in the study sample due to lack of data (Figure 1).
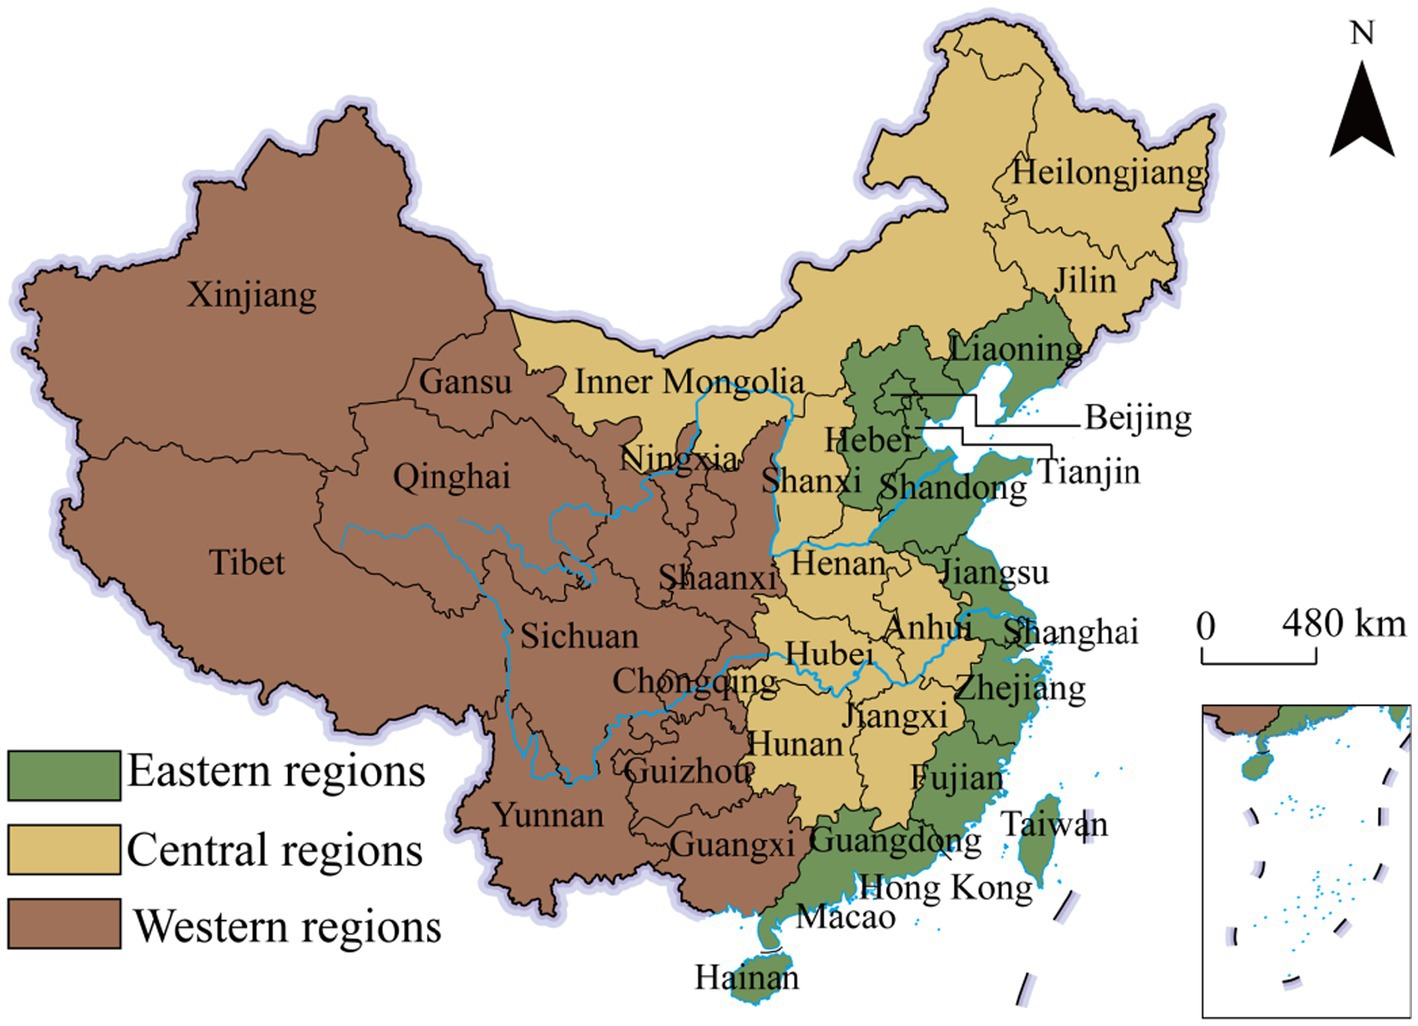
Figure 1. Study areas.
4 Empirical results
4.1 Baseline regression analysis
This part is based on the econometric model (1) set above (Section 2.1), and Stata 17.0 software is used to calculate and analyze the data. In the baseline regression of Table 3, column (1) is listed as the regression result only included two-way fixed effect (province fixed effect and year fixed effect). Based on the regression results, we find a significant positive relationship between DE and HDHI. We include all the control variables and no longer control the fixed effect in column (2). We find that the regression result still has a significant positive relationship. Based on column (2), we add the fixed effect of the year in column (3) and the fixed effect of the province in column (4), and the result remains robust. We include all control variables and fixed effects and adopt more rigorous robust standard error statistics in column (5). The results are still positive and significant, indicating that DE significantly positively affects HDHI.
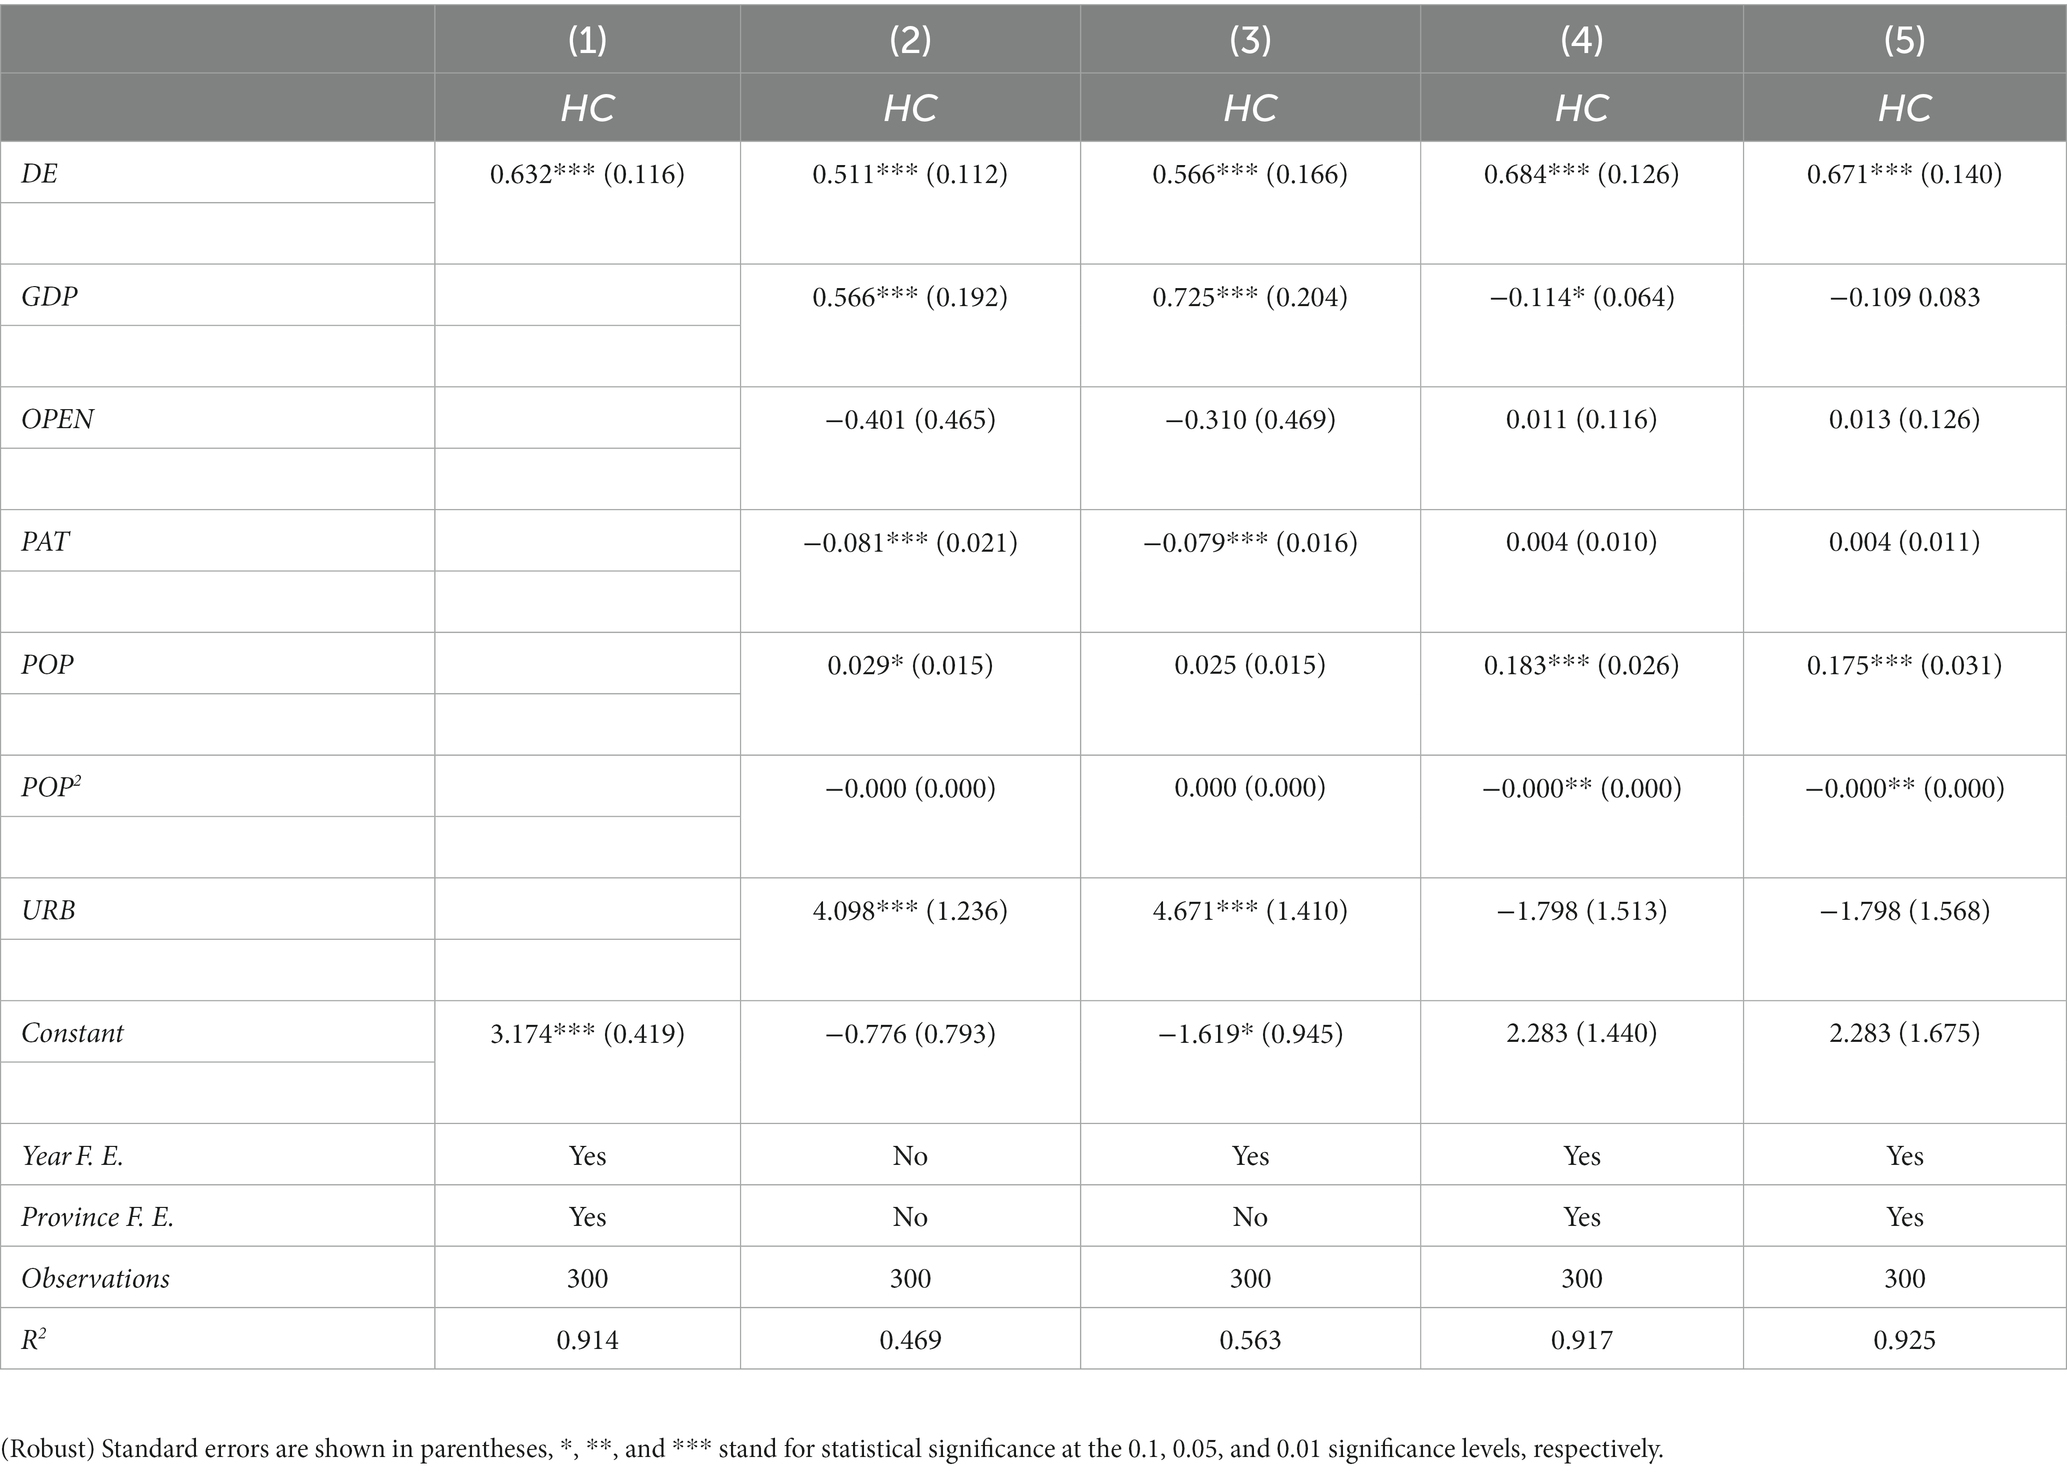
Table 3. Baseline regression results.
4.2 Robustness test
4.2.1 Robustness test I: replace independent variables
The principal component analysis is used to construct the index system for independent variables in baseline regression. In order to avoid the interference of weight on the results, we weighted the indicators in the benchmark regression by a new weight calculation method to obtain the development level of DE calculated based on different methods in this section. We combine the analytic Hierarchy Process (AHP), entropy weight method (EVM), and least squares decision (LSD) model to control further the randomness and inaccuracy of index weight calculation (33). The weight calculation method can control the deviation of weight calculation in a minimum range (34). The specific calculation method is as follows formula (8).
where subjective weight vector v = (v1, v2,…, vn)T, objective weight vector u = (u1, u2,…, un)T, integrated weight vector w = (w1, w2,…, wn)T, , wi ≥ 0 (i = 1,2,…,n).
In Table 4, column (1) lists the development level of DE obtained by changing the weight calculation method. The relationship between DE and HDHI is still positively significant. This indicates that the weight calculation method does not affect the conclusion of baseline regression.
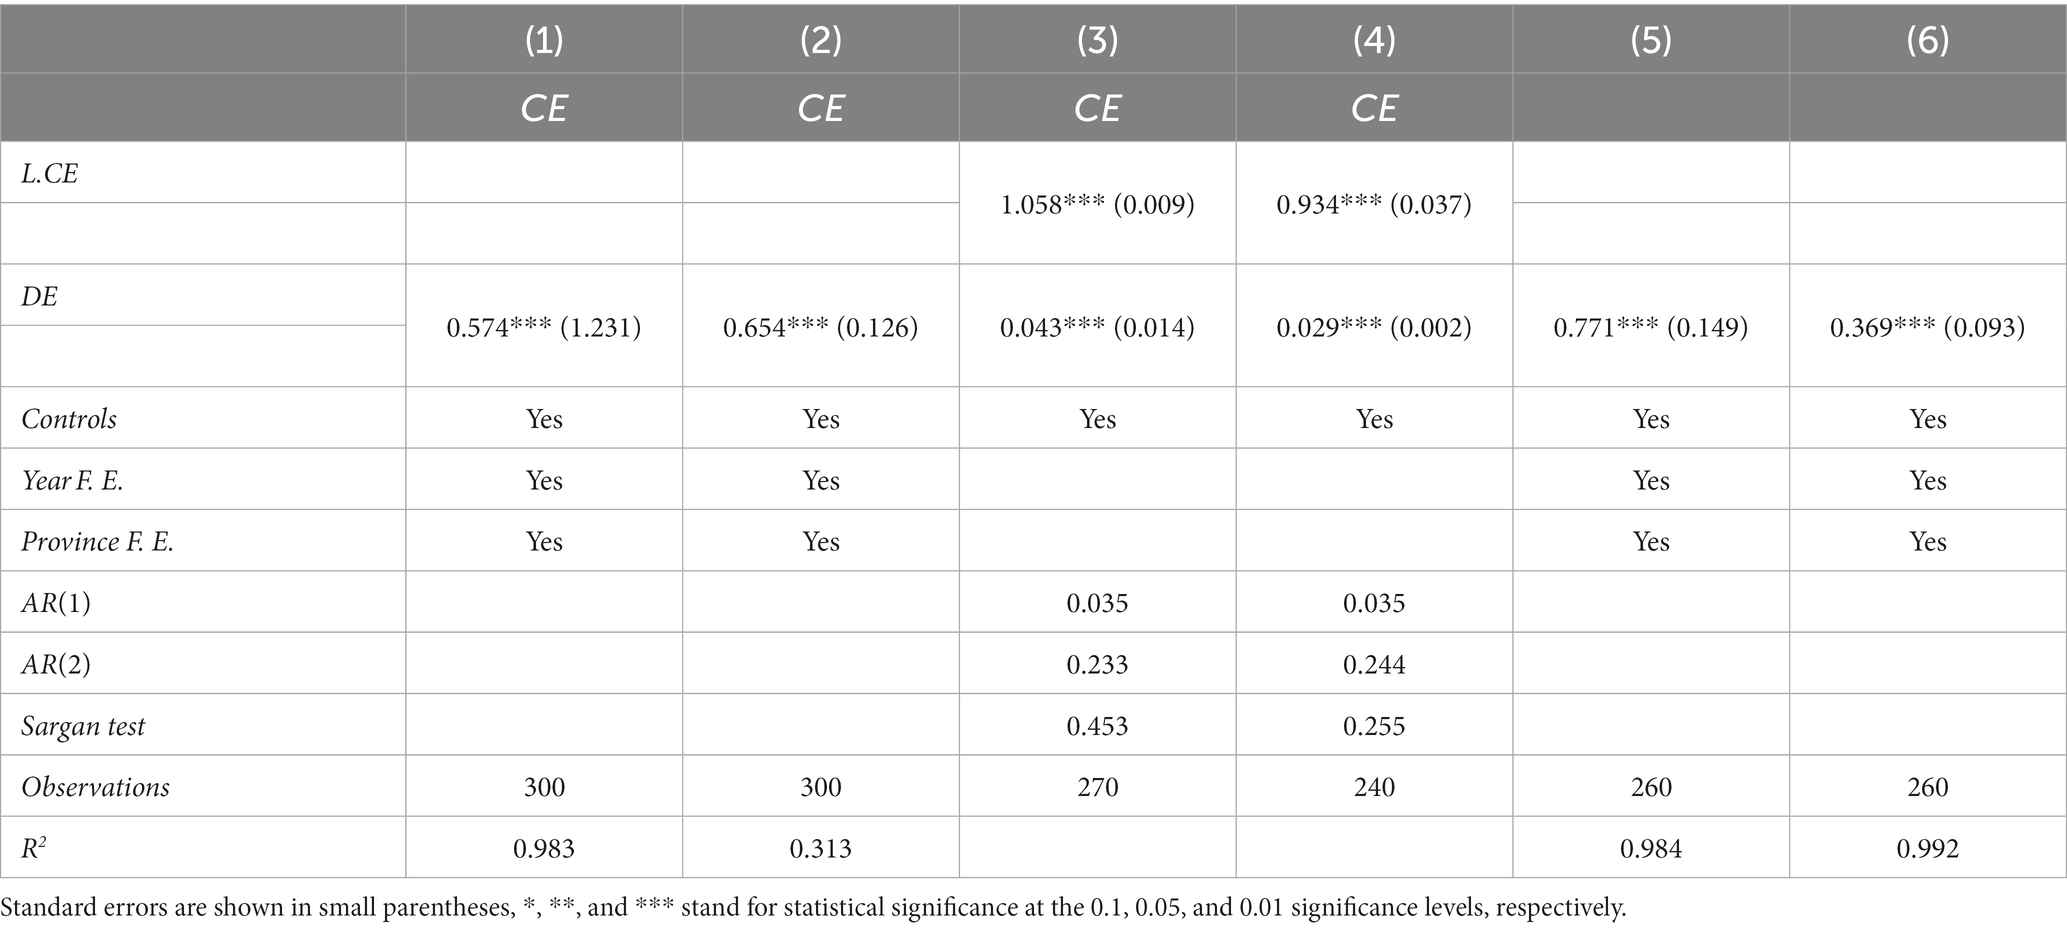
Table 4. Robustness test.
4.2.2 Robustness test II: change different estimation methods
In the previous article, ordinary least square (OLS) method tests the relationship between DE and HDHI. Although the OLS method has advantages (e.g., simple calculation principle, convenient calculation, and fast computing speed), it is also subject to the interference of many problems (e.g., endogeneity, heteroskedasticity). Therefore, we replace the estimation method used in the baseline regression analysis and use the First-order Differential Generalized Method of Moments (GMM) and System Differential GMM for the robustness test. We use the least square dummy variable method (LSDV) to control the fixed effects in baseline regression. We choose the intra-group transformation method to control the fixed effects of province and year. The estimated results are reported in column (2) of Table 4. Moreover, First-order Differential GMM and System Differential GMM are adopted for estimation (35). The regression results are reported, respectively, in columns (3) and (4) of Table 4, which show that the difference in estimation methods does not lead to the change in baseline results.
4.2.3 Robustness test III: subsample regression test
In order to avoid the effects that special samples have on the regression results, we remove special provinces (municipalities directly administered by the Central government and ethnic minority regions) from the database. This is because municipalities directly administered by the central government of China have more policy support, while Chinese ethnic minorities inhabit autonomous regions. In order to support the development of ethnic minority regions, the central government of China adopts specific supportive policies. Although municipalities and autonomous regions are at the same administrative level as provinces, they differ regarding development mode and policy support. This could interfere with the research results of this paper. Therefore, we refer to existing studies (36), excluded the samples of Beijing, Shanghai, Tianjin, and Chongqing, and excluded the samples of Xinjiang, Ningxia, Inner Mongolia, and Guangxi autonomous regions, respectively. The regression results are reported in columns (5) and (6) of Table 4.
4.2.4 Robustness test VI: instrumental variable estimation
In baseline regression, the results may be biased due to the omitted variable, which is challenging to observe or measure. Moreover, the regression model may have the problem of reverse causation. This is because the HDHI needs to rely on information, digitalization, and intelligence. Therefore, the HDHI will force the region to enhance the development of the DE. Therefore, we adopt instrumental variable to alleviate the endogenous problems.
There are two conditions (relevance and exclusion) for using instrumental variable. We choose the geographical distance from the capital city to Hangzhou as the instrumental variable. On the one hand, Hangzhou is the origin of China’s DE with a high level of development of DE (30), which gather many internet enterprises represented by Alibaba, NetEase, and Byte dance. The region near Hangzhou is more likely to be affected by the development of DE in Hangzhou, which satisfies the relevance of instrumental variable. On the other hand, geographical distance is an exogenous variable (37), which has no direct impact on HDHI. Geographical distance is the cross-section datasets, so fixed effects in the model absorb it. Therefore, we multiply it with the number of internet employees to get the interaction term as the instrumental variable. Moreover, we also report the estimated results of constructing interaction terms using spherical distance.
We find that the Anderson canon. Corr. LM statistics significantly reject the null hypothesis, showing that there is not insufficient identification, based on instrumental variable estimation findings shown in Table 5. An endogenous variable and an instrumental variable are correlated. The existence of weak instrumental variables is strongly rejected, and the Crag-Donald Wald F statistic is much greater than the Stock-Yogo weak ID test critical values. It is shown that the estimation contains no weak instrumental variables. The robustness of the baseline regression is demonstrated by the estimated results, which indicate a considerable beneficial influence of DE on HDHI.
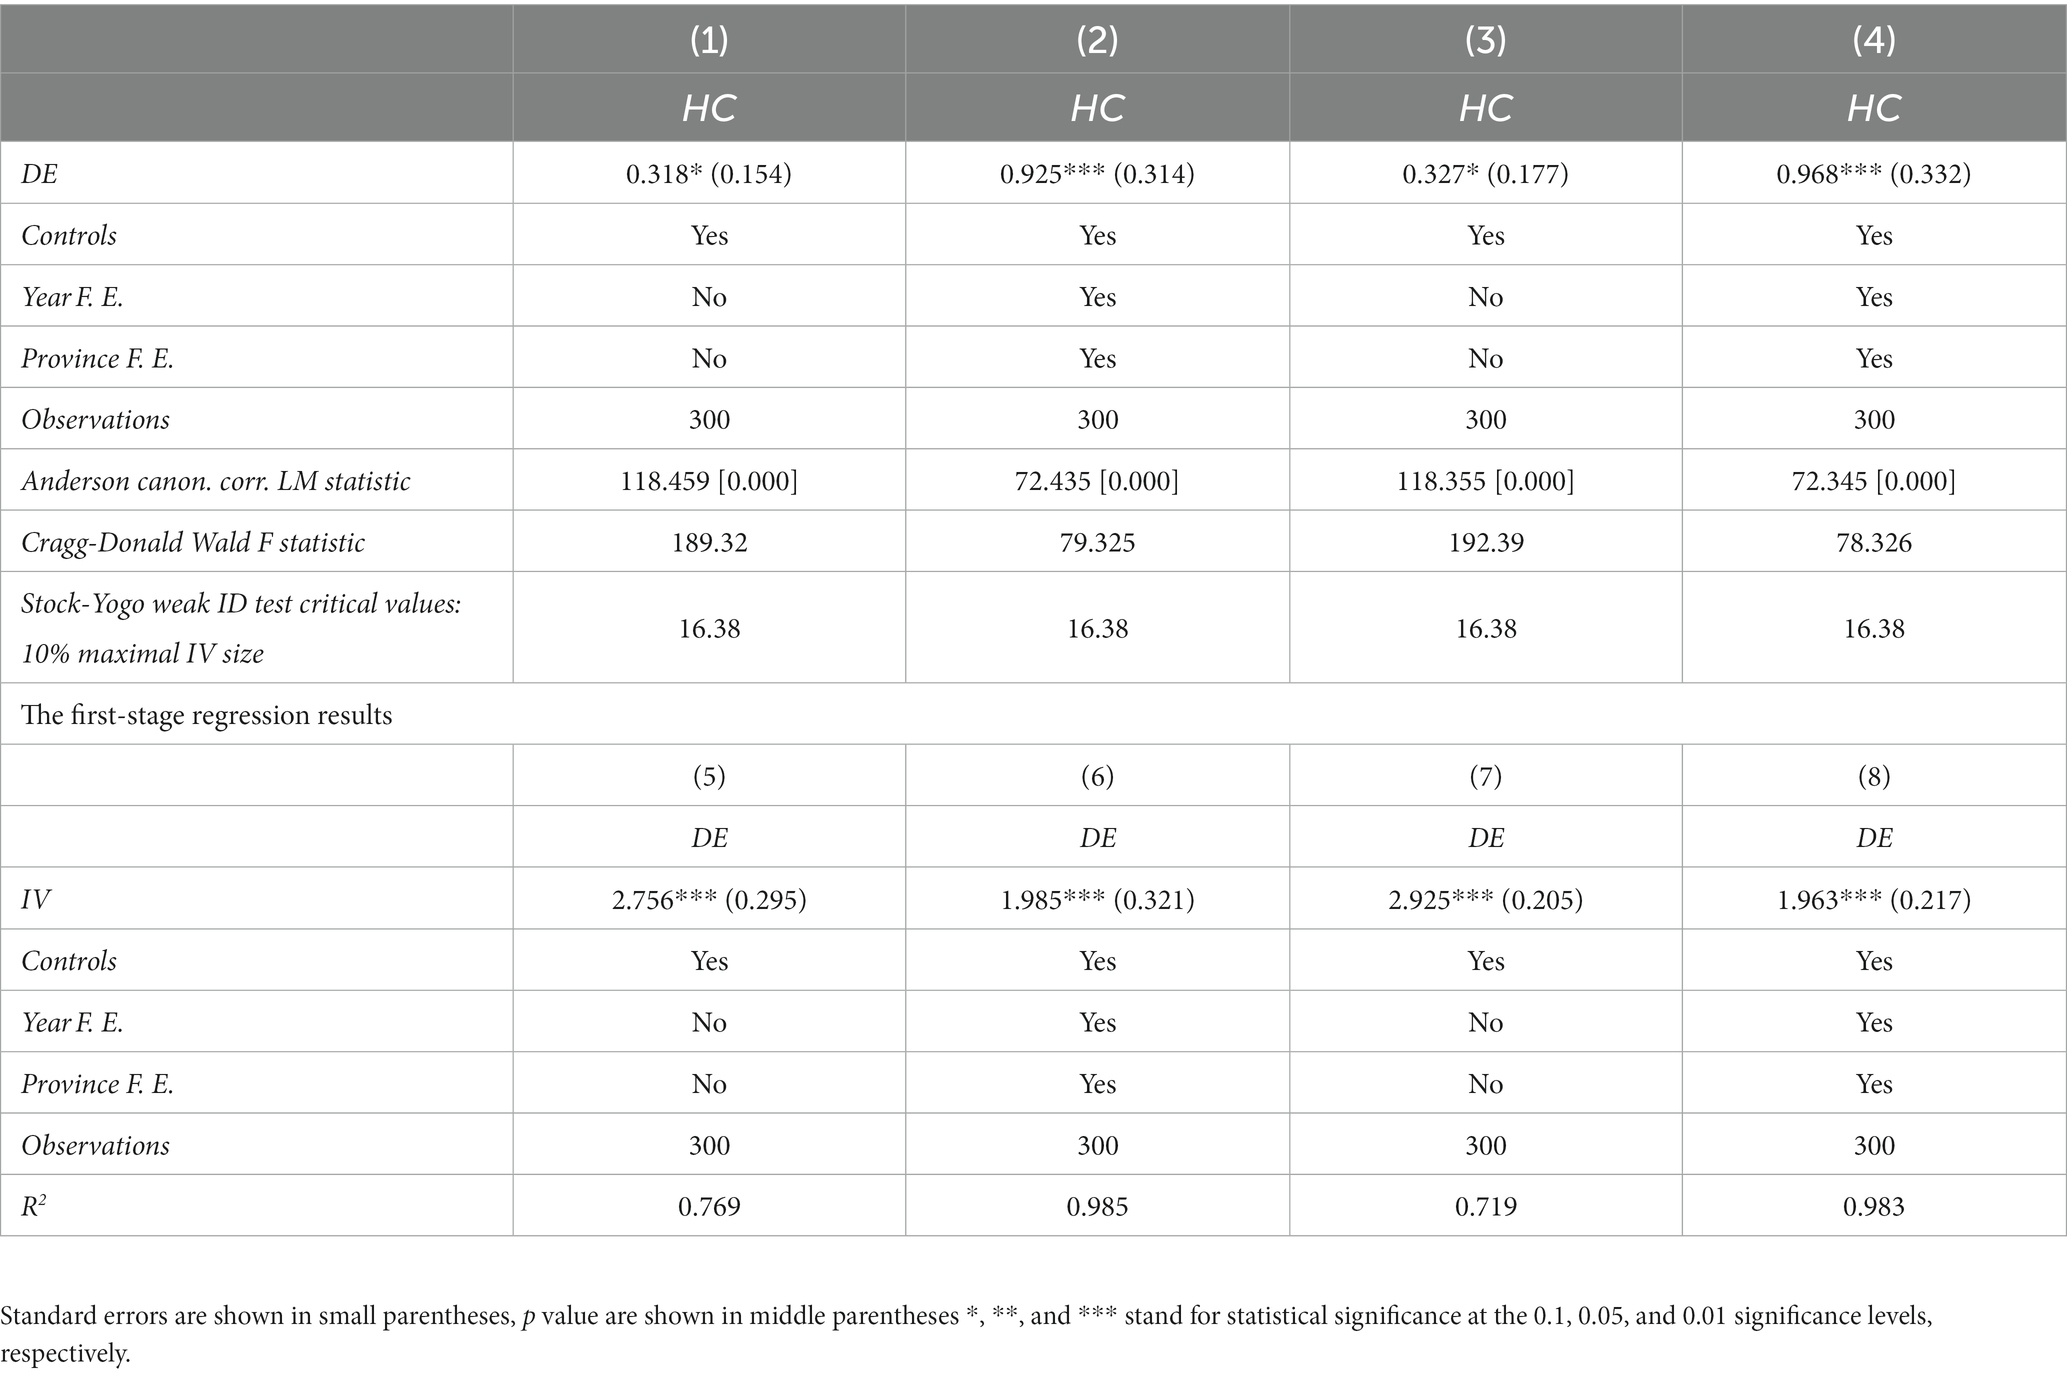
Table 5. Estimation results of instrumental variables.
4.3 Heterogeneity test
4.3.1 Heterogeneity of the development level of the digital economy
Geographical location can vary the identification results of causal effects (38–40). This part focuses on the differences in HDHI brought by different degrees of development of DE. We explore this heterogeneity based on the quantile regression model. The panel quantiles divide the data into five quantiles (5, 25, 50, 70, and 95th) to investigate the relationship between DE and HDHI. Based on the development level of DE heterogeneity’s estimation results in Table 6, we find that the positive effect of DE on HDHI is significantly below the 50-quantile level. The relationship between DE and HDHI above the 50-quantile level is positive but insignificant. The HDHI of the DE presents an inverted U-shaped trend of first increasing or decreasing below the 50-quartile level. The results provide exciting and unique policy implications.
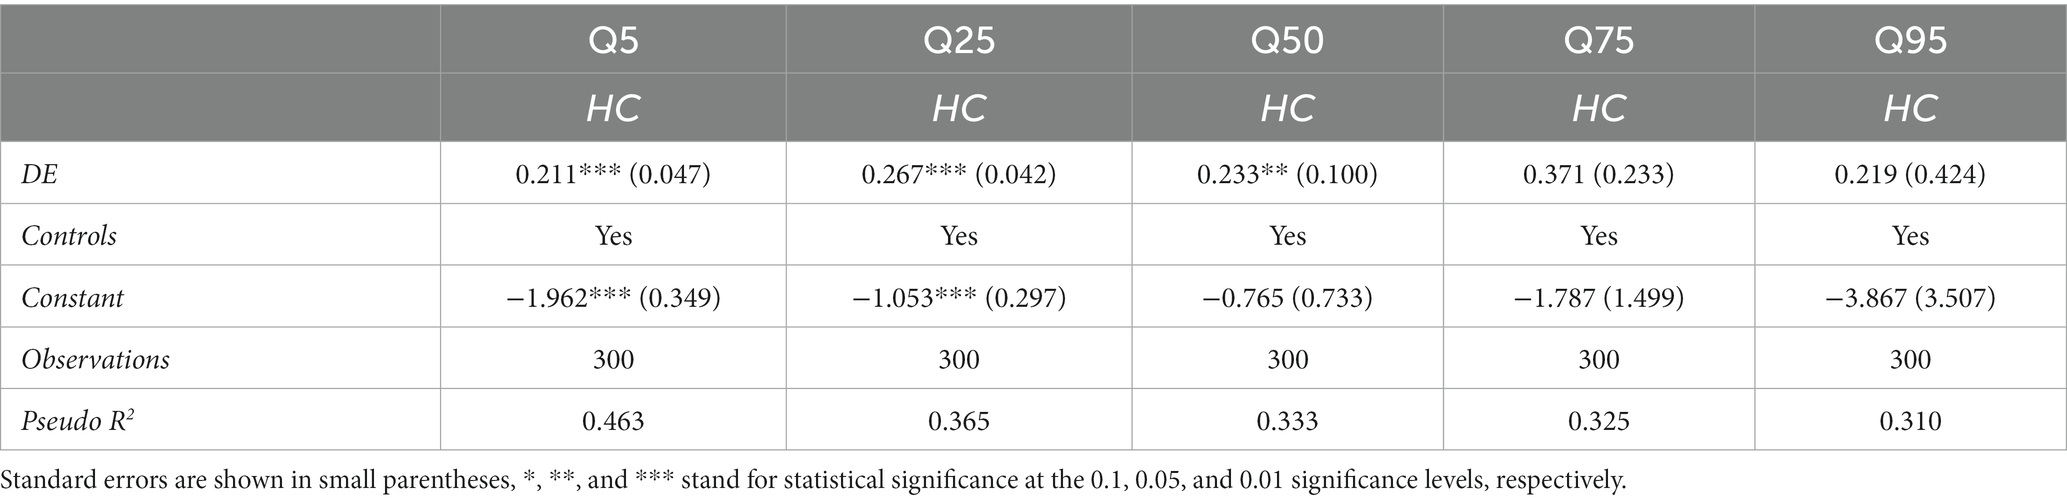
Table 6. Estimation results of heterogeneity of developmental level of digital economy.
4.3.2 Regional heterogeneity of provinces
China has a vast territory. Different regions have considerable differences in factor endowment, industrial institutions, and economic base (41–43). The impact of DE on HDHI may vary systematically depending on the development level and region of DE (44–46). First of all, we divide China’s geographical areas into two dimensions: east–west horizontal and north–south vertical. For relevant standards, (see 29). Based on the estimation results of the regional heterogeneity in Table 7, we find that the DE significantly promote HDHI in the eastern and central-western regions. However, the effect of the DE on the HDHI will be stronger in the eastern regions than in the central-western regions. Compared with the northern region, the DE has a significant impact on HDHI in the southern region. However, the DE has not had a significant impact on the HDHI in the northern region.
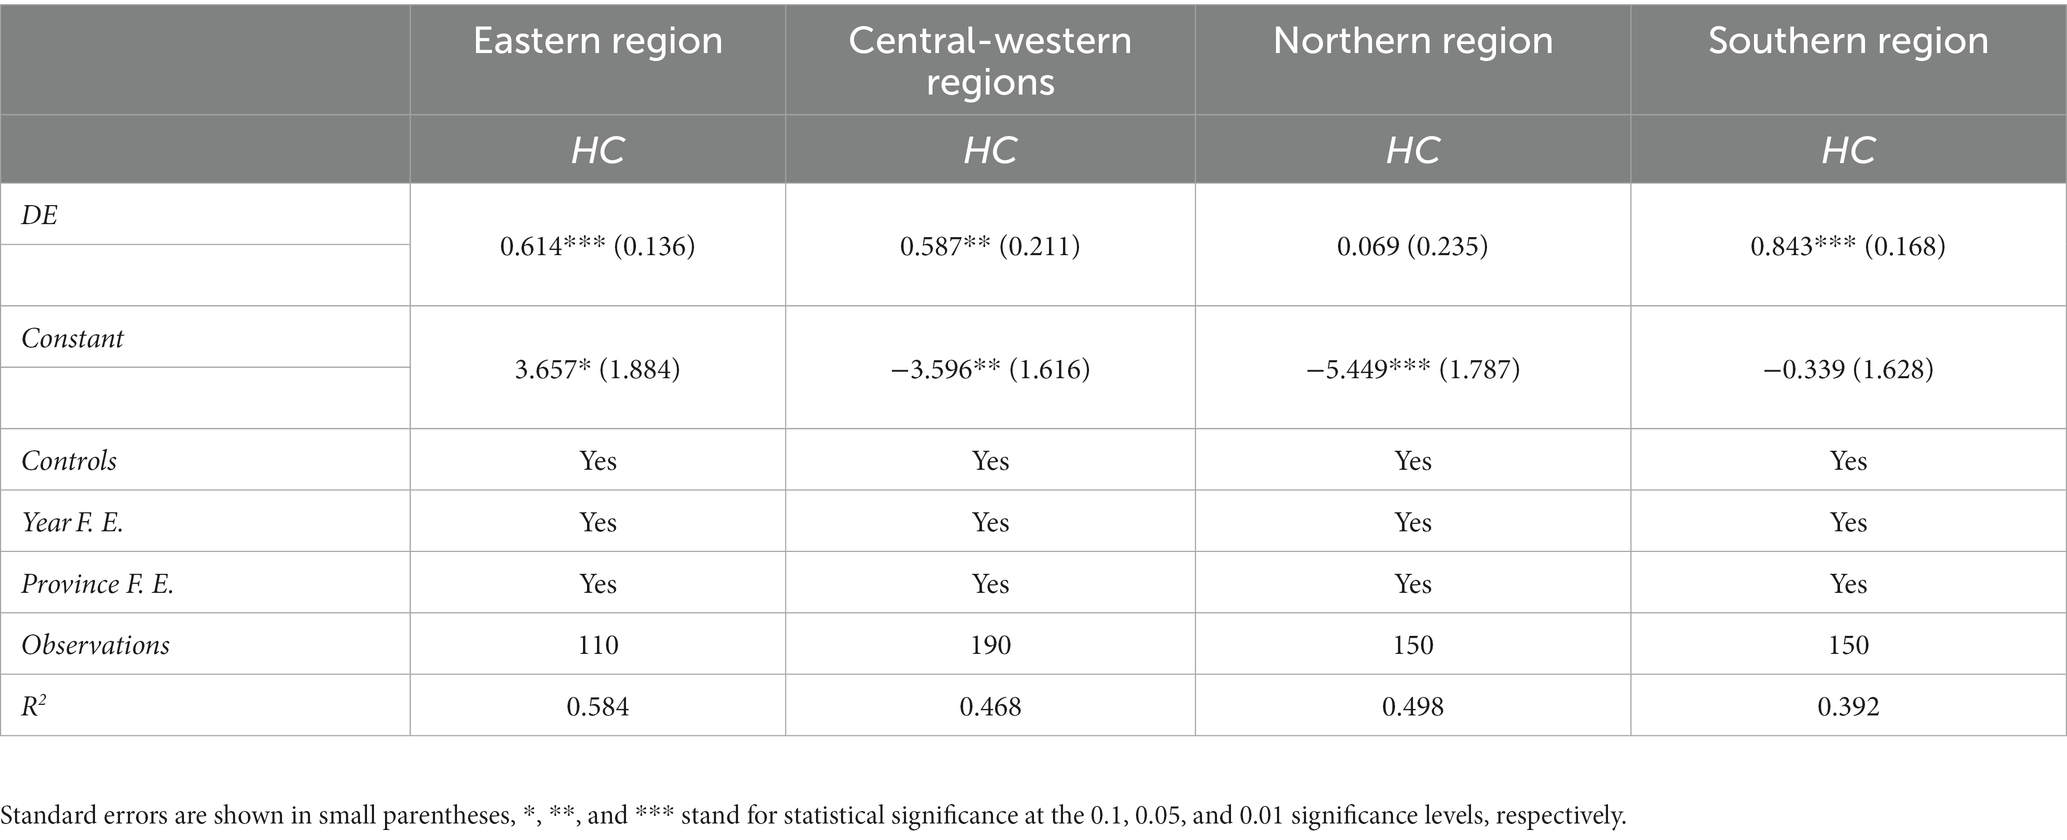
Table 7. Estimation results of regional heterogeneity of provinces.
4.4 Spatial econometric model analysis
4.4.1 Spatial autocorrelation test
Ignoring the spatial effects of each variable in the research may cause bias in the estimation results, so it is necessary to analyze the spatial correlation of each variable before setting the model. The global Moran’s I for the high-quality development of the DE and the health industry is significantly positive at the level of 1%, rejecting the null hypothesis that there is no spatial autocorrelation. The relevant estimates are presented in Table 8.
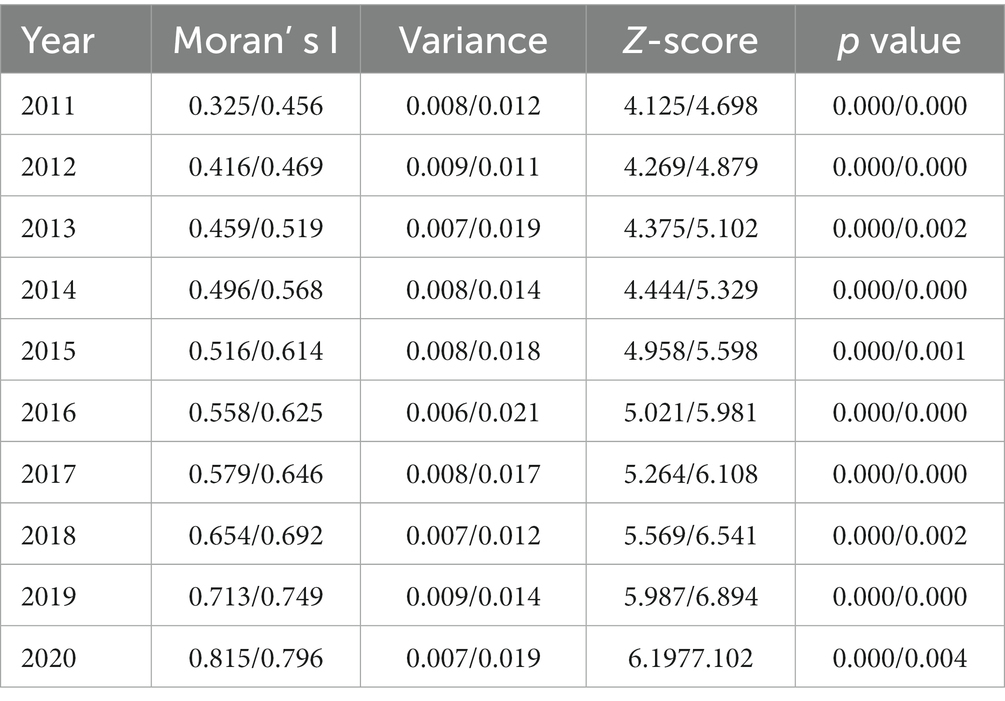
Table 8. Global Moran’s I of digital economy and high-quality development of the healthcare industry.
4.4.2 Spatial Durbin model
LM test was used to judge the model, and the LM statistic coefficients of SEM and Robust LM statistic coefficients were 6.215 and 11.065, respectively. The LM statistic coefficients of SAR and Robust LM statistic coefficients are 10.235 and 14.269, respectively, and the four variables are all significant at 1% confidence level. Therefore, the Spatial Durbin Model is required for spatial effect estimation.
The SAR, SEM, and SDM regression results are reported in Table 9. The regression results of SDM model show that the spatial spillover effect coefficient of DE on the HDHI is 0.612, which is statistically significant at 1% level. In the economic sense, it means that the healthcare industry has obvious agglomeration spillover effect in space, and the high-quality development of the local healthcare industry will drive the HDHI in the neighboring region. The estimated coefficient of W*DE is 0.597, which is statistically significant at 1% level. In an economic sense, for every 1% increase in the level of high-quality development of the local healthcare industry, the healthcare industry in the neighboring region will increase by 0.597%.
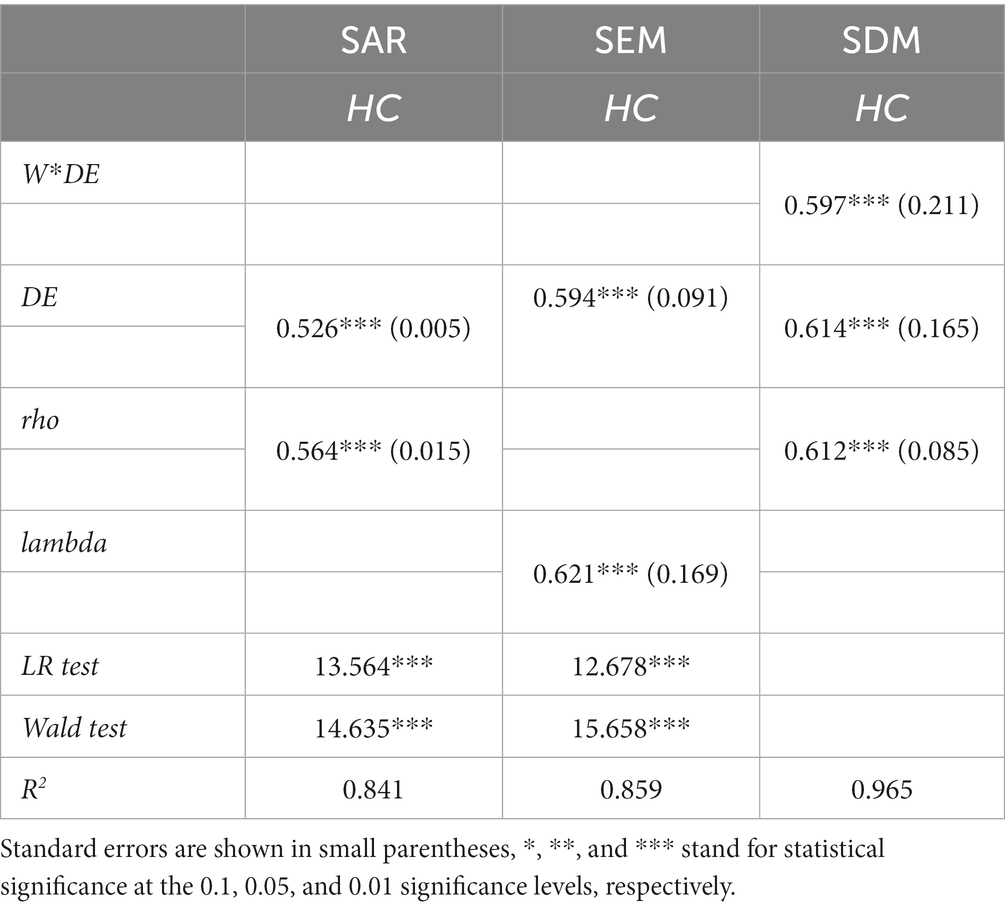
Table 9. Spatial spillover effect regression results.
4.4.3 Spatial spillover effect decomposition
Since the SDM model includes the spatial vector weight matrix, the feedback effect of the spatial lag term may be brought in the recognition, and the estimation results of the model cannot be accurately recognized. Therefore, in order to explain the estimation results of SDM model more scientifically and reasonably, partial differential method is used to calculate the total utility, direct effect, and indirect effect of each variable (47–49). According to the decomposition results, the estimated coefficients of total utility, direct effect, and indirect effect are 0927, 0.623, and 0.601, respectively, and are statistically significant at 1% level. This means that the development of the DE will significantly drive the HDHI in the overall region, the local region and the neighboring region.
5 Conclusion and policy implications
5.1 Conclusion
In the rapid development of DE, this paper focuses on the DE enabling HDHI. We empirically studied the relationship between DE and HDHI based on panel data from 30 Chinese provinces from 2011 to 2020. The main conclusions are as follows:
We find that DE significantly positively affects HDHI. This result is robust after a series of robustness tests (e.g., replace independent variables, change different estimation methods, and sub-sample regression test). The results also remain robust to overcome the endogenous problem.
Heterogeneity analysis shows that the impact of DE on the HDHI is only significant below the median. Regional heterogeneity analysis shows that the impact of DE on the HDHI is more significant in the eastern and southern regions.
The results of spatial econometric analysis show that the development of DE has a significant spatial spillover effect on the HDHI. The development of DE in this region will significantly promote the high-quality development level of healthcare industry in neighboring regions.
5.2 Policy implications
China should prioritize the advancement of coordinated and balanced development of DE across various regions, while also striving to reduce the digital divide that exists across these regions. China should strategically align the growth of DE between the eastern and central-western regions, as well as between the southern and northern regions. The Chinese government ought to actively encourage the development of digital infrastructure in underdeveloped regions and facilitate the widespread adoption of digitalization efforts across all regions.
China should prioritize the implementation of well-designed high-quality development plans and guidelines for the healthcare business, as well as for the growth of DE, in order to steer development in a scientifically planned manner. The implementation of classified policies, addressing the health care gap resulting from the development of the digital economy, providing targeted attention to various industrial actors, and establishing the operational mechanism and development model of the health care industry ecosystem in the context of digitalization are imperative.
5.3 Future research
This study uses the data at the provincial level of China, but we do not study at the global, national, prefecture, county, and household scales. We believe that we can find some interesting conclusions.
In this paper, reduced form estimation method is adopted. In the future, structural form estimation method can be considered to estimate the relationship between DE and HDHI, in order to get more scientific and reasonable conclusions.
This paper uses the index system method to measure DE. Some exogenous impacts can be considered. For example, China’s digital city construction and big data pilot zones will provide us with quasi-natural experiments.
Data availability statement
The datasets presented in this study can be found in online repositories. The names of the repository/repositories and accession number(s) can be found below: https://idf.pku.edu.cn/yjcg/zsbg/513800.htm.
Author contributions
ZD: Writing – original draft. XQ: Writing – review & editing. CL: Writing – review & editing.
Funding
The author(s) declare financial support was received for the research, authorship, and/or publication of this article. This work was supported by Project of Philosophy and Social Science of Shanghai “Study on the Role of Population Aging on Economic Growth in the Yangtze River Delta Urban Agglomeration” (2023ZSH002).
Conflict of interest
The authors declare that the research was conducted in the absence of any commercial or financial relationships that could be construed as a potential conflict of interest.
Publisher’s note
All claims expressed in this article are solely those of the authors and do not necessarily represent those of their affiliated organizations, or those of the publisher, the editors and the reviewers. Any product that may be evaluated in this article, or claim that may be made by its manufacturer, is not guaranteed or endorsed by the publisher.
Footnotes
References
1. Street, RL Jr, and Finset, A . Two years with COVID-19: new- and old-challenges for health communication research. Patient Educ Couns. (2022) 105:261–4. doi: 10.1016/j.pec.2022.01.006
2. Finset, A , Bosworth, H , Butow, P , Gulbrandsen, P , Hulsman, RL , Pieterse, AH, et al. Effective health communication-a key factor in fighting the COVID-19 pandemic. Patient Educ Couns. (2020) 103:873–6. doi: 10.1016/j.pec.2020.03.027
3. Merkley, E , and Loewen, PJ . Anti-intellectualism and the mass Public’s response to the COVID-19 pandemic. Nat Hum Behav. (2021) 5:706–15. doi: 10.1038/s41562-021-01112-w
4. Goodwin, S , Olazabal, M , Castro, AJ , and Pascual, U . Global mapping of urban nature-based solutions for climate change adaptation. Nat Sustain. (2023) 6:458–69. doi: 10.1038/s41893-022-01036-x
5. Fernández-Portillo, A , Almodóvar-González, M , and Hernández-Mogollón, R . Impact of ICT development on economic growth. A study of OECD European union countries. Technol Soc. (2020) 63:101420. doi: 10.1016/j.techsoc.2020.101420
6. Colglazier, W . Sustainable development agenda: 2030. Science. (2015) 349:1048–50. doi: 10.1126/science.aad2333
7. Kjaer, LL , Pigosso, DCA , McAloone, TC , and Birkved, M . Guidelines for evaluating the environmental performance of product/service-systems through life cycle assessment. J Clean Prod. (2018) 190:666–78. doi: 10.1016/j.jclepro.2018.04.108
8. Li, ZG , and Wang, J . The dynamic impact of digital economy on carbon emission reduction: evidence city-level empirical data in China. J Clean Prod. (2022) 351:131570. doi: 10.1016/j.jclepro.2022.131570
9. Yu, M , Tsai, FS , Jin, H , and Zhang, H . Digital finance and renewable energy consumption: evidence from China. Finan Innov. (2022) 8:1–19. doi: 10.1186/s40854-022-00362-5
10. National Bureau of Statistics (2023). Bulletin of the Seventh National Population Census (No. 5). Available at: http://www.stats.gov.cn/sj/tjgb/rkpcgb/qgrkpcgb/202302/t20230206_1902005.html (Accessed on December 16, 2023).
11. Huang, Q , Li, Y , Wu, X , Ge, S , Qu, Z , Wang, A, et al. The willingness and influencing factors to choose smart senior care among old adults in China. BMC Geriatr. (2022) 22:967. doi: 10.1186/s12877-022-03691-3
12. The World Bank (2020). Poverty and shared prosperity 2020: reversals of fortune; the World Bank: Washington, DC, USA.
13. Eozenou, PH-V , Neelsen, S , and Lindelow, M . Child health outcome inequalities in low and middle income countries. Health Syst Reform. (2021) 7:e1934955. doi: 10.1080/23288604.2021.1934955
14. Liu, T , Li, J , Chen, J , and Yang, S . Regional differences and influencing factors of allocation efficiency of rural public health resources in China. Health. (2020) 8:270. doi: 10.3390/healthcare8030270
15. Levin-Zamir, D , and Bertschi, I . Media health literacy, eHealth literacy, and health behavior across the lifespan: current progress and future challenges (chapter 18) In: O Okan, U Bauer, D Levin-Zamir, P Pinheiro, and K Sorensen, editors. International Handbook of Health Literacy-Research, Policy and Practice across the Lifespan. Bristol, UK: Policy Press (2019). 275–90.
16. Kang, HJ , Han, J , and Kwon, GH . Determining the intellectual structure and academic trends of smart home health care research: Coword and topic analyses. J Med Internet Res. (2021) 23:e19625. doi: 10.2196/19625
17. Carretero, S. (2015). Technology-enabled Services for older people living at home independently. Publications Office of the European Union, Luxembourg.
18. Wu, YH , Cristancho-Lacroix, V , Fassert, C , Faucounau, V , de Rotrou, J , and Rigaud, A-S . The attitudes and perceptions of elders with mild cognitive impairment toward an assistive robot. J Appl Gerontol. (2016) 35:3–17. doi: 10.1177/0733464813515092
19. Yusif, S , Soar, J , and Hafeez-Baig, A . Older people, assistive technologies, and the barriers to adoption: a systematic review. Int J Med Inform. (2016) 94:112–6. doi: 10.1016/j.ijmedinf.2016.07.004
20. Czaja, S , Beach, S , Charness, N , and Schulz, R . Elders and the adoption of healthcare technology: opportunities and challenges In: A Sixsmith and G Gutman, editors. Technologies for Active Aging. New York, NY, USA: Springer (2013). 27–46.
21. Renqun, W. (2019). “Problems and suggestions about digital new media development in China” in Proceedings of the 2019 16th international conference on service systems and service management (icsssm2019), Shenzhen, China, 13–15 July 2019; IEEE: New York, NY, USA.
22. Ni, Q , Garcia Hernando, AB , la Cruz, D , and Pau, I . The elderly’s independent living in smart homes: a characterization of activities and sensing infrastructure survey to facilitate services development. Sensors. (2015) 15:11312–62. doi: 10.3390/s150511312
23. Johannessen, T , Ree, E , Aase, I , Bal, R , and Wiig, S . Exploring challenges in quality and safety work in nursing homes and home care—a case study as basis for theory development. BMC Health Serv Res. (2020) 20:277. doi: 10.1186/s12913-020-05149-x
24. Arcaya, M , Brewster, M , Zigler, CM , and Subramanian, SV . Area variations in health: a spatial multilevel modeling approach. Health Place. (2012) 18:824–31. doi: 10.1016/j.healthplace.2012.03.010
25. Yan, JJ , Xu, L , and Tan, YS . The spatial pattern and dynamic evolution of public health expenditure in China. Econ Geogr. (2017) 37:82–91.
26. Zhao, XY , Wang, WJ , and Wan, WY . Regional differences in the health status of Chinese residents: 2003-2013. J Geogr Sci. (2018) 28:741–58. doi: 10.1007/s11442-018-1502-0
27. Elhorst, JP . Spatial Econometrics: From Cross-Sectional Data to Spatial Panels; Springer Briefs in Regional Science. Berlin/Heidelberg, Germany: Springer (2014).
28. G20 (2016). G20 digital economy development and cooperation initiative. Group of Twenty Hangzhou, China.
29. Cheng, Y , Zhang, Y , Wang, JJ , and Jiang, JX . The impact of the urban digital economy on China’s carbon intensity: spatial spillover and mediating effect. Resour Conserv Recycl. (2023) 189:106762. doi: 10.1016/j.resconrec.2022.106762
30. Wang, HL , and Guo, JG . Impacts of digital inclusive finance on CO2 emissions from a spatial perspective: evidence from 272 cities in China. J Clean Prod. (2022) 355:131618. doi: 10.1016/j.jclepro.2022.131618
31. Guo, F , Wang, JY , Wang, F , Kong, T , Zhang, X , and Cheng, ZY . Measuring China’s digital financial inclusion: index compilation and spatial characteristics. China Econ Q. (2020) 19:1401–18.
32. Weng, ZY , Fan, F , Yang, BH , and Zhang, H . Regional differences and drivers of patent transfer-in between Chinese cities: a city absorptive capacity perspective. Tech Anal Strat Manag. (2023) 8:1–15. doi: 10.1080/09537325.2023.2242509
33. Sun, CZ , and Hao, S . Research on the competitive and synergistic evolution of the water-energy-food system in China. J Clean Prod. (2022) 365:132743. doi: 10.1016/j.jclepro.2022.132743
34. Zhai, XQ , Sun, CZ , Zou, W , and Hao, S . Spatiotemporal characteristic and evolution of China’s marine economic resilience. Ocean Coast Manag. (2023) 238:106562. doi: 10.1016/j.ocecoaman.2023.106562
35. Hsieh, MF , Lee, CC , and Lin, YC . New evidence on liquidity creation and bank capital: the roles of liquidity and political risk. Econ Analys Pol. (2022) 73:778–94. doi: 10.1016/j.eap.2022.01.002
36. Luo, K , Liu, YB , Chen, BF , and Zeng, ML . Assessing the impact of digital economy on green development efficiency in the Yangtze River Economic Belt. Energy Econ. (2022) 112:106127. doi: 10.1016/j.eneco.2022.106127
37. Frankel, JA , and Romer, DH . Does trade cause growth? Am Econ Rev. (1999) 89:379–99. doi: 10.1257/aer.89.3.379
38. Anchala, R , Kannuri, NK , Pant, H , Khan, H , Franco, OH , Di Angelantonio, E, et al. Hypertension in India: a systematic review and meta-analysis of prevalence, awareness, and control of hypertension. J Hypertens. (2014) 32:1170–7. doi: 10.1097/HJH.0000000000000146
39. Gupta, R . Trends in hypertension epidemiology in India. J Hum Hypertens. (2004) 18:73–8. doi: 10.1038/sj.jhh.1001633
40. Gupta, R . Convergence in urban-rural prevalence of hypertension in India. J Hum Hypertens. (2016) 30:79–82. doi: 10.1038/jhh.2015.48
41. Pan, XF , Xu, HT , and Lu, YD . Long-term forecasting of industrial CO2 emissions in 31 provinces of China. Environ Sci Pollut Res. (2020) 27:5168–91. doi: 10.1007/s11356-019-07092-9
42. Yang, L , and Wang, B . A reflection upon the equalization of basic public health services in Shandong province. J Ocean Univ China. (2011) 2:56–9.
43. Liu, JS . Research on non-equalization of public health services in towns and villages of ethnic minority areas. J Guizhou Norm Univ. (2009) 5:15–9.
44. Liu, CL , Wang, T , and Guo, QB . Factors aggregating and the regional differences among China urban agglomerations. Sustain For. (2018) 10:4179. doi: 10.3390/su10114179
45. Huang, XP , and Fang, QP . Regional differences of financial support for health care in China: based on the theil index. Public Financ Res. (2008) 4:41–5.
46. Yu, X , Wu, ZY , Zheng, HR , Li, MQ , and Tan, TL . How urban agglomeration improve the emission efficiency? A spatial econometric analysis of the Yangtze river delta urban agglomeration in China. J Environ Manag. (2020) 260:110061. doi: 10.1016/j.jenvman.2019.110061
47. LeSage, J. P. , and Pace, R. K. (2009) Introduction to Spatial Econometrics. New York: CRC Press, 27–41.
48. Carrieri, V , and Jones, AM . Inequality of opportunity in health: a decomposition-based approach. Health Econ. (2018) 27:1981–95. doi: 10.1002/hec.3814
Keywords: digital economy, high-quality development, healthcare industry, provinces, China
Citation: Ding Z, Qu X and Li C (2024) Digital economy and high-quality development of the healthcare industry. Front. Public Health. 12:1331565. doi: 10.3389/fpubh.2024.1331565
Edited by:
Siqin Wang, The University of Queensland, AustraliaReviewed by:
Wenyi Yang, Zhongnan University of Economics and Law, ChinaSong Wang, Northeastern University, China
Copyright © 2024 Ding, Qu and Li. This is an open-access article distributed under the terms of the Creative Commons Attribution License (CC BY). The use, distribution or reproduction in other forums is permitted, provided the original author(s) and the copyright owner(s) are credited and that the original publication in this journal is cited, in accordance with accepted academic practice. No use, distribution or reproduction is permitted which does not comply with these terms.
*Correspondence: Chen Li, bGljaGVuQHN1ZXMuZWR1LmNu