
94% of researchers rate our articles as excellent or good
Learn more about the work of our research integrity team to safeguard the quality of each article we publish.
Find out more
BRIEF RESEARCH REPORT article
Front. Public Health, 11 March 2024
Sec. Life-Course Epidemiology and Social Inequalities in Health
Volume 12 - 2024 | https://doi.org/10.3389/fpubh.2024.1329382
 Alexanderia Lacy1
 Md Marufuzzaman Khan2
 Nirmalendu Deb Nath3
 Praachi Das4
 Morganne Igoe1Suzanne Lenhart1
 Alun L. Lloyd4
 Cristina Lanzas5
 Agricola Odoi3*
Background: Limited information is available on geographic disparities of COVID-19 vaccination in Missouri and yet this information is essential for guiding efforts to improve vaccination coverage. Therefore, the objectives of this study were to (a) investigate geographic disparities in the proportion of the population vaccinated against COVID-19 in Missouri and (b) identify socioeconomic and demographic predictors of the identified disparities.
Methods: The COVID-19 vaccination data for time period January 1 to December 31, 2021 were obtained from the Missouri Department of Health. County-level data on socioeconomic and demographic factors were downloaded from the 2020 American Community Survey. Proportions of county population vaccinated against COVID-19 were computed and displayed on choropleth maps. Global ordinary least square regression model and local geographically weighted regression model were used to identify predictors of proportions of COVID-19 vaccinated population.
Results: Counties located in eastern Missouri tended to have high proportions of COVID-19 vaccinated population while low proportions were observed in the southernmost part of the state. Counties with low proportions of population vaccinated against COVID-19 tended to have high percentages of Hispanic/Latino population (p = 0.046), individuals living below the poverty level (p = 0.049), and uninsured (p = 0.015) populations. The strength of association between proportion of COVID-19 vaccinated population and percentage of Hispanic/Latino population varied by geographic location.
Conclusion: The study findings confirm geographic disparities of proportions of COVID-19 vaccinated population in Missouri. Study findings are useful for guiding programs geared at improving vaccination coverage and uptake by targeting resources to areas with low proportions of vaccinated individuals.
Coronavirus Disease 2019 (COVID-19) is a highly infectious disease caused by the Severe Acute Respiratory Syndrome Coronavirus 2 (SARS-CoV-2). The first COVID-19 case was identified in Wuhan, China, in December 2019 (1), and it was declared a pandemic by the World Health Organization (WHO) the following year. As of March 2023, there have been more than 103 million confirmed cases and over 1.1 million deaths in the United States (US) (2). The state of Missouri detected the first confirmed case on March 8, 2020 (3), and has reported more than 1.7 million COVID-19 cases and 22 thousand deaths as of March 10, 2023 (4).
Vaccination is an effective way to reduce the risk of COVID-19 infections. The US Food and Drug Administration (FDA) authorized the emergency use of COVID-19 vaccines on December 2020 (5), and since then, vaccines have been administered all over the US. However, evidence shows that the COVID-19 burden and vaccine uptake vary geographically due to sociodemographic factors and population characteristics, as well as inequities in healthcare accessibility among populations (6–9). According to the Centers for Disease Control and Prevention (CDC), non-Hispanic Black and Hispanic populations have a higher risk of COVID-19, and yet they are less likely to be vaccinated compared to non-Hispanic White and populations of other racial categories (10, 11). Evidence also suggests that educational attainment, poverty, occupation, rurality, and healthcare access are associated with COVID-19 vaccine hesitancy and vaccine coverage (12–14). Additionally, concerns over misinformation and speed of vaccine development have impacted vaccine acceptance, as highlighted by public health experts and the WHO (15–17).
As of September 2022, the state of Missouri fully vaccinated only 58.9% of the total population (18, 19), which fell far behind the national average (70%) and ranked Missouri as the 11th lowest vaccinated state in the US. In addition, the findings of a recent study conducted among undergraduate students of a university in Missouri reported that several socioeconomic and demographic factors, such as access to healthcare facilities, availability of primary care physicians, and health insurance, were associated with vaccine hesitancy (19). Evidence suggests that vaccine hesitancy is a major barrier of vaccination coverage (20, 21). However, very little is known about the geographic disparities and predictors of COVID-19 vaccination in Missouri. This knowledge is essential for identifying communities with low COVID-19 vaccination in Missouri and guiding targeted planning to improve vaccination coverage in the state. Therefore, the objective of this study was to investigate county-level geographic disparities and predictors of COVID-19 vaccination in Missouri.
Ethical review and approval was not required for the current study in accordance with the local legislation and institutional requirements.
This retrospective ecological study was conducted in 2022–2023 in the state of Missouri, which consists of 114 counties (Figure 1A). Missouri has a population of approximately 6 million, with 50.6% female and 49.4% male residents. Most of the residents are White (82.6%). Black or African American comprise 11.8% of the population while the rest (5.6%) are from other categories that include American Indian, Alaska Native, Asian, Native Hawaiian, Other Pacific Islander, and multiracial groups (22). By ethnicity, only 4.7% of the population is Hispanic or Latino while the rest are non-Hispanic (of any race). St. Louis is the most populous county (1,001,982 people), while Worth county is the least populated with only 2004 people (22). Although 87% (99/114) of the counties are classified as rural, only 33% of the population lives in rural areas (23).
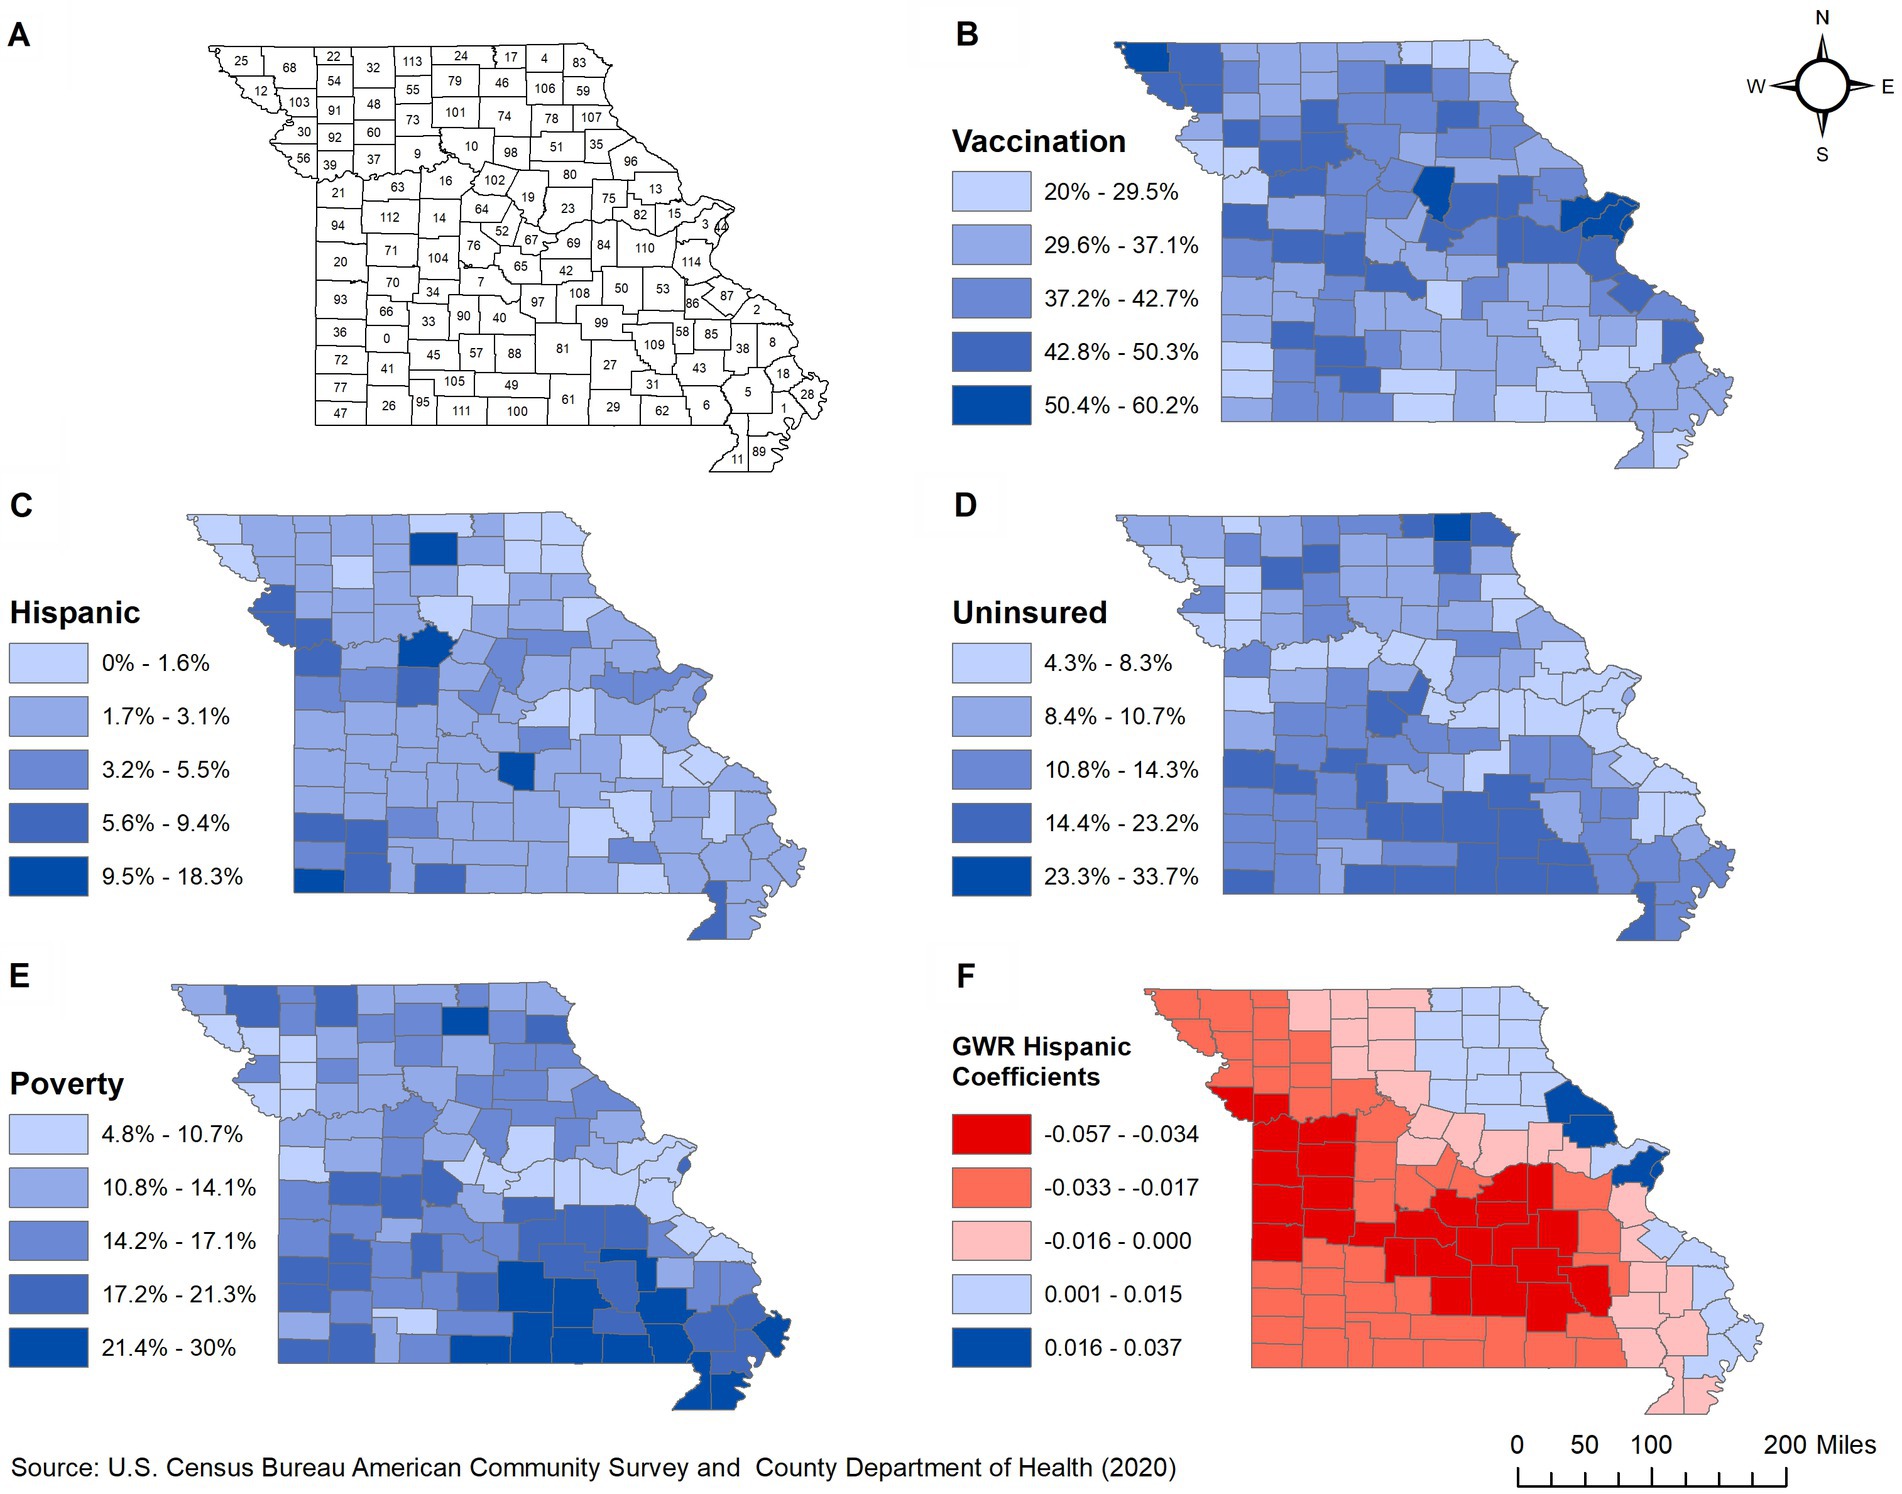
Figure 1. Geographic distribution of: (A) counties, (B) proportions of COVID-19 vaccinated population, (C–E) significant predictors, and (F) spatially varying local coefficients in Missouri. 0, Dade; 1, New Madrid; 2, Perry; 3, St. Louis; 4, Scotland; 5, Stoddard; 6, Butler; 7, Camden; 8, Cape Girardeau; 9, Carroll; 10, Chariton; 11, Dunklin; 12, Holt; 13, Lincoln; 14, Pettis; 15, St. Charles; 16, Saline; 17, Schuyler; 18, Scott; 19, Boone; 20, Bates; 21, Jackson; 22, Worth; 23, Callaway; 24, Putnam; 25, Atchison; 26, Barry; 27, Shannon; 28, Mississippi; 29, Oregon; 30, Buchanan; 31, Carter; 32, Harrison; 33, Polk; 34, Hickory; 35, Ralls; 36, Barton; 37, Ray; 38, Bollinger; 39, Clay; 40, Laclede; 41, Lawrence; 42, Maries; 43, Wayne; 44, St. Louis; 45, Greene; 46, Adair; 47, McDonald; 48, Daviess; 49, Douglas; 50, Crawford; 51, Monroe; 52, Moniteau; 53, Washington; 54, Gentry; 55, Grundy; 56, Platte; 57, Webster; 58, Iron; 59, Lewis; 60, Caldwell; 61, Howell; 62, Ripley; 63, Lafayette; 64, Cooper; 65, Miller; 66, Cedar; 67, Cole; 68, Nodaway; 69, Osage; 70, St. Clair; 71, Henry; 72, Jasper; 73, Livingston; 74, Macon; 75, Montgomery; 76, Morgan; 77, Newton; 78, Shelby; 79, Sullivan; 80, Audrain; 81, Texas; 82, Warren; 83, Clark; 84, Gasconade; 85, Madison; 86, St. Francois; 87, Ste. Genevieve; 88, Wright; 89, Pemiscot; 90, Dallas; 91, DeKalb; 92, Clinton; 93, Vernon; 94, Cass; 95, Stone; 96, Pike; 97, Pulaski; 98, Randolph; 99, Dent; 100, Ozark; 101, Linn; 102, Howard; 103, Andrew; 104, Benton; 105, Christian; 106, Knox; 107, Marion; 108, Phelps; 109, Reynolds; 110, Franklin; 111, Taney; 112, Johnson; 113, Mercer; 114, Jefferson.
Data on COVID-19 confirmed cases and fully vaccinated individuals reported from January 1 to December 31, 2021, were obtained from the Missouri Department of Health. A COVID-19 fully vaccinated individual was defined as a person who received either both doses of Pfizer-BioNTech or Moderna or one dose of the Johnson & Johnson vaccine. The data were aggregated to the county level and proportions of confirmed COVID-19 vaccinated population were computed using 5-year population estimates from the American Community Survey (ACS) as denominators (24).
Data on sociodemographic factors such as age, gender, race and ethnicity, poverty, insurance, household size, educational attainment, employment, and commuting were obtained from the ACS 5-year estimates of 2016–2020 (24). These were investigated as potential predictors of proportion of county population vaccinated against COVID-19. Cartographic boundary files were downloaded from the US Census Bureau’s TIGER files and used for generating maps (25).
Descriptive analysis was performed in GeoDa version 1.8 (26) and R version 4.1.1 (27) using the RStudio version 1.4.1717 (28) interface. The Shapiro–Wilk test was used to assess the normality of continuous variables. Non-normally distributed variables were summarized using median and the 1st and 3rd quartiles while mean and standard deviations were used for normally distributed variables (Table 1).
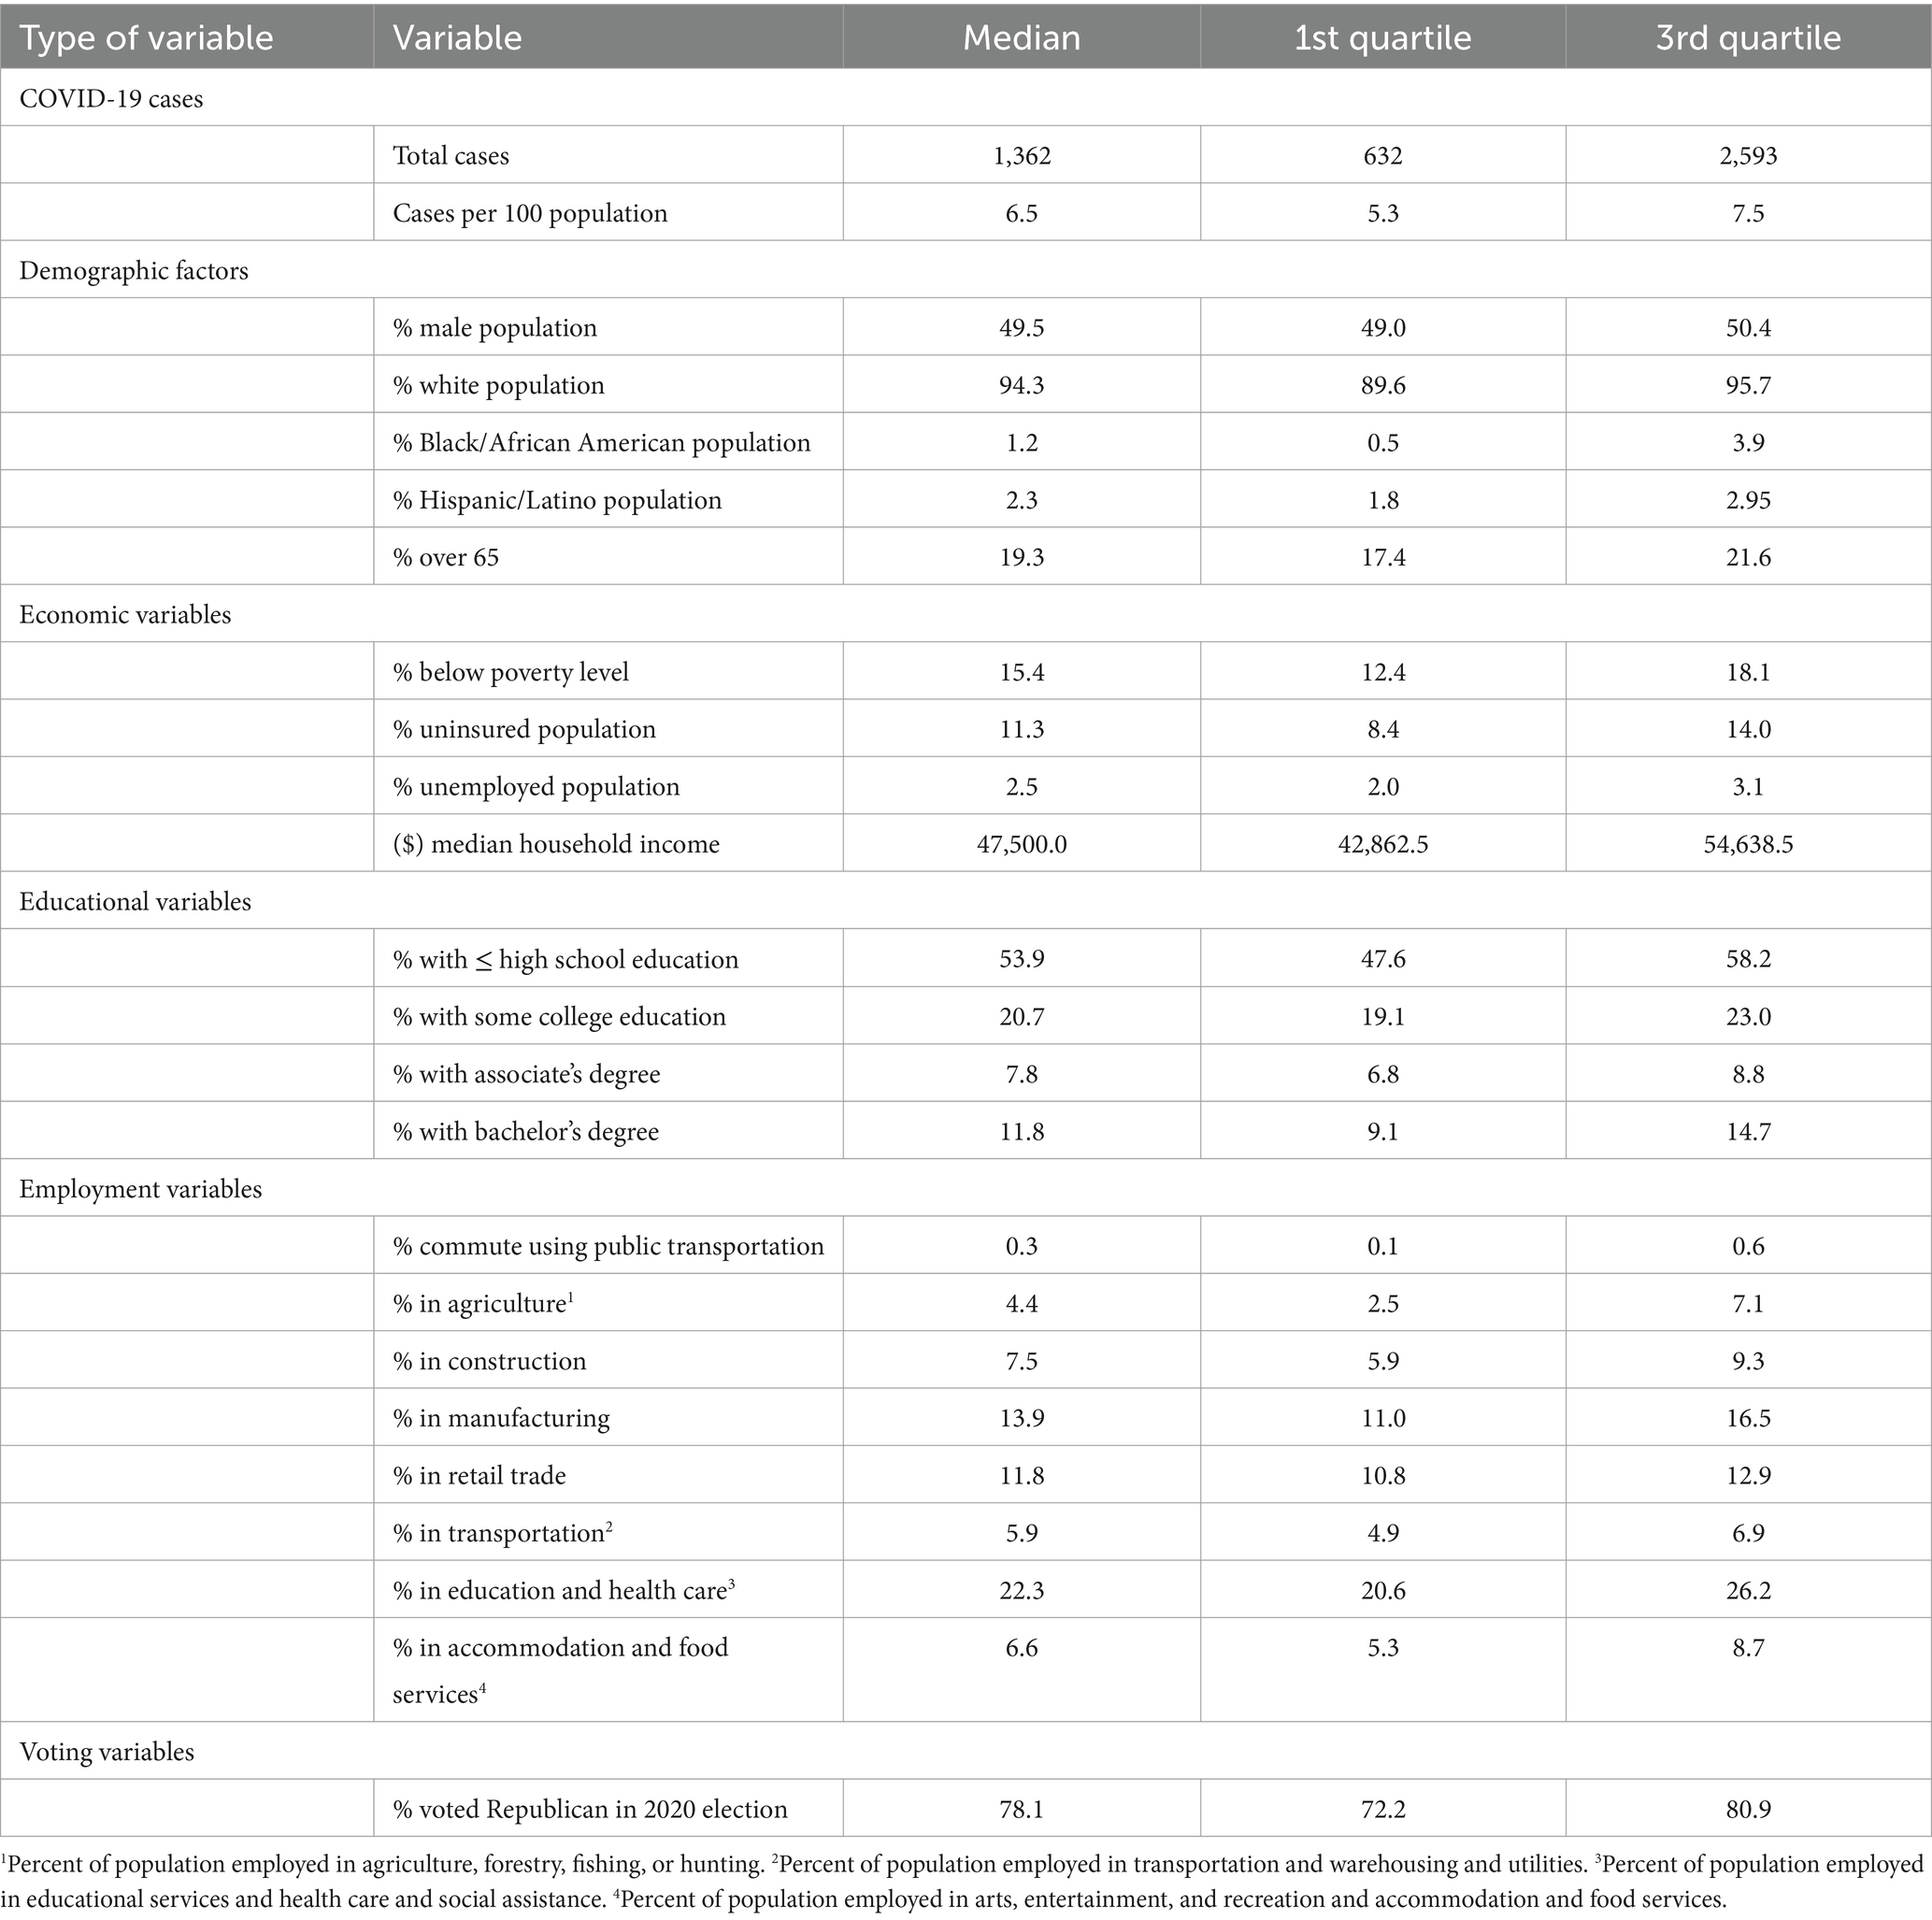
Table 1. Summary statistics of county-level predictors of proportions of COVID-19 vaccinated population in Missouri.
Univariable associations between each of the potential predictors and the log of the county-level proportion of COVID-19 vaccinated population were investigated using global Ordinary Least Squares (OLS) models (29) in GeoDa (26). A relaxed critical p -value of ≤0.15 was used to identify potentially significant predictors.
A multivariable global OLS model was then built in R using the manual backward elimination approach (p ≤ 0.05). Potential confounding variables were investigated using the change in parameter estimates method (30). Two-way interaction terms were investigated based on biological knowledge, and only the significant (p ≤ 0.05) ones were kept in the final mode. Simes method (31) was used to adjust for multiple testing. Collinearity among predictors of the final model was assessed using Multicollinearity Condition Number (MCN) in GeoDA and Variance Inflation Factor (VIF) in R. Adjusted R-squared (R2) and Akaike Information Criterion (AIC) were used to assess the overall goodness-of-fit.
A Geographically Weighted Ordinary Least Squares (GWOLS) model was fit to the data to assess if the associations between county-level proportion of COVID-19 vaccinated population and each of the predictors changed based on geographical location. This local GWOLS model used the same outcome variable and predictors as the final global model. The local model was fit to the data in GWR version 4 (32) specifying an adaptive bi-square geographic kernel weight. The golden section search method was used to identify the optimum bandwidth. Model fit was assessed using small sample size bias-corrected Akaike Information Criteria (AICc). The geographic variability of each regression coefficient was investigated using the global OLS model’s Standard Error (SE), the local GWOLS model’s Interquartile Range (IQR), and the difference of criterion. Coefficients were considered non-stationary if IQR > 2*SE or the difference of criterion <−2 (33).
All maps were generated in QGIS (34). Choropleth maps were used to display the geographic disparities of county-level proportion of COVID-19 vaccinated population, socioeconomic and demographic factors, and local regression coefficients of the GWOLS model. Critical intervals were determined using the Jenk’s optimization classification scheme.
A total of 1,362 (6.5%) of the population had confirmed COVID-19 during the study period. The majority (94.3%) were non-Hispanic White, while the median percentages of non-Hispanic Black and Hispanic/Latino populations across counties were 1.2 and 2.3%, respectively. About 19.3% were ≥ 65 years old, 2.5% were unemployed, and 11.3% did not have health insurance. Median household income was $47,500, with 15.4% living below the poverty level. Approximately 53.9% had high school education or less and 7.8% had an associate’s degree (Table 1). Regarding occupation, 22.3% worked in education and health care, 13.9% in manufacturing, and 11.8% in retail trade. The majority (78.1%) voted republican during the 2020 election.
The proportion of vaccinated population tended to be lower in counties with high percentages of the population that were Hispanic/Latino, uninsured, living below the poverty level, had high school education or less, worked in agriculture, worked in manufacturing, or voted Republican in the 2020 election (relaxed p = 0.15). On the other hand, the proportion of vaccinated individuals tended to be high in counties with high percentages of individuals that were public transport users, education and healthcare workers, had high median household income, bachelor’s degree, and COVID-19 cases (Table 2). No highly correlated variables were identified.
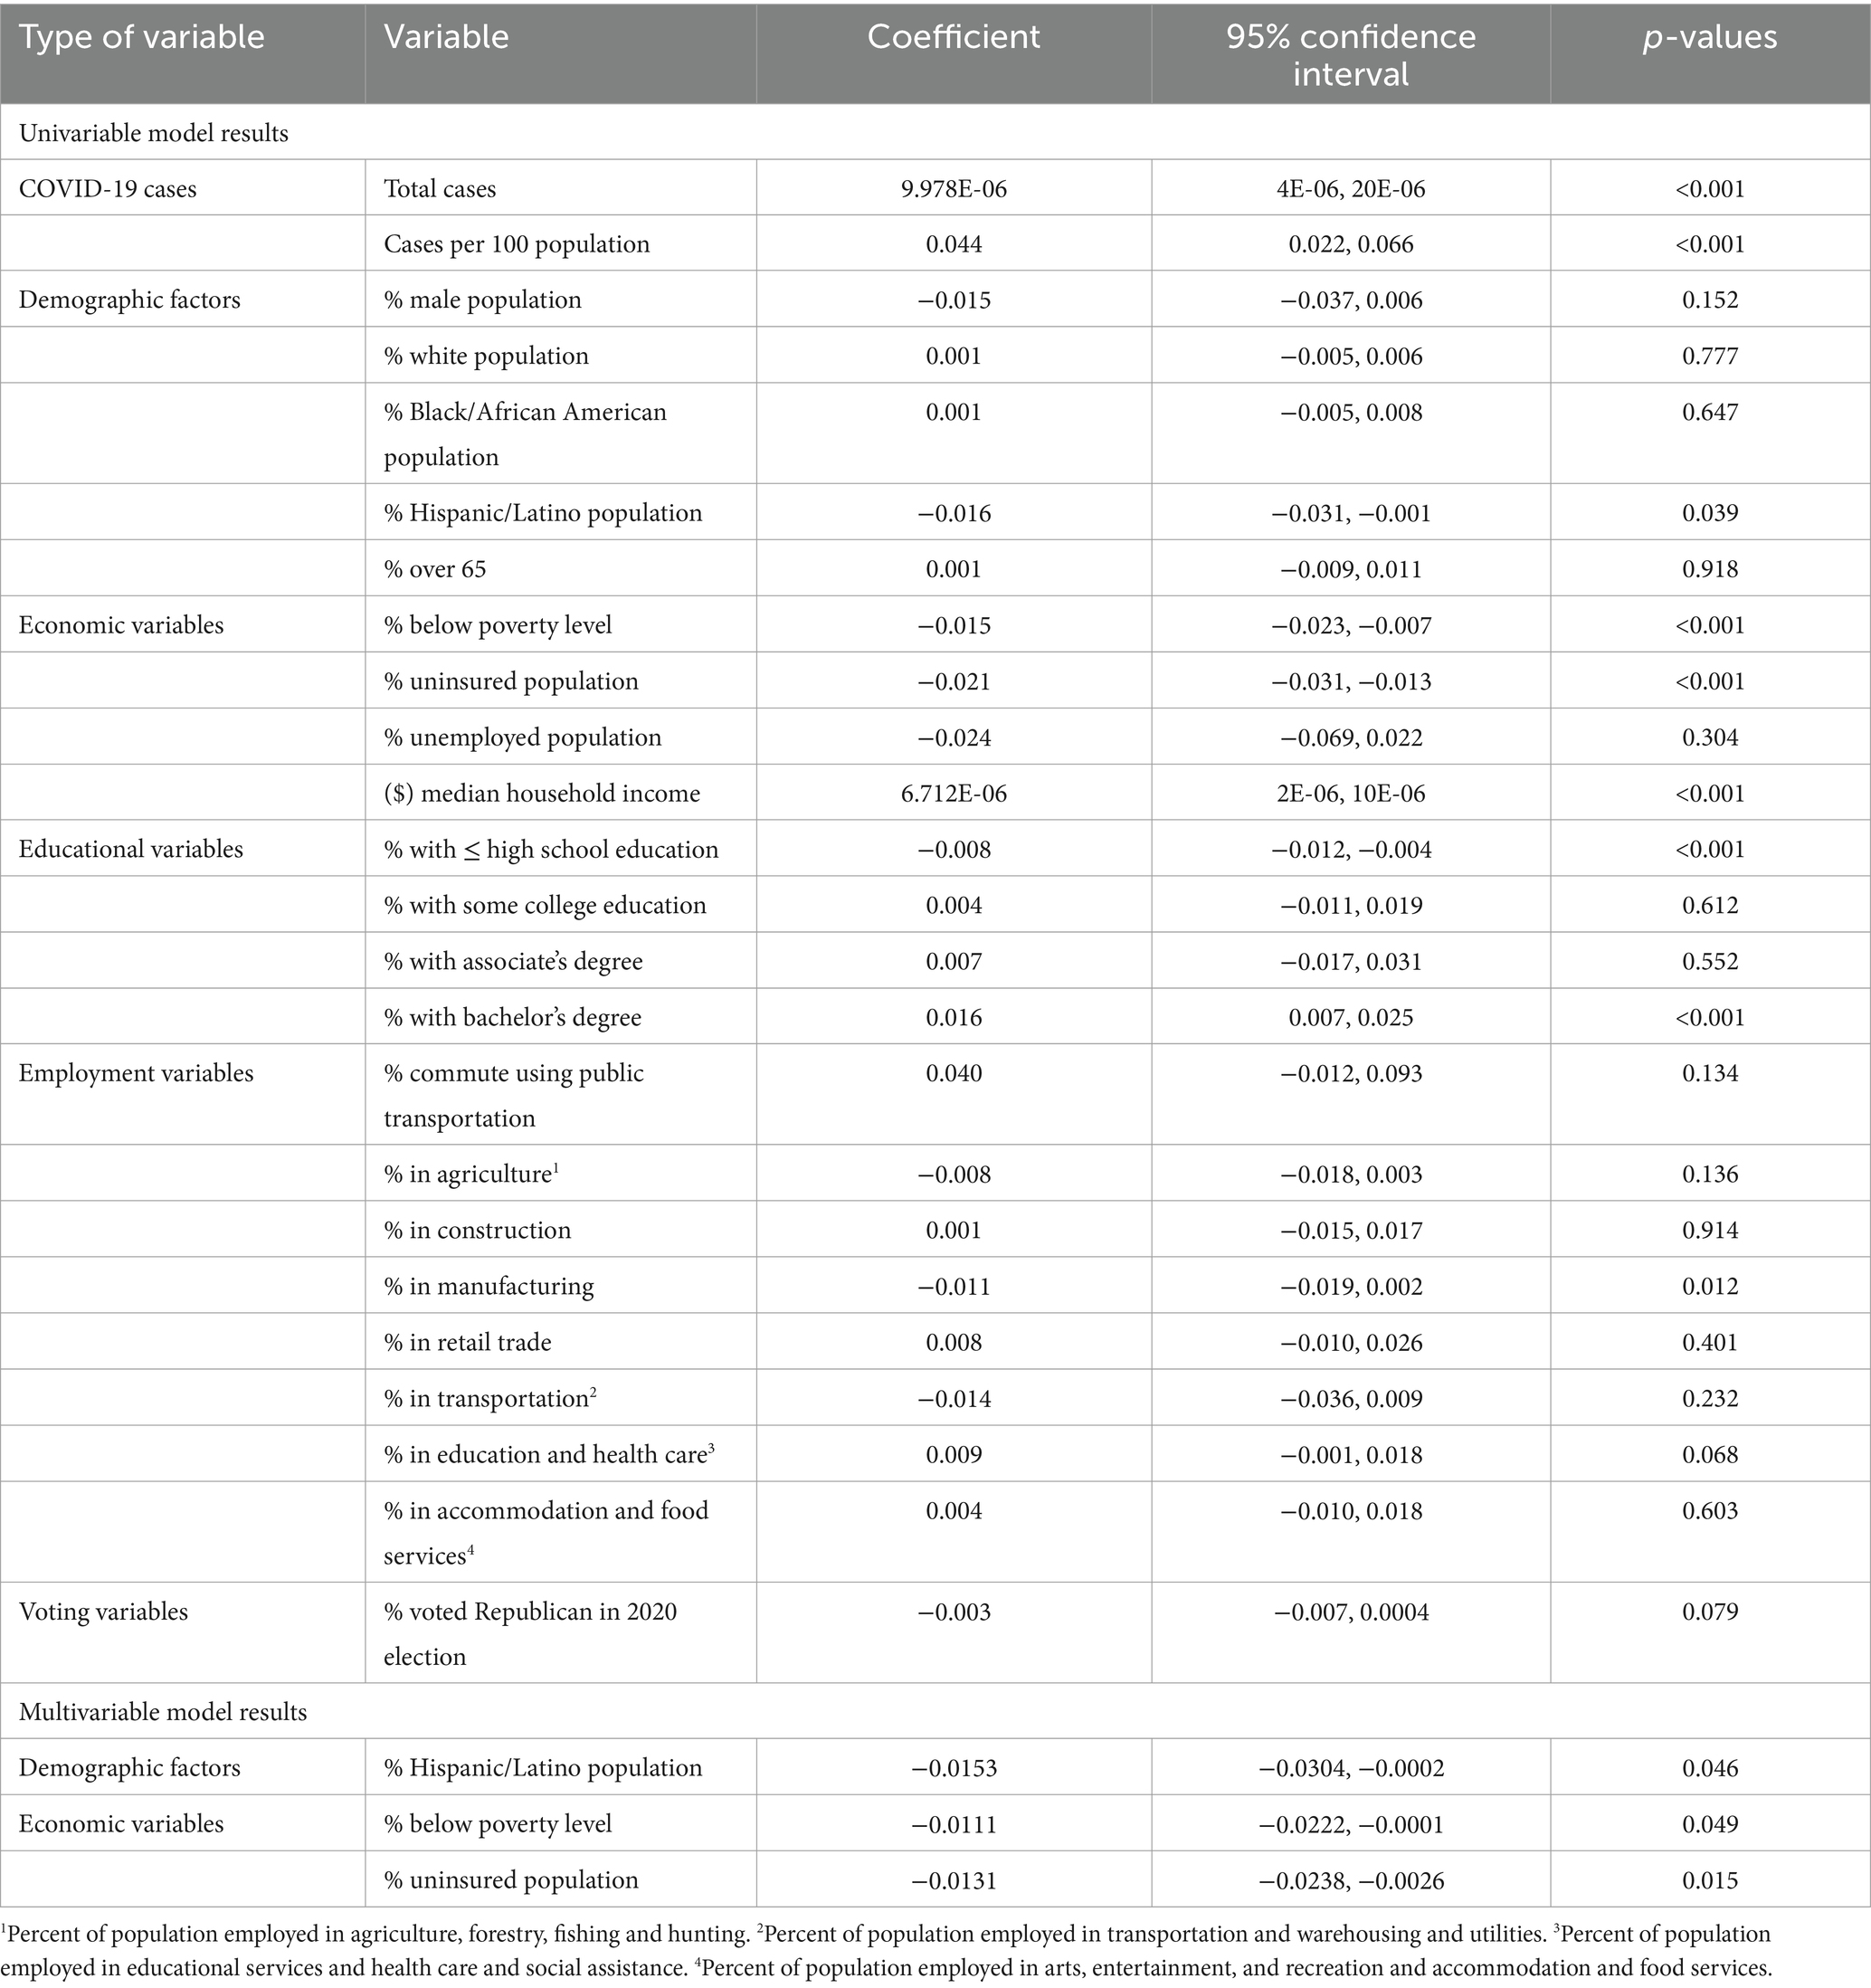
Table 2. Results of univariable and multivariable ordinary least squares regression models used to identify predictors of proportions of COVID-19 vaccinated population in Missouri.
Based on the final global multivariable model, low county-level proportions of COVID-19 vaccinated individuals tended to occur in counties with high percentages of Hispanic/Latino population (p = 0.046), individuals living below the poverty level (p = 0.049), and uninsured population (p = 0.015) (Table 2). The same three variables remained statistically significant in the final model after adjusting for multiple testing using Simes method since the corrected overall critical p -value was 0.05. Counties located in the eastern parts of the state tended to have high proportions of COVID-19 vaccinated population (Figure 1B) but low percentages of Hispanic/Latino (Figure 1C), uninsured (Figure 1D), and populations living below the poverty level (Figure 1E). Counties in the southernmost part of the state had the opposite distributions (Figures 1B,D,E).
The regression coefficient for the association between proportion of COVID-19 vaccinated population and percentage of Hispanic/Latino population was non-stationary (IQR > 2*SE and difference of criterion <−2), implying that the strength of association changes across counties (Table 3). A west–east gradient was observed with strong negative associations being observed in counties of the westernmost and southcentral regions, while positive associations were observed in the eastern part of the state spanning from north to south (Figure 1F). There was no evidence of non-stationarity of the coefficients of percentages of uninsured or poor populations.
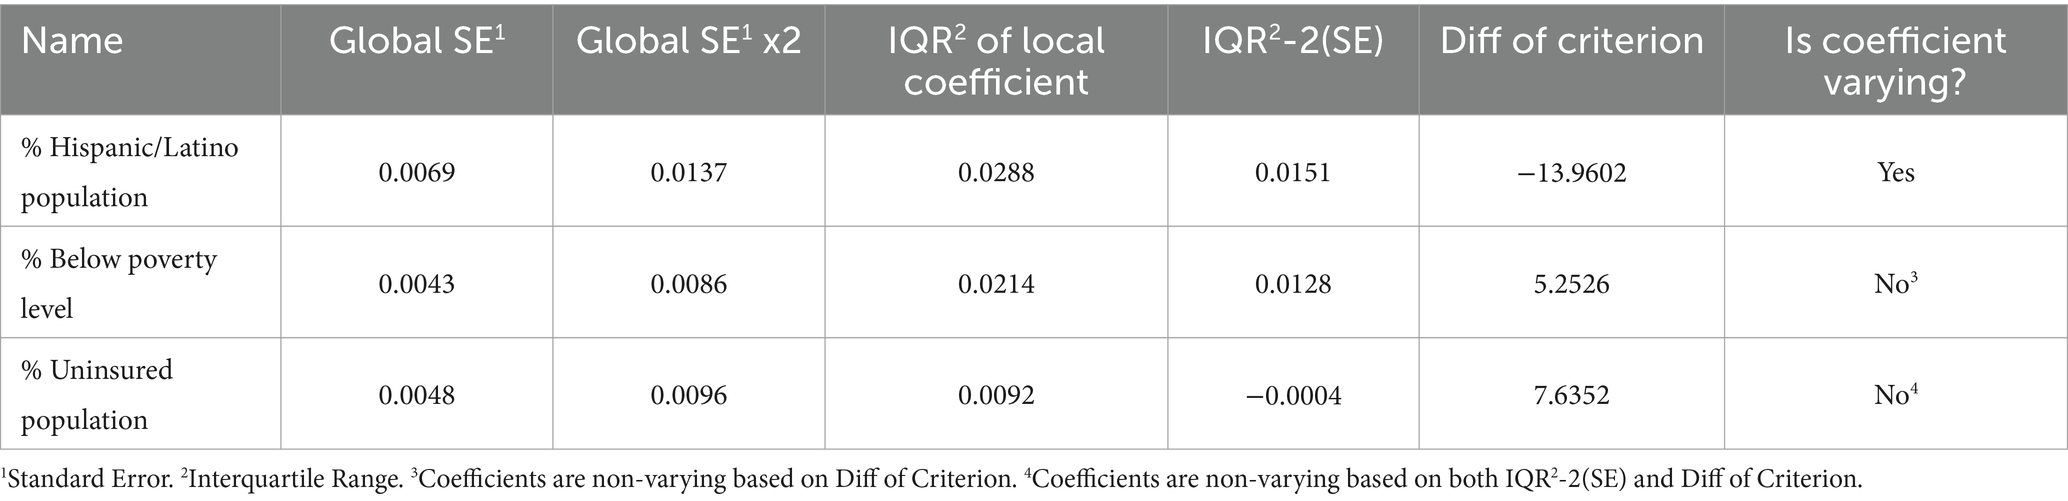
Table 3. Results of assessment of variability of the coefficients of the predictors of the proportions of COVID-19 vaccinated population in Missouri.
This study investigated geographic disparities and predictors of county-level proportions of COVID-19 vaccinated population in Missouri from January to December 2021. The observed low proportions of COVID-19 vaccinated population in non-metropolitan communities in the southern part of the state might be due to inadequate healthcare facilities in these rural areas (23). Previous studies indicated that rural communities had higher burdens of diseases in general but lower access to healthcare resources than urban communities (35–39). According to a report by the Missouri Department of Health, counties in the southern part of the state tended to have fewer healthcare centers and primary care providers than the state average (40). Primary care providers play a crucial role in promoting vaccinations through dissemination of vaccine information as well as provision of vaccinations (29). Therefore, people living in these counties might have less access to vaccines due to lack of information on vaccine availability and access to vaccination centers. Additionally, the findings of this study identified that these counties had high percentages of uninsured individuals and those living below the poverty level, which could explain the low proportions of vaccinated population in these areas.
This study identified a significant negative association between county-level proportions of COVID-19 vaccinated population and the percentage of population living below the poverty level. These findings are consistent with those of previous studies, which reported that individuals with low income were less likely to get COVID-19 vaccines (41–44). This may be due to the fact that poor populations tend to have poor health literacy (45) and are unsure about the safety and effectiveness of the COVID-19 vaccine. Therefore, education on the safety and benefits of vaccines and addressing concerns about the vaccine side effects may help improve vaccination coverage among these populations.
This study found a significant association between the percentage of uninsured population and low proportions of COVID-19 vaccinated population which is consistent with reports by Donadio et al. that US counties with low health insurance coverage tended to have poor COVID-19 vaccination coverage (46). A study by Kelly et al. also reported that uninsured populations were 30% less likely to get COVID-19 vaccines than insured populations (7). Although COVID-19 vaccines are free to all, uninsured individuals may not know this due to lack of access to primary healthcare providers and fear of receiving bills. Vaccine hesitancy may be another reason for low vaccine uptake among uninsured populations. However, we acknowledge that vaccine hesitancy and low levels of vaccine uptake in populations are related but different; some individuals did not receive vaccines due to reasons other than vaccine hesitancy (47).
The significant negative association between county-level proportions of COVID-19 vaccinated population and percentages of Hispanic population suggests that race and ethnicity may play a role in vaccination disparities. A study by Khubchandani reported that COVID-19 vaccination hesitancy rates among Hispanic and African American adults were higher than the US average due to low education level, medical mistrust, and anti-vaccination beliefs (48). However, a study by Frisco et al. reported that US-born Hispanic adults were less vaccine hesitant compared to their White counterparts due to their experiences with COVID-19 (49). Since the Hispanic community in the US was greatly affected by COVID-19, they were more likely to have family members or friends who suffered or died from COVID-19. Such feelings motivated these populations to get vaccines. Suffice it to say that studies investigating vaccine hesitancy among Hispanic populations have produced mixed results (49). This could explain the non-stationary of associations between proportion of COVID-19 vaccinated population and percentage of Hispanic/Latino population across counties identified in this study.
This is the first study investigating geographic disparities and predictors of proportions of COVID-19 vaccinated population at the county-level using global and local models in Missouri. In addition, this study identified how the associations varied across counties in Missouri. However, this study is not without limitations. Reporting of confirmed COVID-19 vaccination data could be inconsistent among counties and prone to reporting bias. Furthermore, this study investigated county-level geographic disparities and did not consider intra-county disparities. These limitations notwithstanding, the findings of this study provided useful information for guiding health planners in allocating healthcare resources and reducing disparities in COVID-vaccination in Missouri. Similar geographically weighted analysis could be used to investigate disparities of COVID-vaccination across states in the US.
The findings of this study confirm geographic disparities in COVID-19 vaccination in Missouri and suggest that certain socioeconomic conditions and race/ethnicity play significant roles in vaccination coverage. Therefore, study findings are useful for guiding education programs and resource allocation geared toward reducing disparities and promoting vaccinations in the state of Missouri.
The original contributions presented in the study are included in the article/Supplementary material, further inquiries can be directed to the corresponding author.
Ethical review and approval was not required for the current study in accordance with the local legislation and institutional requirements. Written informed consent for participation was not required for this study in accordance with the national legislation and the institutional requirements.
AL: Conceptualization, Formal analysis, Investigation, Methodology, Validation, Visualization, Writing – original draft, Writing – review & editing. MK: Investigation, Visualization, Writing – original draft, Writing – review & editing. ND: Investigation, Visualization, Writing - Original draft, Writing - review & editing. PD: Conceptualization, Writing – review & editing. MI: Conceptualization, Investigation, Methodology, Writing – review & editing. SL: Conceptualization, Formal analysis, Investigation, Methodology, Supervision, Writing – original draft, Writing – review & editing. ALL: Conceptualization, Formal analysis, Investigation, Methodology, Validation, Writing – review & editing. CL: Conceptualization, Formal analysis, Funding acquisition, Investigation, Methodology, Project administration, Resources, Writing – original draft, Writing – review & editing. AO: Conceptualization, Formal analysis, Investigation, Methodology, Supervision, Validation, Visualization, Writing – original draft, Writing – review & editing.
The author(s) declare financial support was received for the research, authorship, and/or publication of this article. This work was funded by the US Centers for Disease Control and Prevention (Grant ID: CDC U01CK000587-01M001). The funders had no role in study design, data collection and analysis, decision to publish, or preparation of the manuscript.
The authors are grateful to the Missouri Department of Health for providing the data and funding this study.
The authors declare that the research was conducted in the absence of any commercial or financial relationships that could be construed as a potential conflict of interest.
The author(s) declared that they were an editorial board member of Frontiers, at the time of submission. This had no impact on the peer review process and the final decision.
All claims expressed in this article are solely those of the authors and do not necessarily represent those of their affiliated organizations, or those of the publisher, the editors and the reviewers. Any product that may be evaluated in this article, or claim that may be made by its manufacturer, is not guaranteed or endorsed by the publisher.
The Supplementary material for this article can be found online at: https://www.frontiersin.org/articles/10.3389/fpubh.2024.1329382/full#supplementary-material
COVID-19, Coronavirus Disease 2019; SARS-CoV-2, Severe Acute Respiratory Syndrome Coronavirus 2; WHO, World Health Organization; MO, Missouri; FDA, Food and Drug Administration; CDC, Centers for Disease Control and Prevention; ACS, American Community Survey; TIGER, Topologically Integrated Geographic Encoding and Referencing System; MCN, Multicollinearity Condition Number; VIF, Variance Inflation Factor; IQR, Interquartile Range; SE, Standard Error; AIC, Akaike Information Criterion; US, United States.
1. World Health Organization. WHO director-General’s opening remarks at the media briefing on COVID-19. Geneva, Switzerland: World Health Organization. (2020).
2. World Health Organization. United States of America: WHO coronavirus disease (COVID-19) dashboard with vaccination data. Geneva, Switzerland: World Health Organization. (2023).
3. Parson, L., and Parson, M. Governor, State, and local officials confirm first case of COVID-19 to test “presumptive positive” in Missouri. Jefferson City, USA: Office of Governor Michael L. Parson. (2020).
5. U.S. Food and Drug Administration. FDA takes key action in fight against COVID-19 by issuing emergency use authorization for first COVID-19 vaccine. Washington, DC: United States Food and Drug Administration. (2020).
6. Joshi, A, Kaur, M, Kaur, R, Grover, A, Nash, D, and El-Mohandes, A. Predictors of COVID-19 vaccine acceptance, intention, and hesitancy: a scoping review. Front Public Heal. (2021) 9:698111. doi: 10.3389/fpubh.2021.698111
7. Kelly, BJ, Southwell, BG, McCormack, LA, Bann, CM, MacDonald, PDM, Frasier, AM, et al. Predictors of willingness to get a COVID-19 vaccine in the U.S. BMC Infect Dis. (2021) 21:338. doi: 10.1186/s12879-021-06023-9
8. Savoia, E, Piltch-Loeb, R, Goldberg, B, Miller-Idriss, C, Hughes, B, Montrond, A, et al. Predictors of COVID-19 vaccine hesitancy: socio-demographics, co-morbidity, and past experience of racial discrimination. Vaccine. (2021) 9:767. doi: 10.3390/vaccines9070767
9. Khan, MM, Odoi, A, and Odoi, EW. Geographic disparities in COVID-19 testing and outcomes in Florida. BMC Public Health. (2023) 23:79. doi: 10.1186/S12889-022-14450-9
10. Centers for Disease Control and Prevention. COVID-19 vaccine equity for racial and ethnic minority groups. Atlanta, GA: United States Centers for Disease Control and Prevention. (2022).
11. National Center for Immunization and Respiratory Diseases and United States Advisory Committee on Immunization Practices. Risk for COVID-19 infection, hospitalization, and death by race/ethnicity. Atlanta, USA: United States Centers for Disease Control and Prevention. (2022).
12. Wallace, M, Hagan, L, Curran, KG, Williams, SP, Handanagic, S, Bjork, A, et al. COVID-19 in correctional and detention facilities — United States, February–April 2020. MMWR Morb Mortal Wkly Rep. (2020) 69:587–90. doi: 10.15585/mmwr.mm6919e1
13. Khubchandani, J, Sharma, S, Price, JH, Wiblishauser, MJ, Sharma, M, and Webb, FJ. COVID-19 vaccination hesitancy in the United States: a rapid national assessment. J Community Health. (2021) 46:270–7. doi: 10.1007/s10900-020-00958-x
14. Nawas, GT, Zeidan, RS, Edwards, CA, and El-Desoky, RH. Barriers to COVID-19 vaccines and strategies to improve acceptability and uptake. J Pharm Pract. (2022) 36:900–4. doi: 10.1177/08971900221081621
15. Rijal, P, Wang, BB, Tan, TK, Schimanski, L, Janesch, P, Dong, T, et al. Broadly inhibiting Antineuraminidase monoclonal antibodies induced by trivalent influenza vaccine and H7N9 infection in humans. J Virol. (2020) 94:e01182-19. doi: 10.1128/JVI.01182-19
16. Harrison, EA, and Wu, JW. Vaccine confidence in the time of COVID-19. Eur J Epidemiol. (2020) 35:325–30. doi: 10.1007/s10654-020-00634-3
17. World Health Organization. Ten threats to global health in 2019. Geneva, Switzerland: World Health Organization. (2019).
18. Centers for Disease Control and Prevention (CDC). CDC COVID data tracker: county view. Geneva, Switzerland: World Health Organization. (2023).
19. Myroniuk, TW, Schatz, E, Teti, M, and Hermsen, JM. Undergraduate vaccine hesitancy and the influence of “home” locales. Int J Environ Res Public Health. (2022) 19:14370. doi: 10.3390/ijerph192114370
20. Hughes, MM, Wang, A, Grossman, MK, Pun, E, Whiteman, A, Deng, L, et al. County-level COVID-19 vaccination coverage and social vulnerability—United States, December 14, 2020–march 1, 2021. MMWR Morb Mortal Wkly Rep. (2021) 70:431–6. doi: 10.15585/mmwr.mm7012e1
21. Barry, V, Dasgupta, S, Weller, DL, Kriss, JL, Cadwell, BL, Rose, C, et al. Patterns in COVID-19 vaccination coverage, by social vulnerability and Urbanicity—United States, December 14, 2020–may 1, 2021. MMWR Morb Mortal Wkly Rep. (2021) 70:818–24. doi: 10.15585/mmwr.mm7022e1
25. United states Census Bureau. Tiger/Line shapefiles (2019). Available at: https://www.census.gov/geographies/mapping-files/time-series/geo/tiger-line-file.html
26. Luc, A, and Xun, L. GeoDa: An introduction to spatial data analysis. Chicago, USA: The University of Chicago. (2022).
27. R Core Team. R: a language and environment for statistical computing. Vienna: R Foundation for Statistical Computing (2022).
29. Cohen, J, Cohen, P, West, SG, and Aiken, LS. Applied multiple regression/correlation analysis for the behavioral sciences. 3rd ed. Mahwah, NJ: Lawrence Erlbaum Associates Publishers (2003).
30. Dohoo, I, Martin, W, and Stryhn, H. Methods in epidemiologic research. Charlottetown: VER Inc. (2012).
31. Simes, RJ. An improved Bonferroni procedure for multiple tests of significance. Biometrika. (1986) 73:751–4. doi: 10.1093/biomet/73.3.751
32. Nakaya, T, Fotheringham, AS, Brunsdon, C, and Charlton, M. Geographically weighted Poisson regression for disease association mapping. Stat Med. (2005) 24:2695–717. doi: 10.1002/sim.2129
33. Warf, B. Geographically weighted regression: encyclopedia of geography. Thousand Oaks, CA: SAGE Publications, Inc. (2010).
35. Khan, MM, Roberson, S, Reid, K, Jordan, M, and Odoi, A. Geographic disparities and temporal changes of diabetes prevalence and diabetes self-management education program participation in Florida. PLoS One. (2021) 16:e0254579. doi: 10.1371/JOURNAL.PONE.0254579
37. Khan, MM, Roberson, S, Reid, K, Jordan, M, and Odoi, A. Prevalence and predictors of stroke among individuals with prediabetes and diabetes in Florida. BMC Public Health. (2022) 22:243. doi: 10.1186/s12889-022-12666-3
38. Patwary, AL, and Khattak, AJ. Interaction between information and communication technologies and travel behavior: using behavioral data to explore correlates of the COVID-19 pandemic. Transportation Research Record. (2022). doi: 10.1177/03611981221116626
39. Patwary, AL, and Khattak, AJ. Crash harm before and during the COVID-19 pandemic: evidence for spatial heterogeneity in Tennessee. Accid Anal Prev. (2023) 183:106988. doi: 10.1016/j.aap.2023.106988
40. The Office of Primary Care and Rural Health. Healthcare delivery sites in rural Missouri. Jefferson City, MO: (2017).
41. Fisher, KA, Bloomstone, SJ, Walder, J, Crawford, S, Fouayzi, H, and Mazor, KM. Attitudes toward a potential SARS-CoV-2 vaccine. Ann Intern Med. (2020) 173:964–73. doi: 10.7326/M20-3569
42. Callaghan, T, Moghtaderi, A, Lueck, JA, Hotez, P, Strych, U, Dor, A, et al. Correlates and disparities of intention to vaccinate against COVID-19. Soc Sci Med. (2021) 272:113638. doi: 10.1016/j.socscimed.2020.113638
43. Mollalo, A, and Tatar, M. Spatial modeling of COVID-19 vaccine hesitancy in the United States. Int J Environ Res Public Health. (2021) 18:9488. doi: 10.3390/ijerph18189488
44. Beleche, T, Kolbe, A, Bush, L, and Sommers, B. Unvaccinated for COVID-19 but willing: demographic factors, geographic patterns, and changes over time. Washington, DC: United States Department of Health and Human Services. (2021).
45. Svendsen, MT, Bak, CK, Sørensen, K, Pelikan, J, Riddersholm, SJ, Skals, RK, et al. Associations of health literacy with socioeconomic position, health risk behavior, and health status: a large national population-based survey among Danish adults. BMC Public Health. (2020) 20:1–12. doi: 10.1186/S12889-020-08498-8/FIGURES/2
46. Donadio, G, Choudhary, M, Lindemer, E, Pawlowski, C, and Soundararajan, V. Counties with lower insurance coverage and housing problems are associated with both slower vaccine rollout and higher COVID-19 incidence. Vaccine. (2021) 9:973. doi: 10.3390/vaccines9090973
47. Kreps, S, Prasad, S, Brownstein, JS, Hswen, Y, Garibaldi, BT, Zhang, B, et al. Factors associated with US adults’ likelihood of accepting COVID-19 vaccination. JAMA Netw Open. (2020) 3:e2025594. doi: 10.1001/jamanetworkopen.2020.25594
48. Khubchandani, J, and Macias, Y. COVID-19 vaccination hesitancy in Hispanics and African-Americans: a review and recommendations for practice. Brain Behav Immun Heal. (2021) 15:100277. doi: 10.1016/j.bbih.2021.100277
Keywords: COVID-19, Missouri, spatial epidemiology, epidemiology, geographic disparities, predictors, vaccination
Citation: Lacy A, Khan MM, Deb Nath N, Das P, Igoe M, Lenhart S, Lloyd AL, Lanzas C and Odoi A (2024) Geographic disparities and predictors of COVID-19 vaccination in Missouri: a retrospective ecological study. Front. Public Health. 12:1329382. doi: 10.3389/fpubh.2024.1329382
Edited by:
Elham Hatef, Johns Hopkins Medicine, United StatesReviewed by:
Eustachio Cuscianna, University of Bari Aldo Moro, ItalyCopyright © 2024 Lacy, Khan, Deb Nath, Das, Igoe, Lenhart, Lloyd, Lanzas and Odoi. This is an open-access article distributed under the terms of the Creative Commons Attribution License (CC BY). The use, distribution or reproduction in other forums is permitted, provided the original author(s) and the copyright owner(s) are credited and that the original publication in this journal is cited, in accordance with accepted academic practice. No use, distribution or reproduction is permitted which does not comply with these terms.
*Correspondence: Agricola Odoi, YW9kb2lAdXRrLmVkdQ==
Disclaimer: All claims expressed in this article are solely those of the authors and do not necessarily represent those of their affiliated organizations, or those of the publisher, the editors and the reviewers. Any product that may be evaluated in this article or claim that may be made by its manufacturer is not guaranteed or endorsed by the publisher.
Research integrity at Frontiers
Learn more about the work of our research integrity team to safeguard the quality of each article we publish.