 Wei Wang1
 Pengfei Sun
 Min Li
- 1Department of Clinical Laboratory, Beijing Friendship Hospital, Capital Medical University, Beijing, China
- 2Department of Ultrasound, Beijing Friendship Hospital, Capital Medical University, Beijing, China
- 3Liver Center, Beijing Friendship Hospital, Capital Medical University, Beijing, China
- 4Clinical Epidemiology and EBM Unit, Beijing Friendship Hospital, Beijing Clinical Research Institute, Capital Medical University, Beijing, China
Objectives: Cognitive impairment has emerged as a major contributing factor to mortality for older adults. Identifying the strong modifiable health metrics against mortality is of high priority, especially in this high-risk population.
Methods: This population-based study used data of US adults aged≥60 years old from the National Health and Nutrition Examination Survey 2011–2014 cycles. De-identified data for participants who completed cognitive function test were extracted. Mortality data was obtained by linking to the 2019 public-use linked mortality file.
Results: Participants with low global cognition had higher risk of all-cause mortality (HR = 1.46; 95%CI, 1.04–2.05). The highest prevalence of ideal level of health metrics was observed for sleep duration (54.36% vs. 62.37%), and the lowest was noted for blood pressure (12.06% vs. 21.25%) for participants with low and average to high global cognition, respectively. Ideal status of physical activity and diet quality were significantly associated with all-cause mortality among participants with low global cognition (HR = 0.48, 95%CI: 0.28–0.82; HR = 0.63, 95%CI: 0.43–0.95). The corresponding population-attributable fractions were 26.58 and 15.90%, respectively.
Conclusion: Low cognitive function was associated with increased risk of all-cause death for older adults. Attainment of healthy metrics, especially sufficient physical activity, consuming healthy diet and being never smoked, provided strong protection against death risk.
Introduction
Longer life expectancy has increasing the proportion of older adults and leads to a commensurate growing prevalence of cognitive impairment worldwide (1). Cognitive impairment, characterized by subtle changes in memory and thinking, is a common phenomenon in older adults and can be seen as a prodrome of Alzheimer disease (2). Recent data suggests that the global prevalence of cognitive impairment is approximately 12%–18% for people aged more than 60 years older, causing an enormous economic burden (3).
Even at mild level, cognitive impairment is linked to an increased mortality risk in older adults (4, 5). Although vascular risk factors and comorbidities might explain the increased mortality associated with cognitive impairment to some extent, cognitive impairment itself has independent implication for mortality throughout the aging process (6). Therefore, it is important to identify the modifiable health metrics as well as the stronger protection ones against all-cause mortality for individuals with cognitive impairment. It is well documented that health behaviors, such as sufficient physical activity and healthy diet, could promote healthy aging and enhance quality of life in adults (7, 8), but the evidence among older adults with cognitive impairment is lacking. Understanding the association between modifiable health metrics and mortality in older adults with cognitive impairment will stimulate further efforts to design and implement intervention strategies.
Herein, we used a nationally representative sample of the United States (US) older adults to assess the impact of modifiable health metrics on mortality, and further estimate the prevented proportion of mortality by reaching ideal health metrics for older adults with cognitive impairment.
Materials and methods
Study design and population
The National Health and Nutrition Examination Survey (NHANES) is a continuous, national survey to estimate the prevalence of and risk factors for major diseases. The NHANES utilizes a complex, multistage, probability sampling design that provides representative samples of the non-institutionalized US resident population (9). The NHANES procedures and protocols were approved by the National Center for Health Statistics Research Ethics Review Board. All participants provided written informed consent.
This study is based on an analysis of data from two NHANES cycles (2011–2012, 2013–2014). De-identified data for participants aged ≥60 years old, who had complete data on cognitive function, were extracted. Mortality status and cause of death were identified by linking to publicly accessible mortality files (10). All-cause, cardiovascular (CV) and cancer specific mortality was ascertained based on the underlying causes of death from the International Classification of Diseases codes. The follow-up started from the interview date and ended at death or at the end of the study (December 31, 2019).
Definitions of low global cognition
Cognitive function was assessed for participants aged≥60 years old in NHANES 2011–2012 and 2013–2014 cycles using Consortium to Establish a Registry for Alzheimer’s Disease test (CERAD), animal fluency (AF) and digit-symbol substitution test (DSST).
The CERAD Word Learning test is a measure of immediate and delayed recall memory, using a list of 10 unrelated words. The immediate learning part consisted of three consecutive tests, where participants were requested to read the word list and recall as many as possible. This process was repeated three times with the order of words changed (11). In delayed recall part, participants were requested to recall the 10 words after approximately 8–10 min (12). The AF test is a measure of verbal fluency, where participants were asked to name as many animals as possible in 1 min, with the total score ranging from 0 to 40 (12). The DSST Test, a measure of processing speed, sustained attention and working memory, in which participants were asked to draw as many symbols paired with numbers as possible within 2 min, and the score is the total number of correct matches (13, 14).
The scores of each cognitive test were Z-score transformed. The overall cognitive score was calculated as the average of the standardized scores of the three cognitive tests. Because there was no well-defined standard regarding the threshold for identifying low cognitive performance, we selected participants with an overall cognitive score in the lowest quartile (the 25th percentile) to indicate low global cognition (15–17). Meanwhile, participants with an overall cognitive score higher than that at the 25th percentile were defined as having average to high global cognition.
Definitions of modifiable health metrics
In this study, modifiable health metrics included six health behaviors (physical activity, diet quality, smoking and alcohol drinking status, sleep duration, and body mass index) and three health factors (total cholesterol, blood pressure and blood glycemic index). To capture more detailed information, modifiable health metrics were first classified into multiple levels in prevalence description, then defined as dichotomized variables with ideal and no ideal status (intermediate or poor) in risk assessment.
According to the NHANES guidelines, physical activity from the household and transportation was defined as moderate activity (18). The minutes of vigorous activity were equal to the doubled minutes of moderate activity (19). In this study, the total amount of physical activity was calculated as the minutes of equivalent moderate activity per week of all domains, and further divided into 3 levels: 0, 0.1 to 149.9, 150 min/wk. or greater (20, 21). Diet quality was assessed by the Healthy Eating Index 2015 (HEI-2015), which is a measure of dietary adherence to the 2015–2020 Americans Dietary Guidelines (22, 23). The HEI-2015 score equal or greater than 60.0 was recognized as consuming healthy diet (24). Smoking status was categorized into 3 groups: never smoked (less than 100 cigarettes per lifetime), former smoker (more than 100 cigarettes per lifetime but has quit), current smoker (more than 100 cigarettes per lifetime and currently are still smoking). Alcohol drinker was defined as had at least 12 drinks of any type of alcoholic beverage in any 1 year. Sleep duration was categorized into 3 levels: less than 7, 7 to 8, more than 8 h. Body mass index was calculated as weight in kilograms divided by height in meters squared and categorized into 3 levels: 18.5 to 24.9, 25.0 to 29.9, 30.0 kg/m2 or greater.
In addition, blood pressure was categorized as ideal (untreated systolic blood pressure (SBP) < 120 mmHg, diastolic blood pressure (DBP) < 80 mmHg), intermediate (SBP 120–139 mmHg, DBP 80–89 mmHg or treated), and poor (SBP ≥ 140 mmHg, DBP ≥ 90 mmHg). Total serum cholesterol was divided into 3 levels: untreated cholesterol≤200 mg/dL, 200–239 mg/dL or treated, and ≥ 240 mg/dL. Blood glycemic index was divided by HbA1c into 3 levels: less than 5.7%, 5.7–6.4%, and 6.5% or greater.
Covariates
A set of covariates were taken into consideration. Information on age, gender, race and ethnicity, educational level, health insurance, family income, marital status, and disease history (congestive heart failure, coronary heart disease, stroke, cancer/malignancy, diabetes, metabolic syndrome) was collected. Age was divided into 5 levels: 60–64, 65–69, 70–74, 75–79, and ≥ 80. We reported gender, race and ethnicity as listed in the NHANES dataset. Education was divided into 2 groups (high school or less, some college or higher). Health insurance was categorized into 3 groups: private insurance (any private health insurance, Medi-Gap, and single-service plan), public insurance (Medicare, Medicaid, military healthcare, Indian Health Service, state-sponsored health plan, and other government insurance), and no insurance. Family income was defined by the poverty income ratio (PIR) as low (PIR ≤ 1.3), middle (PIR 1.3–3.5), and high (PIR > 3.5). Marital status was categorized into 4 groups: married, never married, living with a partner, and other. Disease history of congestive heart failure, coronary heart disease, stroke, and cancer/malignancy was defined as an affirmative response to the question, “Ever been told you have the corresponding disease?” Diabetes was defined as self-reported medical history of diabetes, using anti-diabetic medication or a fasting glucose level ≥ 126 mg/dL. Metabolic syndrome was defined based on the Adult Treatment Panel III criteria in 2005 (25).
Statistical analysis
For the description of demographic characteristics, continuous variables were represented by median with interquartile and categorical variables by unweighted counts with weighted percentage. Differences between groups were evaluated using chi-square test for categorical variables.
Cox proportional hazard model was performed to assess the association of low global cognition with mortality. According to the classification of confounding covariates, they were progressively added to 5 adjustment models in addition to the univariate analysis (model 1): model 2, adjusted for age and gender; model 3, adjusted for socio-demographic variables including age, gender, race and ethnicity, educational level, health insurance, family income, marital status and NHANES cycle; model 4, additionally adjusted for disease history including congestive heart failure, coronary heart disease, stroke, cancer/malignancy, diabetes, and metabolic syndrome; model 5, additionally adjusted for health behaviors including physical activity, diet quality, smoking and alcohol drinking status, sleep duration, and body mass index; model 6, additionally adjusted for health factors including blood pressure, total serum cholesterol, and glycemic index. Each of the above variables was entered in the Cox proportional hazard model as separate covariates. Further, hazard ratios (HRs) of each ideal health metric as well as the number of ideal health metrics on mortality stratified by cognitive status were estimated in model 5, with no ideal status being set as reference. The variance inflation factor (VIF) was calculated to test multicollinearity, with a value of 5 or more indicating the presence of multicollinearity. The proportion of mortality that would have been prevented by reaching ideal health metric was estimated by population-attributable fraction (PAF) (26).
According to NHANES analytic guidelines, complex sampling design and sampling weights were taken into account in our analyses to produce national estimates (27). Sampling weight was reweighted in using combined NHANES cycles: fasting subsample 4-year mobile examination center (MEC) weight = fasting subsample 2-year MEC weight/2. Statistical analyses were done using SAS version 9.4 (SAS Inc., Cary, NC, United States). All analyses were two-sided, with a p-value less than 0.05 as statistical significance.
Results
Characteristics of the participants
Of 3,632 participants aged ≥60 years old, 436 were excluded for not performing cognitive tests. We also excluded 262 participants with missing data in calculating the overall cognitive score and another 10 with expected survival period less than 6 months. Therefore, a total of 2,924 participants were enrolled in the present analysis.
Compared to those with average to high global cognition, participants with low global cognition tended to be older, less educated, having less private insurance, with lower annual household income, and were less likely to be married and Non-Hispanic White. Participants with low global cognition showed a higher prevalence of congestive heart failure, stroke, and diabetes (Table 1).
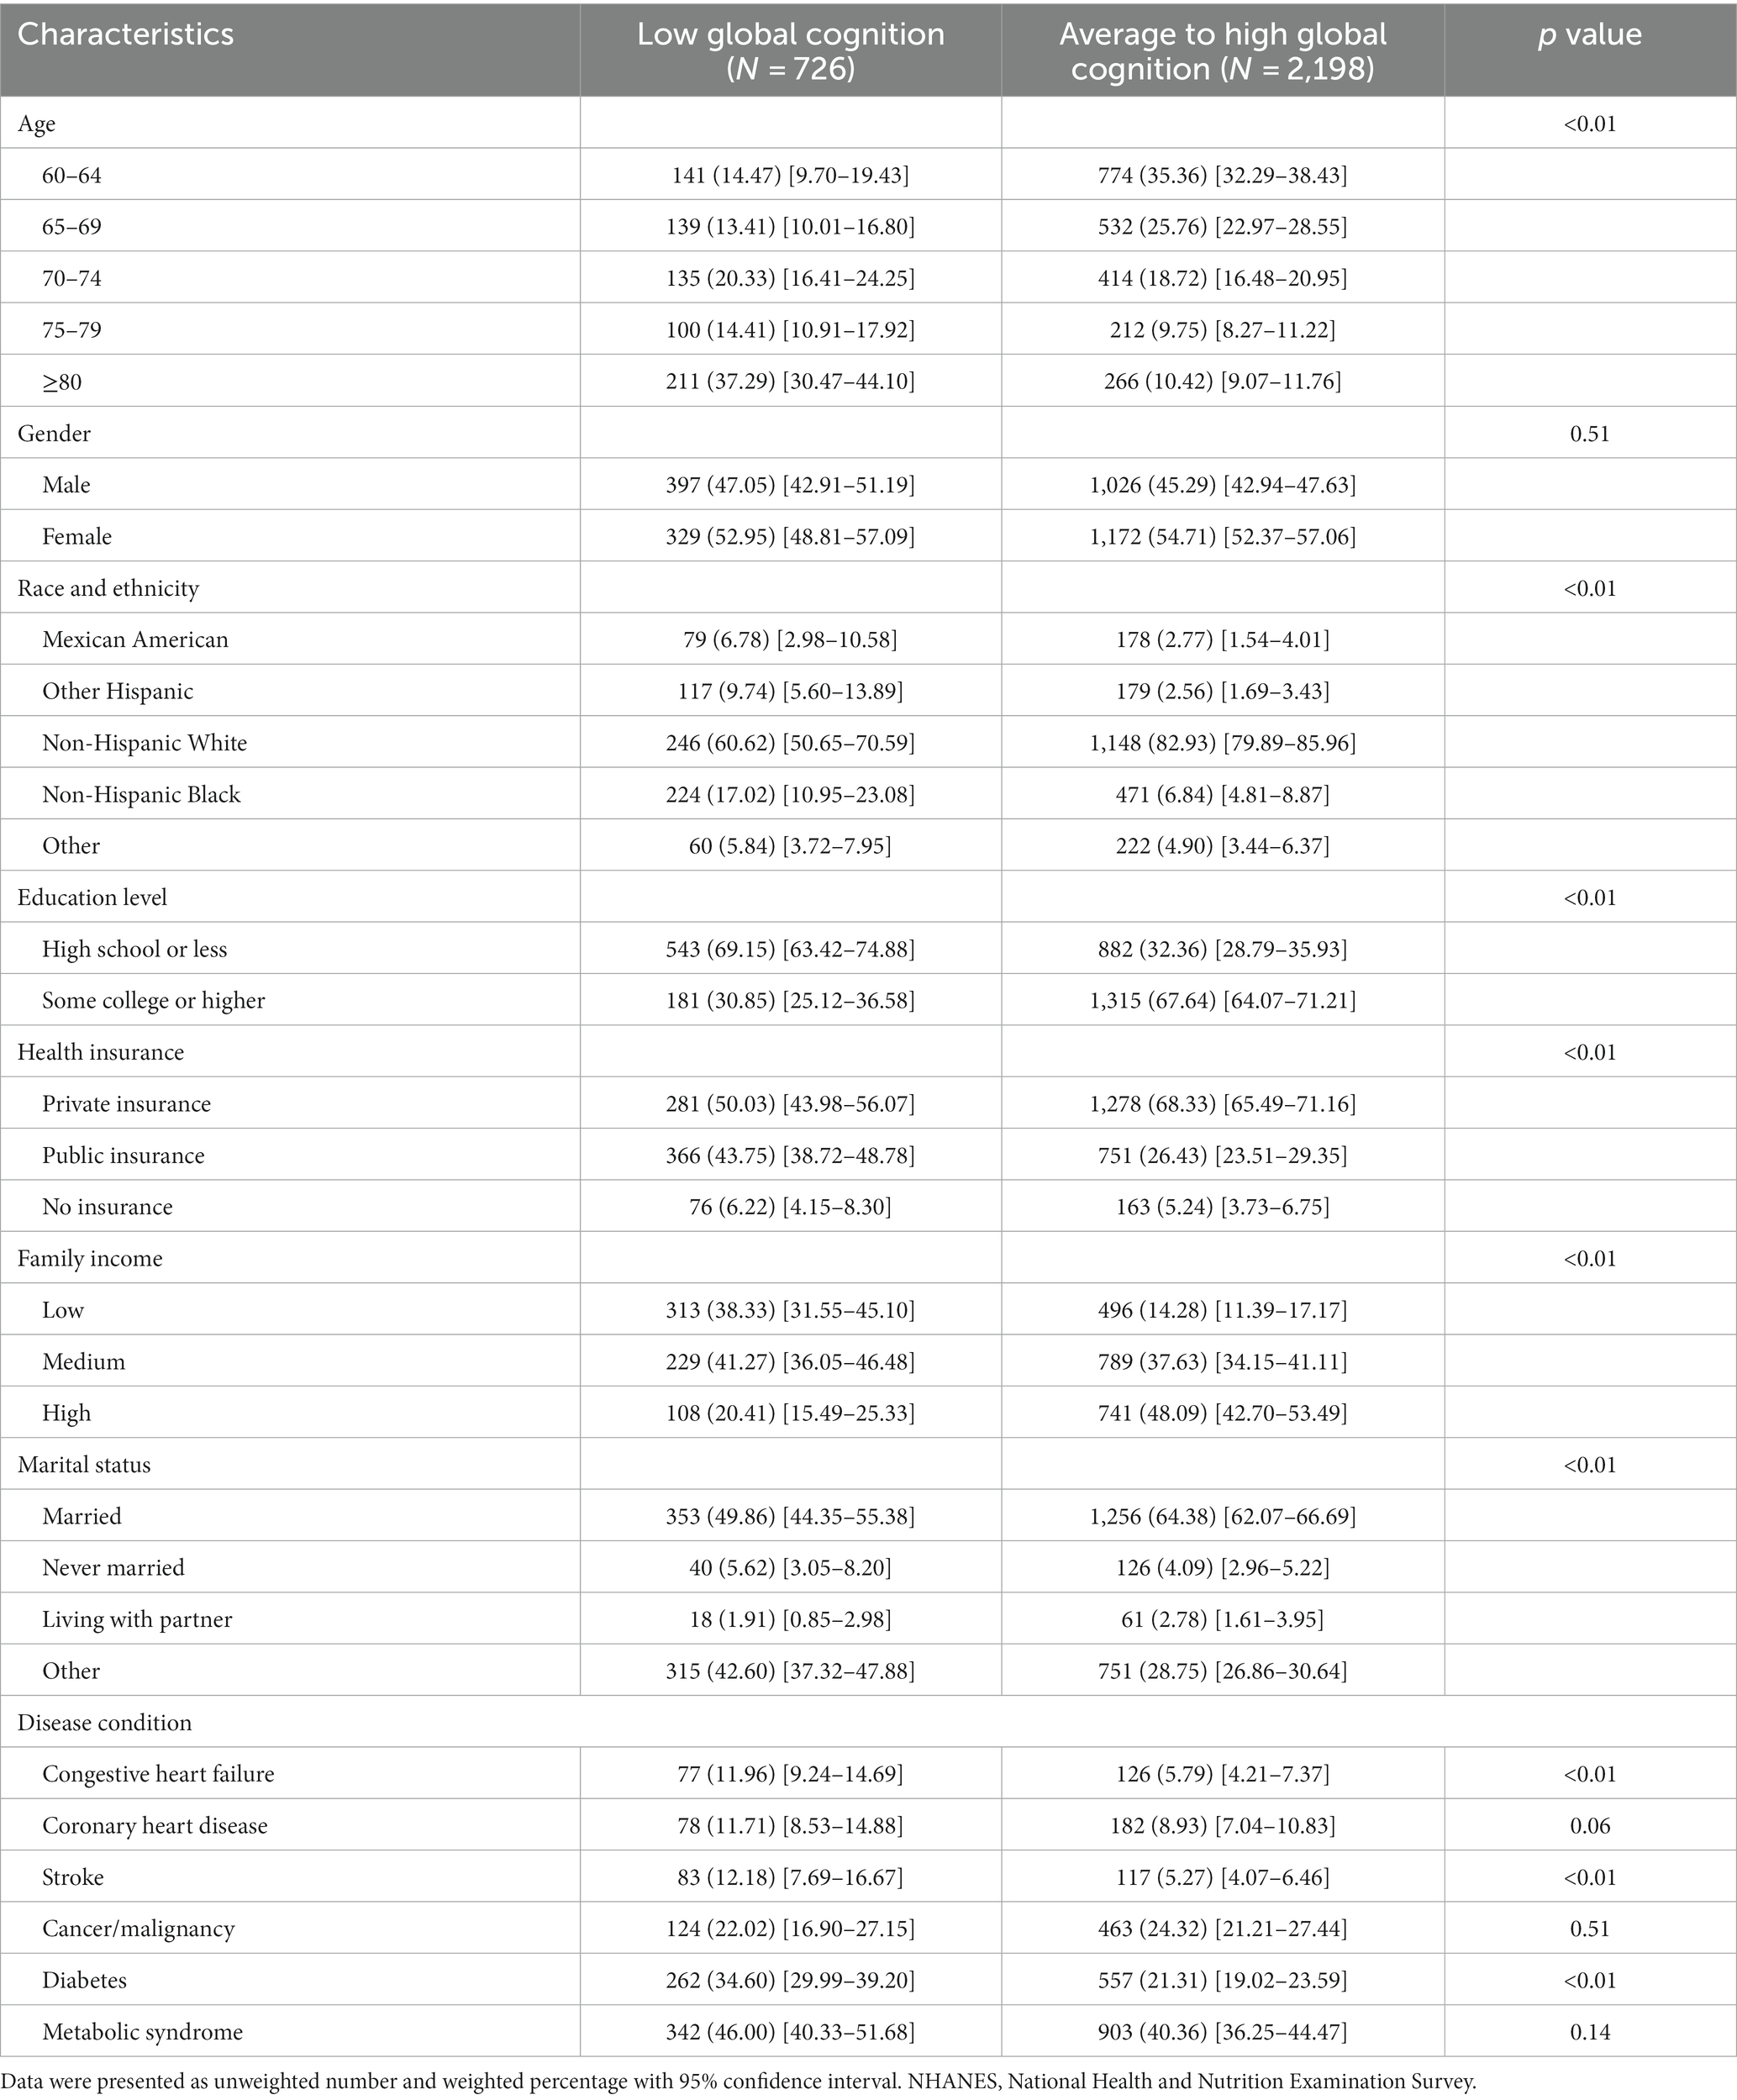
Table 1. Baseline characteristics of the study participants by cognitive status in the NHANES 2011–2014 cycles.
Prevalence of modifiable health metrics
Participants with low global cognition were less engaged in physical activity, less likely to be alcohol drinkers, and had longer sleep duration as well as increased blood pressure and glycemic index. Yet, decreased total cholesterol was also observed among these participants. The highest prevalence of ideal level of health metrics was observed for regular sleep duration (54.36% vs. 62.37%), and the lowest prevalence was noted for blood pressure (12.06% vs. 21.25%) among participants with low and average to high global cognition, respectively (Table 2).
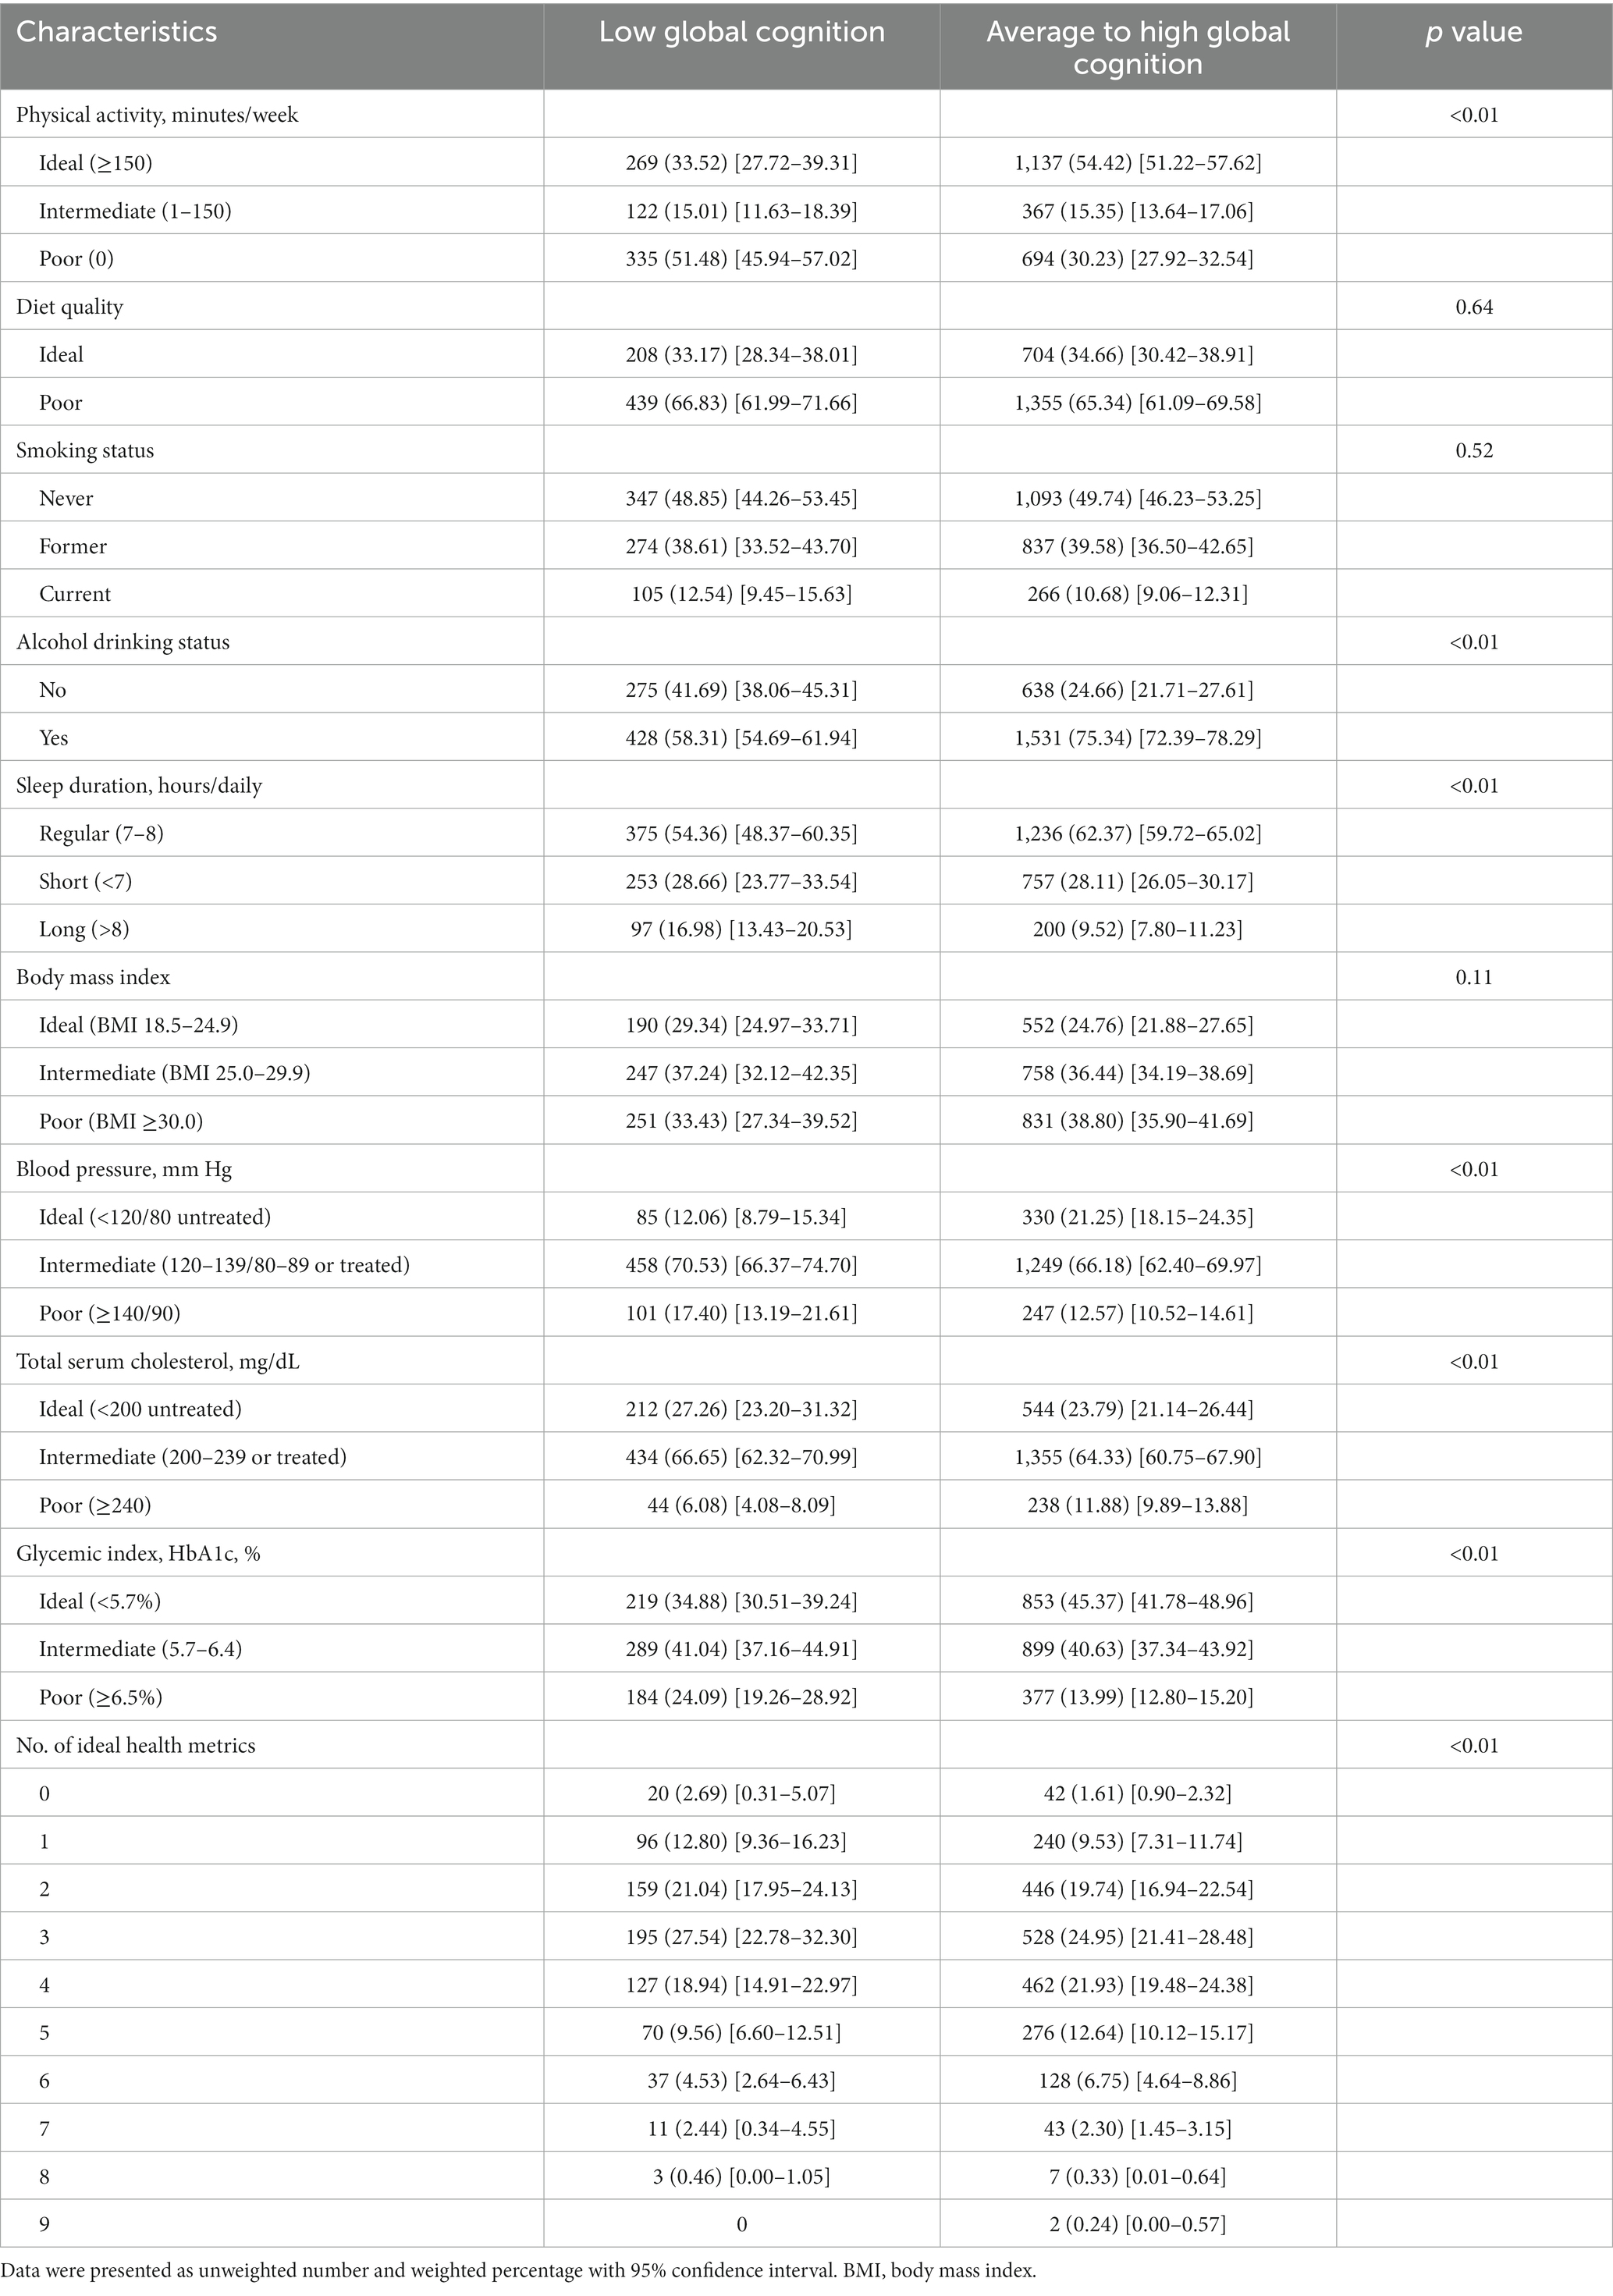
Table 2. Prevalence of modifiable health metrics among older adults, stratified by cognitive status.
Compared to those with average to high global cognition, participants with low global cognition tended to meet a lower number of ideal health metrics (15.49% vs. 11.14% for ≤1 ideal health metric and 16.99% vs. 22.26% for ≥5 ideal health metrics).
Impact of cognitive function on mortality
At a median follow-up of 6.58 years, 569 participants died (191 CV deaths, 145 cancer deaths). Participants with low global cognition had higher all-cause mortality than those with average to high global cognition (40.03% vs. 13.55%). When adjusting for a series of covariates, the association of cognitive function with all-cause mortality weakened but was still significant (HR = 1.46; 95% confidence interval, CI, 1.04–2.05) (Figure 1; Supplementary Table S1).
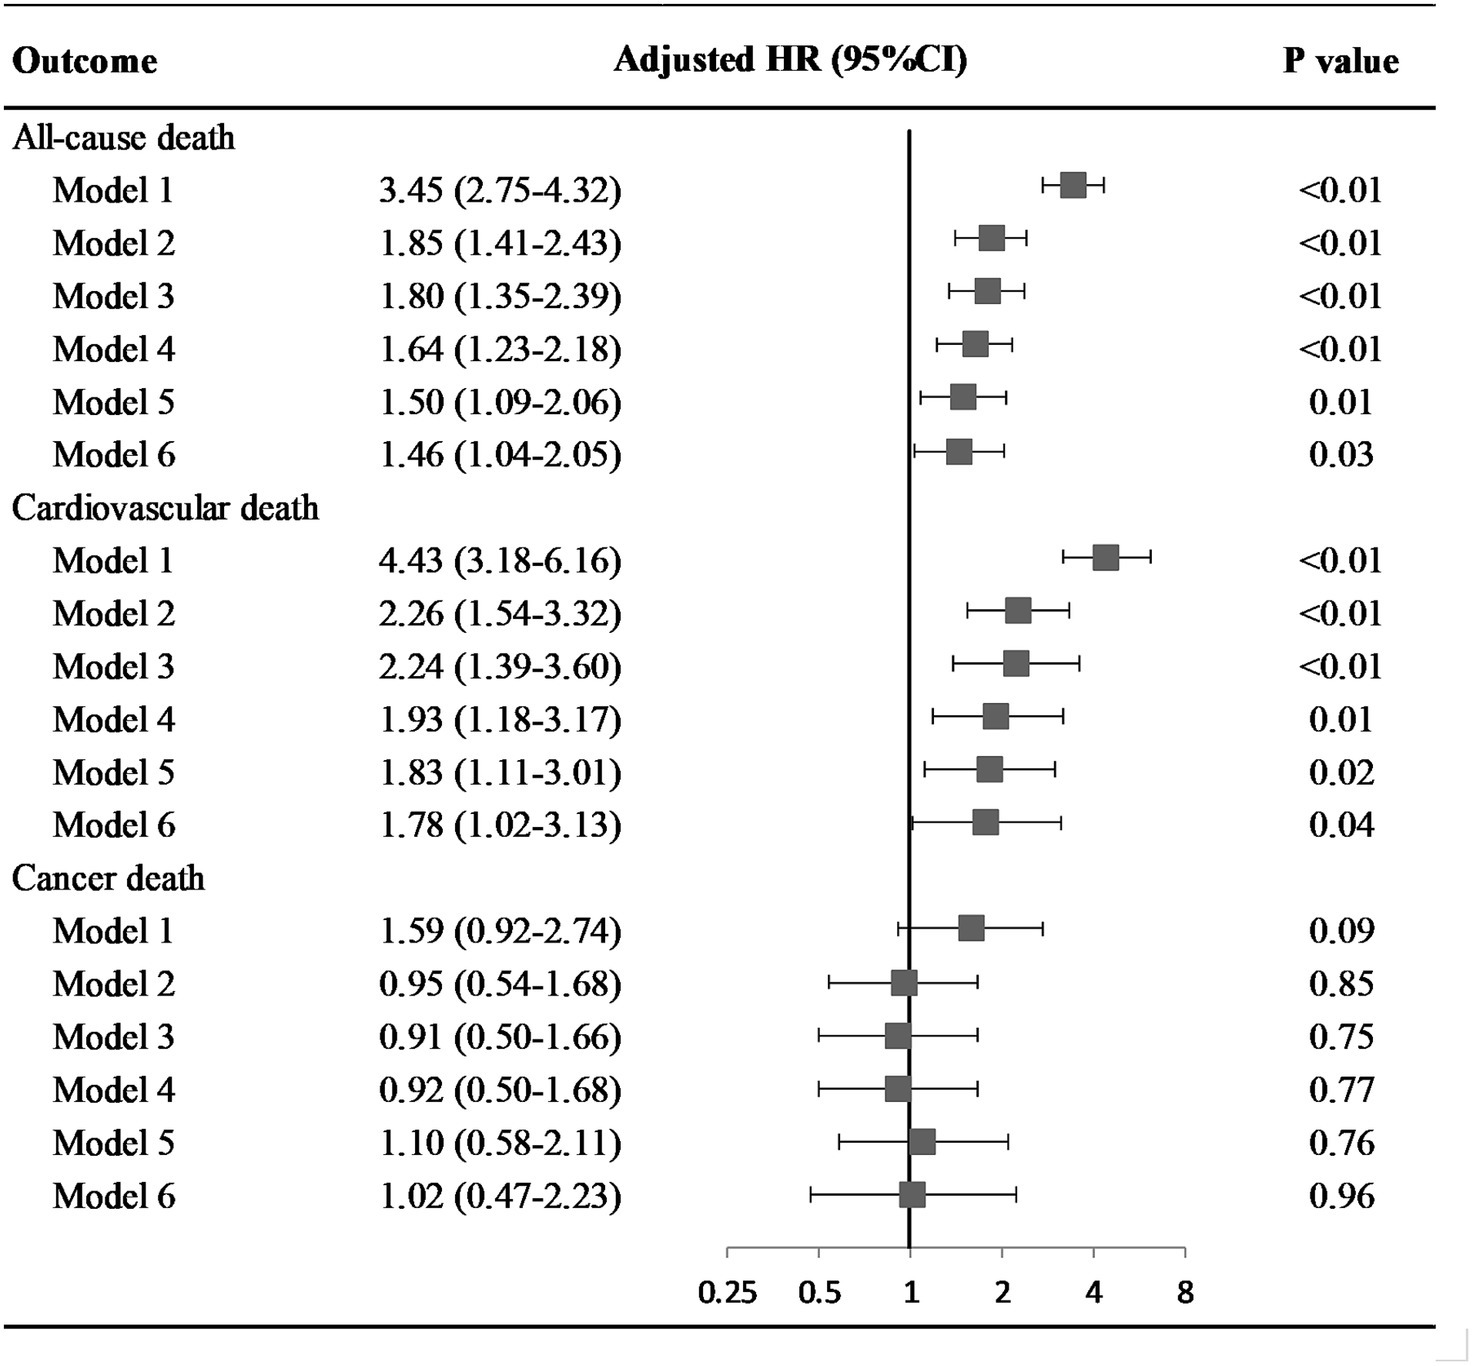
Figure 1. Hazard ratio of cognitive status on all-cause and disease specific death among older adults. Model 1: univariate model; Model 2: adjusted for age and gender; Model 3: adjusted for socio-demographic variables (age, gender, race and ethnicity, educational level, health insurance, family income, marital status), and NHANES cycle; Model 4: adjusted for socio-demographic variables, disease history (congestive heart failure, coronary heart disease, stroke, cancer/malignancy, diabetes, metabolic syndrome), and NHANES cycle; Model 5: adjusted for socio-demographic variables, disease history, health behaviors (physical activity, diet quality, smoking and alcohol drinking status, sleep duration, and body mass index), and NHANES cycle; Model 6: adjusted for socio-demographic variables, disease history, health behaviors, health factors (blood pressure, total serum cholesterol, and glycemic index), and NHANES cycle. Abbreviation: HR, hazard ratio; CI, confidence interval.
Increased risk of CV death was revealed in participants with low global cognition (adjusted HR = 1.78; 95%CI, 1.02–3.13). However, low global cognition was not associated with cancer death in crude and fully adjusted models, with HRs and 95%CI of 1.59 (0.92–2.74) and 1.02 (0.47–2.23) respectively.
Impact of modifiable health metrics on mortality, stratified by cognitive status
After multivariable adjustment, ideal physical activity and diet quality were significantly associated with lower risk of all-cause death for participants with low global cognition (HR = 0.48, 95%CI: 0.28–0.82; HR = 0.63, 95%CI: 0.43–0.95). The adjusted PAFs indicated that 26.58 and 15.90% of all-cause deaths could be potentially averted by achieving the ideal level of physical activity and diet quality, respectively. Meanwhile, ideal smoking status and physical activity provided the significant protection against all-cause death for participants with average to high global cognition (HR = 0.64, 95%CI: 0.47–0.86; HR = 0.72, 95%CI: 0.52–1.00), with the adjusted PAFs of 22.09 and 17.14%, respectively. Further, with the number of ideal health metrics increased, reduced risk of all-cause death was observed for participants with average to high global cognition (p < 0.05). The protection was significant after achieving one ideal health metric (HR = 0.27, 95% CI: 0.09–0.85). Although protection against all-cause death was observed for participants with low global cognition, the associations were not significant (Table 3; Supplementary Table S2).
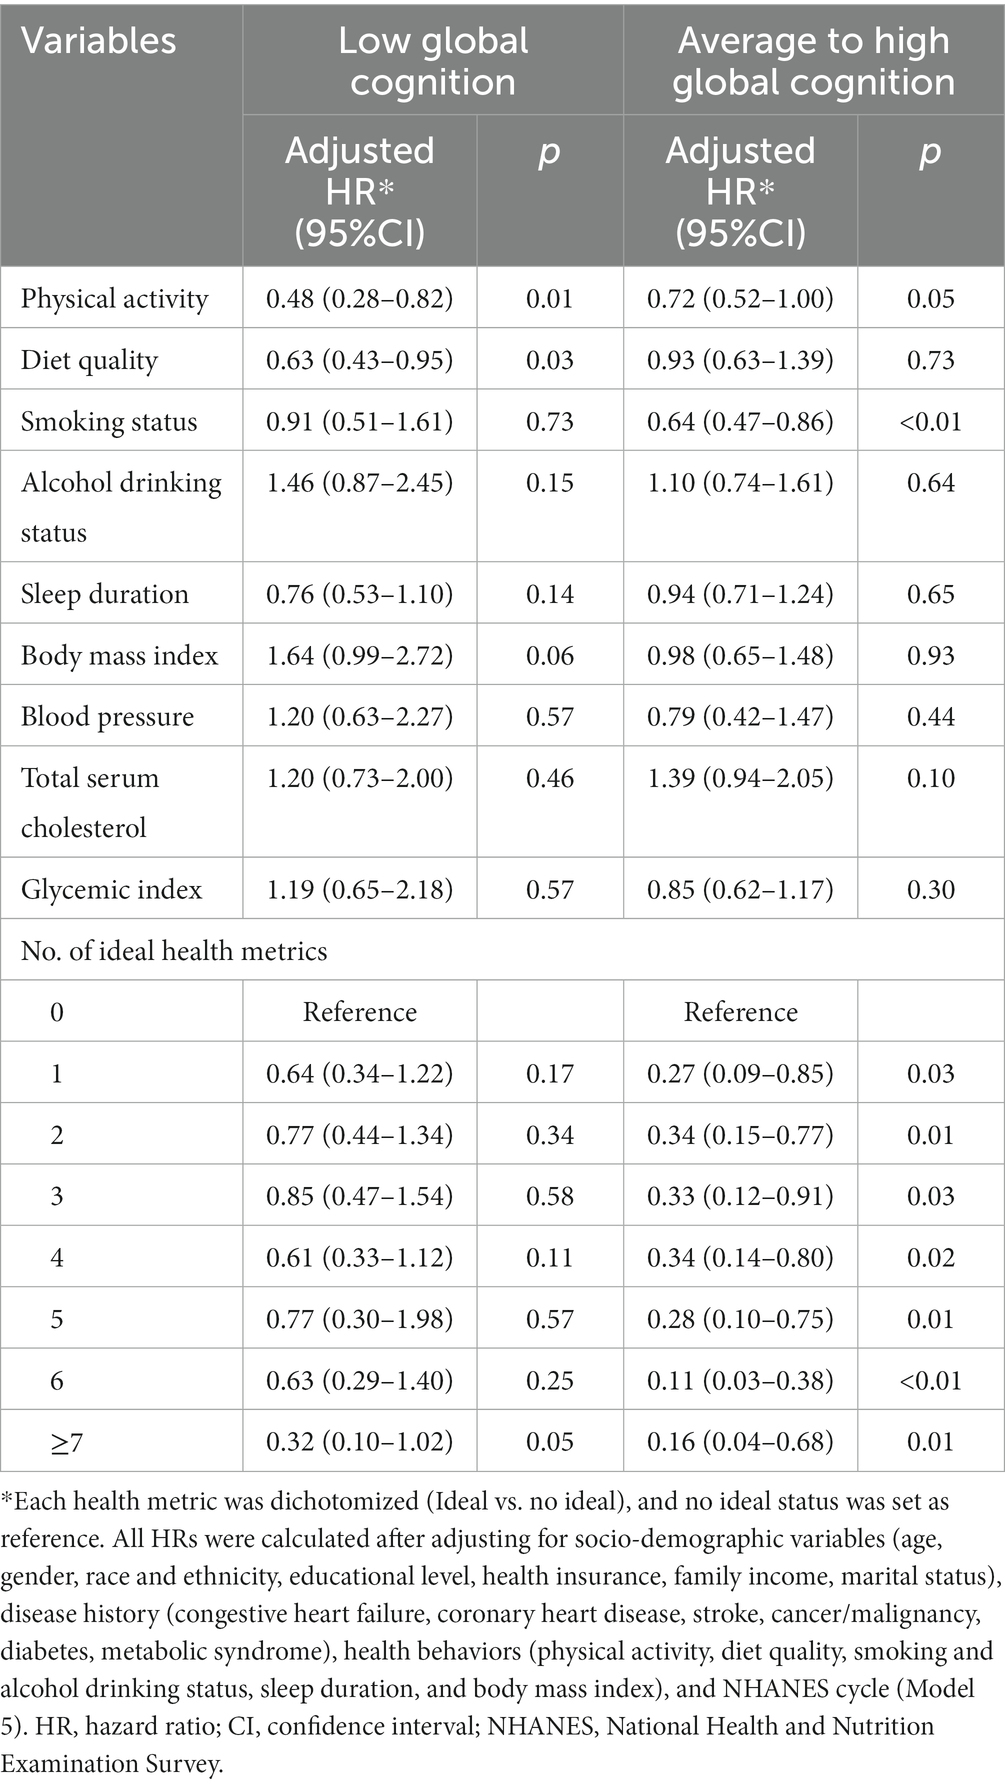
Table 3. Hazard ratios of modifiable health metrics on all-cause death among older adults, stratified by cognitive status.
Regardless of cognitive status, ideal physical activity was significantly associated with lower risk of CV death, with HRs of 0.49 (0.24–0.99) for low global cognition and 0.33 (0.17–0.64) for average to high global cognition. The corresponding PAFs for physical activity were 26.03 and 52.24%, respectively. Additionally, ideal smoking status significantly decreased the risk of CV death and contributed an adjusted PAF of 31.16% for participants with average to high global cognition. Generally, the risk of CV death decreased with increasing number of ideal health metrics for participants with average to high global cognition, but the associations were not observed for participants with low global cognition (Table 4; Supplementary Table S3).

Table 4. Hazard ratios of modifiable health metrics on cardiovascular death among older adults, stratified by cognitive status.
Further, ideal smoking status and physical activity significantly reduced the risk of cancer death for participants with low global cognition (HR = 0.08, 95%CI: 0.01–0.49; HR = 0.12, 95%CI: 0.03–0.53). The corresponding PAFs were 84.97% and 71.19%, respectively. However, no modifiable health metric was found to be associated with cancer death among participants with average to high global cognition. Regardless of cognitive status, no association of number of ideal health metrics and risk of cancer death was observed (Table 5; Supplementary Table S4).
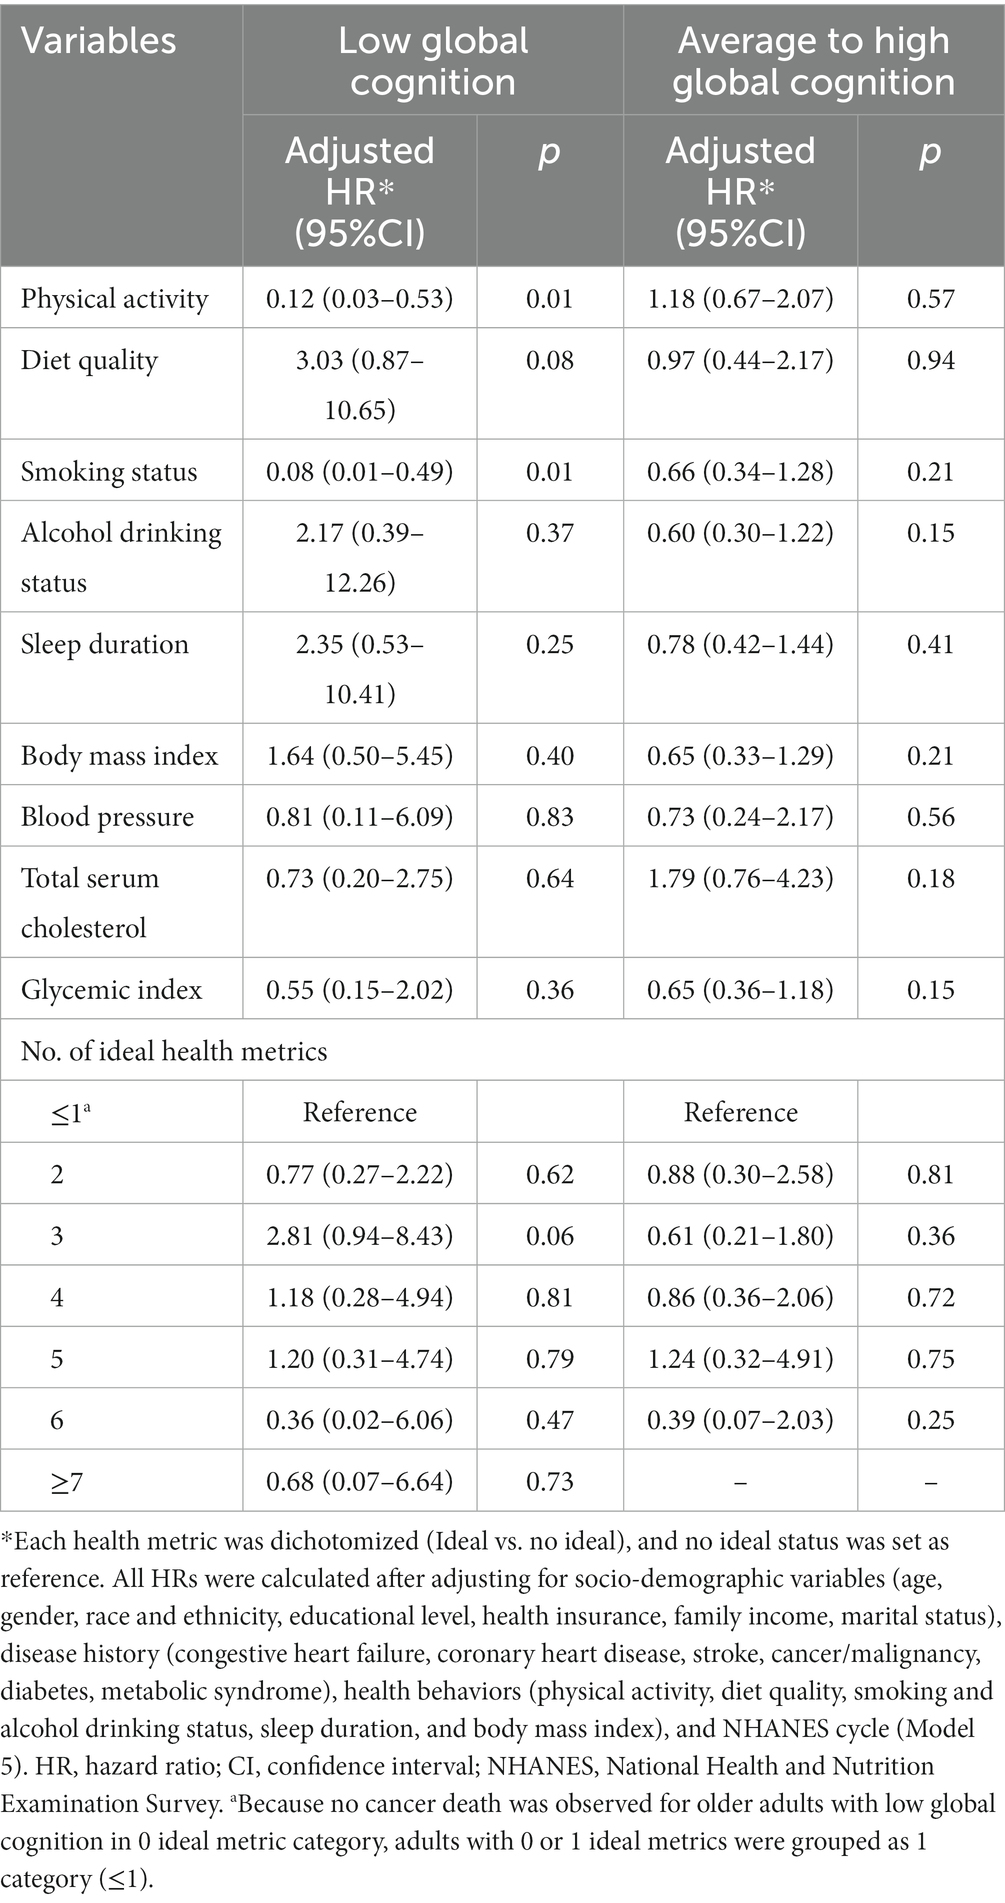
Table 5. Hazard ratios of modifiable health metrics on cancer death among older adults, stratified by cognitive status.
Discussion
Our findings suggested that low cognitive function was associated with increased risk of all-cause death for participants aged ≥60 years old. Ideal levels of health metrics, especially sufficient physical activity, healthy diet and never smoked, were associated with significant reduction in death risk. For participants with low global cognition, nearly 27% of all-cause deaths, 26% of CV deaths, and 71% of cancer deaths could be preventable through the attainment of sufficient physical activity. In addition, consuming healthy diet could avert 16% of all-cause deaths and reporting never smoked could avert 85% of cancer deaths.
Some of previous studies indicated that the association of cognitive impairment and death risk is mainly due to the presence of well-established risk factors such as systemic vascular comorbidities (e.g., high blood pressure and diabetes mellitus) (6, 28). In our study, a higher vascular risk profile was indeed observed for individuals with low global cognition. Moreover, our data showed that low global cognition was associated with a 46% increased mortality risk in elders, regardless of the influence of classic vascular risk factors. Thus, monitoring cognition function regularly among older adults may help to identify populations at high risk of death for in-time intervention to improve prognosis. Additionally, the relation of cognitive function and disease-specific death (e.g., CV death and cancer death) may show different patterns, which need to be validated by more studies.
Studies addressing the impact of modifiable health metrics and cognitive function for the risk of mortality are scarce. This is particularly important in older adults given their increased risk of comorbidities and unhealthy metrics. In this study, our findings highlighted the importance of maintaining ideal level of health metrics for older adults. Regardless of cognitive status, sufficient physical activity provided protection against all-cause mortality. Our findings are consistent with previous studies. A population-based cohort of older adults in Spain revealed that cognitive frailty was more markedly associated with increased mortality in inactive older adults, and being active reduced the mortality risk among cognitively frail individuals by 36% (29). Another national sample of community-dwelling Taiwanese aged 65 years or older suggested that having a physically active lifestyle has beneficial effects on survival in older persons with either frailty/pre-frailty or cognitive impairment (30). Based on the available evidence, the association seems biologically plausible. Several studies suggested that physical activity could reduce the risk of death through several pathways, including increased antioxidant defenses and NO bioactivity, improved endothelial function, decreased systemic inflammation, and reduced psychosocial stress (31–33). Taking together, these evidences highlight the benefits of sufficient physical activity in reducing death risk even in older adults with cognitive impairment. Meanwhile, it is very important to pay attention to the possible bidirectional association between physical activity and cognitive function. That is, less physical activity can directly attribute to the decline of cognitive function, while the decrease in physical activity can also be the result of cognitive impairment (34, 35). Besides, an increasing body of evidence suggests that the presence of ideal health metrics during mid-life has an impact on later life cognition (36). In individuals with cognitive impairment, in general, at early stages of the disease, engaging in physical activity induces improvements in executive functions, memory, and cognitive tests (37). Thus, it is crucial to maintain the ideal health metrics for older adults to prevent and delay cognitive decline as well as lower death risk at the earliest stage possible.
Smoking status is another health metric worthy noticing. Data suggested that among participants with low global cognition, a healthy benefit against cancer death may be gained for reporting as never smoked. Meanwhile, smoking was also a large contributor to all-cause and CV death for participants with average to high global cognition, where approximately 22% and 31% of corresponding death events could be averted if the smoking status was ideal. Besides, particular attention should be paid to the cessation of smoking in either group. Although three health metrics (physical activity, diet quality and smoking status) were observed to significantly reduce the risk of death, our analysis did not find that the other six metrics, including alcohol drinking status, regular sleep duration, body mass index, blood pressure, total serum cholesterol, and glycemic index, significantly contributed to the reduction of mortality. Our results differed from previous studies on the protective effect of these six health metrics (38, 39). One explanation of the inconsistency is that these metrics may be correlated to the other three metrics such that if these three metrics are addressed, they may have an indirect effect on mortality. It has been reported that physical activity is associated with weight loss, lower blood glucose, and lower blood cholesterol. On the other hand, the benefit of certain health metrics might be underestimated after adjustment for a considerable set of confounders. Specifically, controlling for diabetes as part of the disease history covariate may make the estimate for glycemic index more conservative.
Further, our results indicated that among participants with average to high global cognition, the risk of all-cause and CV death decreased as the number of ideal health metrics increased. However, this protection was not significant for participants with low global cognition. One explanation for this may be the discrepant prevalence of each ideal health metrics depending on the cognitive status, and their different impact in lowering the risk of mortality. Given the potential benefits and that all components of these health metrics are modifiable via treatment and lifestyle modification; there is a need to improve these health metrics especially in subjects with low cognition function.
The strengths of this study included the contribution to the limited evidence examining the modifiable health metrics against mortality for older adults with cognitive impairment, and were the first to report PAFs of these modifiable factors for all-cause and disease-specific deaths. Besides, the NHANES includes a large, population-based, nationally representative sample of older US adults, which provided excellent extrapolation to the entire US population. Meanwhile, this study had some limitations. First, potential changes in cognitive function between initial measurement and death were not assessed. We were unable to determine the changes in cognitive function and its impact on mortality. Second, not all modifiable health metrics were analyzed due to the limitation of data. Third, there is possibility of misclassification of certain metrics as a result of being self-reported measures, and subjects with cognitive impairment may have more risk to self-report inaccurate data. Finally, the results were derived from participants aged ≥60 years old. It may not be extrapolated to the whole population.
Conclusion
Low cognitive function was associated with increased risk of all-cause death for older adults, independent of classic vascular risk factors. This study highlighted that health metrics of sufficient physical activity, healthy diet and being never smoked, provided significant protection against death risk. Interventions to reinforce the modifiable health metrics to ideal levels were necessary for older adult population.
Data availability statement
Publicly available datasets were analyzed in this study. This data can be found here: these data were derived from the following resources available in the public domain: https://www.cdc.gov/nchs/nhanes/index.htm.
Ethics statement
The NHANES procedures and protocols were approved by the National Center for Health Statistics Research Ethics Review Board. The studies were conducted in accordance with the local legislation and institutional requirements. All participants provided written informed consent.
Author contributions
WW: Formal analysis, Writing – original draft. PS: Formal analysis, Supervision, Writing – review & editing. TL: Funding acquisition, Supervision, Writing – review & editing. ML: Conceptualization, Funding acquisition, Supervision, Writing – review & editing.
Funding
The author(s) declare financial support was received for the research, authorship, and/or publication of this article. This work was supported by the National Natural Science Foundation of China under Grant No. 82103902 and Grant No. 82100633.
Conflict of interest
The authors declare that the research was conducted in the absence of any commercial or financial relationships that could be construed as a potential conflict of interest.
Publisher’s note
All claims expressed in this article are solely those of the authors and do not necessarily represent those of their affiliated organizations, or those of the publisher, the editors and the reviewers. Any product that may be evaluated in this article, or claim that may be made by its manufacturer, is not guaranteed or endorsed by the publisher.
Supplementary material
The Supplementary material for this article can be found online at: https://www.frontiersin.org/articles/10.3389/fpubh.2024.1304876/full#supplementary-material
References
1. Kontis, V, Bennett, JE, Mathers, CD, Li, G, Foreman, K, and Ezzati, M. Future life expectancy in 35 industrialised countries: projections with a Bayesian model ensemble. Lancet. (2017) 389:1323–35. doi: 10.1016/S0140-6736(16)32381-9
2. Langa, KM, and Levine, DA. The diagnosis and management of mild cognitive impairment: a clinical review. JAMA. (2014) 312:2551–61. doi: 10.1001/jama.2014.13806
3. 2022 Alzheimer's disease facts and figures. Alzheimers Dement. (2022) 18:700–89. doi: 10.1002/alz.12638
4. Perna, L, Wahl, HW, Mons, U, Saum, KU, Holleczek, B, and Brenner, H. Cognitive impairment, all-cause and cause-specific mortality among non-demented older adults. Age Ageing. (2015) 44:445–51. doi: 10.1093/ageing/afu188
5. Sachs, GA, Carter, R, Holtz, LR, Smith, F, Stump, TE, Tu, W, et al. Cognitive impairment: an independent predictor of excess mortality: a cohort study. Ann Intern Med. (2011) 155:300–8. doi: 10.7326/0003-4819-155-5-201109060-00007
6. Zhu, Z, and Liao, H. Impact of cognitive impairment and systemic vascular comorbidities on risk of all-cause and cardiovascular mortality: National Health and nutrition examination survey 1999 to 2002. Int J Cardiol. (2020) 300:255–61. doi: 10.1016/j.ijcard.2019.11.131
7. Ford, ES, Greenlund, KJ, and Hong, Y. Ideal cardiovascular health and mortality from all causes and diseases of the circulatory system among adults in the United States. Circulation. (2012) 125:987–95. doi: 10.1161/CIRCULATIONAHA.111.049122
8. Yang, Q, Cogswell, ME, Flanders, WD, Hong, Y, Zhang, Z, Loustalot, F, et al. Trends in cardiovascular health metrics and associations with all-cause and CVD mortality among US adults. JAMA. (2012) 307:1273–83. doi: 10.1001/jama.2012.339
9. US Centers for Disease Control and Prevention; National Center for Health Statistics. About the National Health and nutrition examination survey. Available at: https://www.cdc.gov/nchs/nhanes/index.htm (Accessed March 25, 2023)
10. National Center for Health Statistics. NCHS data linked to NDI mortality files. Available at: https://www.cdc.gov/nchs/data-linkage/mortality.htm (Accessed March 25, 2023).
11. Morris, JC, Heyman, A, Mohs, RC, Hughes, JP, van Belle, G, Fillenbaum, G, et al. The consortium to establish a registry for Alzheimer's disease (CERAD). Part I. Clinical and neuropsychological assessment of Alzheimer's disease. Neurology. (1989) 39:1159–65. doi: 10.1212/wnl.39.9.1159
12. Strauss, E, Sherman, EMS, and Spreen, O. A compendium of neuropsychological tests: administration, norms and commentary. 3rd ed. New York: Oxford University Press (2006).
14. Proust-Lima, C, Amieva, H, Dartigues, JF, and Jacqmin-Gadda, H. Sensitivity of four psychometric tests to measure cognitive changes in brain aging-population-based studies. Am J Epidemiol. (2007) 165:344–50. doi: 10.1093/aje/kwk017
15. Han, S, Gao, Y, and Gan, D. The combined associations of depression and cognitive impairment with functional disability and mortality in older adults: a population-based study from the NHANES 2011-2014. Front Aging Neurosci. (2023) 15:1121190. doi: 10.3389/fnagi.2023.1121190
16. Brody, DJ, Kramarow, EA, Taylor, CA, and McGuire, LC. Cognitive performance in adults aged 60 and over: National Health and Nutrition Examination Survey, 2011-2014. Natl Health Stat Rep. (2019) 126:1–23.
17. Huang, G, and Ren, G. Interaction between ω-6 fatty acids intake and blood cadmium on the risk of low cognitive performance in older adults from National Health and Nutrition Examination Survey (NHANES) 2011-2014. BMC Geriatr. (2022) 22:292. doi: 10.1186/s12877-022-02988-7
18. Du, Y, Liu, B, Sun, Y, Snetselaar, LG, Wallace, RB, and Bao, W. Trends in adherence to the physical activity guidelines for Americans for aerobic activity and time spent on sedentary behavior among US adults, 2007 to 2016. JAMA Netw Open. (2019) 2:e197597. doi: 10.1001/jamanetworkopen.2019.7597
19. Zhao, G, Li, C, Ford, ES, Fulton, JE, Carlson, SA, Okoro, CA, et al. Leisure-time aerobic physical activity, muscle-strengthening activity and mortality risks among US adults: the NHANES linked mortality study. Br J Sports Med. (2014) 48:244–9. doi: 10.1136/bjsports-2013-092731
20. US Dept of Health and Human Services. Physical activity guidelines for Americans. 2nd ed. Washington, DC: US Dept of Health and Human Services (2018).
21. Li, Y, Xia, PF, Geng, TT, Tu, ZZ, Zhang, YB, Yu, HC, et al. Trends in self-reported adherence to healthy lifestyle behaviors among US adults, 1999 to March 2020. JAMA Netw Open. (2023) 6:e2323584. doi: 10.1001/jamanetworkopen.2023.23584
22. Reedy, J, Lerman, JL, Krebs-Smith, SM, Kirkpatrick, SI, Pannucci, TE, Wilson, MM, et al. Evaluation of the healthy eating index-2015. J Acad Nutr Diet. (2018) 118:1622–33. doi: 10.1016/j.jand.2018.05.019
23. National Cancer Institute. Developing the healthy eating index. Available at: https://epi.grants.cancer.gov/hei/developing.html Updated May 13, 2022 (Accessed March 25, 2023).
24. Farmer, N, Wallen, GR, Yang, L, Middleton, KR, Kazmi, N, and Powell-Wiley, TM. Household cooking frequency of dinner among non-Hispanic black adults is associated with income and employment, perceived diet quality and varied objective diet quality, HEI (healthy eating index): NHANES analysis 2007-2010. Nutrients. (2019) 11:2057. doi: 10.3390/nu11092057
25. Grundy, SM, Cleeman, JI, Daniels, SR, Donato, KA, Eckel, RH, Franklin, BA, et al. Diagnosis and management of the metabolic syndrome: an American Heart Association/National Heart, Lung, and Blood Institute scientific statement. Circulation. (2005) 112:2735–52. doi: 10.1161/CIRCULATIONAHA.105.169404
26. Spiegelman, D, Hertzmark, E, and Wand, HC. Point and interval estimates of partial population attributable risks in cohort studies: examples and software. Cancer Causes Control. (2007) 18:571–9. doi: 10.1007/s10552-006-0090-y
27. Johnson, CL, Paulose-Ram, R, Ogden, CL, Carroll, MD, Kruszon-Moran, D, Dohrmann, SM, et al. National health and nutrition examination survey: analytic guidelines, 1999-2010. Vital Health Stat. (2013) 2:1–24.
28. Weidung, B, Littbrand, H, Nordström, P, Carlberg, B, and Gustafson, Y. The association between SBP and mortality risk differs with level of cognitive function in very old individuals. J Hypertens. (2016) 34:745–52. doi: 10.1097/HJH.0000000000000831
29. Esteban-Cornejo, I, Cabanas-Sánchez, V, Higueras-Fresnillo, S, Ortega, FB, Kramer, AF, Rodriguez-Artalejo, F, et al. Cognitive frailty and mortality in a National Cohort of older adults: the role of physical activity. Mayo Clin Proc. (2019) 94:1180–9. doi: 10.1016/j.mayocp.2018.10.027
30. Li, CL, Chiu, YC, Shyu, YL, Stanaway, FF, Chang, HY, and Bai, YB. Does physical activity protect older persons with frailty and cognitive impairment from excess all-cause mortality? Arch Gerontol Geriatr. (2021) 97:104500. doi: 10.1016/j.archger.2021.104500
31. Laufs, U, Wassmann, S, Czech, T, Münzel, T, Eisenhauer, M, Böhm, M, et al. Physical inactivity increases oxidative stress, endothelial dysfunction, and atherosclerosis. Arterioscler Thromb Vasc Biol. (2005) 25:809–14. doi: 10.1161/01.ATV.0000158311.24443.af
32. Maiorana, A, O'Driscoll, G, Taylor, R, and Green, D. Exercise and the nitric oxide vasodilator system. Sports Med. (2003) 33:1013–35. doi: 10.2165/00007256-200333140-00001
33. Milani, RV, and Lavie, CJ. Reducing psychosocial stress: a novel mechanism of improving survival from exercise training. Am J Med. (2009) 122:931–8. doi: 10.1016/j.amjmed.2009.03.028
34. Erickson, KI, Donofry, SD, Sewell, KR, Brown, BM, and Stillman, CM. Cognitive aging and the promise of physical activity. Annu Rev Clin Psychol. (2022) 18:417–42. doi: 10.1146/annurev-clinpsy-072720-014213
35. Palta, P, Sharrett, AR, Deal, JA, Evenson, KR, Gabriel, KP, Folsom, AR, et al. Leisure-time physical activity sustained since midlife and preservation of cognitive function: the atherosclerosis risk in communities study. Alzheimers Dement. (2019) 15:273–81. doi: 10.1016/j.jalz.2018.08.008
36. Iso-Markku, P, Kujala, UM, Knittle, K, Polet, J, Vuoksimaa, E, and Waller, K. Physical activity as a protective factor for dementia and Alzheimer's disease: systematic review, meta-analysis and quality assessment of cohort and case-control studies. Br J Sports Med. (2022) 56:701–9. doi: 10.1136/bjsports-2021-104981
37. Blumenthal, JA, Smith, PJ, Mabe, S, Hinderliter, A, Lin, PH, Liao, L, et al. Lifestyle and neurocognition in older adults with cognitive impairments: a randomized trial. Neurology. (2019) 92:e212–23. doi: 10.1212/WNL.0000000000006784
38. Smith, PJ, Sherwood, A, Hinderliter, AL, Mabe, S, Watkins, LL, Craighead, L, et al. Lifestyle modification and cognitive function among individuals with resistant hypertension: cognitive outcomes from the TRIUMPH trial. J Hypertens. (2022) 40:1359–68. doi: 10.1097/HJH.0000000000003151
Keywords: cognition, mortality, aged, exercise, healthy diet
Citation: Wang W, Sun P, Lv T and Li M (2024) The impact of modifiable health metrics on mortality for older adults with low cognitive function. Front. Public Health. 12:1304876. doi: 10.3389/fpubh.2024.1304876
Edited by:
José Daniel Jiménez García, University of Jaén, SpainReviewed by:
Marilyn Klug, University of North Dakota, United StatesZhengyi Chen, Case Western Reserve University, United States
Ariana M. Stickel, San Diego State University, United States
Copyright © 2024 Wang, Sun, Lv and Li. This is an open-access article distributed under the terms of the Creative Commons Attribution License (CC BY). The use, distribution or reproduction in other forums is permitted, provided the original author(s) and the copyright owner(s) are credited and that the original publication in this journal is cited, in accordance with accepted academic practice. No use, distribution or reproduction is permitted which does not comply with these terms.
*Correspondence: Min Li, bWxpQGNjbXUuZWR1LmNu