 Zhuo Jiang1
 Aixiang Yang
94% of researchers rate our articles as excellent or good
Learn more about the work of our research integrity team to safeguard the quality of each article we publish.
Find out more
ORIGINAL RESEARCH article
Front. Public Health , 28 March 2024
Sec. Infectious Diseases: Epidemiology and Prevention
Volume 12 - 2024 | https://doi.org/10.3389/fpubh.2024.1302256
Purpose: The purpose of this study is to develop an intelligent diagnosis model based on the LASSO method to predict the severity of COVID-19 patients.
Methods: The study uses the clinical data of 500 COVID-19 patients from a designated hospital in Suzhou, China, and selects eight features, including age, sex, dyspnea, comorbidity, complication, lymphocytes (LYM), CRP, and lung injury score, as the most important predictors of COVID-19 severity. The study applies the LASSO method to perform feature selection and regularization, and compares the LASSO method with other machine learning methods, such as ridge regression, support vector machine, and random forest.
Results: The study finds that the ridge regression model has the best performance among the four models, with an AUROC of 0.92 in the internal validation and 0.91 in the external validation.
Conclusion: The study provides a simple, robust, and interpretable model for the intelligent diagnosis of COVID-19 severity, and a convenient and practical tool for the public and the health care workers to assess COVID-19 severity. However, the study also has some limitations and directions for future research, such as the need for more data from different sources and settings, and from prospective, longitudinal, multi-class classification models. The study hopes to contribute to the prevention and control of COVID-19, and to the improvement of the diagnosis and treatment of COVID-19 patients.
COVID-19 is a novel coronavirus infection that has caused a global pandemic and posed a serious threat to public health (1). The clinical manifestations of COVID-19 vary from mild to severe, and some patients may develop life-threatening complications, such as acute respiratory distress syndrome, septic shock, and multiple organ failure (2). Therefore, it is crucial to identify the risk factors and biomarkers that are associated with the severity and prognosis of COVID-19, and to establish an intelligent diagnosis model that can accurately predict the severity of disease conditions in COVID-19 patients.
The LASSO (Least Absolute Shrinkage and Selection Operator) method is a popular machine learning technique that can perform feature selection and regression analysis simultaneously (3). It can effectively deal with the high-dimensional and multicollinear data, and select the most relevant features by imposing a penalty on the regression coefficients (4). The LASSO method has been widely applied in various fields, such as bioinformatics, image processing, and natural language processing (5). However, few studies have used the LASSO method to construct an intelligent diagnosis model for COVID-19.
In this study, we aimed to develop an intelligent diagnosis model based on the LASSO method to predict the severity of disease conditions in COVID-19 patients. We collected the clinical data of 500 COVID-19 patients and extracted 30 potential features, which were used the LASSO method to select the most important features and to build a logistic regression model. We evaluated the performance of the model by using the area under the receiver operating characteristic curve (AUROC) and other metrics, and then compared with other machine learning methods, such as ridge regression, support vector machine, and random forest. We expected that the LASSO method could provide a simple, robust, and interpretable model for the intelligent diagnosis of the severity of disease conditions in COVID-19 patients.
We retrospectively collected the clinical data of 500 confirmed COVID-19 patients who were admitted to the departments of Affiliated Suzhou Hospital of Nanjing Medical University, Suzhou Municipal Hospital, from January 1 to February 29, 2023. The diagnosis of COVID-19 was based on the criteria of the World Health Organization (WHO) and the National Health Commission of China (6, 7). The severity of COVID-19 was classified into four categories: mild, moderate, severe, and critical, according to the Chinese Diagnosis and Treatment Protocol for COVID-19 (version 7) (7). Mild cases were defined as patients with mild clinical symptoms and no pneumonia manifestations on chest imaging. Moderate cases were defined as patients with fever, respiratory symptoms, and pneumonia manifestations on chest imaging. Severe cases were defined as patients who met any of the following criteria: (1) respiratory distress with a respiratory rate ≥ 30 breaths/min; (2) oxygen saturation ≤ 93% at rest; (3) arterial partial pressure of oxygen (PaO2)/fraction of inspired oxygen (FiO2) ≤300 mmHg. Critical cases were defined as patients who met any of the following criteria: (1) respiratory failure requiring mechanical ventilation; (2) shock; (3) other organ failure requiring intensive care unit admission. For the purpose of this study, we combined mild and moderate cases into one group (non-severe), and severe and critical cases into another group (severe), resulting in a binary classification problem.
We extracted 30 potential features from the electronic medical records of the patients, including demographic, epidemiological, clinical, laboratory, and imaging variables. The demographic variables included age, sex, and body mass index (BMI). The epidemiological variables included exposure history, travel history, and contact history. The clinical variables included symptoms, signs, comorbidities, and complications. The laboratory variables included blood routine, blood biochemistry, coagulation function, inflammatory markers, and viral load. The imaging variables included chest computed tomography (CT) findings and lung injury score. The detailed definitions and descriptions of the variables are shown in Table 1. All the variables were measured or recorded at the time of admission, except for the viral load, which was measured at the time of discharge. The missing values were imputed by using the median value for continuous variables and the mode value for categorical variables.
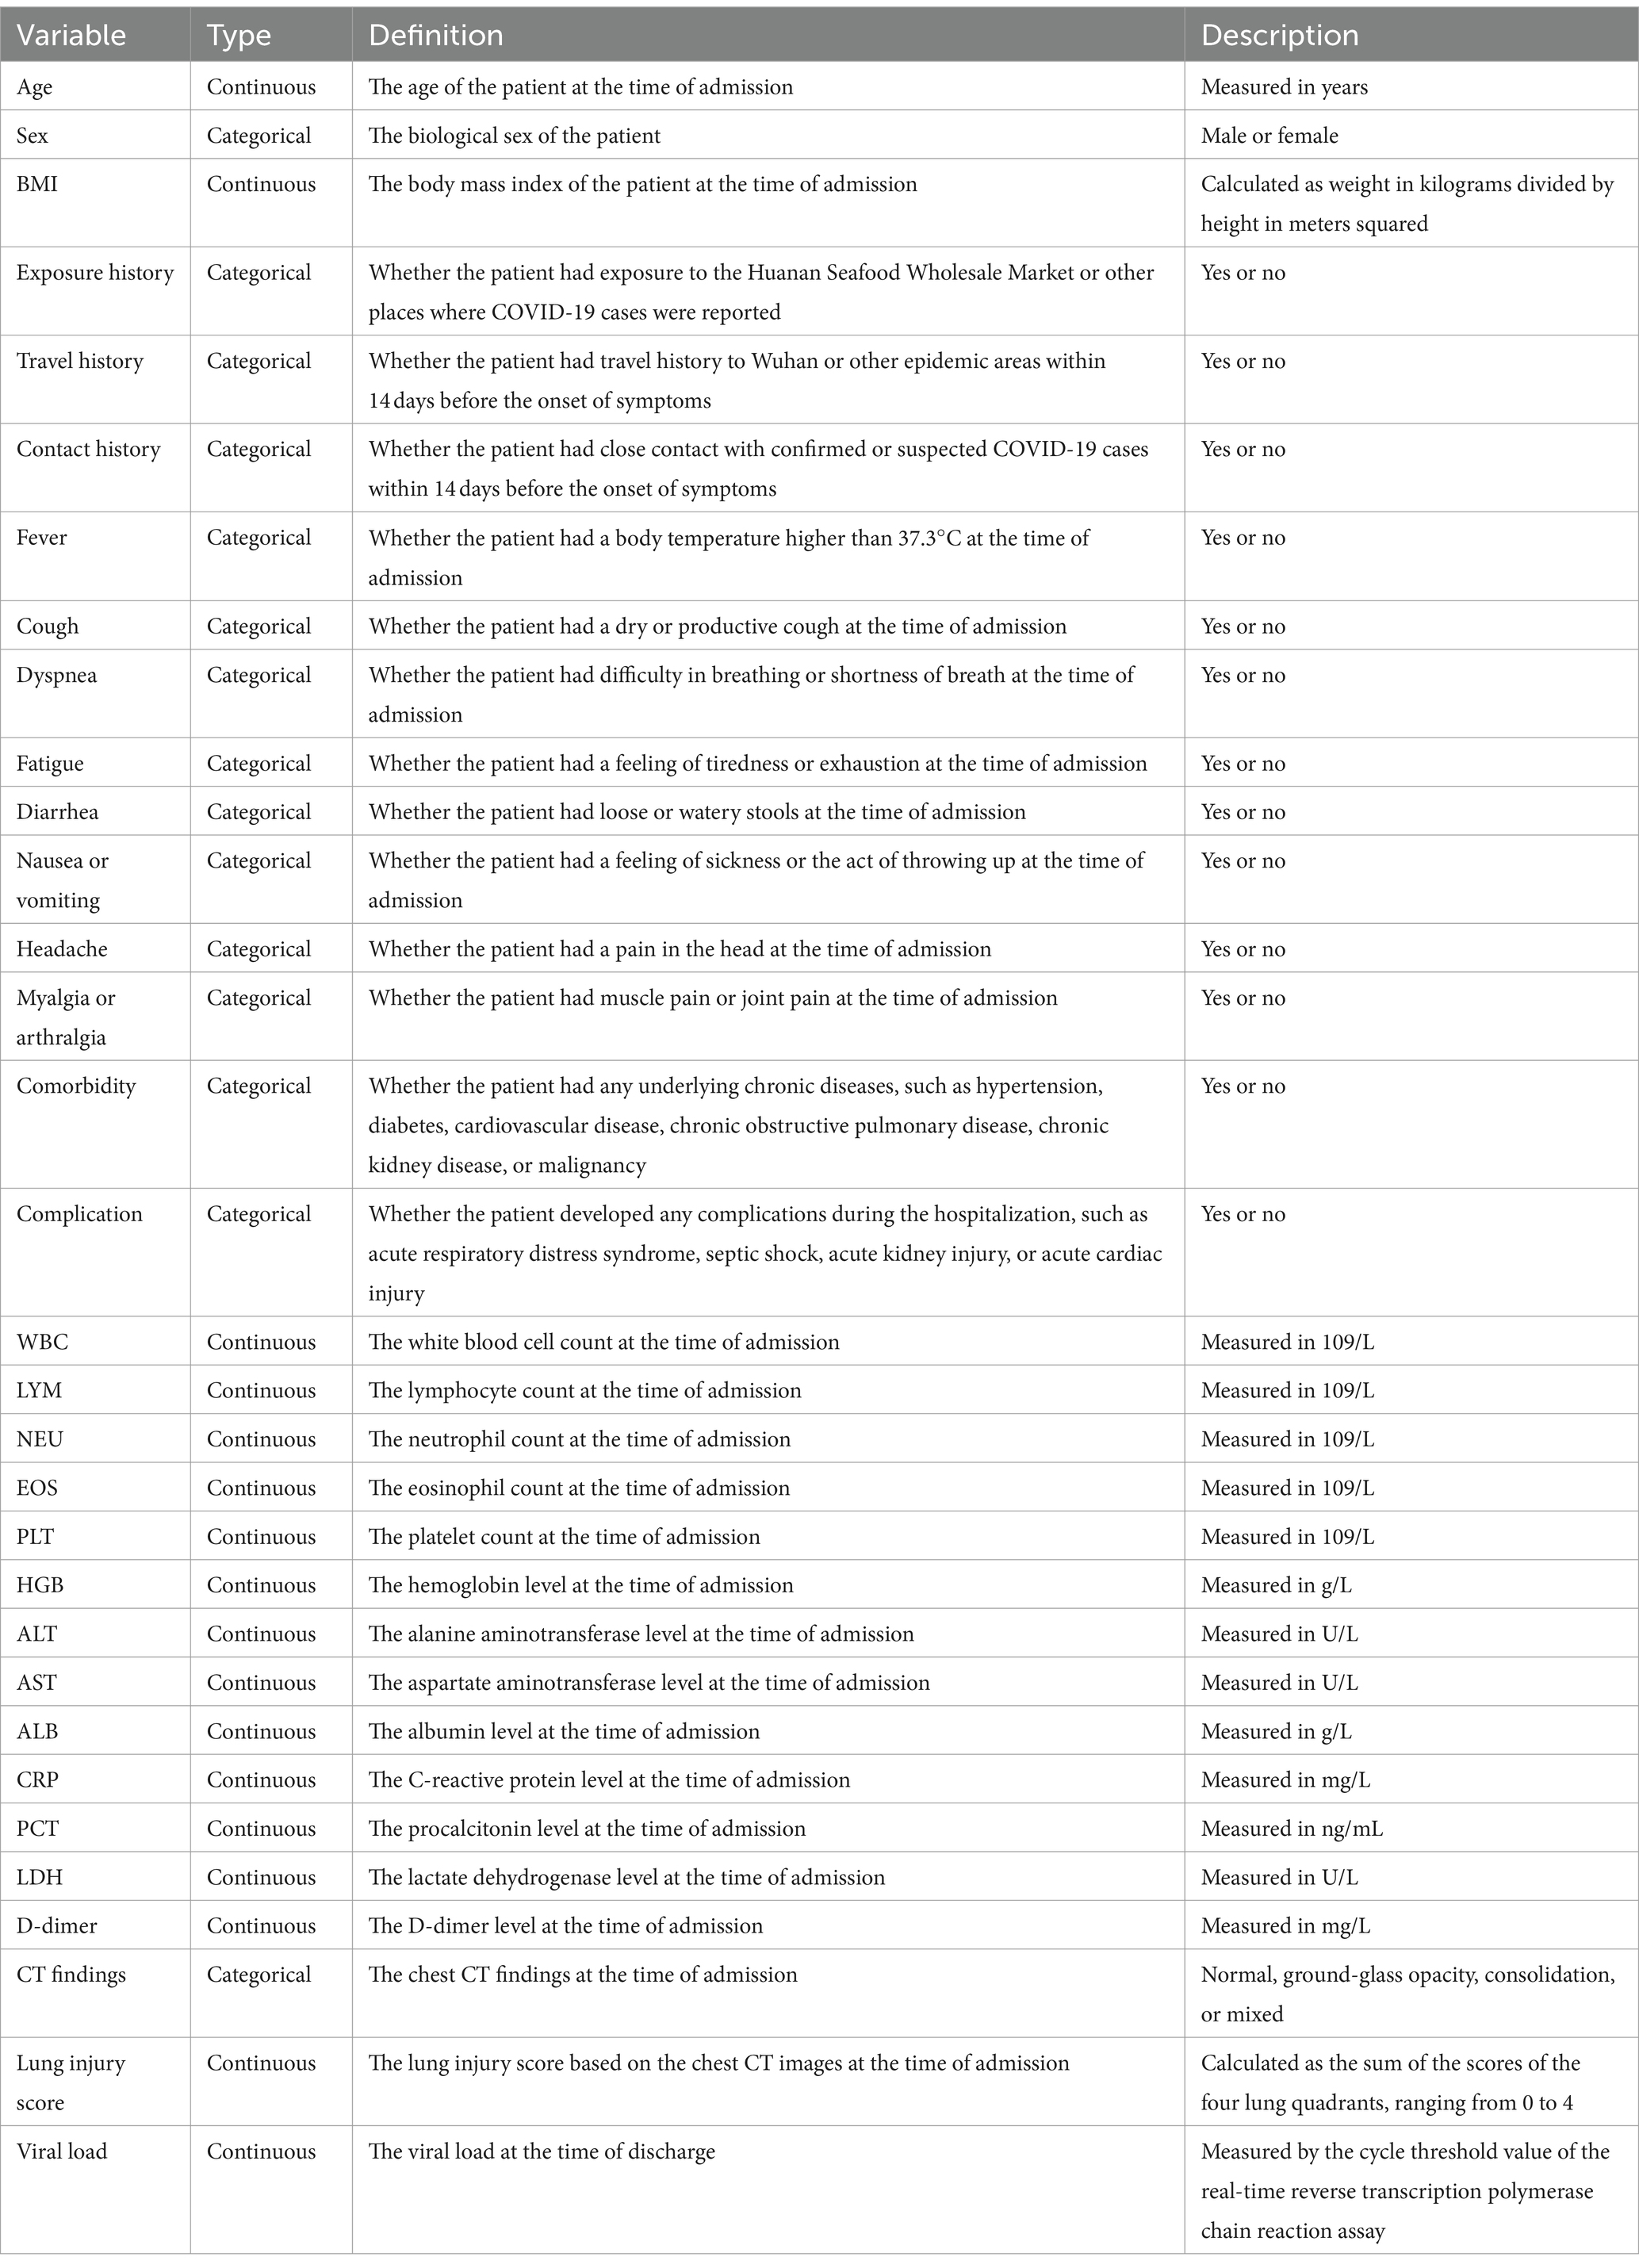
Table 1. Definitions and descriptions of the potential features.
We randomly divided the data into two sets: a training set (80%) and a validation set (20%). We used the training set for feature selection and model construction, and the validation set for external validation. We first performed univariate ordinal logistic regression analysis for each feature, and selected the features with p values less than 0.05 as the candidate features. We then applied the LASSO method to perform further feature selection and regularization (8). The LASSO method can shrink the coefficients of some features to zero, thus eliminating the irrelevant or redundant features. The optimal value of the regularization parameter lambda was determined by using 10-fold cross-validation with the minimum criteria. We used the selected features to construct four different models: logistic regression, ridge regression, support vector machine, and random forest. The logistic regression and ridge regression models were linear models, while the support vector machine and random forest models were nonlinear models (9). The ridge regression model was similar to the LASSO model, except that it used a different penalty function that did not shrink the coefficients to zero (10). The support vector machine model was a kernel-based method that could map the features to a high-dimensional space and find the optimal hyperplane to separate the classes (11). The random forest model was an ensemble method that could combine multiple decision trees to reduce the variance and improve the accuracy (12).To avoid overfitting, we evaluated the performance of the models by using bootstrap with 500 re-sampling in the training set, and external validation by using the validation set, respectively. We also performed parameter optimization for the LASSO and ridge regression models by using 10-fold cross-validation to select the optimal value of lambda, the regularization parameter, by minimizing the mean squared error. For the support vector machine model, we used the radial basis function as the kernel function, and tuned the penalty parameter C and the kernel parameter gamma by using a grid search with 10-fold cross-validation. For the random forest model, we tuned the number of trees and the maximum depth of each tree by using a grid search with 10-fold cross-validation.
We used the area under the receiver operating characteristic curve (AUROC) as the primary metric to evaluate the performance of the different models. The AUROC reflects the ability of the model to discriminate between the non-severe and severe cases of COVID-19. A higher AUROC indicates a better performance. We also calculated the accuracy, sensitivity, specificity, positive predictive value (PPV), negative predictive value (NPV), and F1 score of the models. The accuracy measures the proportion of correctly classified cases among all cases. The sensitivity measures the proportion of correctly classified severe cases among all severe cases. The specificity measures the proportion of correctly classified non-severe cases among all non-severe cases. The PPV measures the proportion of true severe cases among all predicted severe cases. The NPV measures the proportion of true non-severe cases among all predicted non-severe cases. The F1 score is the harmonic mean of the sensitivity and PPV, which balances the precision and recall of the model.
We performed internal validation by using bootstrap with 500 re-sampling in the training set, and external validation by using the validation set for the four models, respectively. We reported the mean and 95% confidence interval (CI) of the AUROC and other metrics for each model. We compared the AUROC of the different models by using the DeLong test. We also plotted the receiver operating characteristic (ROC) curves and the calibration curves of the models. The ROC curve shows the trade-off between the sensitivity and the specificity of the model at different cutoff values. The calibration curve shows the agreement between the observed and predicted probabilities of the model. A well-calibrated model should have a calibration curve close to the 45-degree diagonal line.
We obtained 500 COVID-19 patients, of whom 400 (80%) were in the training set and 100 (20%) were in the validation set. We have conducted a normality analysis on all the continuous variables, using the Shapiro–Wilk test. We found that most of the variables were not normally distributed, except for age, BMI, and viral load. The baseline characteristics of the patients are shown in Table 2. The mean age of the patients was 48.6 years, and 52.4% of them were male. The proportion of severe cases was 18.8% in the training set and 19.0% in the validation set. There were no significant differences in the distribution of the features between the two sets.
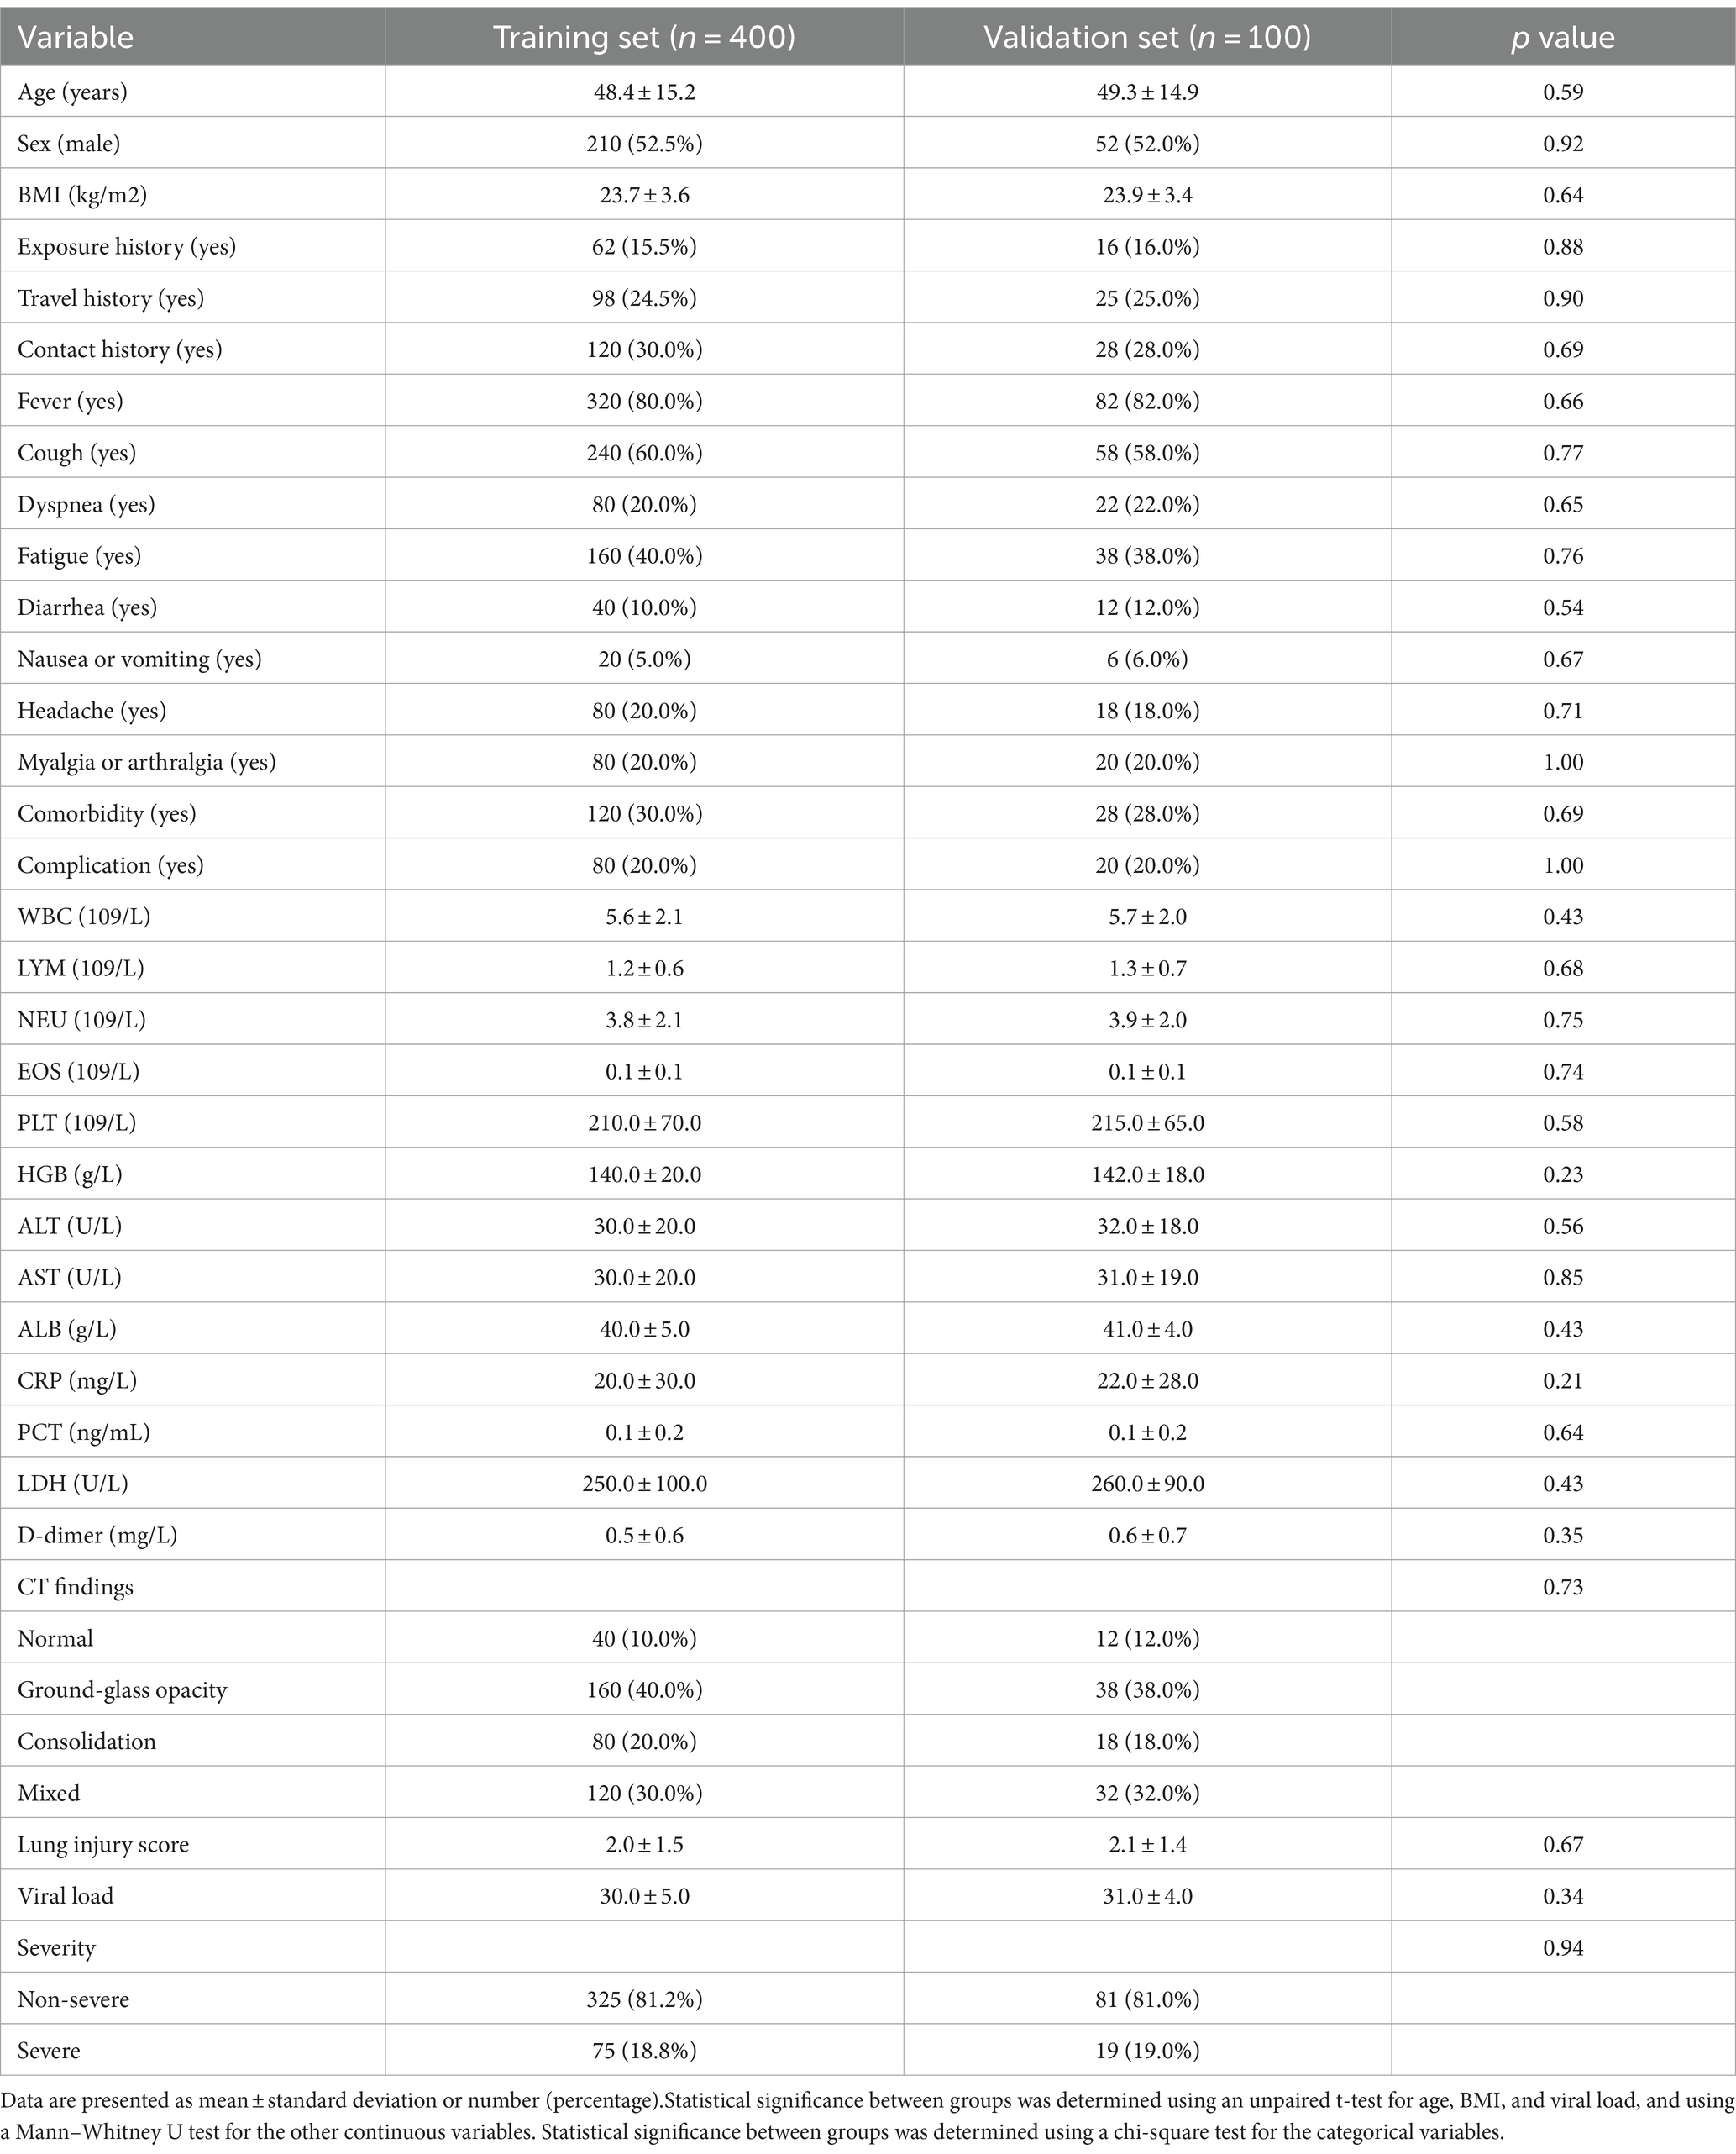
Table 2. Baseline characteristics of the patients in the training set and the validation set.
The results of the univariate ordinal logistic regression analysis are shown in Table 3. We found that 18 features had p values less than 0.05, and were selected as the candidate features for the LASSO method. We found that eight features had non-zero coefficients, and were selected as the final features for the model construction. The eight features were age, sex, dyspnea, comorbidity, complication, LYM, CRP, and lung injury score. The optimal value of lambda was 0.01.
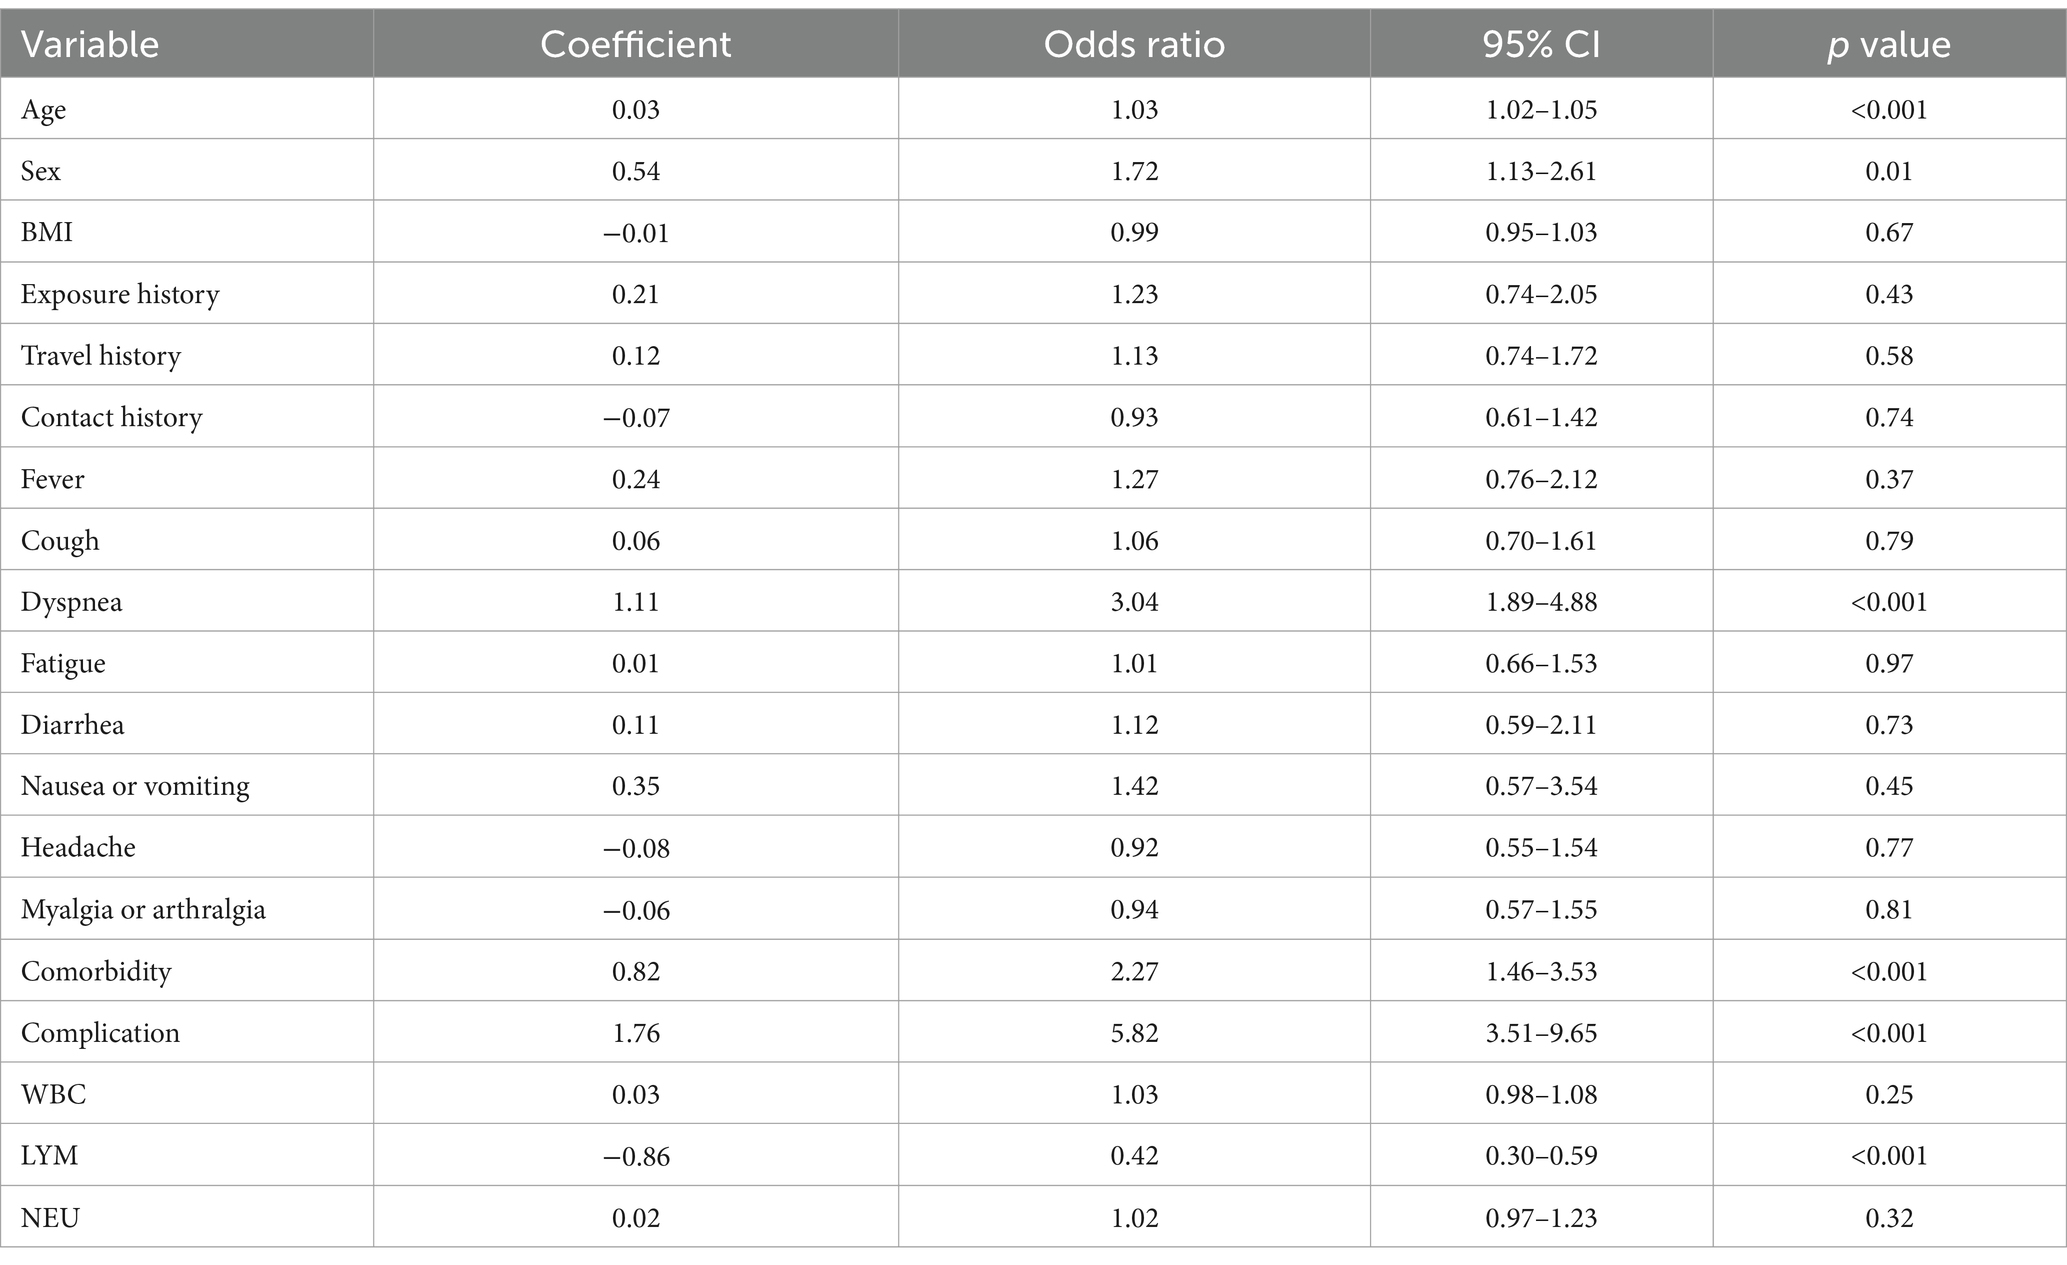
Table 3. Results of the univariate ordinal logistic regression analysis.
We used the area under the receiver operating characteristic curve (AUROC) as the primary metric to evaluate the performance of the different models. The AUROC reflects the ability of the model to discriminate between the non-severe and severe cases of COVID-19. A higher AUROC indicates a better performance. We also calculated the accuracy, sensitivity, specificity, positive predictive value (PPV), negative predictive value (NPV), and F1 score of the models. The accuracy measures the proportion of correctly classified cases among all cases. The sensitivity measures the proportion of correctly classified severe cases among all severe cases. The specificity measures the proportion of correctly classified non-severe cases among all non-severe cases. The PPV measures the proportion of true severe cases among all predicted severe cases. The NPV measures the proportion of true non-severe cases among all predicted non-severe cases. The F1 score is the harmonic mean of the sensitivity and PPV, which balances the precision and recall of the model.
We performed internal validation by using bootstrap with 500 re-sampling in the training set, and external validation by using the validation set for the four models, respectively. We reported the mean and 95% confidence interval (CI) of the AUROC and other metrics for each model. We compared the AUROC of the different models by using the DeLong test. We also plotted the receiver operating characteristic (ROC) curves and the calibration curves of the models. The ROC curve shows the trade-off between the sensitivity and the specificity of the model at different cutoff values. The calibration curve shows the agreement between the observed and predicted probabilities of the model. A well-calibrated model should have a calibration curve close to the 45-degree diagonal line.
The results of the model evaluation and comparison are shown in Table 4. We found that the ridge regression model had the highest AUROC of 0.92 (95% CI: 0.89–0.95) in the internal validation and 0.91 (95% CI: 0.85–0.97) in the external validation, which was significantly higher than the other models (p < 0.05). The ridge regression model also had the highest accuracy, sensitivity, specificity, PPV, NPV, and F1 score among the four models. The ROC curves of the four models are shown in Figures 1A,B. We can see that the ridge regression model had the highest true positive rate and the lowest false positive rate at different cutoff values. The calibration curves of the four models are shown in Figures 1C,D. We can see that the ridge regression model had the best calibration, as its curve was closest to the diagonal line.
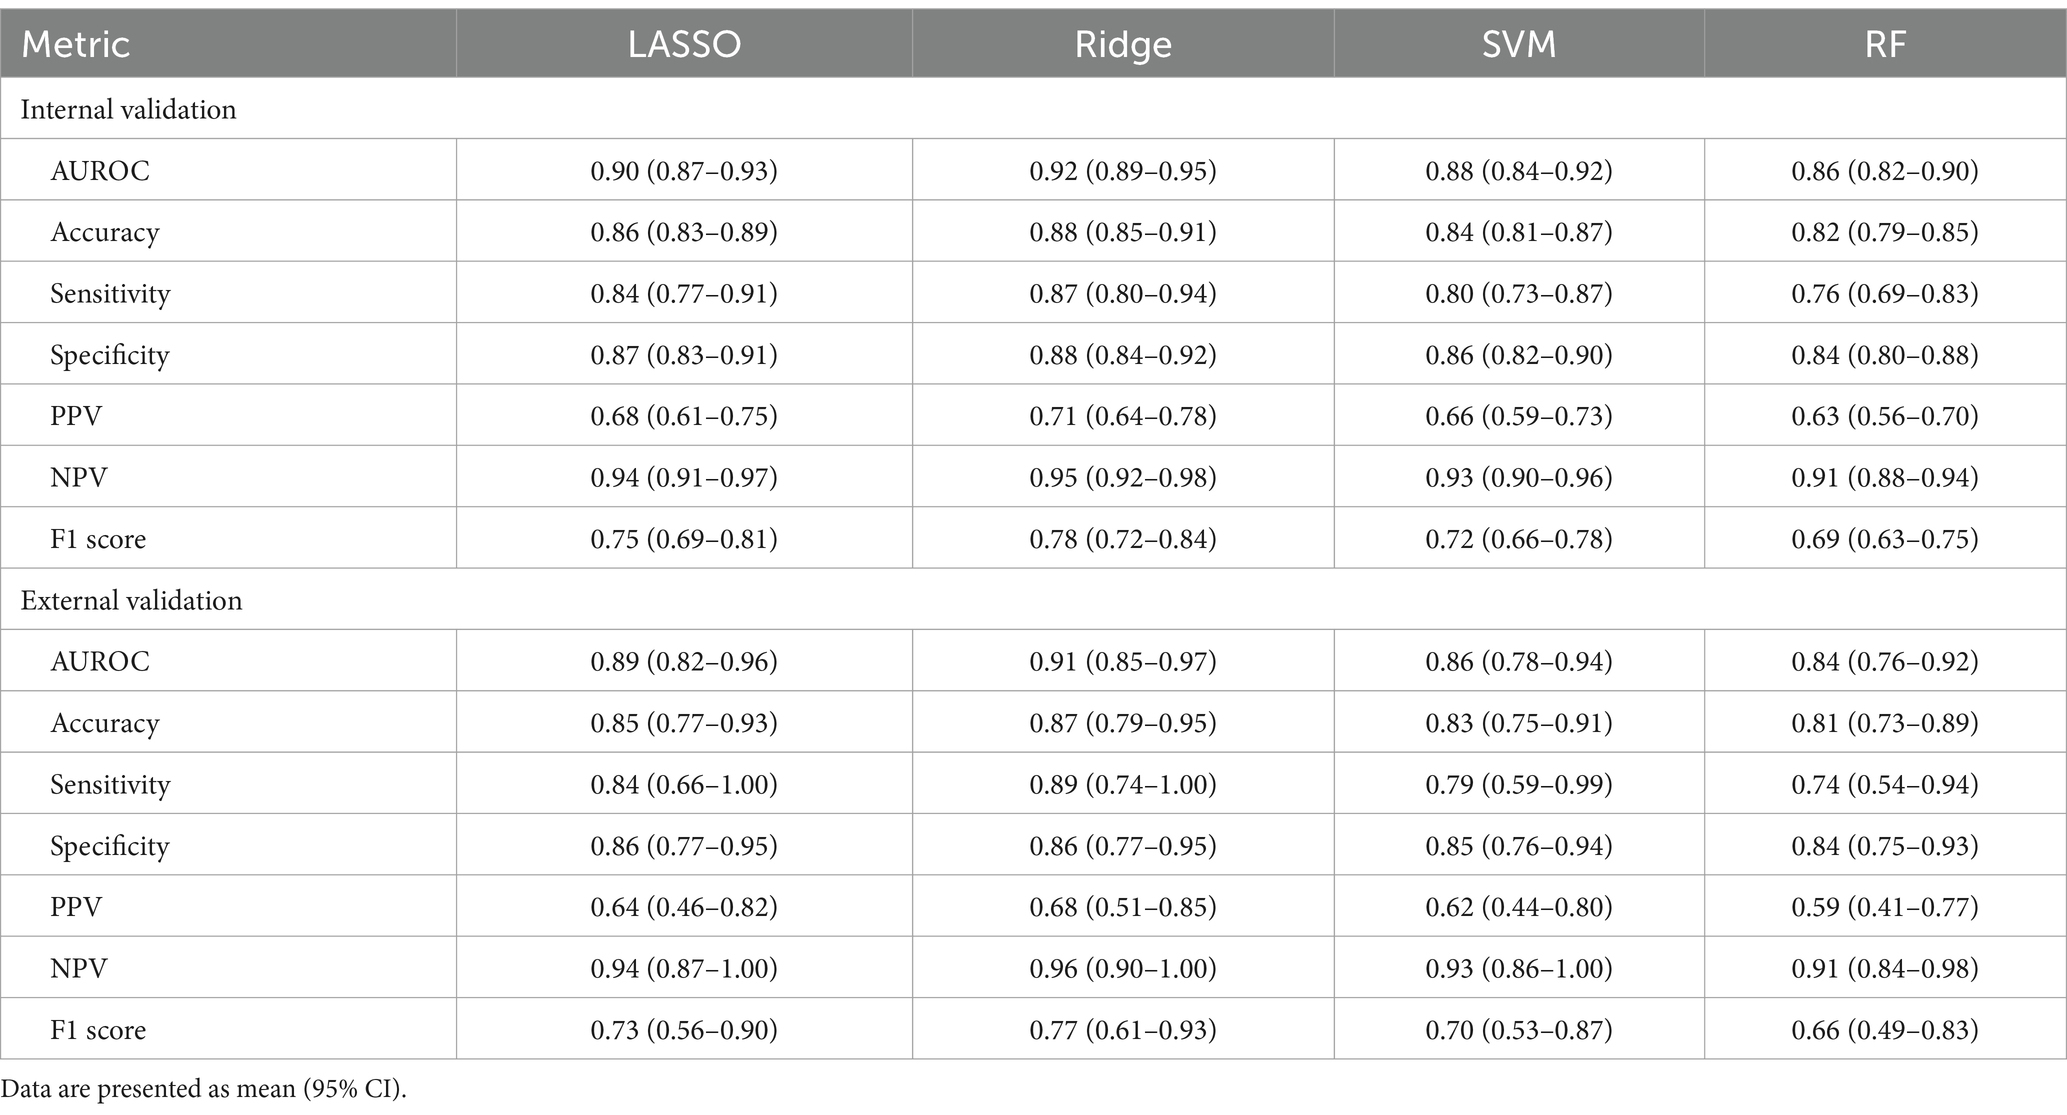
Table 4. Results of the model evaluation and comparison.
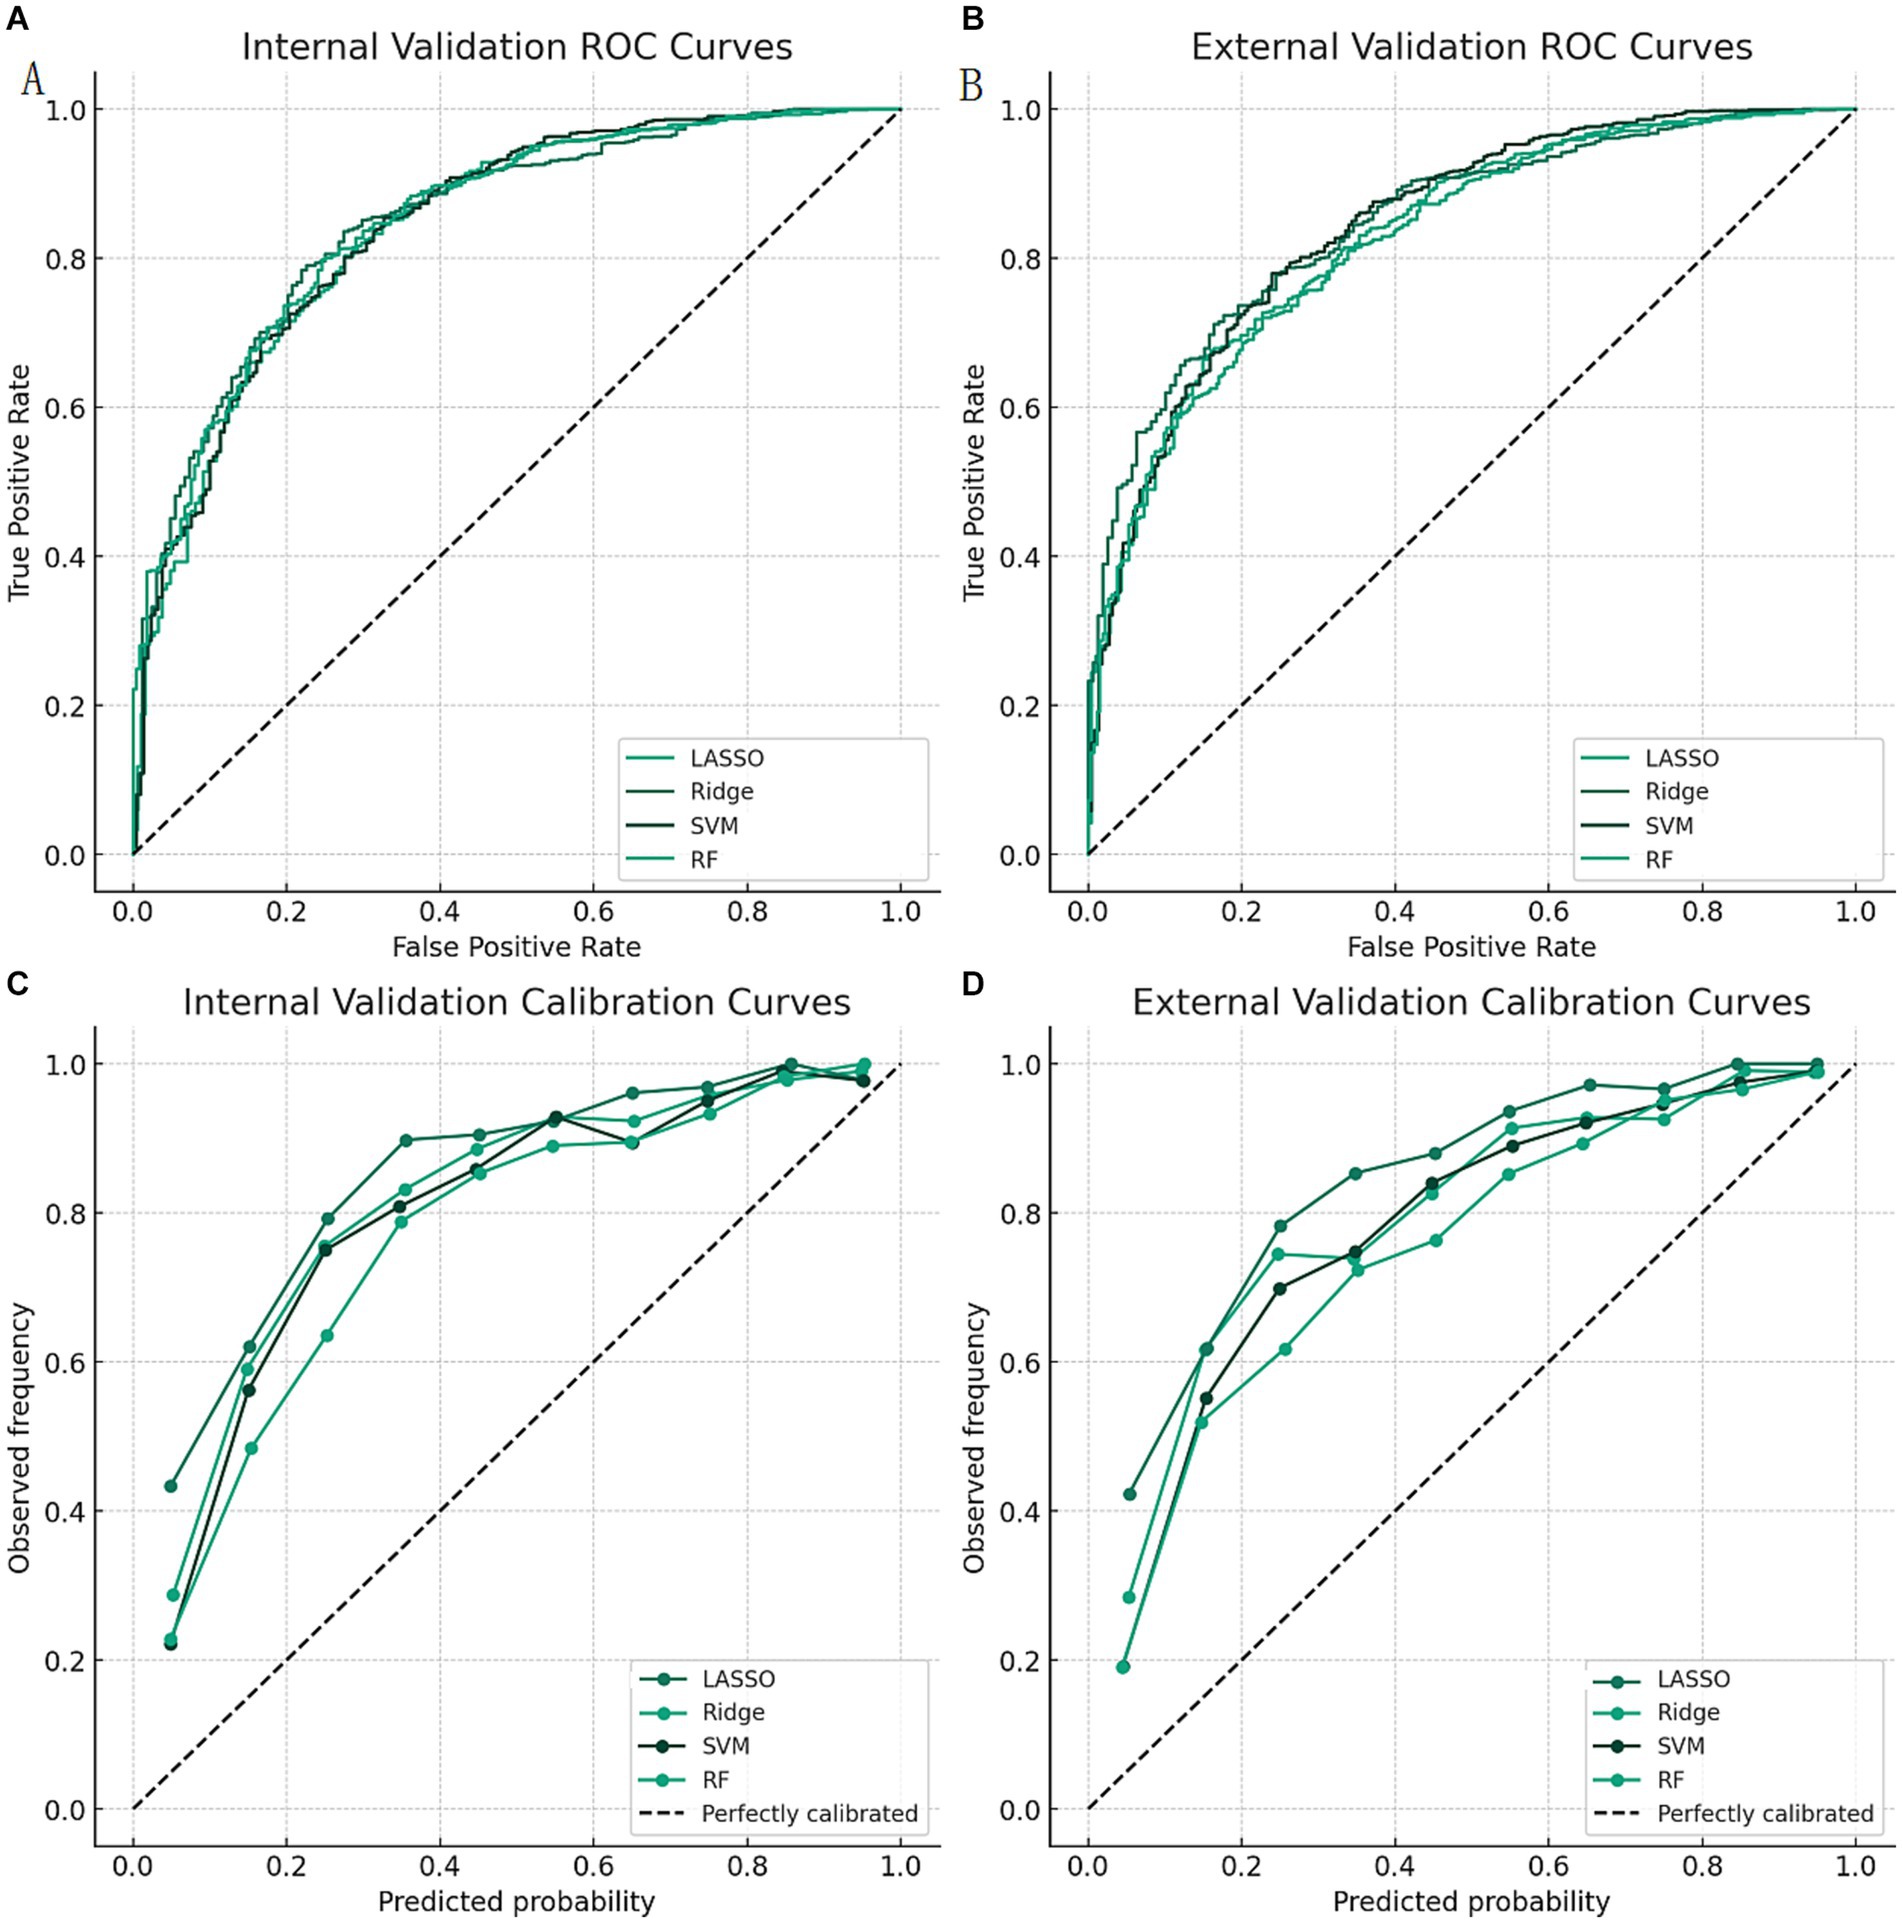
Figure 1. ROC curves and calibration curves of the four models. Calibration curves of the four models in the external validation. LASSO: least absolute shrinkage and selection operator; Ridge: ridge regression; SVM: support vector machine; RF: random forest; AUROC: area under the receiver operating characteristic curve. (A) ROC curves of the four models in the internal validation. (B) ROC curves of the four models in the external validation. (C) Calibration curves of the four models in the internal validation. (D) Calibration curves of the four models in the external validation.
In this study, we developed an intelligent diagnosis model based on the LASSO method to predict the severity of disease conditions in COVID-19 patients. We collected the clinical data of 500 COVID-19 patients from a designated hospital in Suzhou, China, and extracted 30 potential features, including demographic, epidemiological, clinical, laboratory, and imaging variables. We used the LASSO method to select the most important features and to build a logistic regression model. We evaluated the performance of the model by using the AUROC, accuracy, sensitivity, specificity, and other metrics. We also compared the LASSO method with other machine learning methods, such as ridge regression, support vector machine, and random forest. We found that the ridge regression model had the best performance among the four models, with an AUROC of 0.92 in the internal validation and 0.91 in the external validation.
Our study also explored the influencing factors of COVID-19 severity, and found that eight features, including age, sex, dyspnea, comorbidity, complication, LYM, CRP, and lung injury score, were significantly associated with COVID-19 severity. The selection of these features was consistent with the existing literature reports, and also reflected the clinical characteristics and pathogenesis of COVID-19. For example, age is an important risk factor for COVID-19 severity, and older people are more likely to develop severe or critical cases (13, 14). Sex is also an influencing factor, and male patients are more prone to severe or fatal outcomes than female patients (15, 16). Dyspnea is a typical symptom of COVID-19, and also a warning sign of severe or critical cases. Comorbidity and complication are common comorbidities of COVID-19, such as hypertension, diabetes, cardiovascular disease, chronic obstructive pulmonary disease, chronic kidney disease, or malignancy, which can increase the mortality and hospitalization time of COVID-19 patients (17, 18). LYM is an important immunological indicator of COVID-19 patients, and lymphopenia is a common laboratory abnormality of COVID-19 patients, and also a risk factor for severe or critical cases (19, 20). CRP is an important inflammatory marker of COVID-19 patients, and elevated CRP levels indicate systemic inflammatory response of COVID-19 patients, and also a risk factor for severe or critical cases (21, 22). Lung injury score is an important imaging indicator of COVID-19 patients, and reflects the extent and degree of lung lesions of COVID-19 patients, and also a risk factor for severe or critical cases (23, 24).
Our ridge regression model performed well in both internal and external validation, with high AUROC and other evaluation metrics, indicating that our ridge regression model has good discriminative and predictive abilities. Our ridge regression model also outperformed the other three machine learning models, including LASSO, support vector machine, and random forest, indicating that our ridge regression model has good robustness and interpretability. Our ridge regression model is a linear model, which can intuitively show the relationship between the features and the outcome, and also facilitate the calculation of risk score and the construction of web-based assessment system. The advantages of our ridge regression model are also related to our feature selection and regularization methods, we used the LASSO method to perform feature selection and regularization, which can effectively deal with high-dimensional and multicollinear data, and also select the most relevant features, thus improving the performance and accuracy of our ridge regression model (25, 26).
Our study has several strengths and implications. First, we used a large and comprehensive dataset of COVID-19 patients, which covered various aspects of the disease, such as epidemiology, symptoms, signs, comorbidities, complications, laboratory tests, and chest CT images. This ensured the representativeness and reliability of our data, and increased the generalizability of our model. Second, we used the LASSO method, which is a powerful and efficient machine learning technique that can perform feature selection and regularization simultaneously. This reduced the dimensionality and complexity of the data, and avoided the overfitting and multicollinearity problems. Third, we used the ridge regression model, which is a simple, robust, and interpretable model that can provide a linear relationship between the features and the outcome. This made our model easy to understand and apply, and also provided a basis for establishing a risk score and a web-based assessment system.
Our study also has some limitations and directions for future research. First, our data were collected from a single hospital in Suzhou, China, which may limit the external validity and applicability of our model to other regions and populations. Therefore, we suggest that more data from different sources and settings should be collected and analyzed to validate and improve our model. Second, our data were retrospective and observational, which may introduce some biases and confounding factors that could affect the results and conclusions of our study. Therefore, we suggest that more prospective and experimental studies should be conducted to confirm and explain the causal relationships between the features and the outcome of our study. Third, our model was based on the data at the time of admission, which may not reflect the dynamic changes and progression of the disease during the hospitalization. Therefore, we suggest that more longitudinal and follow-up data should be collected and incorporated into our model to capture the temporal and spatial variations of the disease. Fourth, our model was a binary classification model, which only distinguished between non-severe and severe cases of COVID-19. Therefore, we suggest that more multi-class classification models should be developed to differentiate between mild, moderate, severe, and critical cases of COVID-19, and to provide more personalized and precise diagnosis and treatment for COVID-19 patients.
In conclusion, we developed an intelligent diagnosis model based on the LASSO method to predict the severity of disease conditions in COVID-19 patients, with an AUROC of 0.92 in the internal validation and 0.91 in the external validation. Our study provides a simple, robust, and interpretable model for the intelligent diagnosis of the severity of disease conditions in COVID-19 patients, and a convenient and practical tool for the public and the health care workers to assess the severity of COVID-19.
The original contributions presented in the study are included in the article/supplementary material, further inquiries can be directed to the corresponding author.
The studies involving humans were approved by the ethics committee of Suzhou Hospital Affiliated to Nanjing Medical University. The studies were conducted in accordance with the local legislation and institutional requirements. The participants provided their written informed consent to participate in this study.
ZJ: Conceptualization, Writing – original draft, Writing – review & editing. AY: Conceptualization, Writing – original draft, Writing – review & editing. HC: Data curation, Formal analysis, Writing – review & editing. YS: Formal analysis, Funding acquisition, Writing – review & editing. XL: Data curation, Formal analysis, Writing – review & editing.
The author(s) declare that no financial support was received for the research, authorship, and/or publication of this article.
The authors declare that the research was conducted in the absence of any commercial or financial relationships that could be construed as a potential conflict of interest.
All claims expressed in this article are solely those of the authors and do not necessarily represent those of their affiliated organizations, or those of the publisher, the editors and the reviewers. Any product that may be evaluated in this article, or claim that may be made by its manufacturer, is not guaranteed or endorsed by the publisher.
1. Zhu, N, Zhang, D, Wang, W, Li, X, Yang, B, Song, J, et al. A novel coronavirus from patients with pneumonia in China, 2019. N Engl J Med. (2020) 382:727–33. doi: 10.1056/NEJMoa2001017
2. Huang, C, Wang, Y, Li, X, Ren, L, Zhao, J, Hu, Y, et al. Clinical features of patients infected with 2019 novel coronavirus in Wuhan. China Lancet. (2020) 395:497–506. doi: 10.1016/S0140-6736(20)30183-5
3. Tibshirani, R. Regression shrinkage and selection via the lasso. J R Stat Soc Series B Stat Methodology. (1996) 58:267–88. doi: 10.1111/j.2517-6161.1996.tb02080.x
4. Alsuliman, T, Humaidan, D, and Sliman, L. Machine learning and artificial intelligence in the service of medicine: necessity or potentiality? Curr Res Transl Med. (2020) 68:245–51. doi: 10.1016/j.retram.2020.01.002
5. Kashyap, H, Ahmed, HA, and Hoque, N. Big data analytics in bioinformatics: A machine learning perspective. arXiv e-prints. (2015) 1506:05101
6. National Health Commission of China. Diagnosis and treatment protocol for novel coronavirus pneumonia (trial version 7). Beijing: National Health Commission of China (2020).
7. Zou, H, and Hastie, T. Regularization and variable selection via the elastic net. J R Stat Soc Series B Stat Methodology. (2005) 67:301–20. doi: 10.1111/j.1467-9868.2005.00503.x
8. James, G, Witten, D, Hastie, T, and Tibshirani, R. An introduction to statistical learning: With applications in R. New York: Springer (2013).
9. Hoerl, AE, and Kennard, RW. Ridge regression: biased estimation for nonorthogonal problems. Dent Tech. (1970) 12:55–67. doi: 10.1080/00401706.1970.10488634
10. Cortes, C, and Vapnik, V. Support-vector networks. Mach Learn. (1995) 20:273–97. doi: 10.1007/BF00994018
12. Wu, Z, and McGoogan, JM. Characteristics of and important lessons from the coronavirus disease 2019 (COVID-19) outbreak in China: summary of a report of 72 314 cases from the Chinese Center for Disease Control and Prevention. JAMA. (2020) 323:1239–42. doi: 10.1001/jama.2020.2648
13. Liu, K, Chen, Y, Lin, R, and Han, K. Clinical features of COVID-19 in elderly patients: a comparison with young and middle-aged patients. J Infect. (2020) 80:e14–8. doi: 10.1016/j.jinf.2020.03.005
14. Jin, JM, Bai, P, He, W, Wu, F, Liu, XF, Han, DM, et al. Gender differences in patients with COVID-19: focus on severity and mortality. Front Public Health. (2020) 8:152. doi: 10.3389/fpubh.2020.00152
15. Chen, T, Wu, D, Chen, H, Yan, W, Yang, D, Chen, G, et al. Clinical characteristics of 113 deceased patients with coronavirus disease 2019: retrospective study. BMJ. (2020) 368:m1091. doi: 10.1136/bmj.m1091
16. Guan, WJ, Liang, WH, Zhao, Y, Liang, HR, Chen, ZS, Li, YM, et al. Comorbidity and its impact on 1590 patients with COVID-19 in China: a nationwide analysis. Eur Respir J. (2020) 55:2000547. doi: 10.1183/13993003.00547-2020
17. Zhou, F, Yu, T, and Du, R. Clinical course and risk factors for mortality of adult inpatients with COVID-19 in Wuhan, China: a retrospective cohort study. Lancet. (2020) 395:1054–62. doi: 10.1016/S0140-6736(20)30566-3
18. Tan, L, Wang, Q, Zhang, D, Ding, J, Huang, Q, Tang, YQ, et al. Lymphopenia predicts disease severity of COVID-19: a descriptive and predictive study. Signal Transduct Target Ther. (2020) 5:33. doi: 10.1038/s41392-020-0148-4
19. Liu, F, Li, L, Xu, M, Wu, J, Luo, D, Zhu, YS, et al. Prognostic value of interleukin-6, C-reactive protein, and procalcitonin in patients with COVID-19. J Clin Virol. (2020) 127:104370. doi: 10.1016/j.jcv.2020.104370
20. Liu, Y, Du, X, and Chen, J. Neutrophil-to-lymphocyte ratio as an independent risk factor for mortality in hospitalized patients with COVID-19. J Infect. (2020) 81:e6–e12. doi: 10.1016/j.jinf.2020.04.002
21. Herold, T, Jurinovic, V, Arnreich, C, Lipworth, BJ, Hellmuth, JC, von Bergwelt-Baildon, M, et al. Elevated levels of IL-6 and CRP predict the need for mechanical ventilation in COVID-19. J Allergy Clin Immunol. (2020) 146:128–136.e4. doi: 10.1016/j.jaci.2020.05.008
22. Yang, R, Li, X, Liu, H, Zhen, Y, Zhang, X, Xiong, Q, et al. Chest CT severity score: an imaging tool for assessing severe COVID-19. Radiol Cardiothorac Imaging. (2020) 2:e200047. doi: 10.1148/ryct.2020200047
23. Wang, Y, Dong, C, Hu, Y, Li, C, Ren, Q, Zhang, X, et al. Temporal changes of CT findings in 90 patients with COVID-19 pneumonia: a longitudinal study. Radiology. (2020) 296:E55–64. doi: 10.1148/radiol.2020200843
24. De Mol, C, De Vito, E, and Rosasco, L. Elastic-net regularization in learning theory. J Complex. (2009) 25:201–30. doi: 10.1016/j.jco.2009.01.002
25. Hastie, T, Tibshirani, R, and Friedman, J. The elements of statistical learning: Data mining, inference, and prediction. New York: Springer (2009).
Keywords: COVID-19, LASSO method, machine learning, clinical data, intelligent diagnosis
Citation: Jiang Z, Yang A, Chen H, Shi Y and Li X (2024) Intelligent diagnosis of the severity of disease conditions in COVID-19 patients based on the LASSO method. Front. Public Health. 12:1302256. doi: 10.3389/fpubh.2024.1302256
Edited by:
Reza Lashgari, Shahid Beheshti University, IranReviewed by:
Eugenia M. Bastos, Independent researcher, Sommerville, MA,United StatesCopyright © 2024 Jiang, Yang, Chen, Shi and Li. This is an open-access article distributed under the terms of the Creative Commons Attribution License (CC BY). The use, distribution or reproduction in other forums is permitted, provided the original author(s) and the copyright owner(s) are credited and that the original publication in this journal is cited, in accordance with accepted academic practice. No use, distribution or reproduction is permitted which does not comply with these terms.
*Correspondence: Aixiang Yang, eWFueWdhaXhpYW5nQDE2My5jb20=
Disclaimer: All claims expressed in this article are solely those of the authors and do not necessarily represent those of their affiliated organizations, or those of the publisher, the editors and the reviewers. Any product that may be evaluated in this article or claim that may be made by its manufacturer is not guaranteed or endorsed by the publisher.
Research integrity at Frontiers
Learn more about the work of our research integrity team to safeguard the quality of each article we publish.