 Thelma J. Mielenz1,2*
 Haomiao Jia3
 Carolyn G. DiGuiseppi4
 David Strogatz5Howard F. Andrews3,6
 Lisa J. Molnar7David W. Eby7Linda L. Hill8Guohua Li1,2,9
- 1Department of Epidemiology, Mailman School of Public Health, Columbia University, New York, NY, United States
- 2Center for Injury Science and Prevention, Columbia University Irving Medical Center, New York, NY, United States
- 3Department of Biostatistics, Mailman School of Public Health, Columbia University, New York, NY, United States
- 4Department of Epidemiology, Colorado School of Public Health, University of Colorado Anschutz Medical Campus, Aurora, CO, United States
- 5Bassett Research Institute, Cooperstown, NY, United States
- 6Department of Psychiatry, Vagelos College of Physicians and Surgeons, Columbia University, New York, NY, United States
- 7University of Michigan Transportation Research Institute, Ann Arbor, MI, United States
- 8School of Public Health, University of California San Diego, La Jolla, CA, United States
- 9Department of Anesthesiology, Vagelos College of Physicians and Surgeons, Columbia University, New York, NY, United States
Introduction: Frailty and low physical performance are modifiable factors and, therefore, targets for interventions aimed at delaying driving cessation (DC). The objective was to determine the impact of frailty and physical performance on DC.
Methods: Multisite prospective cohort of older drivers. The key inclusion criteria are as follows: active driver age 65–79 years, possessing a valid driver’s license, without significant cognitive impairment, and driving a 1996 car or a newer model car. Of the 2,990 enrolled participants, 2,986 (99.9%) had at least one frailty or Short Physical Performance Battery (SPPB) measure and were included in this study. In total, 42% of participants were aged 65–69 years, 86% were non-Hispanic white, 53% were female, 63% were married, and 41% had a high degree of education. The Fried Frailty Phenotype and the Expanded Short Physical Performance Battery (SPPB) from the National Health and Aging Trends Study were utilized. At each annual visit, DC was assessed by the participant notifying the study team or self-reporting after no driving activity for at least 30 days, verified via GPS. Cox proportional hazard models, including time-varying covariates, were used to examine the impact of the SPPB and frailty scores on time to DC. This assessment included examining interactions by sex.
Results: Seventy-three participants (2.4%) stopped driving by the end of year 5. Among women with a fair SPPB score, the adjusted hazard ratio (HR) of DC was 0.26 (95% confidence interval (CI) 0.10–0.65) compared to those with a poor SPPB score. For those with a good SPPB score, the adjusted HR of DC had a p-value of <0.001. Among men with a fair SPPB score, the adjusted hazard ratio (HR) of DC was 0.45 (95% CI 0.25–0.81) compared to those with a poor SPPB score. For men with a good SPPB score, the adjusted HR of DC was 0.19 (95% CI 0.10–0.36). Sex was not an effect modifier between frailty and DC. For those who were categorized into pre-frail or frail, the adjusted ratio of HR to DC was 6.1 (95% CI 2.7–13.8) compared to those who were not frail.
Conclusion and relevance: Frailty and poor physical functioning are major risk factors for driving cessation. Staying physically active may help older adults to extend their driving life expectancy and mobility.
Introduction
Driving cessation (DC) decreases independence and leads to poorer physical, mental, and social health (1). Frailty and physical performance are both modifiable factors by behavioral factors such as progressive exercise interventions (2). The Short Physical Performance Battery (SPPB), a comprehensive lower extremity physical performance measure is a strong predictor of skilled nursing admission, morbidity, and mortality (3, 4). It has also been found to be a good measure of physical functioning and driving outcomes (3, 4). The SPPB has previously been assessed as a predictor of DC (4). Gill et al. found that low SPPB scores were associated with 120% of the hazard of DC [HR = 2.2, 95% CI 1.3, 3.7] compared to high scores (3, 5). However, this sample came from one health plan in one geographic region and was oversampled based on physical disability (5). The data from our study sample may yield results that are more generalizable than those from the study by Gill et al. (5).
While the SPPB provides a valuable measure of physical capabilities in terms of lower extremity physical function, frailty is a clinical syndrome that develops following a decline in function and resilience across numerous physiological systems. Therefore, frailty provides an alternative, more comprehensive measure of physical capabilities than the SPPB (6, 7). Frailty is associated with falls, disability, hospitalization, and injury mortality (6–8). Baseline frailty in this cohort has previously been found to be associated with the rate of DC at 1 year HR of 4.2 (95% CI: 1.9–9.1) for pre-frail and HR of 6.1 (95% CI: 1.4–27.3) for frail participants (8). Ishii et al. evaluated driving cessation as the exposure and physical frailty transition as the outcome in a cohort of 2,934 older Japanese adults (9). They reported that driving cessation was a risk factor for frailty, as indicated by a 4.6% versus 17.1% difference in the rates for frailty transition (9). Our study is the first to evaluate time-varying frailty as the exposure and driving cessation as the outcome longitudinally.
The aim of this study was to examine the impact of frailty and SPPB on the likelihood of DC. We hypothesized that the presence of frailty and poor SPPB would lead to a higher likelihood of DC.
Methods
Participants, design, and procedures
We utilized the AAA Longitudinal Research on Aging Drivers (LongROAD) cohort, and the methods were described in detail previously (10). Using a clinical convenience sample, 40,806 patients were approached, with 7.3% enrolling in the study. LongROAD was a multisite prospective cohort of 2,990 older drivers enrolling participants aged 65–79 years recruited between July 2015 and March 2017 from five sites: Ann Arbor, MI; Baltimore, MD; Cooperstown, NY; Denver, CO; and San Diego, CA. The inclusion criteria were as follows: (1) living at their current address 80% of the year, (2) possessing a valid driver’s license, (3) driving on average at least once per week, (4) having no significant cognitive impairment, (5) driving one vehicle ≥80% of the time, (6) driving a vehicle with model year 1996 or newer with an available OBDII port, (7) not involved in another driving study, (8) planning to stay in their current location for another 5 years, and (9) not living with a current LongROAD participant (10). The annual data collection was completed in the following date ranges: Baseline —6 July 2015 to 31 March 2017; Year 1—6 July 2016 to 20 June 2018; Year 2—21 June 2017 to 8 June 2019; Year 3—3 July 2018 to 30 April 2020; Year 4—25 June to 24 November 2021; and Year 5—31 August 2020 to 27 September 2022. The Baseline, Year 2, and Year 4 or 5 (due to COVID-19 half of the cohort in Year 4 and the other half of the cohort in Year 5) visits were conducted in person. The other visits were conducted by telephone. Participants classified by the Fried Frailty Phenotype (FFP) or SPPB at least once (n = 2,986, 99.9%) were included in this analysis.
Measures
Covariates
It is well known that poor cognition and vision are important risk factors for driving cessation. Episodic and working memory were measured with immediate and delayed word recall tasks with higher scores indicative of better cognitive health (11). The Motor Free Visual Perception Test (MVPT-3) measured overall visual perception ability based on test items 22–34 (scores ranged from 0 to 13 with 13 indicating better visual perception) (12, 13).
Exposure
Short physical performance battery
Lower extremity physical function was measured using scores from the timed components of the National Health and Aging Trends Study (NHATS) Expanded SPPB: walking speed; repeated chair stands; three original standing balance tests (side-by-side, semi-tandem, and tandem); and an additional balance test (standing on one leg with eyes open) (14). Each participant received scores ranging from 0 to 4 for the three components. An SPPB summary score ranging from 0 to 12, with 12 representing the highest performance level, was created by summing the three scores. To account for a high level of performance in this cohort, cutoffs for each category were raised so that the SPPB scores are categorized as poor (0–7), fair (8–10), and good (11–12) (3).
Frailty
Frailty was measured using the FFP (6–8). Frailty status was evaluated by assessing five criteria on a pass/fail basis: shrinking (unintentional loss of ≥10 pounds in the past year or being underweight according to a body mass index (BMI) of ≤18.5 kg/m2), weakness (grip strength in the lowest 20% of the population, adjusted for sex and BMI), exhaustion (self-report of having poor endurance and energy), slowness (slowest 20% of the population based on time to walk 15 ft., adjusted for sex, and standing height), and low physical activity (not having recently walked for exercise or engaged in vigorous physical activity). If three or more of these criteria were met, the participant was classified as frail; if one or two criteria were met, the participant was classified as pre-frail; and if none was met, the participant was classified as not frail (6). In this study, the pre-frail and frail categories were collapsed into the “frail” category due to the models not converging with separate categories.
Primary outcomes
Driving cessation
Driving cessation was based on participants’ self-report, which was captured in one of the three ways. First, questions about driving status were assessed at each annual follow-up visit. Second, participants were instructed to notify the study team if they stopped driving. Third, participants’ driving activity was monitored using an in-vehicle GPS device. If there was no driving for at least 30 days, the study team reached out to participants to identify their current driving status.
Statistical analysis
Cox proportional hazard (PH) models with time-varying covariates were used to examine the impact of annual SPPB and frailty with time to DC among those who were still driving. SPPB and frailty were examined in separate PH models. The model fits data from day 0 to the end of the follow-up for each person. Each model included the following covariates to control confounding of data: age, sex, marital status, education, delayed and immediate word recall, and MVPT-3. All these covariates (except for sex) were time-varying (The model estimates were adjusted for clustering within each site.). The models were tested for interaction by sex.
Results
At baseline, 42% were 65–69 years old, 53% were female, 86% were non-Hispanic white, 41% had an advanced degree, and 63% were married (Table 1).
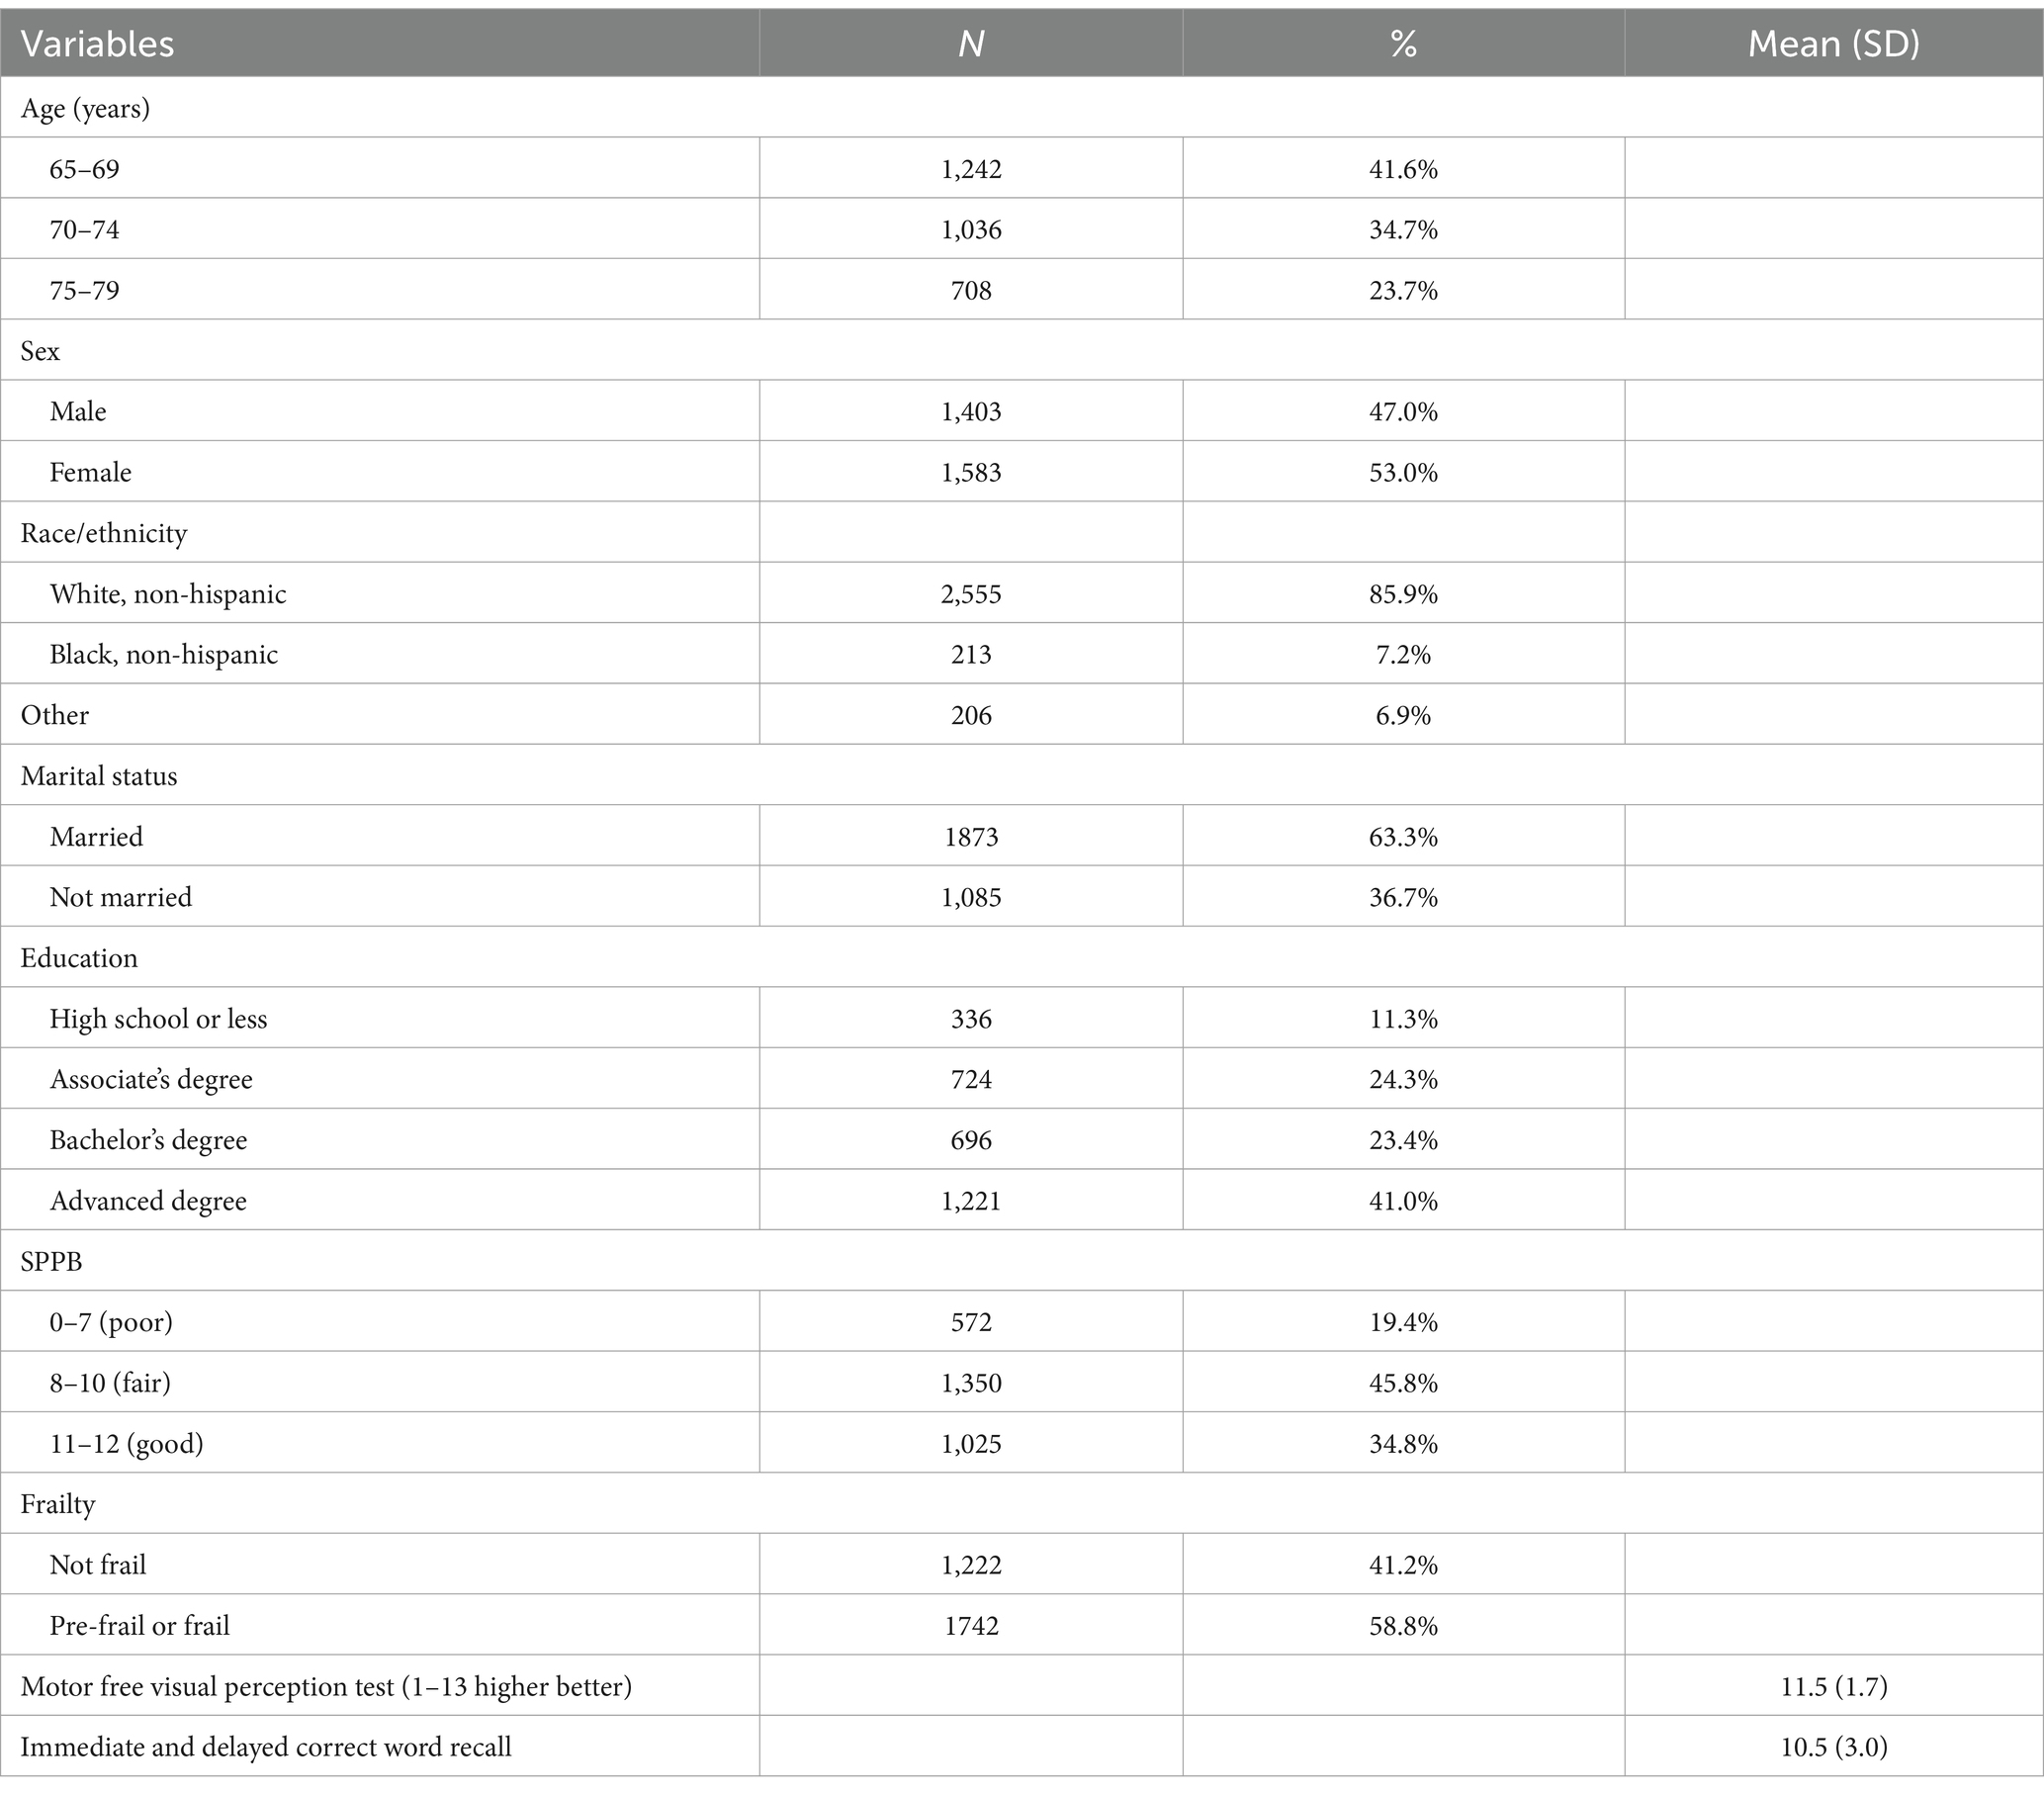
Table 1. Characteristics of baseline participants (N = 2,986).
Seventy-three participants stopped driving by Year 5. One participant resumed driving after having stopped. The interaction between SPPB fair level and sex was not significant (p = 0.32), and the interaction between SPPB good level and sex was significant (p = 0.0001). Overall, the interaction between SPPB and sex was significant (p = 0.0271), thus we ran both combined and stratified models by sex. For the combined models, after controlling for the time-varying covariates and comparing fair SPPB to poor SPPB, the results were as follows: adjusted (age, sex, marital status, education. delayed and immediate word (NOTE: NOT WORK), and vision) and adjusting for clustering within each site, the hazard ratio (aHR) was 0.31 (95% confidence interval (CI) 0.18, 0.52). Comparing good SPPB to poor SPPB the aHR was 0.09 (95% CI 0.04, 0.20). Among men, after controlling for the time-varying covariates (age, marital status, education, delayed and immediate word recall, and vision) and sex and adjusting for clustering within each site, the comparison of fair SPPB to poor SPPB, yielded the following results: the adjusted hazard ratio (aHR) was 0.45 (95% confidence interval (CI) 0.25, 0.81). Comparing good SPPB to poor SPPB, the aHR was 0.19 (95% CI 0.10, 0.36). Among women, after controlling for the time-varying covariates (age, marital status, education, delayed and immediate work recall, and vision) and adjusting for clustering within each site, comparing fair SPPB to poor SPPB, the results were as follows: adjusted hazard ratio (aHR) was 0.26 (95% CI 0.10, 0.65). Comparing good SPPB to poor SPPB, the aHR was <0.001 (see Table 2). For FFP, sex was not a significant effect modifier in the relationship between frailty and driving cessation (p = 0.9810) (see Table 3).
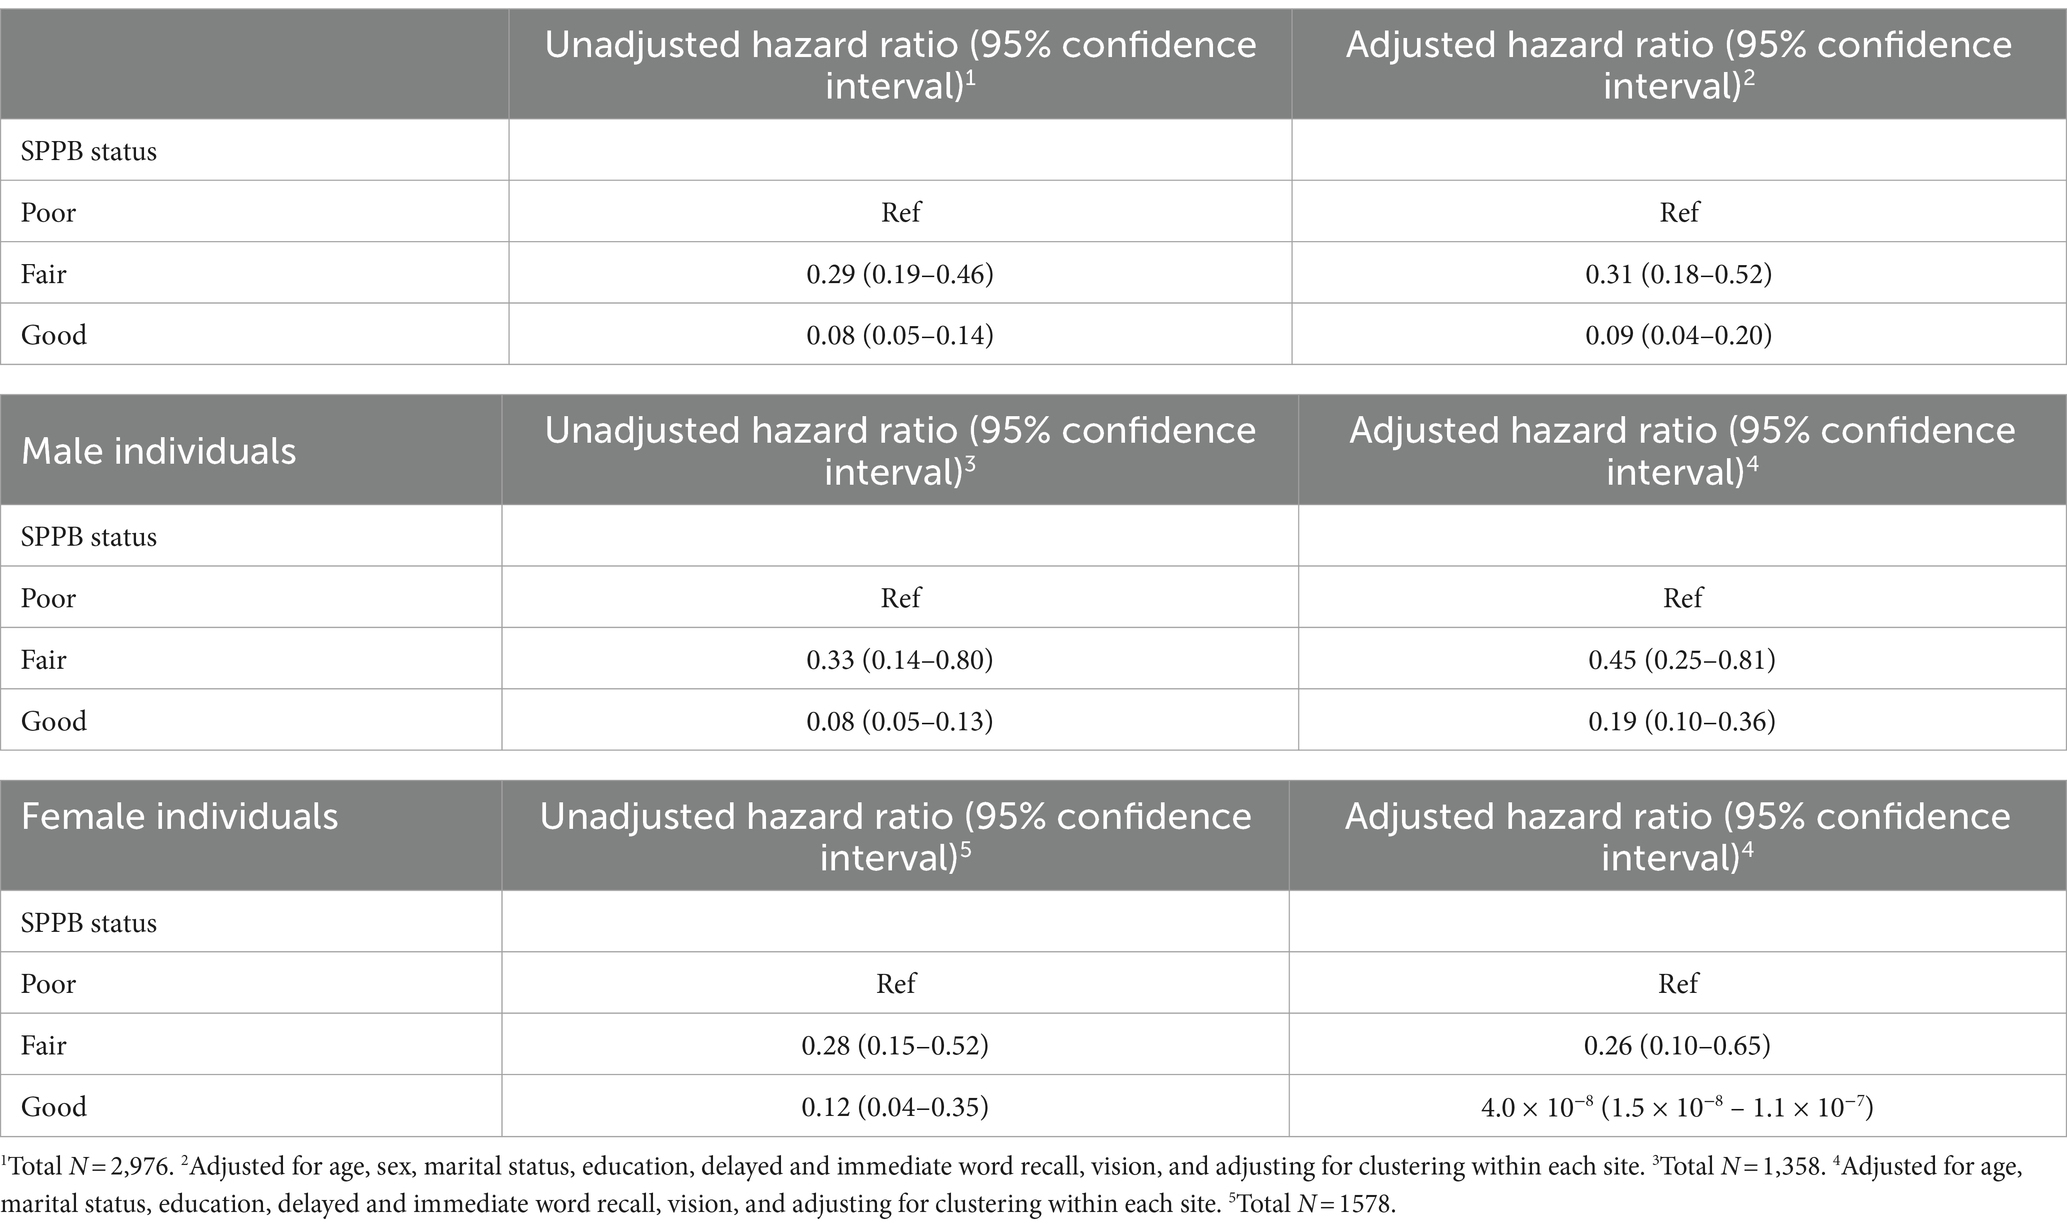
Table 2. Unadjusted and adjusted association of short physical performance battery (SPPB) with time to driving cessation.
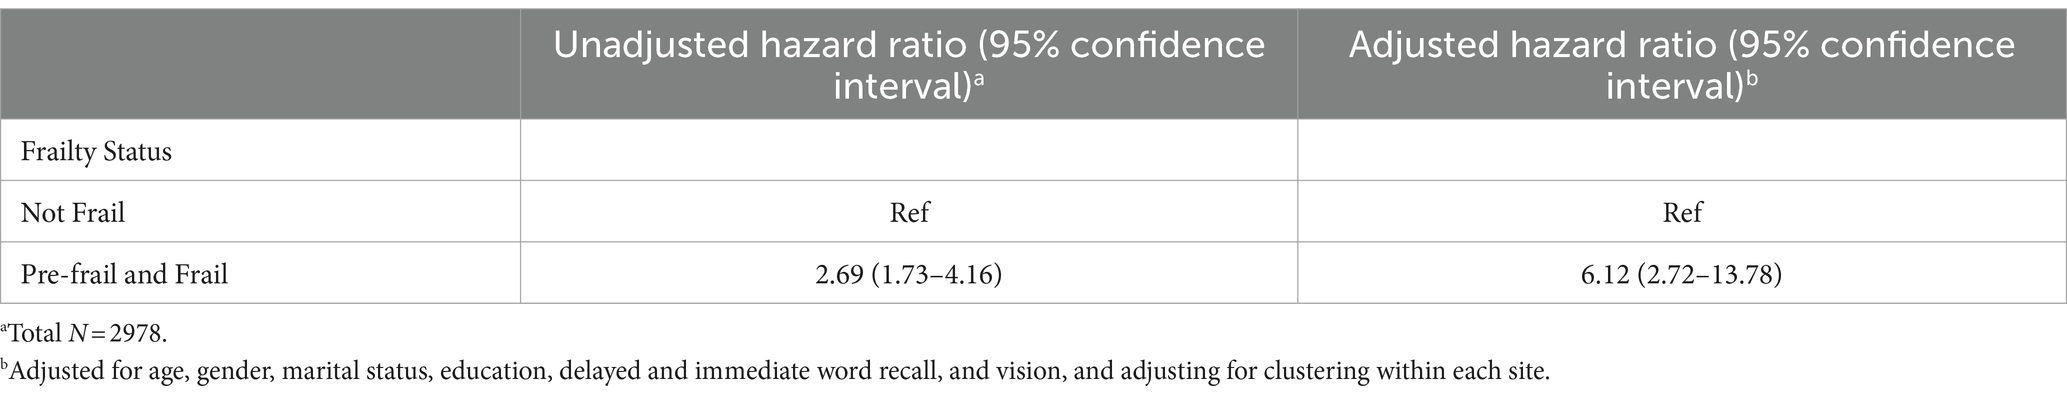
Table 3. Unadjusted and adjusted association of frailty status with time to driving cessation.
After controlling for the time-varying covariates (age, marital status, education, delayed and immediate work recall, and vision) and sex and adjusting for clustering within each site, the comparison of pre-frail and frail individuals with those not frail resulted in a HR of 6.1 (95% CI 2.7, 13.8).
Discussion
This study assessed the impact of repeated measures of frailty and SPPB and followed participants over 5 years for the likelihood of DC. Over the 5-year study period, we found a protective association of higher physical performance, especially in women, and a negative association of frailty with time to DC. Ishii et al. found that DC was an independent risk factor of physical frailty transition in older adults, but this is the first study to assess the impact of physical frailty transition on DC (9). Previous research utilized the baseline LongROAD data and evaluated SPPB with driving space and crashes, but did not find effect modification by sex (3). Gill et al. (5) assessed the risk factors associated with long-term disability in the community including driving a car and found that women had a HR of 1.86 (95% CI 1.41–2.46). Although sex differences in frailty are widely reported, we did not find sex differences while evaluating the time to driving cessation (15–17). It has been reported that women are more likely to transition into frailty and are more likely to change frailty status, and this should be evaluated in future studies (15, 18).
Frailty is not a static state and has been shown to be a dynamic state in a meta-analysis of 42,775 community-dwelling older adults, where 13.7% of them improved (15, 18). Targeted exercise interventions starting with balance and flexibility and then progressing to endurance and resistance training are shown to improve physical function in frail older adults when targeting the pre-frail (2, 15). More specifically, the American College of Sports Medicine guidelines suggest that resistance and balance training begin before endurance training (2, 19). Interventions incorporating exercise, nutrition, cognitive training, and behavioral therapy have shown sustained (6 months) improvements in frailty status (2, 20). Physical activity interventions prevented decline in on-road driving performance (21, 22). Age-related changes in both physical and cognitive function lead to driving cessation. These non-cognitive changes such as muscle strength are modifiable (23).
A limitation of this study is the low response rate to our clinical convenience sample, which may limit the generalizability of the findings to the entire US population of older drivers (3, 10). In the methods paper for LongROAD, Li et al. stated that the sample was overrepresented by non-Hispanic whites and individuals with higher education status (3, 10). In summary, improving both frailty and physical performance in older adults by keeping physically active, ensuring adequate nutrition, and undergoing cognitive training are interventions that older adults can focus on to potentially delay DC.
Conclusion
Frailty and poor physical functioning impacted driving cessation. Future interventions should target frailty and poor physical functioning to prolong driving cessation.
Data availability statement
The datasets presented in this article are not readily available because data access limited due to constraints from the consent form. Requests to access the datasets should be directed to dGptMjE0MUBjdW1jLmNvbHVtYmlhLmVkdQ==.
Ethics statement
The studies involving humans were approved by the institutional review boards of all participating institutions. The studies were conducted in accordance with the local legislation and institutional requirements. The participants provided their written informed consent to participate in this study.
Author contributions
TM: Conceptualization, Data curation, Formal analysis, Funding acquisition, Investigation, Methodology, Project administration, Supervision, Writing – original draft, Writing – review & editing. HJ: Conceptualization, Formal analysis, Methodology, Supervision, Writing – original draft, Writing – review & editing. CD: Data curation, Funding acquisition, Investigation, Writing – review & editing. DS: Data curation, Funding acquisition, Investigation, Writing – review & editing. HA: Data curation, Funding acquisition, Investigation, Methodology, Writing – review & editing. LM: Data curation, Funding acquisition, Investigation, Methodology, Writing – review & editing. DE: Data curation, Funding acquisition, Investigation, Methodology, Writing – review & editing. LH: Data curation, Funding acquisition, Investigation, Writing – review & editing. GL: Data curation, Funding acquisition, Investigation, Methodology, Writing – review & editing.
Funding
The author(s) declare financial support was received for the research, authorship, and/or publication of this article. This work was supported by the AAA Foundation for Traffic Safety (AAAFTS). This research was supported in part by a grant 1 R49 CE002096-01 from the National Center for Injury Prevention and Control, Centers for Disease Control and Prevention, to the Center for Injury Epidemiology and Prevention at Columbia University. Its contents are solely the responsibility of the authors and do not necessarily represent the official views of the Centers for Disease Control and Prevention.
Conflict of interest
The authors declare that the research was conducted in the absence of any commercial or financial relationships that could be construed as a potential conflict of interest.
Publisher’s note
All claims expressed in this article are solely those of the authors and do not necessarily represent those of their affiliated organizations, or those of the publisher, the editors and the reviewers. Any product that may be evaluated in this article, or claim that may be made by its manufacturer, is not guaranteed or endorsed by the publisher.
References
1. Falkenstein, M, Karthaus, M, and Brüne-Cohrs, U. Age-related diseases and driving safety. Geriatrics (Basel). (2020) 5:80. doi: 10.3390/geriatrics5040080
2. Walston, J, Buta, B, and Xue, QL. Frailty screening and interventions: considerations for clinical practice. Clin Geriatr Med. (2018) 34:25–38. doi: 10.1016/j.cger.2017.09.004
3. Ng, LS, Guralnik, JM, Man, C, DiGuiseppi, C, Strogatz, D, Eby, DW, et al. Association of Physical Function with Driving Space and Crashes among Older Adults. Gerontologist. (2020) 60:69–79. doi: 10.1093/geront/gny178
4. Mielenz, TJ, Durbin, LL, Cisewski, JA, Guralnik, JM, and Li, G. Select physical performance measures and driving outcomes in older adults. Inj Epidemiol. (2017) 4:14. doi: 10.1186/s40621-017-0110-2
5. Gill, TM, Gahbauer, EA, Murphy, TE, Han, L, and Allore, HG. Risk factors and precipitants of long-term disability in community mobility: a cohort study of older persons. Ann Intern Med. (2012) 156:131–40. doi: 10.7326/0003-4819-156-2-201201170-00009
6. Fried, LP, Tangen, CM, Walston, J, Newman, AB, Hirsch, C, Gottdiener, J, et al. Cardiovascular health study collaborative research group. Frailty in older adults: evidence for a phenotype. J Gerontol A Biol Sci Med Sci. (2001) 56:M146–57. doi: 10.1093/gerona/56.3.m146
7. Xue, QL . The frailty syndrome: definition and natural history. Clin Geriatr Med. (2011) 27:1–15. doi: 10.1016/j.cger.2010.08.009
8. Crowe, CL, Kannoth, S, Andrews, H, Strogatz, D, Li, G, DiGuiseppi, C, et al. Associations of frailty status with low-mileage driving and driving cessation in a cohort of older drivers. Geriatrics (Basel). (2020) 5:19. doi: 10.3390/geriatrics5010019
9. Ishii, H, Doi, T, Tsutsumimoto, K, Nakakubo, S, Kurita, S, and Shimada, H. Driving cessation and physical frailty in community-dwelling older adults: a longitudinal study. Geriatr Gerontol Int. (2021):21. doi: 10.1111/ggi.14272
10. Li, G, Eby, DW, Santos, R, Mielenz, TJ, Molnar, LJ, Strogatz, D, et al. Longitudinal research on aging drivers (LongROAD): study design and methods. Inj Epidemiol. (2017) 22:4. doi: 10.1186/s40621-017-0121-z
11. Wallace, RB, and Herzog, AR. Overview of the health measures in the health and retirement study. J Hum Res. (1995) 30:S84–S107. doi: 10.2307/146279
12. Eby, DW, Molnar, LJ, Kostyniuk, LP, Zakrajsek, JS, Ryan, L, Zanier, N, et al. The association between visual abilities and objectively-measured driving space, exposure, and avoidance among older drivers: a preliminary analysis. J Aust College Road Safety. (2018) 29:39–45. doi: 10.3316/informit.146311795135973
13. Coarusso, RP, and Hammill, DD. Motor-free Visual Perception Test-Third Edition. Novato, C A: Academic Therapy Publications (2003).
14. Kasper, J. D., Freedman, V. A., and Niefeld, M. R. (2012). Construction of performance-based summary measures of physical capacity in the National Health and aging trends study. NHATS technical paper #4. Available at: https://www.nhats.org/scripts/TechnicalPerfSumMeasure.htm
15. Kojima, G, Taniguchi, Y, Iliffe, S, Jivraj, S, and Walters, K. Transitions between frailty states among community-dwelling older people: a systematic review and meta-analysis. Ageing Res Rev. (2019) 50:81–8. doi: 10.1016/j.arr.2019.01.010
16. Hubbard, RE . Sex differences in frailty. Interdiscip Top Gerontol Geriatr. (2015) 41:41–53. doi: 10.1159/000381161
17. Collard, RM, Boter, H, Schoevers, RA, and Oude Voshaar, RC. Prevalence of frailty in community-dwelling older persons: a systematic review. J Am Geriatr Soc. (2012) 60:1487–92. doi: 10.1111/j.1532-5415.2012.04054.x
18. Trevisan, C, Veronese, N, Maggi, S, Baggio, G, Toffanello, ED, Zambon, S, et al. Factors influencing transitions between frailty states in elderly adults: the Progetto Veneto Anziani longitudinal study. J Am Geriatr Soc. (2017) 65:179–84. doi: 10.1111/jgs.14515
19. American College of Sports MedicineChodzko-Zajko, WJ, Proctor, DN, Fiatarone Singh, MA, Minson, CT, Nigg, CR, et al. American College of Sports Medicine position stand. Exercise and physical activity for older adults. Med Sci Sports Exerc. (2009) 41:1510–30. doi: 10.1249/MSS.0b013e3181a0c95c
20. Ng, TP, Feng, L, Nyunt, MS, Feng, L, Niti, M, Tan, BY, et al. Nutritional, physical, cognitive, and combination interventions and frailty reversal among older adults: a randomized controlled trial. Am J Med. (2015) 128:1225–1236.e1. doi: 10.1016/j.amjmed.2015.06.017
21. Marottoli, RA, Allore, H, Araujo, KL, Iannone, LP, Acampora, D, Gottschalk, M, et al. A randomized trial of a physical conditioning program to enhance the driving performance of older persons. J Gen Intern Med. (2007) 22:590–7. doi: 10.1007/s11606-007-0134-3
22. Abe, T, Fujii, K, Seol, J, Fujii, Y, Joho, K, Sato, A, et al. Driving frequency associated with deficits in lower extremity function, dynamic vision, and physical activity in Japanese older adults. J Trans Health. (2018) 9:282–7. doi: 10.1016/j.jth.2018.01.010
Keywords: older adults, driving cessation, frailty, physical performance, driving outcomes
Citation: Mielenz TJ, Jia H, DiGuiseppi CG, Strogatz D, Andrews HF, Molnar LJ, Eby DW, Hill LL and Li G (2024) Frailty and poor physical functioning as risk factors for driving cessation. Front. Public Health. 12:1298539. doi: 10.3389/fpubh.2024.1298539
Edited by:
Yunhwan Lee, Ajou University, Republic of KoreaReviewed by:
Luenda Charles, Centers for Disease Control and Prevention (CDC), United StatesRevital Feige Gross Nevo, Independent Researcher, Jerusalem, Israel
Copyright © 2024 Mielenz, Jia, DiGuiseppi, Strogatz, Andrews, Molnar, Eby, Hill and Li. This is an open-access article distributed under the terms of the Creative Commons Attribution License (CC BY). The use, distribution or reproduction in other forums is permitted, provided the original author(s) and the copyright owner(s) are credited and that the original publication in this journal is cited, in accordance with accepted academic practice. No use, distribution or reproduction is permitted which does not comply with these terms.
*Correspondence: Thelma J. Mielenz, dGptMjE0MUBjdW1jLmNvbHVtYmlhLmVkdQ==