 Dandan Yang1,2†
 Chuanfeng Zhang1†Yuheng Chen1†
 Jing Lu1
 Yunting Chen1
 Zhi Zhang1Feifei Chai3Zhendong Zhang2*Furu Wang1,2*
 Baoli Zhu1,2*
- 1Jiangsu Provincial Center for Disease Control and Prevention, Nanjing, China
- 2Department of Genetic Toxicology, Key Laboratory of Modern Toxicology of the Ministry of Education, Center for Global Health, School of Public Health, Nanjing Medical University, Nanjing, China
- 3Department of Sexually Transmitted Diseases and AIDS, Xuzhou Center for Disease Control and Prevention, Xuzhou, China
Objective: This study aimed to evaluate the spatiotemporal distribution of patients with hepatitis C virus (HCV) and the factors influencing this distribution in Jiangsu Province, China, from 2011 to 2020.
Methods: The incidence of reported HCV in Jiangsu Province from 2011 to 2020 was obtained from the Chinese Information System for Disease Control and Prevention (CISDCP). R and GeoDa software were used to visualize the spatiotemporal distribution and the spatial autocorrelation of HCV. A Bayesian spatiotemporal model was constructed to explore the spatiotemporal distribution of HCV in Jiangsu Province and to further analyze the factors related to HCV.
Results: A total of 31,778 HCV patients were registered in Jiangsu Province. The registered incidence rate of HCV increased from 2.60/100,000 people in 2011 to 4.96/100,000 people in 2020, an increase of 190.77%. Moran's I ranged from 0.099 to 0.354 (P < 0.05) from 2011 to 2019, indicating a positive spatial correlation overall. The relative risk (RR) of the urbanization rate, the most important factor affecting the spread of HCV in Jiangsu Province, was 1.254 (95% confidence interval: 1.141–1.376), while other factors had no significance.
Conclusion: The reported HCV incidence rate integrally increased in the whole Jiangsu Province, whereas the spatial aggregation of HCV incidence was gradually weakening. Our study highlighted the importance of health education for the floating population and reasonable allocation of medical resources in the future health work.
1 Introduction
Hepatitis C is an infectious disease caused by hepatitis C virus (HCV), which is transmitted mainly through blood, sexual contact, and mother-to-fetus transmission (1). HCV is tightly associated with hepatocellular carcinoma (HCC) and it is a long-term process involves a sequence of steps, including chronic hepatic inflammation, liver fibrosis, steatosis, cirrhosis, irreversible genetic or epigenetic alterations, and progression of the malignant carcinogenic cells without effective treatment (2). The World Health Organization (WHO) estimates that approximately 58 million patients with chronic HCV infection (3) and approximately 399,000 people die each year from HCV-related complications (4). In 2016, the WHO Global Health Sector Strategy (GHSS) on viral hepatitis explicitly proposed a target to reduce the incidence of new hepatitis C cases by 90% by 2030 (5). In China, HCV causes a great disease burden, with approximately 7.6 million people living with chronic infections (6), and the incidence of HCV has demonstrated an upward trend (7). Jiangsu Province is one of the most developed provinces in eastern China and has over 80 million permanent residents. The enormous population size and population mobility poses a great challenge for HCV prevention and control, although Jiangsu Province is an area with low endemicity for HCV infection.
Previous studies showed that HCV prevalence is influenced by spatial and temporal factors (8, 9). An HCV epidemiological survey showed that there were obvious regional differences in HCV incidence in China. Some researchers established 11 provinces as hotspots of clustered HCV-infected patients by performing a spatial analysis of HCV in mainland China from 2005 to 2011 (10). Zhu et al. (11) reported that the epidemic of HCV in China became much more severe from 2003 to 2015, and the hotspots gradually shifted from northeastern to western China. The hotspots identified in these studies were mostly located in economically underdeveloped areas or border areas of China. The incidence of HCV in rural areas is significantly higher than that in urban areas, and the incidence in the central and western regions is higher than that in the eastern regions. The larger cluster of HCV-infected patients in these areas is attributed to poorer economic status or drug use. However, for Jiangsu Province, an economically developed province in the eastern region of China, no study has clarified the spatiotemporal epidemiological characteristics of HCV. The Bayesian spatiotemporal model provides a robust method to integrate embedded temporal information, spatial information, and parameter uncertainty (prior distribution) (12), thereby describing the spatiotemporal characteristics and identifying spatiotemporally associated factors. In this study, we used the Bayesian spatiotemporal model to investigate the spatiotemporal distribution of HCV in Jiangsu Province from 2011 to 2020 and to further explore the factors related to HCV incidence.
2 Materials and methods
2.1 Data sources
The incidence data on registered HCV patients from 2011 to 2020 were obtained from the Chinese Information System for Disease Control and Prevention (CISDCP) of Jiangsu Province, and analysis was conducted according to the current address of the patients. The number of permanent residents was calculated as the number of HCV patients in an area divided by the incidence in different years. Other demographic and socioeconomic variables, including the urbanization rate, disposable income per capita, number of doctors, number of beds per 1,000 people, and national basic medical insurance participation rate, were collected from the Statistical Yearbook (13–25) of 13 cities in Jiangsu Province from 2011 to 2020. The vector maps of counties in Jiangsu Province were obtained from the database of the China National Catalog Service for Geographic Information (https://www.webmap.cn/main.do?method=index).
2.2 Spatial autocorrelation analysis
Spatial autocorrelation analysis was performed at the district and county levels. Global spatial autocorrelation was used to analyze the overall spatial aggregation of the HCV epidemic in ninety-six districts and counties of Jiangsu Province. Moran's I was set between [−1, 1] and was calculated as follows Equation 1 (26):
where n are the number of districts and counties in Jiangsu Province, xi and xj are the hepatitis C patients in districts i and j, respectively, is the average number of registered hepatitis C patients in all regions in this study, and wij represents the adjacent weight matrix corresponding to the district pair i and j. If p < 0.05, the spatial correlation was considered statistically significant. Moran's I > 0 indicated a positive spatial correlation, whereas Moran's I < 0 indicated a negative correlation. Local indicators of spatial association (LISA) analysis was conducted to estimate the impact of individual areas on the overall situation and types of clusters. All the above analyses were performed by GeoDa (version 1.18.0.0; Center for Spatial Data Science).
2.3 Bayesian spatiotemporal model analysis
We studied the impact of the urbanization rate, disposable income per capita, number of doctors and beds, and on the registered HCV incidence for each city in Jiangsu Province from 2011 to 2020. The Bayesian spatiotemporal model is a hierarchical model based on Markov chain Monte Carlo (MCMC) simulations (12). The number of HCV patients was generally considered to follow a Poisson distribution as follows Equation 2 (27):
where yit represents the registered HCV patient number in the tth year (t = 1, 2, …, 10) and region i (i = 1, 2, …, 13), Eit is the expected number of HCV patients in year t and region i, and θit is the ratio of the actual number of HCV patients to the expected number in year t and region i, which represents the relative risk (RR) of disease incidence. A Bayesian model was constructed based on the logarithmic form of θit, computed as follows Equation 3:
β0 is the intercept, βk denotes the regression coefficients of the collected factors, and xi1, …, xi5 represent the urbanization rate, disposable income per capita, number of doctors and beds per 1,000 people, and national basic medical insurance participation rate, respectively.
In Equation 4, ui is the spatial structure effect, reflecting spatial correlation, which is assumed to subject to a conditional autoregressive process, with a Gaussian distribution, and the mean being the weighted average of neighboring regions uj, i ≠ j, computed as follows, where δi is the first-order neighborhood of region i, nδi is the number of neighboring regions in region i, and is the variance of the spatial effect.
vt is the temporal structure effect, whose prior distribution is a first-order general autoregressive (AR) model (1), reflecting that the temporal effect vt at moment t is only related to the temporal effect vt−1 at the previous moment. The above model was analyzed by the CARBayesST package in R (version 3.6.2; R Foundation for Statistical Computing).
3 Results
3.1 Spatiotemporal distribution of HCV incidence in Jiangsu Province
A total of 31,778 HCV patients were registered in Jiangsu Province from 2011 to 2020. The registered incidence of HCV rose from 2.60 patients per 100,000 people in 2011 to 4.96 patients per 100,000 in 2020, an increase of 190.77%, with the highest incidence in 2019 (5.27 patients per 100,000 people). As shown in Table 1, Huai'an city (6.86 patients per 100,000 people) and Xuzhou city (6.62 patients per 100,000 people) located in the northern area of Jiangsu Province and Wuxi city (5.44 patients per 100,000 people) located in the southern area were the regions with the highest average incidence of HCV. In contrast, Nantong and Nanjing city situated in the south of Jiangsu Province had the lowest incidence. In general, the northern region of Jiangsu Province had a higher HCV incidence, which increased over time. Figure 1 shows the change in the reported incidence of HCV in Jiangsu Province from 2011–2020; the darker the color is the higher the HCV incidence.
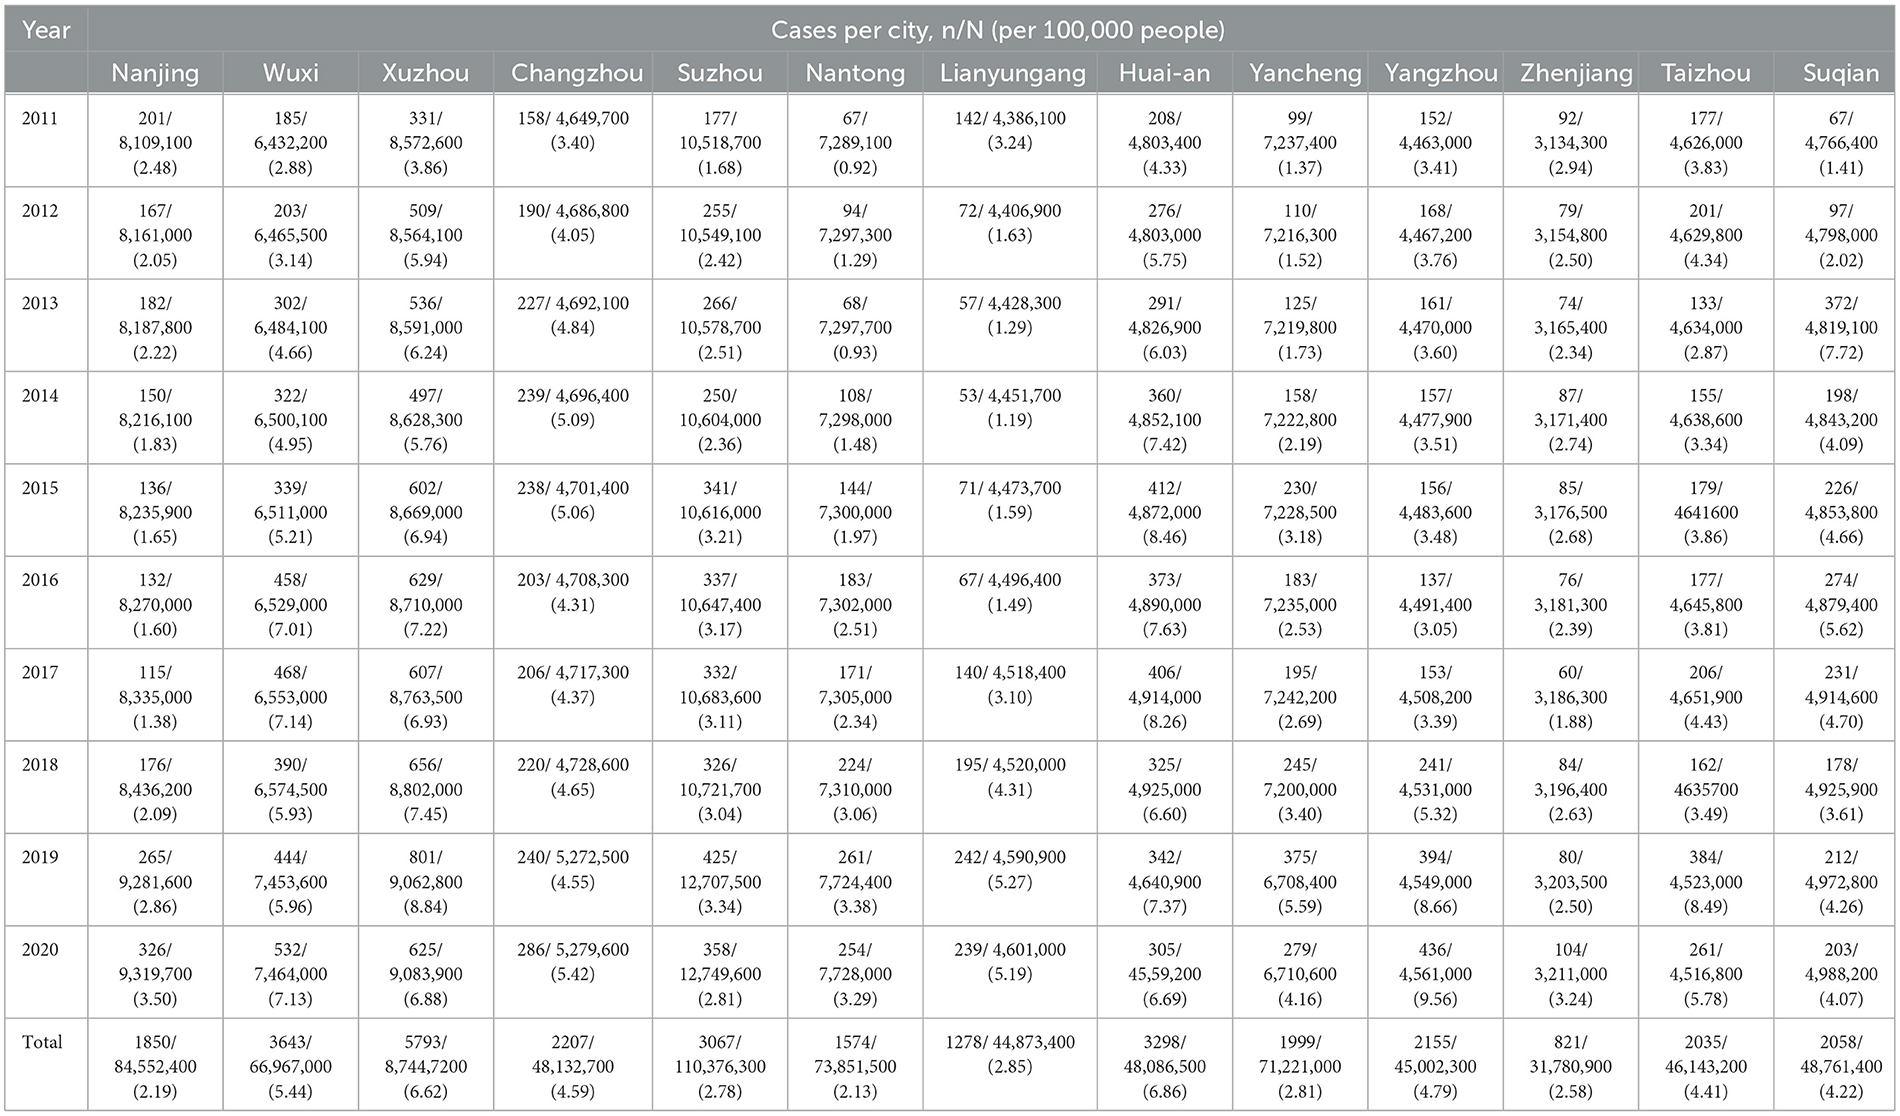
Table 1. Number of HCV cases and incidence rates by city in Jiangsu Province from 2011 to 2020.
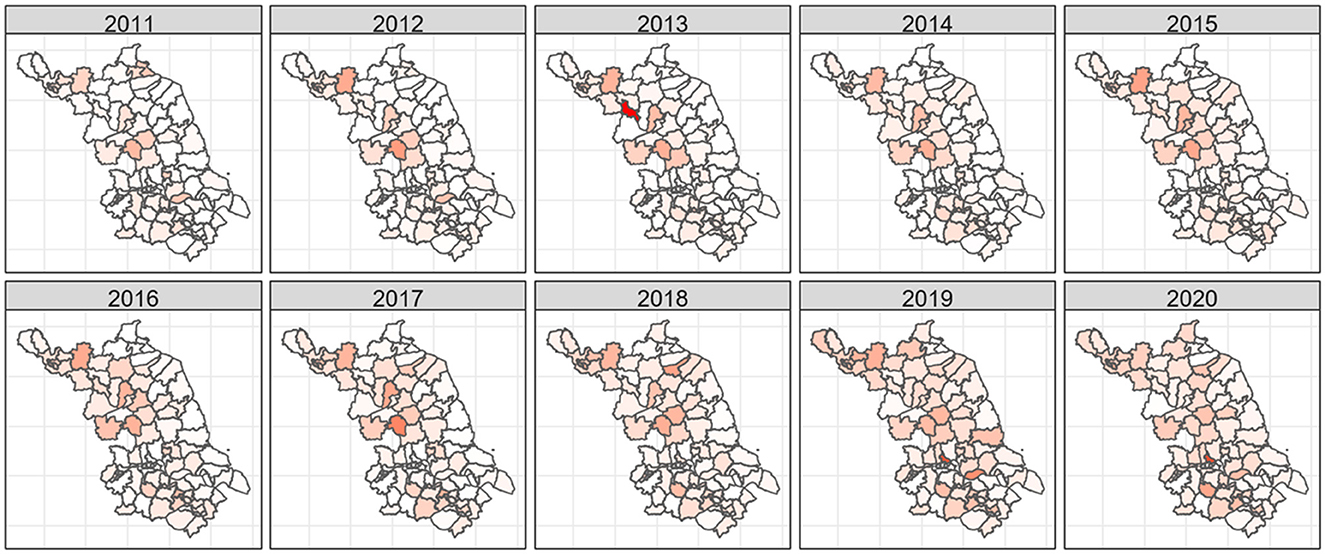
Figure 1. Reported HCV incidence by district in Jiangsu Province from 2011–2020.
3.2 Spatial autocorrelation analysis of HCV incidence
We performed spatial autocorrelation analysis at the district and county levels. The specific registered HCV incidence at the district and county levels is shown in a heatmap (Figure 2). The results of the global spatial autocorrelation analysis of HCV incidence over the last decade are described in Table 2. Moran's I ranged from 0.099 to 0.354 (P < 0.05 for each Moran's I) from 2011 to 2019, suggesting a positive spatial correlation of HCV incidence at the district and county levels in Jiangsu Province. Moran's I in 2020 was 0.073 (P > 0.05), indicating that there was no spatial clustering and that the incidence of HCV was randomly distributed throughout the province. Before 2013, the hotspots of HCV incidence were mainly located in some districts or counties belonging to Xuzhou city and Huai'an city in the northern region of Jiangsu Province (Figure 3). After 2014, the hotspots gradually spread from the northern to the southern region. The coldspots of HCV incidence were consistently located in Nanjing city and Nantong city during the study period (Figure 3).
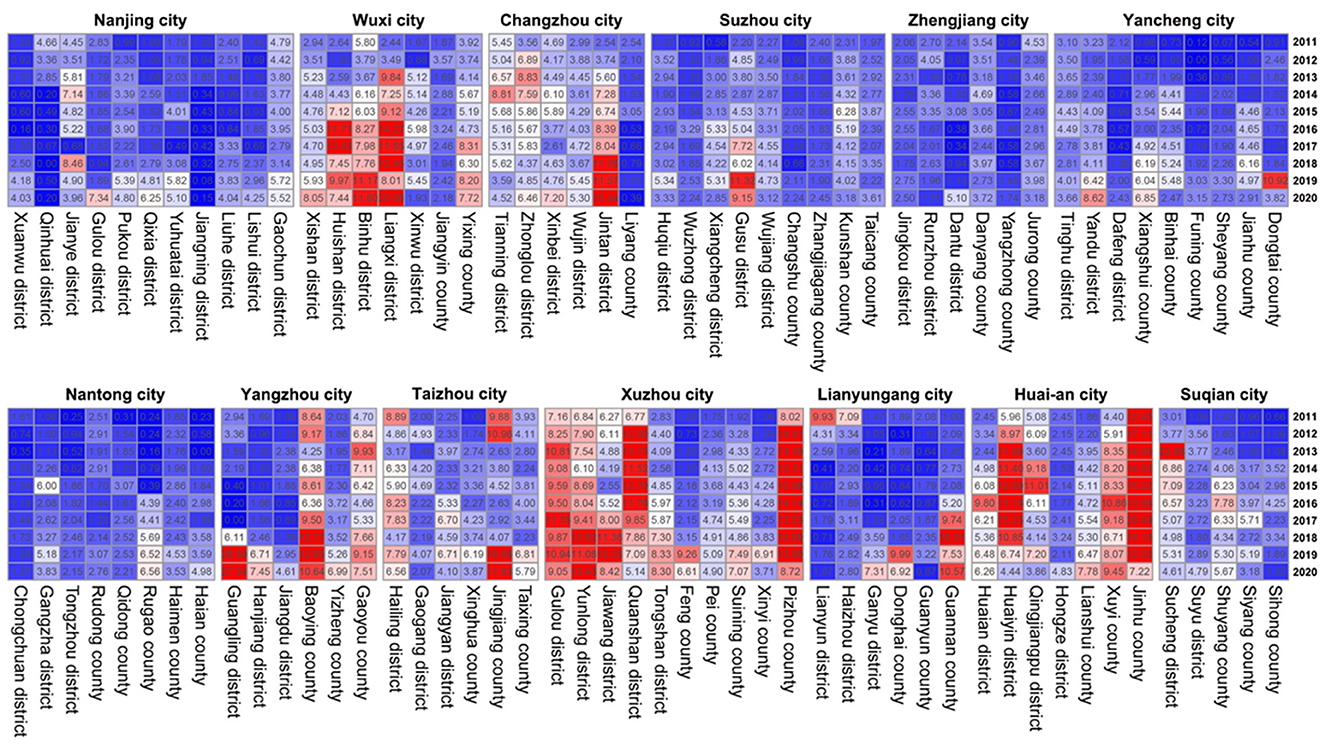
Figure 2. Heatmap of reported HCV incidence by district in Jiangsu Province from 2011 to 2020.
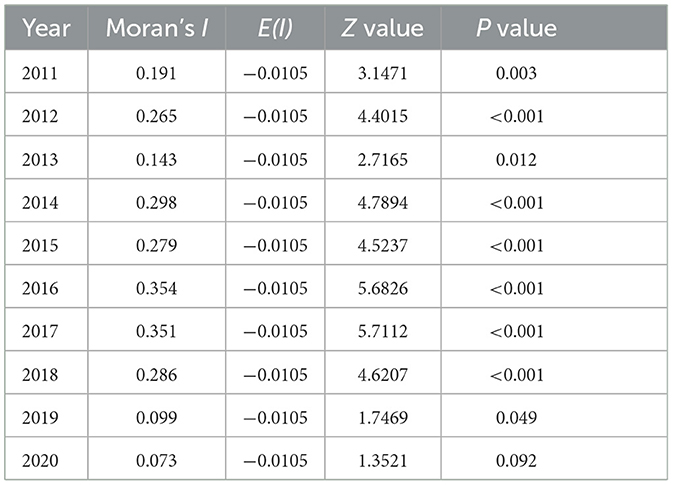
Table 2. Results of global spatial autocorrelation analysis of HCV incidence in Jiangsu Province, China, from 2011 to 2020.
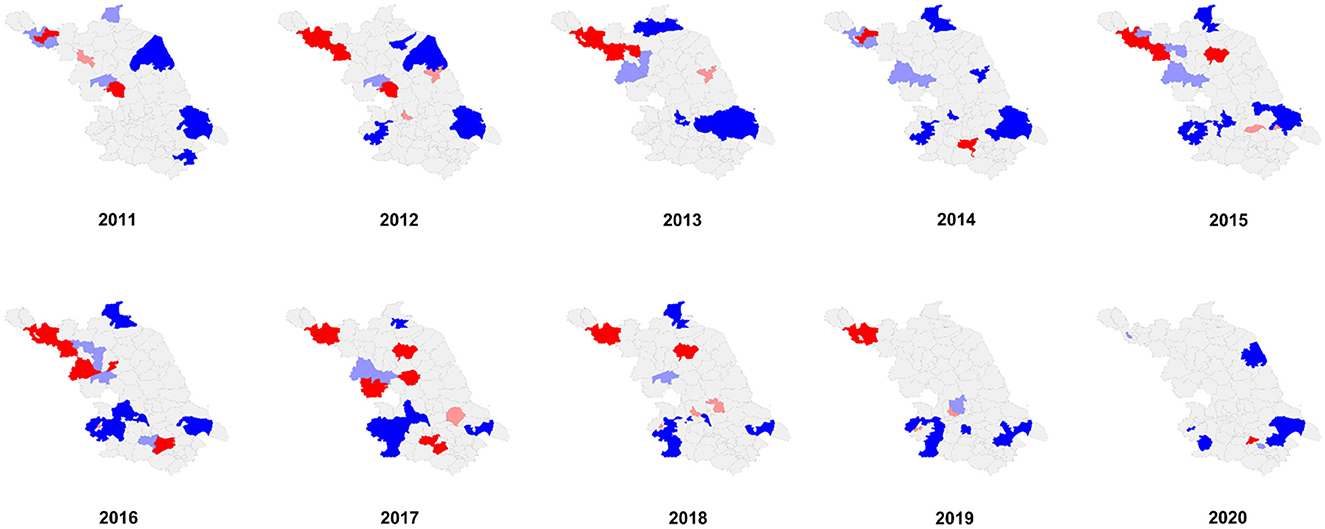
Figure 3. LISA cluster map of HCV incidence in Jiangsu Province from 2011 to 2020.
3.3 Bayesian analysis of registered HCV patients in Jiangsu Province
Bayesian spatiotemporal model analysis revealed that the urbanization rate was the most important factor affecting the epidemic situation of HCV in Jiangsu Province [RR = 1.254, 95% confidence interval (CI): 1.141–1.376], while other factors had no significant effect on the risk of HCV incidence (Table 3). The RR of HCV infection increased by 25.4% for every 1% increase in the urbanization rate.
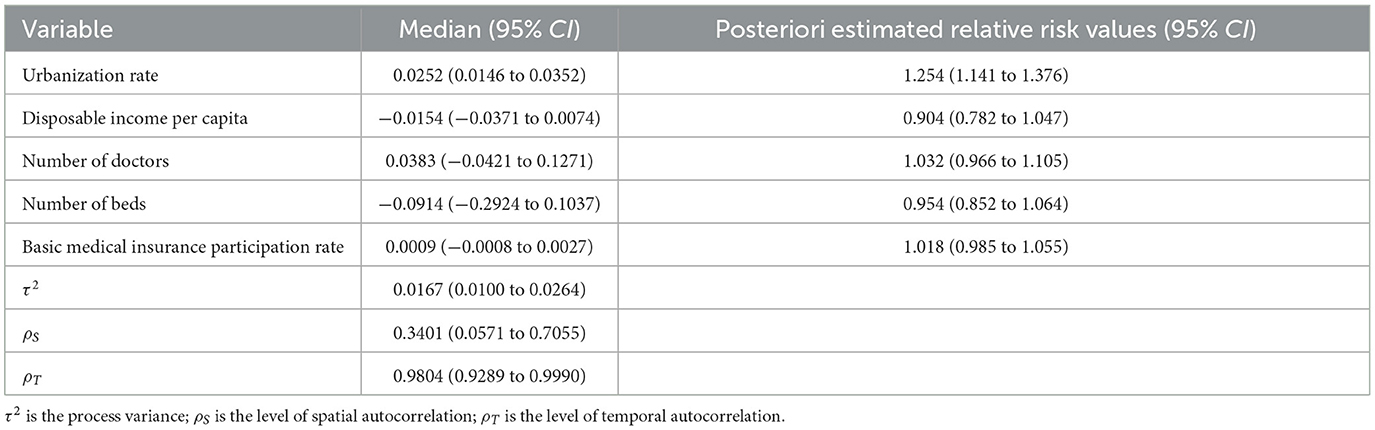
Table 3. Bayesian spatiotemporal model regression coefficient values.
4 Discussion
This study analyzed the spatial and temporal characteristics of the incidence of HCV in Jiangsu Province. We found that the incidence of HCV generally increased but varied widely by region from 2011 to 2020 in Jiangsu Province. Based on the Bayesian spatiotemporal model, the urbanization rate was the most important factor affecting HCV incidence in Jiangsu Province.
In China, blood transfusion, especially transfusion of contaminated blood or blood products, was the dominant mode of HCV transmission in the late 1980s and early 1990s (1). In 1998, the Chinese government outlawed paid blood donations (28) for clinical use, drastically reducing transmission from blood or blood products. However, due to the lack of medical resources or health awareness, many people did not receive the test for HCV infection, which became a significant barrier to achieving HCV elimination (29). Fortunately, the expansion of insurance coverage and patient reimbursement schemes in China resulted in the increased exposure of large segments of the population to the health care system. Active or passive medical screening became more frequent with age in these populations that were once exposed to contaminated blood or blood products, leading to an increase in HCV detection rates. In contrast to the past, injecting drug users (IDUs) and sexual transmission are no the main routes of HCV transmission (30). IDUs and unsafe sex activities also contributed to the spread of HCV from high-risk populations to the general population. In general, IDUs and sexual transmission might be responsible for the upward trend of HCV in Jiangsu Province.
Spatial autocorrelation analysis indicated that HCV clusters had significant spatial aggregation before 2020 in Jiangsu Province. Before 2013, HCV hotspots were mainly located in the cities of Xuzhou and Huai'an in the northern region of Jiangsu Province. After 2014, the southern region of Jiangsu Province also appeared as a hotspot, such as Wujin District in Changzhou city and Binhu and Liangxi districts in Wuxi city. Hotspots gradually spread from the northern to the southern regions of Jiangsu Province. Remarkably, Xuzhou city was a highly clustered area of HCV prevalence from 2011 to 2019 in Jiangsu Province. Geographical location is one of the major reasons for the high HCV prevalence in Xuzhou city. Xuzhou city is located at the border of four provinces, including Henan Province, a region with a severe HCV epidemic due to illegal blood donations. The complicated human mobility situation and relatively unfavorable economic conditions aggravate the spread of HCV in Xuzhou city. The southern areas in Jiangsu Province are highly developed and can offer great employment opportunities, which lead to the migration of many workers to these regions. In addition, according to the sentinel surveillance from the Jiangsu Provincial Centers for Disease Control and Prevention, the population size of IDUs and people with HIV in southern Jiangsu is significantly larger than that in northern Jiangsu. As a result, population mobility and a higher proportion of IDUs and unprotected sexual encounters might be responsible for the spread of hotspots from the northern to the southern regions of Jiangsu Province.
This study found that the urbanization rate was the most important factor affecting the epidemic situation of HCV in Jiangsu. The RR of HCV infection increased by 25.4% for every 1% increase in the urbanization rate. In contrast, other factors had no significant effect on the risk of hepatitis C in this model. Continuing rural-to-urban migration with the development of urbanization swelled the population density of the city, thus inevitably exacerbating the intensified transmission risk of HCV. Therefore, during the process of urbanization, reasonable allocation of medical resources should be highly emphasized to ensure that the health service needs of various types of floating populations in cities are met.
Due to insoluble constraints, this study still has some limitations. The most important limitation is that the demographic and socioeconomic information was obtained from the Statistical Yearbook at the prefectural level, and some factors affecting the incidence of hepatitis C may have been concealed. Further research is needed in the future. In addition, data on HCV patients and incidence relied on the CISDCP. Due to the discrepant quality of reports in different regions, there may have been discrepancies between the reported number of HCV patients and the real situation.
5 Conclusion
In conclusion, the reported incidence of HCV in Jiangsu Province showed a significant upward trend from 2011 to 2020, whereas the spatial aggregation of HCV incidence was gradually weaking. Rising urbanization rates was a crucial factor affecting the incidence of HCV, therefore, our study highlighted the importance of health education for the floating population and reasonable allocation of medical resources in the future health work.
Data availability statement
The raw data supporting the conclusions of this article will be made available by the authors, without undue reservation.
Author contributions
DY: Writing—original draft. CZ: Writing—original draft. YuhC: Writing—review & editing. JL: Writing—original draft. YunC: Writing—review & editing. ZhiZ: Writing—review & editing. FC: Writing—review & editing. ZheZ: Project administration, Supervision, Writing—review & editing. FW: Methodology, Writing—review & editing. BZ: Project administration, Supervision, Writing—review & editing.
Funding
The author(s) declare that no financial support was received for the research, authorship, and/or publication of this article.
Acknowledgments
We want to express our sincere appreciation for the Jiangsu Provincial CDC for providing the data on the reported HCV incidence.
Conflict of interest
The authors declare that the research was conducted in the absence of any commercial or financial relationships that could be construed as a potential conflict of interest.
Publisher's note
All claims expressed in this article are solely those of the authors and do not necessarily represent those of their affiliated organizations, or those of the publisher, the editors and the reviewers. Any product that may be evaluated in this article, or claim that may be made by its manufacturer, is not guaranteed or endorsed by the publisher.
Supplementary material
The Supplementary Material for this article can be found online at: https://www.frontiersin.org/articles/10.3389/fpubh.2024.1282575/full#supplementary-material
References
1. Gao X, Cui Q, Shi X, Su J, Peng Z, Chen X, et al. Prevalence and trend of hepatitis C virus infection among blood donors in Chinese mainland: a systematic review and meta-analysis. BMC Infect Dis. (2011) 11:88. doi: 10.1186/1471-2334-11-88
2. Goto K, Suarez AAR, Wrensch F, Baumert TF, Lupberger J. Hepatitis C virus and hepatocellular carcinoma: when the host loses its grip. Int J Mol Sci. (2020) 21:3057. doi: 10.3390/ijms21093057
3. World Health Organization. Hepatitis C. (2023). Available online at: https://www.who.int/news-room/fact-sheets/detail/hepatitis-c (accessed July 12, 2023).
4. World Health Organization. New WHO study: Making diagnosis of hepatitis C more accessible and closer to the community using point-of-care HCV viral load assays. (2023). Available online at: https://www.who.int/news/item/24-01-2023-new-who-study-making-diagnosis-of-hcv-more-accessible-and-closer-to-the-community-using-poc-hcv-viral-load-assays (accessed January 24, 2023).
5. World Health Organization. Global hepatitis report, 2017. (2017). Available online at: https://www.who.int/publications/i/item/9789241565455 (accessed April 19, 2017).
6. Chen YS Li L, Cui FQ, Xing WG, Wang L, Jia ZY, et al. A sero-epidemiological study on hepatitis C in China. Chin J Epidemiol. (2011) 32:888–91.
7. Bian DD, Zhou HY, Liu S, Liu M, Duan C, Zhang JY, et al. Current treatment status and barriers for patients with chronic HCV infection in mainland China: a national multicenter cross-sectional survey in 56 hospitals. Medicine. (2017) 96:e7885. doi: 10.1097/MD.0000000000007885
8. Guo Y, Sun HQ Yu SC, Ma JQ, Xiao GX. Analyses on temporal and spatial clustering and changing trend of HCV in Mainland of China. Value Health. (2014) 17:A685. doi: 10.1016/j.jval.2014.08.2562
9. Butt ZA, Mak S, Gesink D, Gilbert M, Wong J, Yu A, et al. Applying core theory and spatial analysis to identify hepatitis C virus infection “core areas” in British Columbia, Canada. J Viral Hepat. (2019) 26:373–83. doi: 10.1111/jvh.13043
10. Wang L, Xing J, Chen F, Yan R, Ge L, Qin Q, et al. Spatial analysis on hepatitis C virus infection in mainland China: from 2005 to 2011. PLoS ONE. (2014) 9:e110861. doi: 10.1371/journal.pone.0110861
11. Zhu B, Liu J, Fu Y, Zhang B, Mao Y. Spatio-temporal epidemiology of viral hepatitis in China (2003-2015): Implications for prevention and control policies. Int J Environ Res Public Health. (2018) 15:661. doi: 10.3390/ijerph15040661
12. Wu J, Lu AD, Zhang LP, Zuo YX, Jia YP. Study of clinical outcome and prognosis in pediatric core binding factor-acute myeloid leukemia. Chin J Hematol. (2019) 40:52–7.
13. Nanjing Bureau of Statistics. Nanjing Statistical Yearbook. (2023). Available online at: http://tjj.nanjing.gov.cn/bmfw/njtjnj/ (accessed August 3, 2023).
14. Wuxi Bureau of Statistics. Wuxi Statistical Year book. (2023). Available online at: http://tj.wuxi.gov.cn/ztzl/tjnj/index.shtml (accessed August 3, 2023).
15. Xuzhou Bureau of Statistics. Xuzhou Statistical Yearbook. (2023). Available online at: http://tj.xz.gov.cn/dynamic/zwgk/govInfoPub.html (accessed August 3, 2023).
16. Changzhou Bureau of Statistics. Changzhou Statistical Yearbook. (2023). Available online at: http://tjj.changzhou.gov.cn/class/MFCMMFBD (accessed August 3, 2023).
17. Suzhou Bureau of Statistics. Suzhou Statistical Yearbook. (2023). Available online at: http://tjj.suzhou.gov.cn/sztjj/tjnj/nav_list.shtml (accessed August 3, 2023).
18. Nantong Bureau of Statistics. Nantong Statistical Yearbook. (2023). Available online at: http://tjj.nantong.gov.cn/ntstj/tjnj/tjnj.html (accessed August 3, 2023).
19. Lianyungang Bureau of Statistics. Lianyungang Statistical Yearbook. (2023). Available online at: http://tjj.lyg.gov.cn/tjxxw/tjnj/tjnj.html (accessed August 3, 2023).
20. Huai'an Bureau of Statistics. Huai'an Statistical Yearbook. (2023). Available online at: http://tjj.huaian.gov.cn/tjnj/list.html (accessed August 3, 2023).
21. Yancheng Bureau of Statistics. Yancheng Statistical Yearbook. (2023). Available online at: http://tjj.yancheng.gov.cn/col/col1779/index.html (accessed August 3, 2023).
22. Yangzhou Bureau of Statistics. Yangzhou Statistical Yearbook. (2023). Available online at: http://tjj.yangzhou.gov.cn/nj2022/index.htm (accessed August 3, 2023).
23. Zhenjiang Bureau of Statistics. Zhenjiang Statistical Yearbook. (2023). Available online at: http://stats.jiangsu.gov.cn/col/col87684/index.html (accessed August 3, 2023).
24. Taizhou Bureau of Statistics. Taizhou Statistical Yearbook. (2023). Available online at: https://www.taizhou.gov.cn/dwzw/dzqk/tznj/index.html (accessed August 3, 2023).
25. Suqian Bureau of Statistics. Suqian Statistical Yearbook. (2023). Available online at: http://tjj.suqian.gov.cn/stjj/xxgk/xxgk.shtml (accessed August 3, 2023).
26. Moran PAP. Some theorems on time series. Biometrika. (1947) 34:281–291. doi: 10.1093/biomet/34.3-4.281
27. Souza WV, Carvalho MS, Albuquerque Mde F, Barcellos CC, Ximenes RA. Tuberculosis in intra-urban settings: a Bayesian approach. Trop Med Int Health. (2007) 12:323–30. doi: 10.1111/j.1365-3156.2006.01797.x
28. The Central People's Government of the People's Republic of China. Law of the People's Republic of China on blood donations. (2005). Available online at: https://www.gov.cn/banshi/2005-08/01/content_18963.htm (accessed August 1, 2005).
29. Wasitthankasem R, Wanlapakorn N, Pimsing N, Posuwan N, Poovorawan Y. Simplified test-to-treat strategy for hepatitis C in Thailand: the phetchabun model. J Infect Dis. (2023) 228:S198–S203. doi: 10.1093/infdis/jiac490
30. Degenhardt L, Peacock A, Colledge S, Leung J, Grebely J, Vickerman P, et al. Global prevalence of injecting drug use and sociodemographic characteristics and prevalence of HIV, HBV, and HCV in people who inject drugs: a multistage systematic review. Lancet Global health. (2017) 5:e1192–e207. doi: 10.1016/S2214-109X(17)30375-3
Keywords: hepatitis C, HCV, Bayesian model, reported incidence, spatiotemporal distribution
Citation: Yang D, Zhang C, Chen Y, Lu J, Chen Y, Zhang Z, Chai F, Zhang Z, Wang F and Zhu B (2024) Distribution of hepatitis C virus in eastern China from 2011 to 2020: a Bayesian spatiotemporal analysis. Front. Public Health 12:1282575. doi: 10.3389/fpubh.2024.1282575
Received: 24 August 2023; Accepted: 05 February 2024;
Published: 21 February 2024.
Edited by:
Nuno Sepulveda, Warsaw University of Technology, PolandReviewed by:
Andong Qin, Huai'an No. 4 People's Hospital, ChinaKayode Oshinubi, Northern Arizona University, United States
Copyright © 2024 Yang, Zhang, Chen, Lu, Chen, Zhang, Chai, Zhang, Wang and Zhu. This is an open-access article distributed under the terms of the Creative Commons Attribution License (CC BY). The use, distribution or reproduction in other forums is permitted, provided the original author(s) and the copyright owner(s) are credited and that the original publication in this journal is cited, in accordance with accepted academic practice. No use, distribution or reproduction is permitted which does not comply with these terms.
*Correspondence: Baoli Zhu, emh1YmxjZGNAc2luYS5jb20=; Furu Wang, d2FuZ2Z1cnVAanNjZGMuY24=; Zhendong Zhang, emR6aGFuZ0Buam11LmVkdS5jbg==
†These authors have contributed equally to this work and share first authorship