
94% of researchers rate our articles as excellent or good
Learn more about the work of our research integrity team to safeguard the quality of each article we publish.
Find out more
ORIGINAL RESEARCH article
Front. Public Health , 17 May 2023
Sec. Environmental Health and Exposome
Volume 11 - 2023 | https://doi.org/10.3389/fpubh.2023.973158
This article is part of the Research Topic Environment and health in contaminated sites: from anthropogenic impacts to prevention options View all 8 articles
 Qiang Feng1,2
 Chao-Qun Fan2
 Jing-Jing Wang2Huan Wang2Dong-Ming Wu2
 George P. Nassis3,4Mei Wang2*
 Hai-Jun Wang1*
Background: Muscle strength is closely related to chronic noncommunicable diseases; specifically, a decline in handgrip strength (HS) is predominant globally. Exposure to green space—built environment components used for health intervention—reportedly decreases the risk of certain diseases and all-cause mortality. However, evidence in this area is limited.
Objective: We aimed to explore the association between green space exposure and muscle strength and ascertain the combined effect of physical activity and green space exposure on muscle strength.
Method: Data from 128,759 participants (aged 20–79 years) were obtained using a complex stratified multistage probability cluster sampling design. The green space was assessed as normalized difference vegetation index (NDVI) data for a 500-m buffer zone based on the geolocation information of sampling sites. We used a questionnaire to investigate transportation, occupation, physical activity, leisure-time exercise behaviors, and sedentary time within a usual week of the preceding year. The outcome was low relative HS, defined as HS-to-body weight ratio, and the percentage of men and women with relative HS in the lower third. We defined adequate physical activity as 150 min of moderate-intensity or 75 min of vigorous physical activity per week and calculated the weighted proportion of participants with insufficient physical activity. Categorical variables of NDVI and physical activity were used as exposure variables and their interrelationship was evaluated in a generalized linear mixed model (GLMM) to estimate the odds ratios (ORs) and 95% confidence intervals (95% CI). We measured interaction on an additive or multiplicative scale using a GLMM to test the interaction between green space exposure and physical activity. All analyses were performed for the total sample and subgroups (urban and rural).
Result: The high NDVI group had a lower risk of low relative HS than the low NDVI group (OR [95% CI]: 0.92 [0.88–0.95]). The sufficient physical activity group had a lower risk of low relative HS than the insufficient physical activity group (OR [95% CI]: 0.85 [0.81–0.88]). There was an interactive effect on the additive scale (relative excess risk owing to interaction: 0.29, 95% CI 0.22–0.36, p < 0.001) between green space exposure and physical activity.
Conclusion: High NDVI and adequate physical activity were protective factors against low relative HS in Chinese adults. Increasing green space exposure and physical activity together may have a greater potentiating effect on muscle strength improvement than these two protective factors individually. Green spaces should be incorporated into city design or built environments.
– We obtained data from 128,759 consenting Chinese adults.
– We used a complex stratified multistage probability cluster sampling design.
– High NDVI and adequate physical activity protected against low relative HS.
– A combined increase in green space exposure and physical activity may elicit a greater muscle strength improvement than an increase in green space exposure or physical activity alone in people living in rural areas.
– Green spaces may be incorporated in city designs or built environments.
Muscle strength is closely related to chronic non-communicable diseases (1, 2) and all-cause mortality (3); hence, studies on muscle strength are important and have a high public health significance. A decline in handgrip strength (HS) is predominant both globally (4) and in urban and rural Chinese populations (5, 6); thus, more evidence-based solutions are required to address this serious public health problem. Relative HS has recently emerged as a better indicator of overall body muscle strength than absolute muscle strength and might be more comparable among people with different body masses (5, 7, 8).
The World Health Organization (WHO) has created a committee on social determinants of health to improve the essential factors (such as socioeconomic factors, lifestyle, and environmental factors) of communities and individuals, which are key elements of human health. Focusing on the determinants of health and the integration of health into all policies (Health in All Policies) has become a research hotspot in the field of public health (9). Based on the social determinants of the health research framework, lifestyle, and environmental changes (including more green space) may improve muscle strength (10).
With respect to lifestyle, a dose–response relationship has been demonstrated between physical activity and muscle strength, and randomized controlled studies have suggested that physical activity effectively promotes muscle strength in adults (11, 12). In a study with a British cohort of 1,645 participants (778 men and 867 women) born in 1946 physical activity (homemade questionnaire survey) and HS were evaluated, After adjustment for sex, participants with moderate-intensity leisure-time physical activity (MPA) and vigorous leisure-time physical activity (VPA) at the age of 36 years showed higher HS levels at 60–64 years than inactive participants in that study (4). In Korea, insufficient aerobic exercise has been shown to be a risk factor for decreased HS (13). Therefore, increasing the physical activity level could improve muscle strength.
Green spaces are built environment components that can be used for health intervention; they have recently become research hotspots on health outcomes and demonstrated potential health benefits (14, 15). Moreover, green space exposure decreased the risk of cardiovascular disease, diabetes, respiratory disease, obesity, and all-cause mortality. Furthermore, green space exposure might affect muscle strength. McCormack et al. (16) reported that exposure to green space, which is an essential aspect of the Physical Activity Neighborhood Environment Scale, increases self-rated muscle strength. Another study among adolescents showed that the density of parks around schools has a positive effect on the physical fitness score including cardiorespiratory fitness and muscle strength (17). Some studies have demonstrated an association between green space exposure and physical activity; furthermore, at the population level, exposure to green spaces such as parks is crucial for increasing physical activity (18, 19). However, except for these studies, evidence in this area is limited. Further studies are required to clarify whether green space exposure can improve muscle strength; in addition, no study has thoroughly investigated the combined effect of green space exposure and physical activity on muscle strength.
Therefore, we hypothesized that green space exposure can improve muscle strength and physical activity; moreover, green space exposure and physical activity have a combined effect on muscle strength improvement. In this study, we aimed to provide an insight into the association between green space exposure alone, and in combination with physical activity, providing evidence for muscle strength improvement to facilitate health-conscious environmental policy-making.
Using a complex stratified multistage probability cluster sampling design, we analyzed data from the 2020 Chinese National Survey on Adults’ Fitness, the largest nationally representative survey of civilians in the People’s Republic of China, which was conducted from August to November 2020. The details of recruitment have been described elsewhere (6).
Briefly, 31 provinces, autonomous regions, and municipalities in mainland China were covered in the first stage. In the second stage, three sub-provincial or prefectural-level cities ranked between provinces and counties in the administrative structure of China were randomly selected from each province, based on their economic positions weighted by the gross domestic product assessment, which constitutes the inner-province socioeconomic status (low, middle, and high). Three urban districts (or three rural counties) in each city were selected in the third stage. Three city streets (or rural towns) were chosen for the fourth stage. Two-street community societies (or villages) were selected for the fifth stage. In the final stage, systematic sampling was used to select equal numbers of eligible participants from each workplace or residence to be followed up for at least 3 years. The retirement age in China is 60 years. Participants who were younger than 60 years and living in cities were chosen from the sampling sites based on their workplaces, and participants older than 60 years and living in rural areas were chosen from the sampling sites based on their home addresses. All participants were chosen on the basis of the principles described above and represented Chinese people living in rural and urban areas (Figure 1).

Figure 1. Flow chart of sampling design in the 2020 Chinese National Survey on Adults’ Fitness.
After receiving explanations from trained investigators, participants completed a questionnaire to provide information about demographic characteristics (sex, age, nationality, education level, and career). Each participant signed an informed consent form prior to enrolment. The study protocol was approved by the General Administration of Sports of the People’s Republic of China (20).
We used a handgrip strength measurement device (Jianmin II, Beijing, People’s Republic of China) to measure the HS in the dominant hand. Before the measurement, the participants held the grip handles with their dominant hand and adjusted the grip width by applying an appropriate grip force. Participants remained upright, with feet naturally separated at shoulder width and arms dropped naturally and inclined at a 10–30° angle from the trunk. After three consecutive tests, we recorded the maximal value for each participant (HS in kg, rounded up to 0.1 kg) with adequate rest intervals (2 min or longer). We used a weight scale (Jianmin II, Beijing, People’s Republic of China) to measure the weight of participants. During the test, the participants wore shorts and bare feet, naturally stood in the center of the scale, kept their body stable, and recorded in kilograms (kg), accurate to one decimal place. The relative HS was calculated using the HS-to-body weight ratio.
All site addresses were translated into geolocation information (in terms of longitude and latitude). We excluded all sampling sites with fewer than 10 participants. We used satellite-derived normalized difference vegetation index (NDVI) data for a 500-m buffer zone (NDVI-500), which was determined based on the geolocation information of the sampling sites. In previous studies, exposure to green spaces with smaller buffer zones (250-m buffer zone) had a stronger association with mental health, whereas exposure to green spaces with larger buffer zones (1,000-m buffer zone) had a greater effect on physical activity; hence, we chose a 500-m buffer zone in our analysis (21, 22). We retrieved the NDVI level for each grid cell using Terra Moderate Resolution Imaging Spectroradiometer (MODIS, United States) vegetation indices (MOD13Q1), which were obtained from the United States Geological Survey and generated every 16 days (23). The NDVI value ranges between −1 and + 1, with higher values indicating more green space exposure. As green space exposure influences human behavior in the long term (24, 25), we calculated the mean NDVI for a 12-month period; thus, we set up the start date as 1 year before the survey and the end date as 1 day before the survey. We used the same method described by Cusack et al. (26) and Lin et al. (27) to estimate the NDVI-500 for each sampling site. Moreover, we identified all 16-day composite images that covered the period from the start date to the end date for each sampling site based on the site address. Finally, we summed up the NDVI values and calculated the average as the mean of NDVI-500.
Through the questionnaire survey, trained investigators collected data on physical activity. We investigated transportation, occupational physical activity, leisure-time exercise behaviors, and sedentary time within a usual week of the preceding year. The questionnaire on physical activity had been described in details in our previous article, which was validated among Chinese adults (n = 2,014, age 20–75 years) (6).
We determined different physical activity levels for each participant: low-intensity physical activity, MPA, and VPA. Participants who exercised for more than 10 h/day were excluded. We defined adequate physical activity as achieving 150 or 75 min of MPA or VPA per week, respectively. In addition to physical activity, we collected data on career, education, settlement (urban or rural), and nationality (Han or minority) using a questionnaire.
We used Tukey’s approach (28, 29) to exclude outliers, which were HS and weight values exceeding 1.5 times the interquartile range (method shown in Supplementary Figure S1). We expressed the relative HS as median [interquartile range (IQR)] because the values were not normally distributed. We calculated the low relative HS rate by using the percentage of relative HS. The relative HS of the lower third of male and female participants was taken as the cut-off value.
To explore the relationship between the NDVI and relative HS, we separated the participants into two groups using the median NDVI value in all sample sites: low (rural <0.3327, urban <0.2729) and high (rural ≥0.3327, urban ≥0.2729) NDVI groups.
We used data from the seventh national census released by the China National Bureau of Statistics in 2020, and the survey data were weighted according to sex and 5-year-interval age groups in 31 provinces in mainland China. We then calculated the weighted proportion of participants with sufficient physical activity, which could represent the Chinese population.
The generalized linear mixed model (GLMM) was used to estimate the odds ratios (ORs). The outcome variable was a low relative HS. The categorical variables NDVI and physical activity were considered as separate exposure variables. Additionally, each additional IQR of NDVI and the addition of 150 and 75 min of MPA and VPA per week, respectively, were considered continuous variables.
We presented the results of two statistical models in which the province of each participant was used as a random effect. In the crude model, we only explored the exposure and outcome variables. In the adjusted model, we adjusted for age groups (in 5-year increments from a 20–24 year-old group), sex (male or female), inner-province socioeconomic status (low, middle, or high), nationality (Han or minority), education level (primary school or less, junior high school, senior high school, or university and above), career (technical staff, business people, agricultural personnel, or other occupation), time spent on sedentary activities within 1 week and whether participants had an adequate physical activity or NDVI (low or high) in the year before data collection.
The samples were divided into four groups: high NDVI and sufficient physical activity, high NDVI and insufficient physical activity, low NDVI and sufficient physical activity, and low NDVI and insufficient physical activity. Using the low NDVI and insufficient physical group as the reference group, GLMM was used for OR analysis in the adjusted model. We measured the interaction between green space exposure and physical activity on an additive or a multiplicative scale using the GLMM, wherein NDVI, physical activity, and their product terms were added, and the p-value of the product term reflected the interaction under the multiplication scale. Simultaneously, the interaction under the additive scale was determined by calculating the relative excess risk due to interaction (RERI). The delta method facilitates the calculation of the standard error and confidence interval (CI) (30) using Microsoft Excel (Microsoft Corporation, Redmond, WA, United States). All analyses were performed for the total sample population and subgroups (urban and rural sample populations).
In our sampling method, participants aged less than 60 years residing in urban areas were chosen based on their workplaces, and we hypothesized that all participants were not far from home. To test the robustness of the results, we performed two sensitivity analyses. Firstly, we excluded the big cities with populations greater than 5 million people (Beijing, Tianjin, Shanghai, Chongqing, Wuhan, Chengdu, Hangzhou, Nanjing, Zhengzhou, Xian, and Jinan) from the analyses. Secondly, we excluded all samples with weekday transportation time above a cut-off value: walking and riding a bicycle for more than 1 h, riding a motorcycle and driving a car for more than 30 min, and taking a bus for more than 60 min. In the subgroup analysis, we performed stratified analyses between adults aged 20–59 and 60–79 years and between sex groups to test the robustness of our results. In addition, the relative HS was the most studied parameter because it could reflect whole-body strength.
All statistical analyses were performed using R version 3.6.1 (R Foundation for Statistical Computing, Vienna, Austria). Statistical significance was defined as a two-sided p-value < 0.05. The results are expressed as the regression coefficient (for continuous variables) or OR (for categorical variables). The weighted rate of adequate physical activity was calculated using the R “survey” package. Data related to green space exposure were downloaded using the R software “modistools” package, and the GLMM used the R software “lm4” and “lmertest” statistical packages. In the additive scale, interactions were determined using the RERI Excel programme developed by Knol et al. (31).
We invited 158,720 potential participants; of them, 128,759 were enrolled in the study (response rate = 81.1%). Table 1 shows the general characteristics, relative HS values, and physical activity of the study population obtained during the national survey. There was no significant difference in age between the high and low NDVI groups.

Table 1. Characteristics of the study population.
Table 2 presents basic information on green space exposure. The median exposure level in the 500-m buffer zone of the whole population was 0.30 (IQR: 0.16). In rural and urban areas, the median exposure levels in the 500-m buffer zones were 0.33 (IQR: 0.18) and 0.27 (IQR: 0.13), respectively. After adjustment for the provincial administrative divisions and economic situation in the province, the NDVI levels in the 500-m buffer zones were significantly higher in rural areas than in cities and towns (p < 0.001).
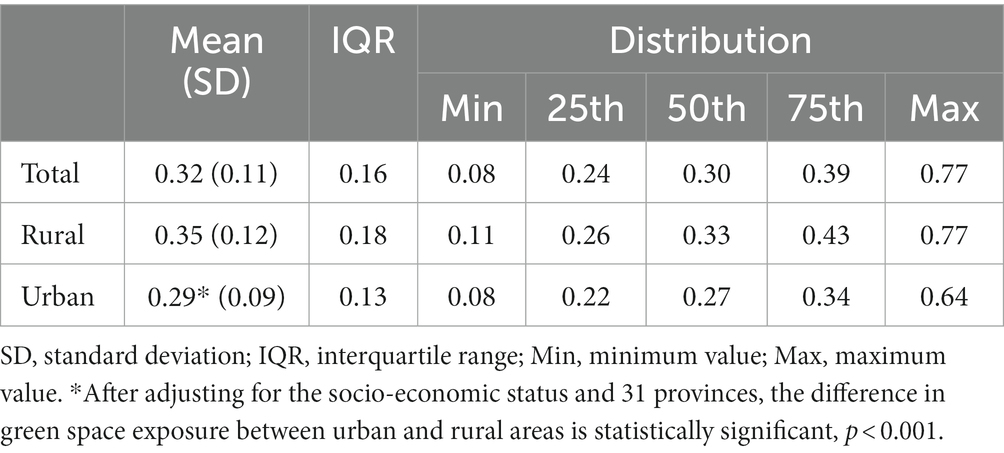
Table 2. Basic information related to green space exposure.
The basic physical activity levels of the participants are presented in Table 3. The average leisure physical activity times of the total, rural, and urban populations were 152.5 (IQR 240.0), 119.0 (IQR 150.0), and 190.4 (IQR 300.0) min/week, respectively. Moreover, 19,068 (14.8%), 6,865 (10.0%), and 12,203 (20.3%) people reached the recommended levels of physical activity in the total, rural, and urban populations, respectively. The proportion of people who reached the recommended levels of physical activity was significantly higher in the urban than in the rural population (p < 0.001).
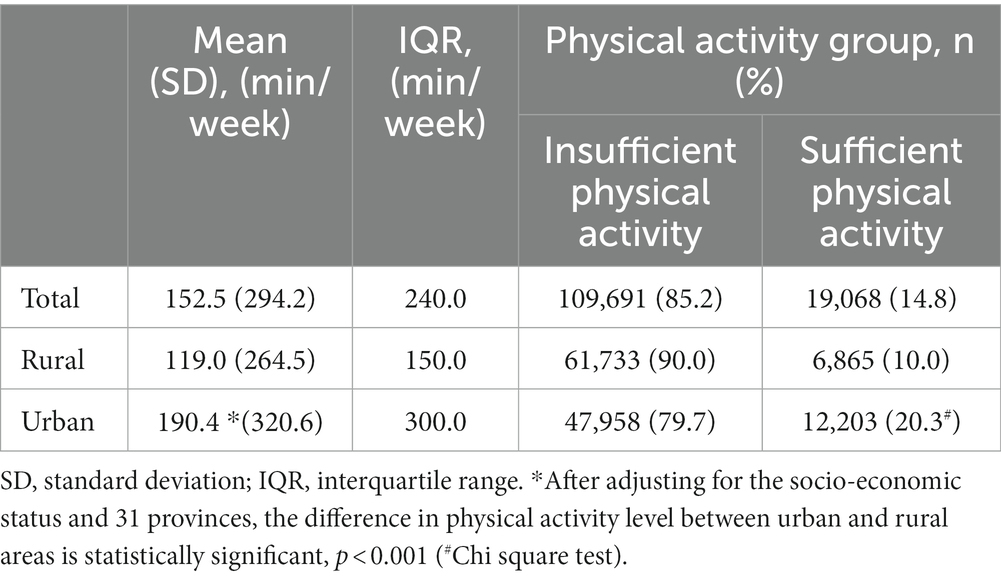
Table 3. Basic information regarding physical activity exposure.
Based on the association between the NDVI and relative HS, low NDVI was found to be a risk factor for low relative HS in both models (Table 4). The high NDVI group had a lower risk of low relative HS than the low NDVI group in the total, rural, and urban sample populations in the adjusted model (OR [95% CI]: 0.92 [0.88–0.95], 0.89 [0.85–0.95], and 0.94 [0.89–0.99], respectively). An IQR increase of the NDVI triggered a decrease in the risk of low relative HS in the total and rural sample populations (OR [95% CI]: 0.95 [0.92–0.98] and 0.96 [0.92–0.99], respectively). However, in the urban sample population, an IQR increase of NDVI had no significant effect on the risk of low relative HS (OR [95% CI]: 0.97 [0.93–1.02]).
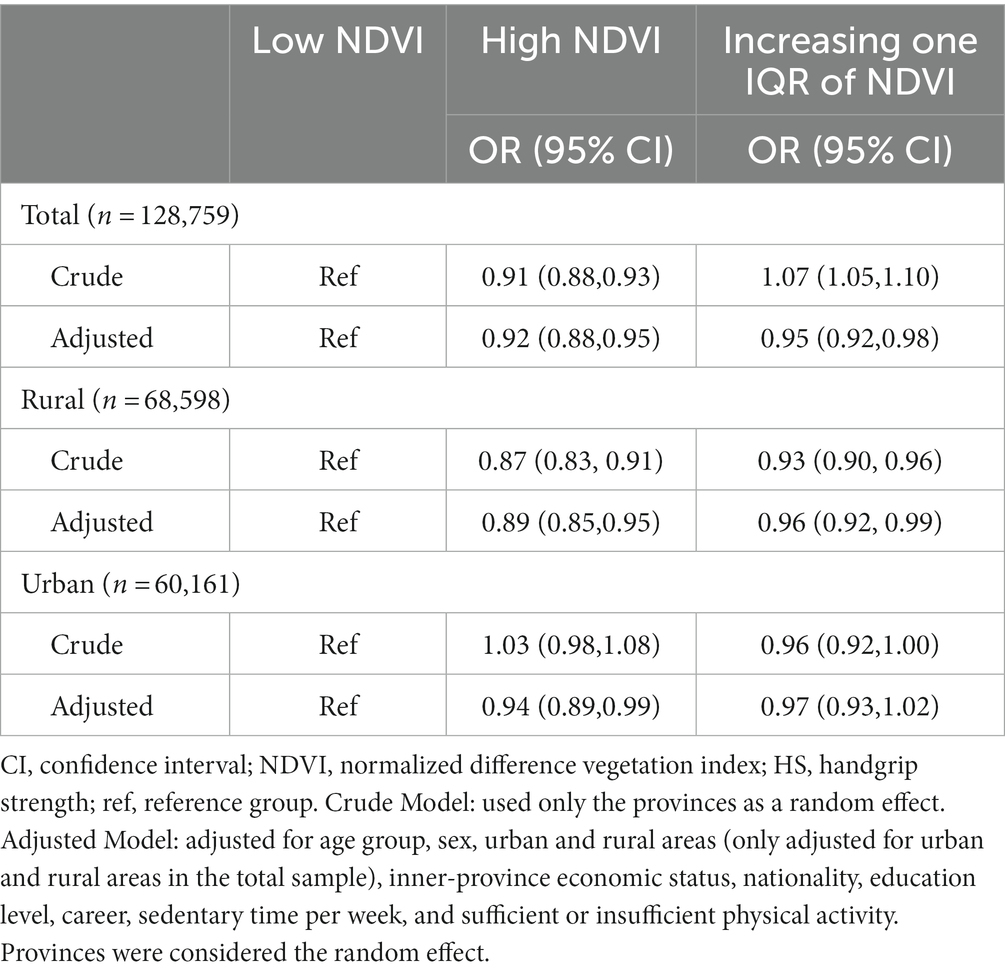
Table 4. Associations between NDVI and relative HS (categorical variable).
Physical activity had a significant relationship with relative HS (Table 5). The sufficient physical activity group had a lower risk of low relative HS than the insufficient physical activity group in the adjusted model (OR [95% CI] of total, rural, and urban sample populations: 0.85 [0.81–0.88], 0.85 [0.80–0.92], and 0.84 [0.79–0.89], respectively). Increasing the MPA level for one IQR of NDVI decreased the risk of low relative HS in the adjusted model (OR [95% CI] of total, rural, and urban sample populations: 0.96 [0.95–0.98], 0.96 [0.94–0.99], and 0.96 [0.94–0.98], respectively). Increasing the VPA level for one IQR of NDVI decreased the risk of low relative HS in the adjusted model (OR [95% CI] of total, rural, and urban sample populations: 0.97 [0.96–0.98], 0.97 [0.96–0.99], and 0.96 [0.95–0.97], respectively).
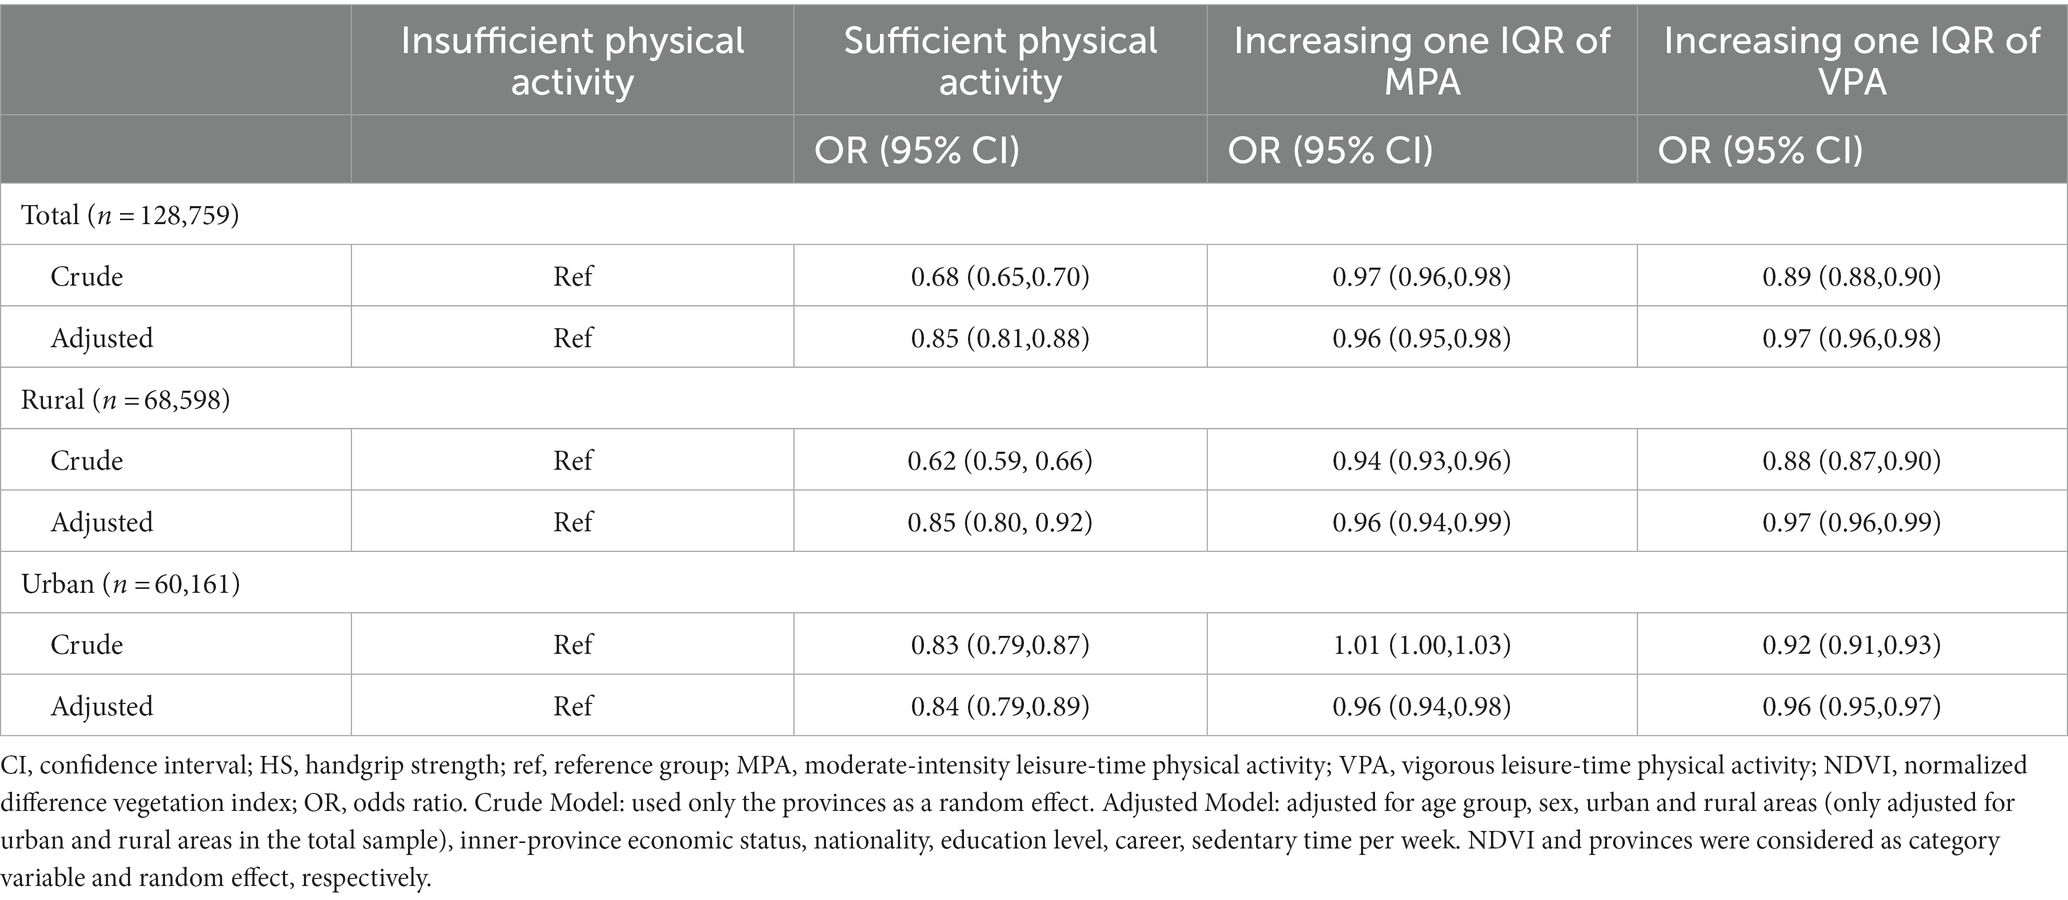
Table 5. Associations between physical activity and relative HS (categorical variable).
Table 6 presents the results of the interaction analysis. In the total sample population, compared with those in the reference group, the ORs [95% CIs] in the low NDVI and sufficient physical activity, high NDVI and insufficient physical activity, and high NDVI and sufficient physical activity groups were 0.85 [0.81–0.91], 0.92 [0.88–0.95], and 0.77 [0.72–0.82], respectively. The joint effect of green space exposure and physical activity was observed on the additive scale (RERI = 0.29, 95% CI 0.22–0.36). However, on a multiplicative scale, the interaction between green space exposure and physical activity was not significant (p = 0.713) in the total sample population.
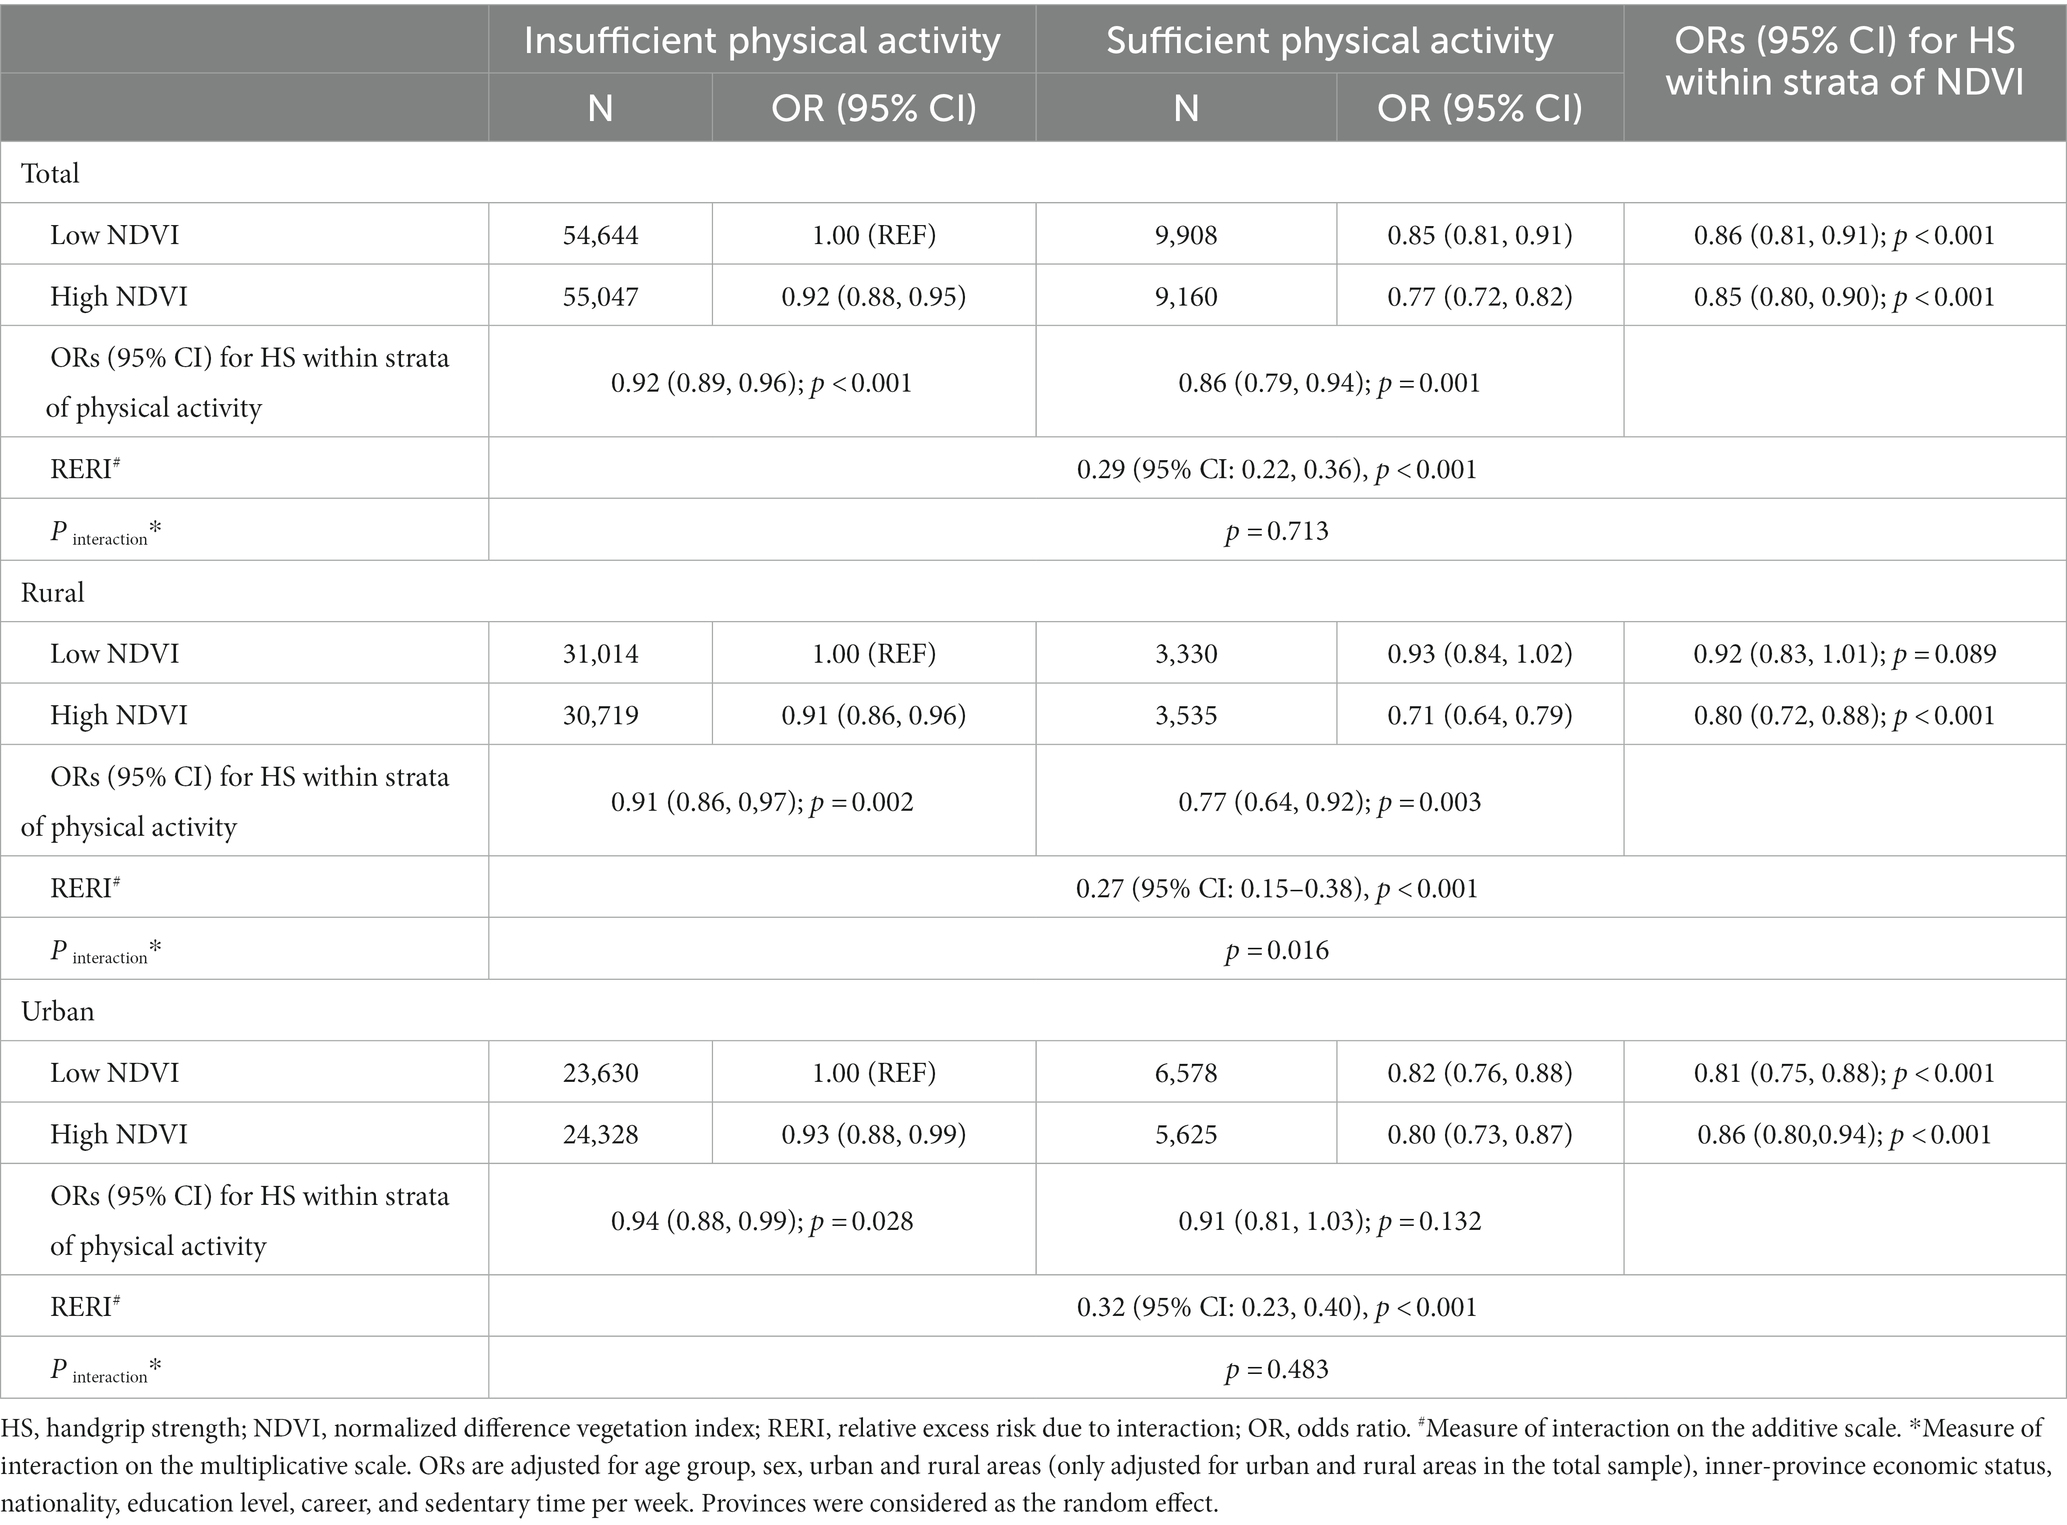
Table 6. Interaction between NDVI and physical activity on relative HS.
In the rural sample population, compared with those in the reference group, the ORs [95% CIs] in the other three groups were 0.93 [0.84–1.02], 0.91 [0.86–0.96], and 0.71 [0.64–0.79]. The joint effect of green space exposure and physical activity was detected on the additive scale (RERI = 0.27, 95% CI 0.15–0.38). On the multiplicative scale, the interaction between green space exposure and physical activity was also significant (p = 0.016) in the rural sample population.
In the urban sample population, compared with those in the reference group, the ORs [95% CIs] in the other three groups were 0.82 [0.76–0.88], 0.93 [0.88–0.99], and 0.80 [0.73–0.87]. The combined effect of green space exposure and physical activity was observed on the additive scale (RERI = 0.32, 95% CI 0.23–0.40). However, on the multiplicative scale, the interaction between green space exposure and physical activity was not significant (p = 0.483) for the urban sample population.
The estimated joint effect of green space exposure (NDVI) and physical activity was more significant than the product of the estimated effects of green space exposure (NDVI) and physical activity.
In the sensitivity analyses, after excluding participants living in big cities or far from home, the results were comparable with the main results (Supplementary Tables S1–S6). In the stratified analysis, we stratified the different age groups and sexes (Supplementary Tables S7, S8), and the results were in agreement with the main results.
This study found that low NDVI and insufficient physical activity were associated with low relative HS in a national cohort of Chinese adults. Furthermore, the NDVI and physical activity interacted with relative HS. Among people with insufficient physical activity, environmental parameters, such as the NDVI, significantly affected the relative HS. This finding was based on the large number of nationally representative individuals (128,759 adults) in 2020 in the People’s Republic of China.
Low muscle strength is a risk factor for chronic non-communicable diseases (32). Our study provides evidence that high green space exposure is of public health significance. A decreasing trend in absolute and relative HS from 2000 to 2014 has been previously reported (5, 6). In recent years, there has been a decreasing trend in leisure-time physical activity in China (6, 33), which is probably associated with decreased muscle strength. To the best of our knowledge, this is the first study to explore the association between green space exposure and muscle strength in Chinese adults. According to our findings, if the NDVI increases from low to high, which is achievable in urban construction, the risk of low relative HS could decrease by 11 and 6% in rural and urban areas, respectively. This indicates that more green space exposure provides more health benefits, such as increased muscle strength.
Our study found that every increase in IQR (0.158 units) of NDVI in the 500-m buffer zone decreased the risk of low relative HS by 5% in the total sample population. However, compared with those in other studies related to green space, our study showed low NDVI values in the 500-m buffer zone in Chinese adults (only 0.34 units on average); in the relevant reports of foreign developed countries, the average NDVI was mostly greater than 0.5 or 0.6 (24, 34, 35). This result indicates a gap in the green space coverage of the living environment of Chinese adults compared with that of adults in developed countries, which implies significant room for improvement. Therefore, green space exposure is an effective means of health promotion and should play a more central role in urban construction, physical activities, and muscle strength improvement.
The possible mechanism whereby green space exposure improves muscle strength remains unclear. It has been demonstrated that it is not necessary for people to use green spaces to obtain health benefits. For example, one study reported positive health benefits among children and adolescents who did not actually use green spaces for their activities (36), whereas Yang et al. (37) found that the higher the exposure to green spaces around schools, the lower the risk of visual impairment in Chinese children. Another study in China reported that green space exposure reduces all-cause mortality, to a certain extent, in patients with multi-drug resistant tuberculosis who live in areas with short nights (38). Another possible mechanism is that outdoor fitness equipment (OFE) increases the number of green space visitors (39, 40), thereby increasing their muscle strength. In addition to improving the physical activity level (41, 42), OFE in green spaces enhances cardiopulmonary endurance, muscle strength, balance, and flexibility. According to data released by the Chinese government, from 1997 to 2019, there was a seven-fold increase (from 100,000 to 823,500) in the number of OFE built in communities and parks (20, 43). Our study demonstrated that people with high green space exposure may have a higher probability of using OFE.
In China, uneven economic development has caused significant urban–rural differences (44). Some studies have shown that green space exposure has a positive association with different health outcomes, such as obesity (45, 46) and diabetes (47). Furthermore, most studies have focused on green spaces in urban areas of China (48, 49). However, the type of green space that can affect health in rural areas has not been thoroughly studied. Our findings suggest that more attention should be paid to health interventions for people living in rural areas in China owing to the dramatic changes in their lifestyle. Moreover, our results highlight a difference in the effect size of NDVI between urban and rural areas. Green space exposure is much more crucial for people living in rural areas. The high NDVI and sufficient physical activity groups experienced reductions in low relative HS by 29 and 20% in rural and urban populations, respectively, compared with the low NDVI and insufficient physical activity groups. In addition, we observed the interaction effect of green space exposure and physical activity on both additive and multiplicative scales in the rural population. A possible explanation of the difference between urban and rural populations is the distinct lifestyles of Chinese people living in urban and rural areas. More studies should be conducted to clarify the mechanism by which green space exposure improves muscle strength in people living in rural areas.
Our data show that physical activity and green space exposure have a positive interaction, which is in concordance with the results previously obtained in children and adolescents. James et al. (50) found that natural resources, such as parks, simultaneously reduce sedentary time and increase physical activity and fitness. Although the mechanism underlying the positive interaction is unclear, our findings have a high practical significance because we demonstrated that the health benefits at the population level could result from people participating in more physical activity and creating more green spaces. Moreover, among people with insufficient physical activity, building more green spaces seems to be a possible solution for improving muscle strength.
Previous studies have reported a relationship between physical fitness and green space exposure (51, 52), although the evidence is controversial (53, 54). Notably, we found that green space exposure plays an essential role in improving muscle strength, regardless of whether people follow physical activity guidelines. Among people with insufficient physical activity, high green space exposure may be more beneficial for improving the relative HS. However, it is unclear whether green space exposure has a relationship with other types of physical fitness, such as cardiac fitness. Therefore, further studies are necessary.
We found that 150 min of MPA and 75 min of VPA had almost the same effect in decreasing the risk factor of low relative HS; the WHO recommends 150–300 min of MPA or 75–150 min of VPA per week for adults (55). From the results of this study, performing 150 min of MPA and 75 min of VPA has the same effect on improving muscle strength, which adds to the evidence supporting the WHO physical activity guidelines.
The findings of this study have several important practical implications. In recent years, the reduction in global physical activity levels has become a major global public health problem. The proportion of people with insufficient physical activity in major countries ranges between 23.9 and 33.9% (56). In this study, 14.8% of Chinese adults reached the recommended levels of leisure physical activity. Although the physical activities related to occupation and transportation were not considered, the physical activity levels of Chinese adults were still low compared with global physical activity levels. Promoting the improvement of physical activity levels is a systematic project that is affected by individual, environmental, national, economic, urban, and cultural policies as well as other aspects (57). Therefore, it is difficult to effectively increase the physical activity levels of citizens, especially adults. However, this study found that, even in people with insufficient physical activity, green space exposure improves muscle strength, and there is a potential interaction between green space exposure and physical activity. This finding suggests that the promotion of physical activities and role of environmental construction should be considered when developing health promotion policies. The constant improvement in green spaces in the community and narrowing the gap between China and developed countries in terms of available green spaces have important practical significance in muscle strength improvement.
This study had several strengths. Firstly, this is the first study to explore the association between green space exposure and relative HS in a nationally representative sample in China. Secondly, using big population representative data and proper statistical analysis, we found a robust and reliable positive association between green space and muscle strength. To the best of our knowledge, this is the first study to demonstrate the interaction effect of physical activity and green space on muscle strength among people living in rural areas.
However, this study had several limitations. Firstly, the cross-sectional nature of the national survey precludes causal inferences. Longitudinal studies should be conducted to demonstrate the relationship between green space exposure and relative HS. Secondly, we had access only to workplace addresses in urban areas because of the sampling design. However, we performed different sensitivity analyses, and the results indicated that the potential bias might be insignificant. Thirdly, we collected physical activity data using a self-reported questionnaire, which might have led to recall bias. However, a large number of adults (128,759) filled the questionnaires to reduce the error as much as possible. Future studies should perform objective measurements of physical activity to improve the robustness of this analysis. Finally, we used NDVI as the green space exposure index, which could be affected by the weather. However, we used an average value over 12 months to minimize the effects of weather.
In conclusion, low NDVI and physical inactivity are risk factors for low relative HS in Chinese adults. An increase in green space exposure (from low to high NDVI) decreases the risk of low relative HS. A combined increase in green space exposure and physical activity may elicit a greater muscle strength improvement than an increase in green space exposure or physical activity alone in people living in rural areas. Therefore, green spaces should be considered in city design or built environments.
The original contributions presented in the study are included in the article/Supplementary material, further inquiries can be directed to the corresponding authors.
The studies involving human participants were reviewed and approved by the General Administration of the Sports of the People’s Republic of China (2019021). The patients/participants provided their written informed consent to participate in this study.
QF contributed to the study analysis plan, data analysis, and manuscript writing. MW conceived and designed the study. H-JW, C-QF, J-JW, HW, and D-MW contributed to the design of the database and electronic case report forms and collated and cleaned the data. GN contributed to the writing up of the manuscript and has provided a critical review of the manuscript. All authors contributed to the article and approved the submitted version.
We thank all participants and 31 provincial sports bureaus for their support.
The authors declare that the research was conducted in the absence of any commercial or financial relationships that could be construed as a potential conflict of interest.
All claims expressed in this article are solely those of the authors and do not necessarily represent those of their affiliated organizations, or those of the publisher, the editors and the reviewers. Any product that may be evaluated in this article, or claim that may be made by its manufacturer, is not guaranteed or endorsed by the publisher.
The Supplementary Material for this article can be found online at: https://www.frontiersin.org/articles/10.3389/fpubh.2023.973158/full#supplementary-material
1. Hwang, YC, Cho, IJ, Jeong, IK, Ahn, KJ, and Chung, HY. Factors associated with regression from prediabetes to normal glucose tolerance in a Korean general population: a community-based 10-year prospective cohort study. Diabet Med. (2018) 35:1544–51. doi: 10.1111/dme.13789
2. Lee, JM, and Ryan, EJ. The relationship between muscular strength and depression in older adults with chronic disease comorbidity. Int J Environ Res Public Health. (2020) 17:6830. doi: 10.3390/ijerph17186830
3. García-Hermoso, A, Cavero-Redondo, I, Ramírez-Vélez, R, Ruiz, JR, Ortega, FB, Lee, DC, et al. Muscular strength as a predictor of all-cause mortality in an apparently healthy population: a systematic review and meta-analysis of data from approximately 2 million men and women. Arch Phys Med Rehabil. (2018) 99:2100–2113.e5. doi: 10.1016/j.apmr.2018.01.008
4. Dodds, R, Kuh, D, Aihie Sayer, A, and Cooper, R. Physical activity levels across adult life and grip strength in early old age: updating findings from a British birth cohort. Age Ageing. (2013) 42:794–8. doi: 10.1093/ageing/aft124
5. Feng, Q, Jiang, C, Wang, M, Cai, R, Wang, H, Wu, D, et al. Association between relative handgrip strength and hypertension in Chinese adults: an analysis of four successive national surveys with 712,442 individuals (2000-2014). PLoS One. (2021) 16:e0258763. doi: 10.1371/journal.pone.0258763
6. Tian, Y, Jiang, C, Wang, M, Cai, R, Zhang, Y, He, Z, et al. BMI, leisure-time physical activity, and physical fitness in adults in China: results from a series of national surveys, 2000-14. Lancet Diabetes Endocrinol. (2016) 4:487–97. doi: 10.1016/S2213-8587(16)00081-4
7. Lee, WJ, Peng, LN, Chiou, ST, and Chen, LK. Relative handgrip strength is a simple indicator of Cardiometabolic risk among middle-aged and older people: a Nationwide population-based study in Taiwan. PLoS One. (2016) 11:e0160876. doi: 10.1371/journal.pone.0160876
8. Byeon, JY, Lee, MK, Yu, MS, Kang, MJ, Lee, DH, Kim, KC, et al. Lower relative handgrip strength is significantly associated with a higher prevalence of the metabolic syndrome in adults. Metab Syndr Relat Disord. (2019) 17:280–8. doi: 10.1089/met.2018.0111
9. Khayatzadeh-Mahani, A, Ruckert, A, Labonté, R, Kenis, P, and Akbari-Javar, MR. Health in all policies (HiAP) governance: lessons from network governance. Health Promot Int. (2019) 34:779–91. doi: 10.1093/heapro/day032
10. Thornton, RL, Glover, CM, Cené, CW, Glik, DC, Henderson, JA, and Williams, DR. Evaluating strategies for reducing health disparities by addressing the social determinants of health. Health Aff. (2016) 35:1416–23. doi: 10.1377/hlthaff.2015.1357
11. Ferreira, ML, Sherrington, C, Smith, K, Carswell, P, Bell, R, Bell, M, et al. Physical activity improves strength, balance and endurance in adults aged 40-65 years: a systematic review. J Physiother. (2012) 58:145–56. doi: 10.1016/S1836-9553(12)70105-4
12. Genin, PM, Dessenne, P, Finaud, J, Pereira, B, Thivel, D, and Duclos, M. Health and fitness benefits but low adherence rate: effect of a 10-month onsite physical activity program among tertiary employees. J Occup Environ Med. (2018) 60:e455–62. doi: 10.1097/JOM.0000000000001394
13. Seong, JY, Ahn, HY, Park, Y, Shin, S, and Ha, IH. Association between aerobic exercise and handgrip strength in adults: a cross-sectional study based on data from the Korean National Health and Nutrition Examination Survey (2014-2017). J Nutr Health Aging. (2020) 24:619–26. doi: 10.1007/s12603-020-1372-x
14. de Vries, S, van Dillen, SME, Groenewegen, PP, and Spreeuwenberg, P. Streetscape greenery and health: stress, social cohesion and physical activity as mediators. Soc Sci Med. (2013) 94:26–33. doi: 10.1016/j.socscimed.2013.06.030
15. Wang, R, Helbich, M, Yao, Y, Zhang, J, Liu, P, Yuan, Y, et al. Urban greenery and mental wellbeing in adults: cross-sectional mediation analyses on multiple pathways across different greenery measures. Environ Res. (2019) 176:108535. doi: 10.1016/j.envres.2019.108535
16. McCormack, GR, Frehlich, L, Blackstaffe, A, Turin, TC, and Doyle-Baker, PK. Active and fit communities. Associations between neighborhood walkability and health-related fitness in adults. Int J Environ Res Public Health. (2020) 17:1131. doi: 10.3390/ijerph17041131
17. Bezold, CP, Stark, JH, Rundle, A, Konty, K, Day, SE, Quinn, J, et al. Relationship between recreational resources in the school neighborhood and changes in fitness in new York City public school students. J Urban Health. (2017) 94:20–9. doi: 10.1007/s11524-016-0114-1
18. Giles-Corti, B, Timperio, A, Bull, F, and Pikora, T. Understanding physical activity environmental correlates: increased specificity for ecological models. Exerc Sport Sci Rev. (2005) 33:175–81. doi: 10.1097/00003677-200510000-00005
19. Sallis, JF, Floyd, MF, Rodríguez, DA, and Saelens, BE. Role of built environments in physical activity, obesity, and cardiovascular disease. Circulation. (2012) 125:729–37. doi: 10.1161/CIRCULATIONAHA.110.969022
20. China, G. A. O. S. O. (2019). Statistical survey data of national sports venues in 2019 (in Chinese). Available at: https://www.sport.gov.cn/n315/n329/c968164/content.html
21. Browning, M, and Lee, K. Within what distance does “greenness” best predict physical health? A systematic review of articles with GIS buffer analyses across the lifespan. Int J Environ Res Public Health. (2017) 14:675. doi: 10.3390/ijerph14070675
22. Su, JG, Dadvand, P, Nieuwenhuijsen, MJ, Bartoll, X, and Jerrett, M. Associations of green space metrics with health and behavior outcomes at different buffer sizes and remote sensing sensor resolutions. Environ Int. (2019) 126:162–70. doi: 10.1016/j.envint.2019.02.008
23. Didan, K. MYD13Q1 MODIS/Aqua Vegetation Indices 16-Day L3 Global 250m SIN Grid V061. NASA EOSDIS Land Processes DAAC. (2021). Available at: https://doi.org/10.5067/MODIS/MYD13Q1.061
24. Barboza, EP, Cirach, M, Khomenko, S, Iungman, T, Mueller, N, Barrera-Gómez, J, et al. Green space and mortality in European cities: a health impact assessment study. Lancet Planet Health. (2021) 5:e718–30. doi: 10.1016/S2542-5196(21)00229-1
25. Villeneuve, PJ, Jerrett, M, Su, JG, Burnett, RT, Chen, H, Wheeler, AJ, et al. A cohort study relating urban green space with mortality in Ontario, Canada. Environ Res. (2012) 115:51–8. doi: 10.1016/j.envres.2012.03.003
26. Cusack, L, Larkin, A, Carozza, S, and Hystad, P. Associations between residential greenness and birth outcomes across Texas. Environ Res. (2017) 152:88–95. doi: 10.1016/j.envres.2016.10.003
27. Lin, L, Li, Q, Yang, J, Han, N, Chen, G, Jin, C, et al. The associations of residential greenness with fetal growth in utero and birth weight: a birth cohort study in Beijing, China. Environ Int. (2020) 141:105793. doi: 10.1016/j.envint.2020.105793
28. Santacroce, M. (2020). SCREEN: Stata module to quickly identify possible outliers based on the interquartile range, percentile or standard deviation. Boston: Statistical Software Components, Boston College Department of Economics.
30. Hosmer, DW, and Lemeshow, S. Confidence interval estimation of interaction. Epidemiology. (1992) 3:452–6. doi: 10.1097/00001648-199209000-00012
31. Knol, MJ, van der Tweel, I, Grobbee, DE, Numans, ME, and Geerlings, MI. Estimating interaction on an additive scale between continuous determinants in a logistic regression model. Int J Epidemiol. (2007) 36:1111–8. doi: 10.1093/ije/dym157
32. Ko, KJ, Kang, SJ, and Lee, KS. Association between cardiorespiratory, muscular fitness and metabolic syndrome in Korean men. Diabetes Metab Syndr. (2019) 13:536–41. doi: 10.1016/j.dsx.2018.11.025
33. Ng, SW, Howard, AG, Wang, HJ, Su, C, and Zhang, B. The physical activity transition among adults in China: 1991-2011. Obes Rev. (2014) 15:27–36. doi: 10.1111/obr.12127
34. Andrusaityte, S, Grazuleviciene, R, Dedele, A, and Balseviciene, B. The effect of residential greenness and city park visiting habits on preschool Children’s mental and general health in Lithuania: a cross-sectional study. Int J Hyg Environ Health. (2020) 223:142–50. doi: 10.1016/j.ijheh.2019.09.009
35. Nardone, A, Rudolph, KE, Morello-Frosch, R, and Casey, JA. Redlines and greenspace: the relationship between historical redlining and 2010 greenspace across the United States. Environ Health Perspect. (2021) 129:017006. doi: 10.1289/EHP7495
36. Van Renterghem, T. Towards explaining the positive effect of vegetation on the perception of environmental noise. Urban For Urban Green. (2019) 40:133–44. doi: 10.1016/j.ufug.2018.03.007
37. Yang, BY, Li, S, Zou, Z, Markevych, I, Heinrich, J, Bloom, MS, et al. Greenness surrounding schools and visual impairment in Chinese children and adolescents. Environ Health Perspect. (2021) 129:107006. doi: 10.1289/EHP8429
38. Ge, E, Gao, J, Ren, Z, Liu, X, Luo, M, Zhong, J, et al. Greenness exposure and all-cause mortality during multi-drug resistant tuberculosis treatment: a population-based cohort study. Sci Total Environ. (2021) 771:145422. doi: 10.1016/j.scitotenv.2021.145422
39. Chow, HW, Mowen, AJ, and Wu, GL. Who is using outdoor fitness equipment and how? The case of Xihu Park. Int J Environ Res Public Health. (2017) 14:448. doi: 10.3390/ijerph14040448
40. Cohen, DA, Marsh, T, Williamson, S, Golinelli, D, and McKenzie, TL. Impact and cost-effectiveness of family fitness zones: a natural experiment in urban public parks. Health Place. (2012) 18:39–45. doi: 10.1016/j.healthplace.2011.09.008
41. Chow, HW. Outdoor fitness equipment in parks: a qualitative study from older adults’ perceptions. BMC Public Health. (2013) 13:1216. doi: 10.1186/1471-2458-13-1216
42. Chow, HW, and Ho, CH. Does the use of outdoor fitness equipment by older adults qualify as moderate to vigorous physical activity? PLoS One. (2018) 13:e0196507. doi: 10.1371/journal.pone.0196507
43. Xiangru Li, Q. F. Characteristics and future development of outdoor fitness equipment engineering in China (in Chinese). China Sport Sci Technol. (2005) 04:96-98+105. doi: 10.16470/j.csst.2005.04.025
44. Zhang, B, Zhou, L, and College, M. Research on the development of county economy under the background of urban-rural integration (in Chinese). Spec Zone Econ. (2018) 3:79–81.
45. Dong, Y, Jan, C, Ma, Y, Dong, B, Zou, Z, Yang, Y, et al. Economic development and the nutritional status of Chinese school-aged children and adolescents from 1995 to 2014: an analysis of five successive national surveys. Lancet Diabetes Endocrinol. (2019) 7:288–99. doi: 10.1016/S2213-8587(19)30075-0
46. Liu, M, Tang, W, Zhang, Y, Wang, Y, Baima, K, Li, Y, et al. Urban-rural differences in the association between long-term exposure to ambient air pollution and obesity in China. Environ Res. (2021) 201:111597. doi: 10.1016/j.envres.2021.111597
47. Wang, H, and Lai, Y. Urban-rural differences in diabetes in China. JAMA. (2017) 317:1688–9. doi: 10.1001/jama.2017.3347
48. Hunter, RF, Cleland, C, Cleary, A, Droomers, M, Wheeler, BW, Sinnett, D, et al. Environmental, health, wellbeing, social and equity effects of urban green space interventions: a meta-narrative evidence synthesis. Environ Int. (2019) 130:104923. doi: 10.1016/j.envint.2019.104923
49. Yu, S, Zhu, X, and He, Q. An assessment of Urban Park access using house-level data in urban China: through the lens of social equity. Int J Environ Res Public Health. (2020) 17:2349. doi: 10.3390/ijerph17072349
50. James, M, Fry, R, Mannello, M, Anderson, W, and Brophy, S. How does the built environment affect teenagers (aged 13-14) physical activity and fitness? A cross-sectional analysis of the ACTIVE project. PLoS One. (2020) 15:e0237784. doi: 10.1371/journal.pone.0237784
51. Akpınar, A. Green exercise: how are characteristics of urban green spaces associated with Adolescents’ physical activity and health? Int J Environ Res Public Health. (2019) 16:4281. doi: 10.3390/ijerph16214281
52. Wang, H, Dai, X, Wu, J, Wu, X, and Nie, X. Influence of urban green open space on residents’ physical activity in China. BMC Public Health. (2019) 19:1093. doi: 10.1186/s12889-019-7416-7
53. Mäki-Opas, TE, Borodulin, K, Valkeinen, H, Stenholm, S, Kunst, AE, Abel, T, et al. The contribution of travel-related urban zones, cycling and pedestrian networks and green space to commuting physical activity among adults - a cross-sectional population-based study using geographical information systems. BMC Public Health. (2016) 16:760. doi: 10.1186/s12889-016-3264-x
54. Owen, CG, Limb, ES, Nightingale, CM, Rudnicka, AR, Ram, B, Shankar, A, et al. Active design of built environments for increasing levels of physical activity in adults: the ENABLE London natural experiment study. Public Health Res. (2020):8. doi: 10.3310/phr08120
55. Bull, FC, Al-Ansari, SS, Biddle, S, Borodulin, K, Buman, MP, Cardon, G, et al. World Health Organization 2020 guidelines on physical activity and sedentary behaviour. Br J Sports Med. (2020) 54:1451–62. doi: 10.1136/bjsports-2020-102955
56. Guthold, R, Stevens, GA, Riley, LM, and Bull, FC. Worldwide trends in insufficient physical activity from 2001 to 2016: a pooled analysis of 358 population-based surveys with 1.9 million participants. Lancet Glob Health. (2018) 6:e1077–86. doi: 10.1016/S2214-109X(18)30357-7
Keywords: relative handgrip strength, green space, NDVI, physical activity, additive scale interaction
Citation: Feng Q, Fan C-Q, Wang J-J, Wang H, Wu D-M, Nassis GP, Wang M and Wang H-J (2023) The effects of green space and physical activity on muscle strength: a national cross-sectional survey with 128,759 Chinese adults. Front. Public Health. 11:973158. doi: 10.3389/fpubh.2023.973158
Edited by:
Mario Sprovieri, National Research Council (CNR), ItalyReviewed by:
Xiaoxu Xie, Fujian Medical University, ChinaCopyright © 2023 Feng, Fan, Wang, Wang, Wu, Nassis, Wang and Wang. This is an open-access article distributed under the terms of the Creative Commons Attribution License (CC BY). The use, distribution or reproduction in other forums is permitted, provided the original author(s) and the copyright owner(s) are credited and that the original publication in this journal is cited, in accordance with accepted academic practice. No use, distribution or reproduction is permitted which does not comply with these terms.
*Correspondence: Hai-Jun Wang, d2hqdW5AcGt1LmVkdS5jbg==; Mei Wang, d2FuZ21laUBjaXNzLmNu
Disclaimer: All claims expressed in this article are solely those of the authors and do not necessarily represent those of their affiliated organizations, or those of the publisher, the editors and the reviewers. Any product that may be evaluated in this article or claim that may be made by its manufacturer is not guaranteed or endorsed by the publisher.
Research integrity at Frontiers
Learn more about the work of our research integrity team to safeguard the quality of each article we publish.