 Hua Wang1
 Mingcheng Zhang
 Jiqiang Niu
- 1School of Computer and Communication Engineering, Zhengzhou University of Light Industry, Zhengzhou, China
- 2Key Laboratory for Synergistic Prevention of Water and Soil Environmental Pollution, Xinyang Normal University, Xinyang, China
- 3Key Laboratory of Urban Land Resources Monitoring and Simulation, Ministry of Natural Resources, Shenzhen, China
Since the start of the twenty-first century, China's economy has grown at a high or moderate rate, and air pollution has become increasingly severe. The study was conducted using data from remote sensing observations between 1998 and 2019, employing the standard deviation ellipse model and spatial autocorrelation analysis, to explore the spatiotemporal distribution characteristics of PM2.5 in Henan Province. Additionally, a multiscale geographically weighted regression model (MGWR) was applied to explore the impact of 12 driving factors (e.g., mean surface temperature and CO2 emissions) on PM2.5 concentration. The research revealed that (1) Over a period of 22 years, the yearly mean PM2.5 concentrations in Henan Province demonstrated a trend resembling the shape of the letter “M”, and the general trend observed in Henan Province demonstrated that the spatial center of gravity of PM2.5 concentrations shifted toward the north. (2) Distinct spatial clustering patterns of PM2.5 were observed in Henan Province, with the northern region showing a primary concentration of spatial hot spots, while the western and southern areas were predominantly characterized as cold spots. (3) MGWR is more effective than GWR in unveiling the spatial heterogeneity of influencing factors at various scales, thereby making it a more appropriate approach for investigating the driving mechanisms behind PM2.5 concentration. (4) The results acquired from the MGWR model indicate that there are varying degrees of spatial heterogeneity in the effects of various factors on PM2.5 concentration. To summarize the above conclusions, the management of the atmospheric environment in Henan Province still has a long way to go, and the formulation of relevant policies should be adapted to local conditions, taking into account the spatial scale effect of the impact of different influencing factors on PM2.5.
1 Introduction
China's economy has expanded significantly since the reform and opening up, but the quality of the environment has deteriorated (1), and atmospheric environmental pollution has become the focus of society and one of the most urgent problems to be solved by governments at all levels (2). PM2.5 is a major atmospheric pollutant (3) and is also known as fine particulate matter and fine particles; PM2.5 refers to atmospheric airborne particles with a diameter of 2.5 microns or smaller. Studies have shown that it seriously harms the atmospheric environment and human health (4–6).
Presently, more academics domestically and internationally have conducted investigations of PM2.5 geographical and temporal distribution patterns and related factors at various spatial scales, and a multiscale research system has been formed for national (7–9), river basin (10–12), city cluster (13–15), provincial (16–21), and prefecture-level city scales (22–24). Studies based on the provincial scale have focused mostly on Beijing-Tianjin-Hebei and the relatively economically developed regions in the south. However, there are relatively few studies on the spatiotemporal distribution characteristics and driving mechanisms of PM2.5 in various provinces in Central China (25–27). On April 15, 2006, the “Several Opinions of the CPC Central Committee and The State Council on Promoting the Rise of the Central Region” was officially promulgated. Central China is an important bearing area for China's “Rise of Central China” strategy and an important area for the implementation of coordinated regional development and new industrialization strategy. The sustained economic development of China as a whole is strategically dependent on the region's economic success. Central China's Henan Province is a significant economic, populated, and recently industrialized region, and the 2019 China Ecological Environment Status Bulletin published by the Ministry of Ecology and Environment showed that from January to December 2019, six of the twenty cities with relatively poor air quality among 168 key cities in China, including Anyang and Jiaozuo, were located in Henan Province, and the majority of Henan Province was located in the high-concentration area of PM2.5 pollution, which is the Yellow Huaihai Plain (28). Studying the spatiotemporal pattern and driving mechanism of PM2.5 in Henan Province is of great significance for understanding the spatiotemporal distribution properties of PM2.5 in Henan Province, promoting sustainable development, and safeguarding the health of the population.
The goal of pertinent study should be to investigate the spatiotemporal distribution properties of PM2.5 and the underlying causes of its existence, according to present research findings. From the studies of the spatiotemporal distribution characteristics of PM2.5, scholars have mainly explored PM2.5 spatiotemporal variation patterns and spatial aggregation characteristics through spatial center of gravity shift evaluation, cold and hot spot analysis, and spatial autocorrelation analysis (29–33). Among them, the spatial center of gravity shift can be realized by the standard deviation ellipsoid (SDE) model (34, 35), which can not only calculate the center of gravity of the PM2.5 concentration spatial distribution but also effectively reflect the spatial aggregation trend of PM2.5. Regarding the investigation of PM2.5 driving mechanisms, the driving mechanism research methods that have been applied can be divided into traditional research methods such as Pearson correlation coefficient analysis (36), rank correlation analysis (37), gray correlation analysis (38), and OLS regression models, as well as methods that introduce a spatial perspective such as the geographical detector method (39, 40), spatial lag model (41), spatial error model (42), spatial Durbin model (43), and geographically weighted regression model (GWR) (44). It has been shown that PM2.5 concentration, as a kind of data with spatial properties, has a certain degree of spatial heterogeneity for each influencing factor (45). It has been found that the interaction between indicators with spatial attributes, such as PM2.5 concentration, and their associated influencing factors tends to have multiscale effects (46, 47). To a certain degree, GWR, functioning as a local regression model, is capable of depicting the spatial heterogeneity of driving factors affecting PM2.5. The MGWR method proposed by Fotheringham in 2017 provides a new way (48) to describe the spatial heterogeneity of the influence of independent variable. In addition, MGWR introduces the idea of a multiscale perspective, which is a very important issue in geography (49). Therefore, comparing the GWR with the MGWR and selecting the better-fitting model to analyze the driving mechanism is a more reliable research method to obtain an accurate PM2.5 concentration driving model.
In summary, this paper intends to take Henan Province as the study area, based on the PM2.5 remote sensing data from 1998 to 2019, which have been corrected and fused, as well as high spatial resolution factor raster data. The study analyzed the spatiotemporal distribution characteristics of PM2.5 using the standard deviation ellipse model and explored the spatial aggregation characteristics of PM2.5 concentration in Henan Province through methods such as spatial autocorrelation analysis and hot and cold spot analysis. Furthermore, this paper employs the MGWR model in combination to disclose how driving factors impact the distribution pattern and spatial heterogeneity of PM2.5, providing a reference for analyzing the pollution situation of PM2.5 and creating regulations for the atmospheric environment's sustainable development.
2 Data and methods
2.1 Study area overview
Henan Province is located in the central hinterland of China (Figure 1), with complex terrain and rich resources. Henan Province is of great importance as a key grain production region, an energy and raw material base, and a comprehensive transportation hub in China. With abundant human resources and scientific and educational resources, the province is an important agricultural province and a populous province in China. In addition, with the proposal of the “rise of Central China” strategy, the industrialization development of Henan Province also ushered in the spring, and it has now become a large emerging industrial province, making progress in economic development. Henan Province also has serious air quality problems, according to the “Annual Work Program for Air Pollution Prevention and Control in Henan Province (2019-2020)” released in 2019; it was stated that the yearly mean PM2.5 concentration in Henan Province was 53 μg/m3, up 3.9% year-on-year, the ratio of good days was 55.8%, down 2.5% year-on-year, and the management of atmospheric environment needs to be improved.
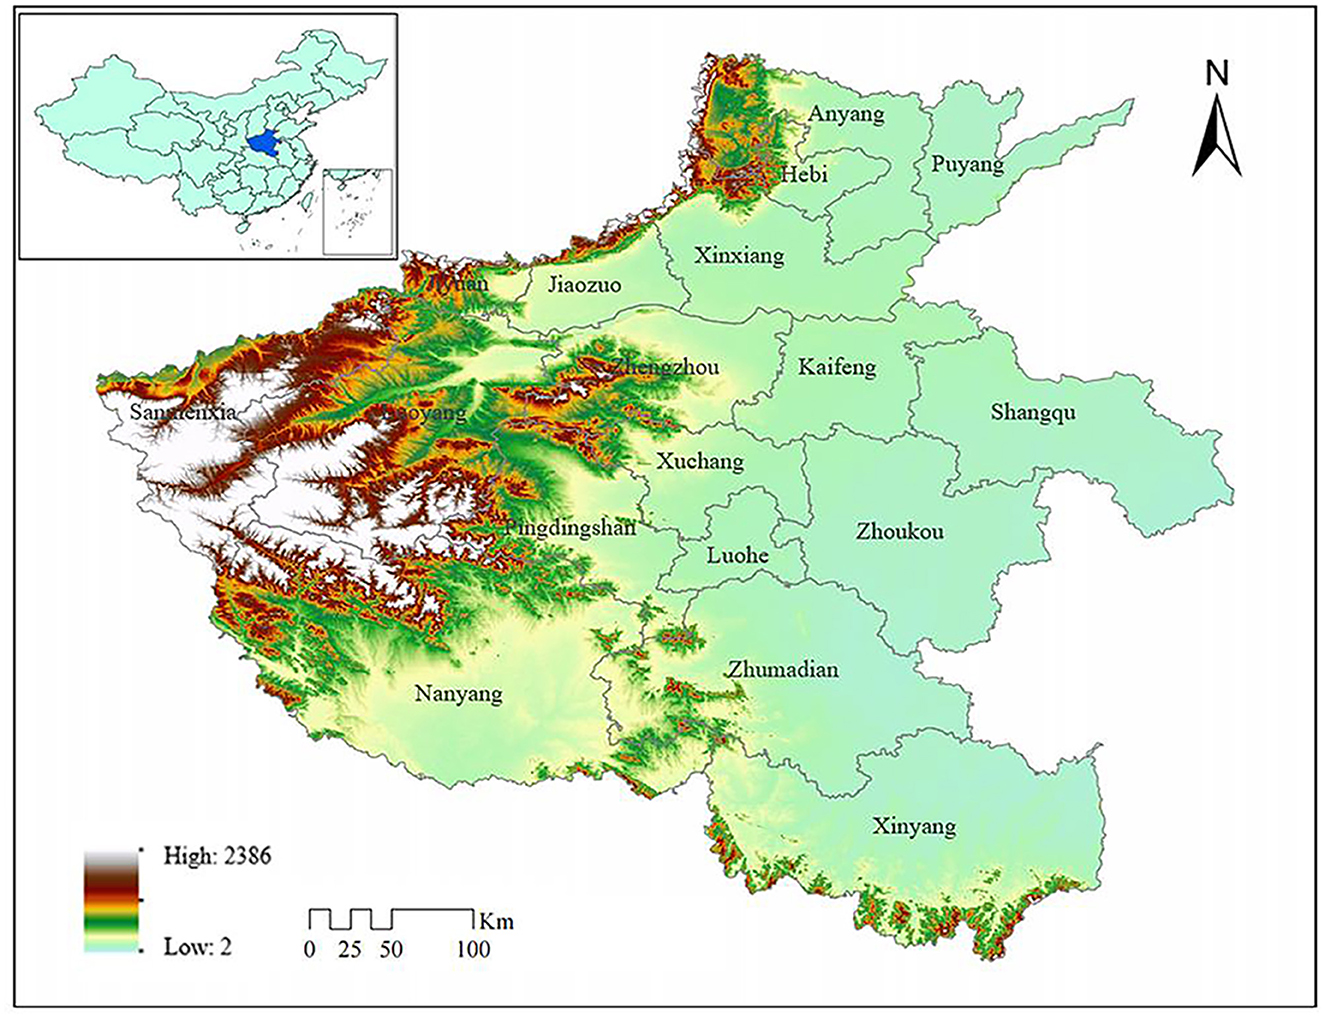
Figure 1. The geographical position and administrative divisions of Henan Province.
2.2 Study data
2.2.1 PM2.5 data
The PM2.5 remote sensing data utilized in this study were derived from the Atmospheric Composition Analysis Group at Washington University (St. Louis) (https://sites.wustl.edu/acag/datasets/surface-pm2-5). The data span from 1998 to 2019 with a spatial resolution of ~1 × 1 km, and the product number for the Chinese region is V4.CH.03. With its great spatial resolution, the data product can depict the spatial distribution pattern of PM2.5; additionally, the product has been widely used in global and regional PM2.5-related studies (50–52).
2.2.2 Other data
To unpack the driving mechanism of PM2.5 spatial concentration, this study introduced two types of influence factor data: natural type data and socioeconomic type data. The natural-type data included surface temperature, relative humidity, wind speed, precipitation, vegetation index, and elevation. The socioeconomic data included GDP, nighttime lights, CO2 emissions, electricity consumption, population density, and arable land area share. Electricity consumption data were obtained from Chen et al. (53) and published in Scientific Data. Yang et al. (54) supplied a land cover dataset covering the period from 1990 to 2019 in China, with a spatial resolution of 30 m. Using this dataset, the data concerning the proportion of arable land area was computed. The specific data description and data sources are shown in Table 1.
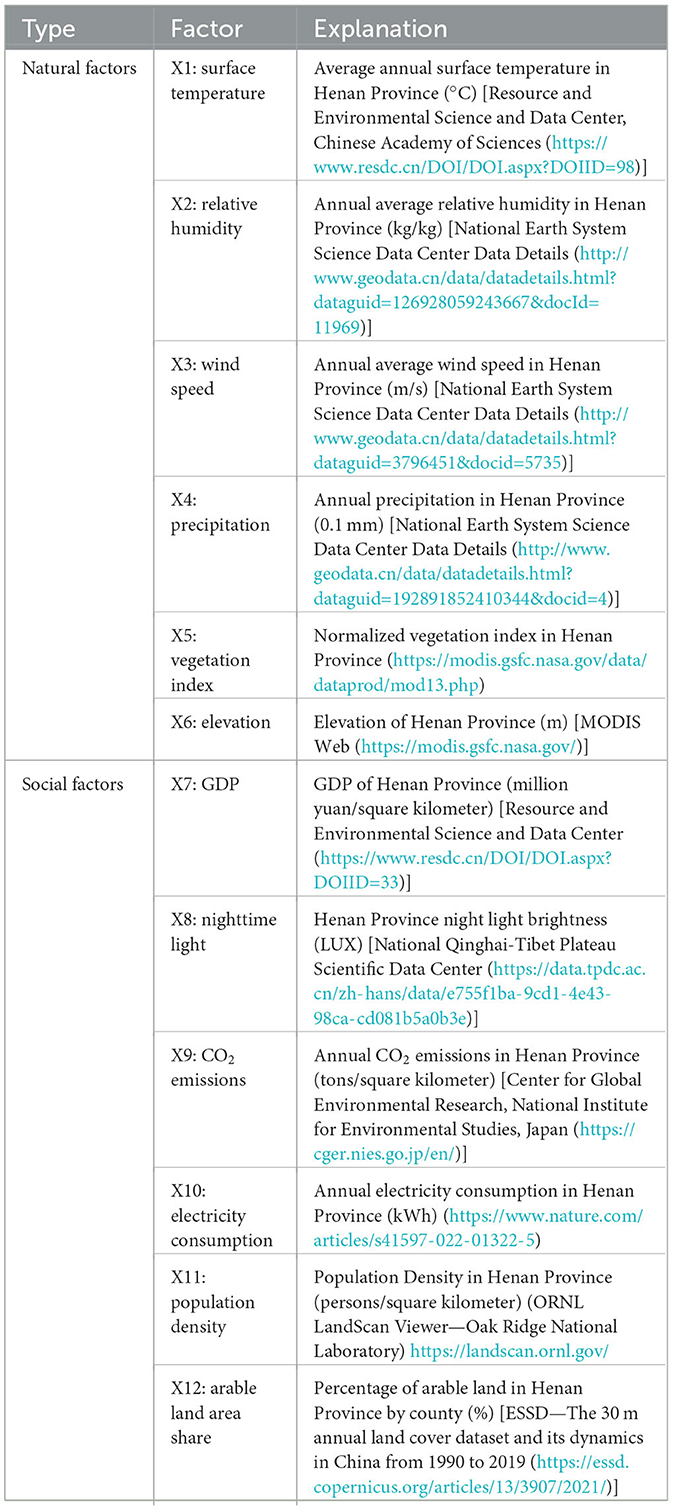
Table 1. Factors and descriptions of PM2.5 concentration impact.
After random sampling and eliminating invalid sampling data in Henan Province, 2,956 sample units of natural and socioeconomic data were obtained. Considering the possibility of multicollinearity in the variables selected in this study, the variance inflation factor (VIF) was used to test all the abovementioned explanatory variables to avoid bias in the estimation results caused by the interaction between indicators. It is generally assumed that if the VIF is >10, the variable is highly collinear. The inverse of the VIF is the tolerance, and the closer it is to 0, the stronger the multicollinearity is. The VIF is computed using the following formula.
The value of Ri represents the complex correlation coefficient between the ith independent variable (Xi) and the other independent variables employed in the regression analysis. Table 2 presents the results of the test. The VIF values of each indicator are <10, declaring that the selected indicators do not have multicollinearity problems.

Table 2. Multicollinearity inspection of influencing factors.
2.3 Research methodology
2.3.1 Standard deviation ellipse analysis
SDE is an algorithm that visually evaluates the orientation and distribution characteristics of a series of discrete points. In this paper, the standard deviation ellipse is used to reflect the spatiotemporal evolution pattern of PM2.5 in the past 22 years, mainly using the parameters of center of gravity, area, long and short axes, and azimuth Angle of the standard deviation ellipse. The ellipse center is calculated by the following formulas:
where wi is the weight of object i and (xi, yi) is the spatial coordinate location of study object i.
The azimuth angle, which is the angle of clockwise rotation from due north to the long axis direction, reflects the primary trend direction of the PM2.5 data distribution. The change in azimuth can be a reflection of the primary trend direction of the data distribution for PM2.5 concentrations. The azimuth angle is calculated by the following formulas:
where represents the deviation of the spatial coordinates of the PM2.5 concentration in the study area to the center point .
The ellipse's long half-axis denotes the distribution's direction, while its short half-axis denotes its range for PM2.5 data. The data's centripetal force is more visible when the short half-axis is shorter; when it is longer, the PM2.5 data are more distributed. As the distance between the long and short half-axes increases, the directionality of the PM2.5 data becomes increasingly obvious.
The formulas for calculating the long and short semiaxes are as follows:
where the axes' relative standard deviations along x and y are represented by σx and σy, respectively.
2.3.2 Spatial autocorrelation analysis
Spatial autocorrelation analysis is a potential interdependence in geography that can be used to describe the interdependence between two points that are geographically close to each other and the interdependence between temporal variables at different locations. Atmospheric activities have a strong spatial continuity, and thus, the PM2.5 concentration values are closer when they are spatial close to each other. Statistics for spatial autocorrelation are frequently used to examine the spatial clustering and cyclical patterns of geographic elements and can be used to depict the interdependence between geographic observation data.
where I denotes the global Moran index, n is the number of observation cells, Xi and Xj are the PM2.5 concentrations of cells i and j, Wij denotes the spatial weight between points i and j, a Wij equal to 1 means they are adjacent, a Wij equal to 0 means they are not adjacent, and is the sample mean. The Moran index is between [−1, 1], When I > 0, it signifies positive spatial autocorrelation, which means that the observed attributes are spatially clustered. On the other hand, when I < 0, it indicates negative spatial autocorrelation, i.e., the observed attributes are discrete in space.
2.3.3 Hot spot analysis with rendering (Getis-Ord )
The global Moran index reflects only the overall autocorrelation of PM2.5. In this study, the hot spot analysis method was used to analyze the local autocorrelation of PM2.5. The hot spot analysis method identifies spatial clusters of statistically significant low and high values, i.e., cold and hot spots, by all values in the local area. The Getis-Ord local analysis is calculated by the following formulas:
where n is the number of spatial data cells; Xj is the attribute value of data cell j; which indicates the spatial adjacency of cell i and cell j; S is the average standard deviation of PM2.5 for the whole research region; A high value of indicates dense clustering of hot spots, and vice versa indicates dense clustering of cold spots.
2.3.4 Multiscale geographically weighted regression
MGWR is an extension and improvement of GWR (48). Before introducing MGWR, the classical OLS and traditional GWR models were first introduced in the context of PM2.5 research.
The classical OLS model is a global model widely used for relationship analysis with the following equation:
where i denotes a cell, Yi denotes the yearly mean PM2.5 mass concentration of cell i, Xij is the jth explanatory variable of cell i, β is an unknown parameter to be estimated for the association between PM2.5 concentration data and covariates, and εi is a random error component.
The GWR model can resolve the spatial autocorrelation and spatial non-smoothness problems that cannot be solved by the OLS model. Its basic formula is as follows:
where β0(ui, vi) for the cell i constant term, βj(ui, vi) for the regression coefficient of the independent variable at the data sampling point.
Based on the GWR model, MGWR loosens the assumption of “same spatial scale” and can obtain the optimal bandwidth of different variables, thus reducing the bias of estimates. The formula is as follows:
The main difference between Equations (13) and (12) is that bwj represents the bandwidth used for the regression coefficients of the jth variable, and βbwj(ui, vi) is the regression coefficient of the jth variable at cell i. The MGWR model was calibrated by the reverse fitting algorithm proposed by Fotheringham et al. (48, 55).
The construction of the MGWR model in this paper was based on the development of MGWR2.2 software by the Spatial Analysis Research Center (SPARC) at Arizona State University (https://sgsup.asu.edu/SPARC).
The spatiotemporal distribution of PM2.5 is influenced by both natural geographical factors and social and economic constraints. Therefore, this paper comprehensively considers the scientificity and accessibility of indicators and selects 12 factors from both social and natural aspects for analysis.
3 Results and analysis
3.1 Temporal variation pattern of PM2.5 concentration
Based on the remote sensing retrieval data of PM2.5, the average annual PM2.5 concentration at provincial and municipal levels during 1998–2019 was calculated., and according to the line graph drawn (Figure 2), it was observed that from 1998 to 2019, the yearly mean PM2.5 concentrations in Henan Province and municipalities in the province showed an “M”-shaped trend, with peaks in 2007 and 2013 at 73.35 and 73.85 μg/m3, respectively, which were both higher than the Ambient Air Quality Standard (GB3095-2012) of the corresponding secondary standard limit value of 35 μg/m3. From 1998 to 2007, the PM2.5 concentrations showed an overall upward trend. After a brief downturn in the early 1990s, the industry in Henan Province experienced a phase of rapid growth from 1998 onwards, which induced a yearly increase in PM2.5 concentrations. After a brief decline between 2007 and 2013, the PM2.5 quality concentrations were brought under control in approximately 2008, mainly as a result of strict emission reduction measures for the Beijing Olympics. The overall decrease in PM2.5 concentration from 2013 to 2019 reflects the successful implementation of The State Council's 2013 Action Plan for the Prevention and Control of Air Pollution. It is worth stating that the overall annual average PM2.5 concentration in Henan Province has been decreasing each year since 2015, which shows that the “Notice on Strengthening Straw Burning Ban and Comprehensive Utilization” promulgated by the General Office of Henan Provincial People's Government in 2015 has achieved certain results in straw burning ban and comprehensive utilization.
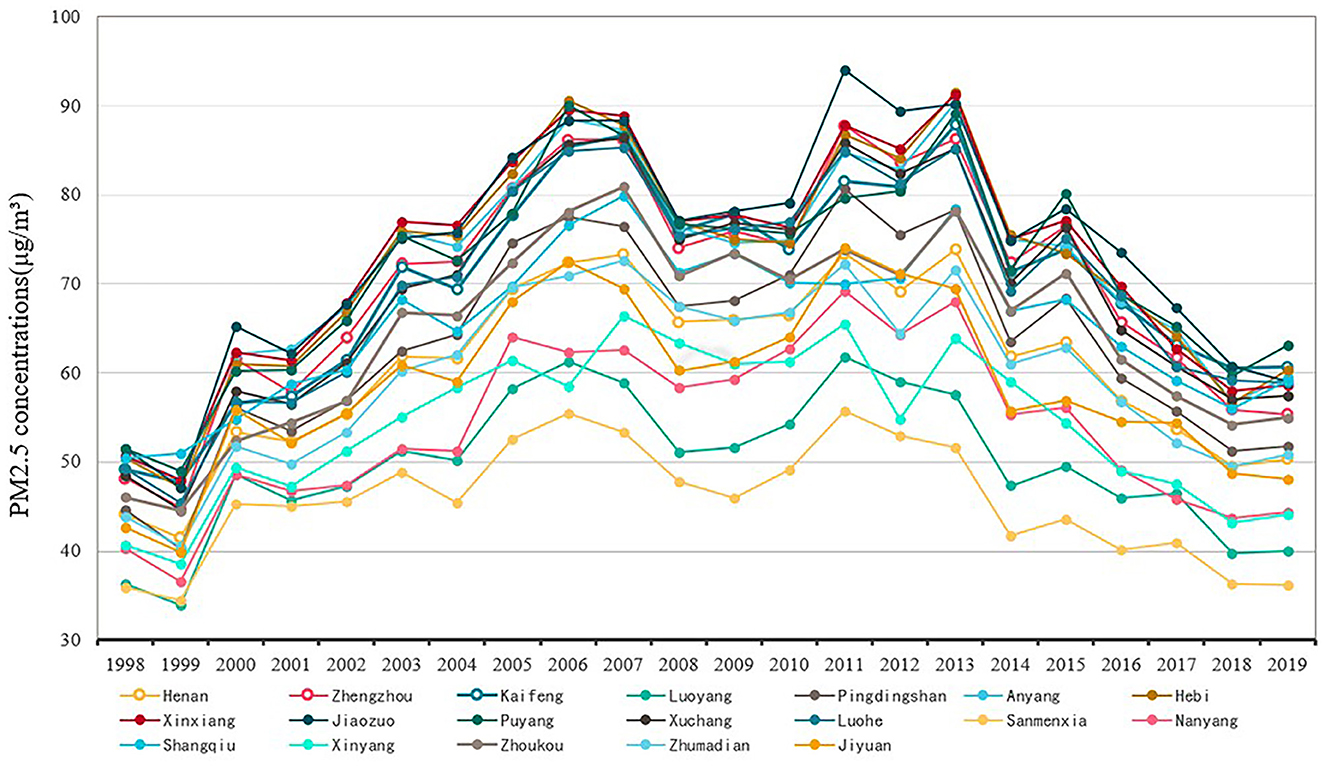
Figure 2. The trend of yearly mean concentration change of PM2.5.
At the city scale, Jiaozuo city and Xinxiang city had the highest annual average PM2.5 concentration among the 18 cities, Which was connected to the energy and industrial structures in the area. Heavy industry and the energy sector, which have a bigger environmental impact, dominate the local industrial structure. Additionally, there are a lot of coal deposits in the area. The electricity demand mainly relies on thermal power generation, which also aggravates the level of PM2.5 pollution. The low yearly mean PM2.5 concentrations in Luoyang and Jiyuan are because Luoyang is situated in Henan Province's western region and has a relatively dry and cold climate, which does not encourage the buildup of PM2.5 contaminants. This result also shows that the “Regulations on the Ban of Fireworks in Luoyang City” promulgated by the Ecological Environment Bureau of Luoyang City in 2005 has had some beneficial environmental effects. The industrial structure of Jiyuan city is dominated by light industry, which has only a minor environmental impact.
In order to gain insights into the temporal variation of PM2.5 concentration, using the yearly mean limits of PM2.5 concentration as outlined in the Ambient Air Quality Standard (GB3095-2012) by the Ministry of Environmental Protection of China in 2012, the study divides the yearly mean PM2.5 concentration into four intervals. Subsequently, the distribution of districts and counties within each interval is carefully analyzed during the study period, with a visual representation provided in Figure 3. The results show that: (1) There were few counties and districts in Henan Province with yearly average PM2.5 concentration levels below 35 g/m3. This indicates that there is no large-scale occurrence of PM2.5 low-value areas in Henan Province, and the overall air quality is worse. (2) From 1998 to 2019, the number of districts and counties with an yearly mean PM2.5 concentration values >75 μg/m3 first gradually increased with the development of industrialization in Henan Province, and then decreased to 0 with the government's gradual attention to PM2.5 pollution, which showed that PM2.5 pollution management in Henan Province had also achieved some results in recent years. (3) There were more districts and counties with yearly mean PM2.5 concentrations between 50 and 75 μg/m3, indicating that more districts and counties than necessary exceeded the national secondary standard and that there was still much work to be done in Henan Province to manage PM2.5 pollution.
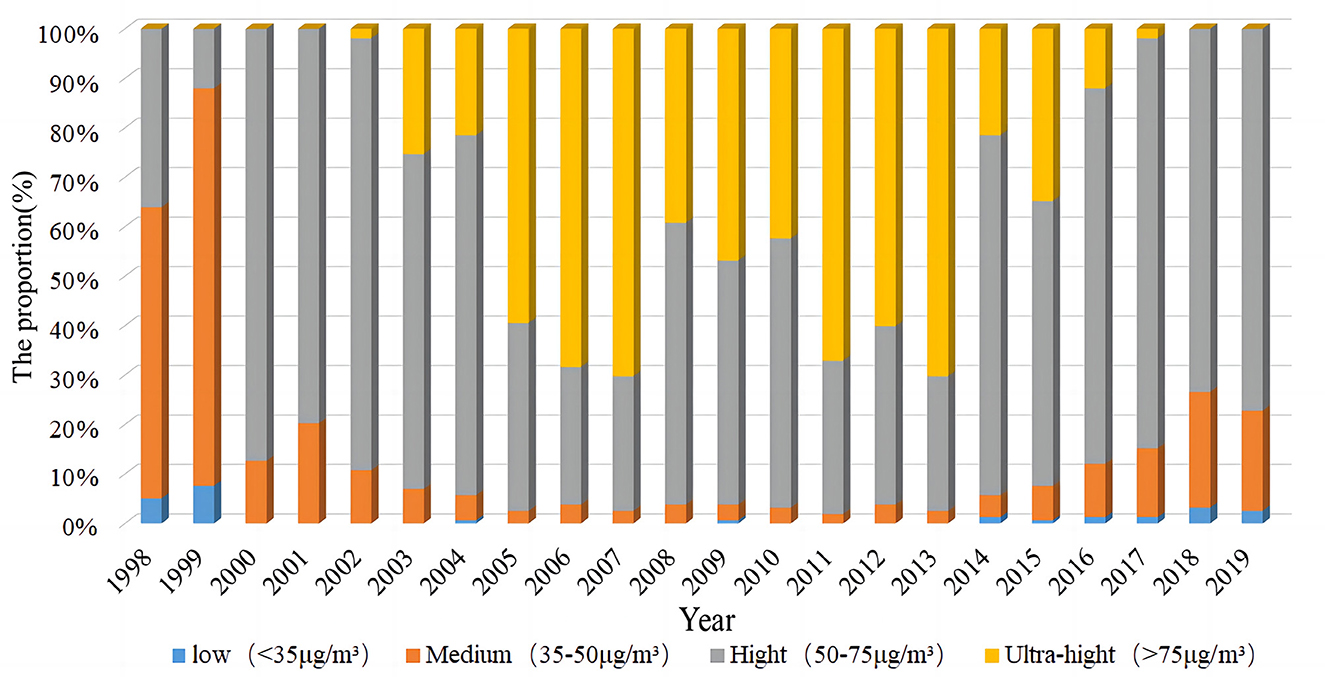
Figure 3. Trends of PM2.5 concentration changes by range in Henan provincein 1998–2019.
3.2 Spatial variation trend analysis of PM2.5 concentration
In order to deeply explore the spatiotemporal pattern of PM2.5 concentration, this paper used the standard deviation ellipse to quantitatively explain the spatiotemporal evolution characteristics of the average annual PM2.5 concentration distribution in Henan Province from a global perspective, such as the shift of the center of gravity, the contraction trend, and the direction of distribution. Only the results for 1998, 2004, 2009, 2014, and 2019 are shown here, and the details are shown in Table 3 and Figure 4.

Table 3. Standard deviation ellipse parameters.
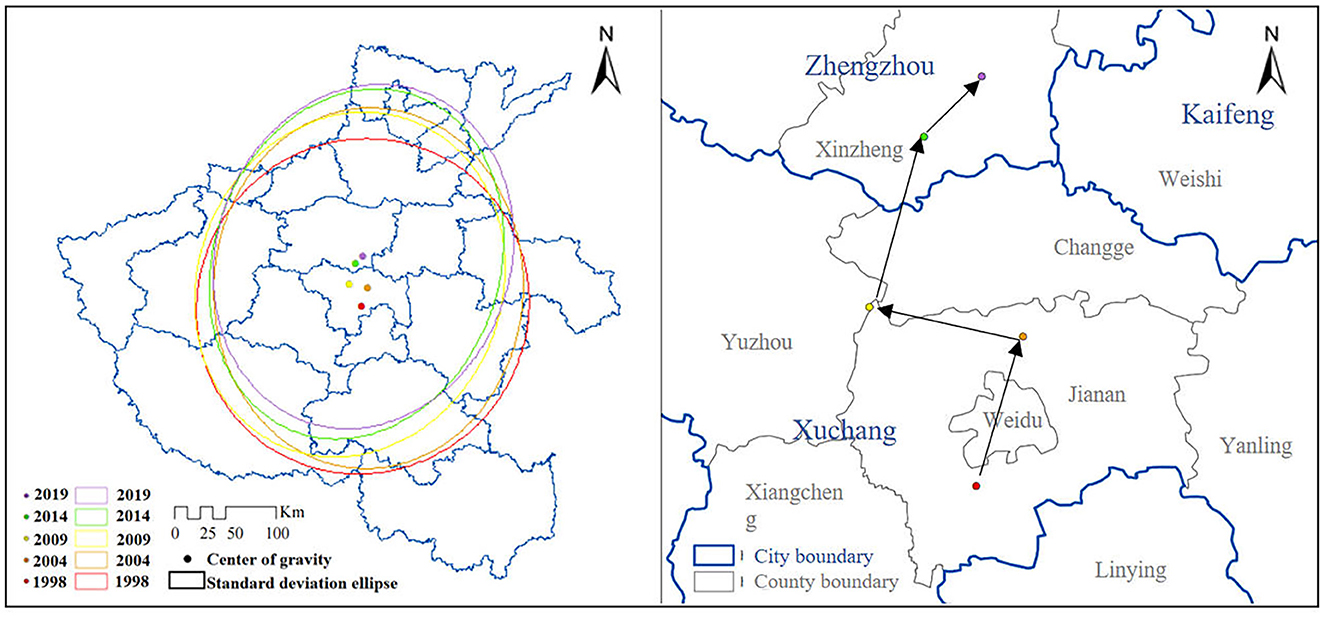
Figure 4. Spatial variation in the PM2.5 concentration center of gravity and standard deviation ellipse.
In terms of azimuthal variation, the PM2.5 concentration in Henan Province shows a spatial distribution pattern of “northeast-southwest”, which is roughly related to the geographical landscape and population distribution in Henan Province. The azimuth angle fluctuated from 35.84° in 1998 to 19.01° in 2019, indicating that there was a weak trend of the PM2.5 spatial distribution pattern shifting to the “north-south” direction, which means that Jiaozuo city, Xinxiang city, and their surrounding areas, which are roughly located in the northern Henan Province, have a slightly stronger air pollution level than the northeastern part. This result is consistent with the industrial and energy structure of northern Henan Province. The standard deviation ellipse's long and short axes' differences revealed a general tendency of gradually increasing, which further demonstrated the directionality of the spatial distribution of PM2.5 concentrations. From the direction of the long axis, the standard deviation of the long axis increased from 210.814 km in 1998 to 224.853 km in 2004, which means that the PM2.5 expanded in the direction of “northeast-southwest”, i.e., the high pollution area was concentrated. From 2004 to 2009, the standard deviation of the long axis decreased from 224.853 to 218.370 km, indicating that the air pollution in this period showed a shrinking trend in the main direction. This outcome is in line with the 22-year trend of Henan Province's yearly mean PM2.5 concentration. Indicating that the spatial centripetal force of the PM2.5 concentration initially increased and then dispersed, the standard deviation of the short axis showed a tendency of first reducing and then increasing. Overall, the geographical spillover effect has been highlighted as the PM2.5 concentration in Henan Province tends to expand and scatter in geographic areas.
In terms of the spatial center of gravity, the center of gravity of the spatial distribution of the yearly mean PM2.5 concentration gradually shifted from the southern zone of Jianan District in Xuchang city to the northeast in 1998. However, by 2004, the center of gravity remained in the Jian'an District and then shifted to the northwest. The center of gravity was located at the junction of Yuzhou and Jian'an Districts in 2004 and has shown a trend of shifting to the northeast since then, it is correlated with the spatial distribution pattern showing a “northeast-southwest” movement in the PM2.5 concentration in Henan Province. The final yearly mean PM2.5 concentration centers of gravity in 2014 and 2019 were within Xinzheng, Zhengzhou city. Overall, the spatial center of gravity of the PM2.5 concentration in Henan Province showed a trend of drifting from due south to due north. This change can be attributed to the ongoing industrial development in Zhengzhou and the large base and fast growth rate of motor vehicle ownership, the increased pollution emissions from motor vehicles, and the industrial and energy structures in northern Henan. From the perspective of ellipse coverage, the area of the standard deviation ellipse first decreased year by year from 139,540,000 km2 in 1998 to 124,510,000 km2 in 2014, and then it increased to 125,380,000 km2 in 2019. This result indicates that its distribution range showed a “contraction-expansion” trend, which means that the main range of PM2.5 pollution expanded from 2014 to 2019. In addition, the standard deviation ellipse of 5 years covered the north, middle, and east of Henan Province, representing the vital area of air pollution reduction in Henan Province.
Overall, the PM2.5 pollution distribution in Henan Province has been expanding recently, a spatial spillover effect has emerged, and air pollution is developing toward regional pollution. These patterns are mainly related to the long-term economic development in some areas and the unreasonable industrial structure, followed by the Effects of terrain and meteorological environment. The wide range of airflow causes the local air quality to be affected by both local pollutant emissions and pollution sources from other areas.
3.3 Spatial aggregation analysis of PM2.5 concentration
3.3.1 Global spatial autocorrelation analysis
To analyze the spatial distribution characteristics of the PM2.5 concentrations in Henan Province, PM2.5 remote sensing inversion data at the county level of administrative units were used for zonal statistics, and the yearly mean PM2.5 data for 5 years, 1998, 2004, 2009, 2014 and 2019, were selected for the global spatial autocorrelation analysis of PM2.5 data in Henan Province. The Moran's I index was analyzed (Figure 5): In the selected 5 years, Moran's I index has been >0, showing that the spatial distribution of PM2.5 in Henan Province has a significant positive spatial correlation, i.e., a significant spatial aggregation characteristic. This finding also suggests that, while building the driving model, the spatial heterogeneity of the effects of numerous variables on PM2.5 should be taken into consideration.
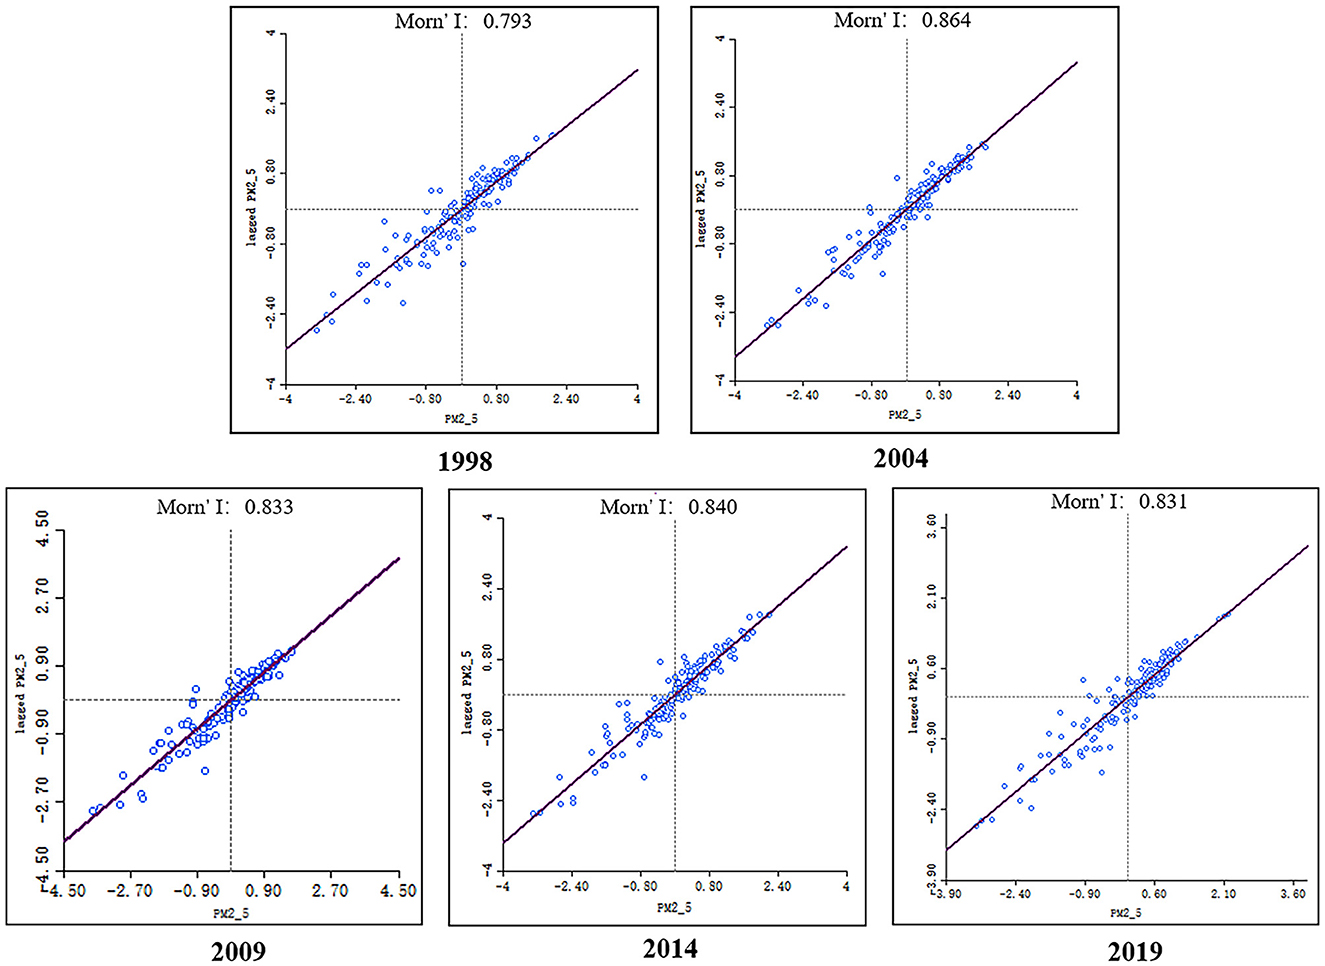
Figure 5. Moran's I index of PM2.5 for 1998, 2004, 2009, 2014, and 2019.
3.3.2 Local spatial autocorrelation analysis
In order to gain deeper insights into the spatial clustering attributes of PM2.5 in Henan Province, the hot spot analysis was performed using PM2.5 satellite inversion data, building upon the outcomes of global spatial autocorrelation analysis to investigate the local distribution pattern of PM2.5 concentrations. The results of the analysis (Figure 6) showed that the study area as a whole showed strong aggregation from 1998 to 2019, with local areas showing 99% confidence in the aggregation area in 1998, 2004, 2009, 2014, and 2019. From the perspective of spatial distribution, the hot spots are mainly dense in northern and central Henan, and the spatial correlation is high, and cold spots are dense in western and southern Henan, and the spatial correlation is low. The distribution of PM2.5 concentration cold and hot spots in Henan Province remained approximately the same, but the area and number of cold and hot spot areas of different levels changed to some extent. Temporally, the spatial autocorrelation of PM2.5 concentration in Henan Province indicated an overall strengthening trend, and the local autocorrelation in 2019 was significantly strengthened compared with that in 1998. Spatially, the hot spot areas showed a northward trend, gradually shifting from places such as Xuchang and Shangqiu to areas such as Anyang, Hebi, and Xinxiang in northern Henan.
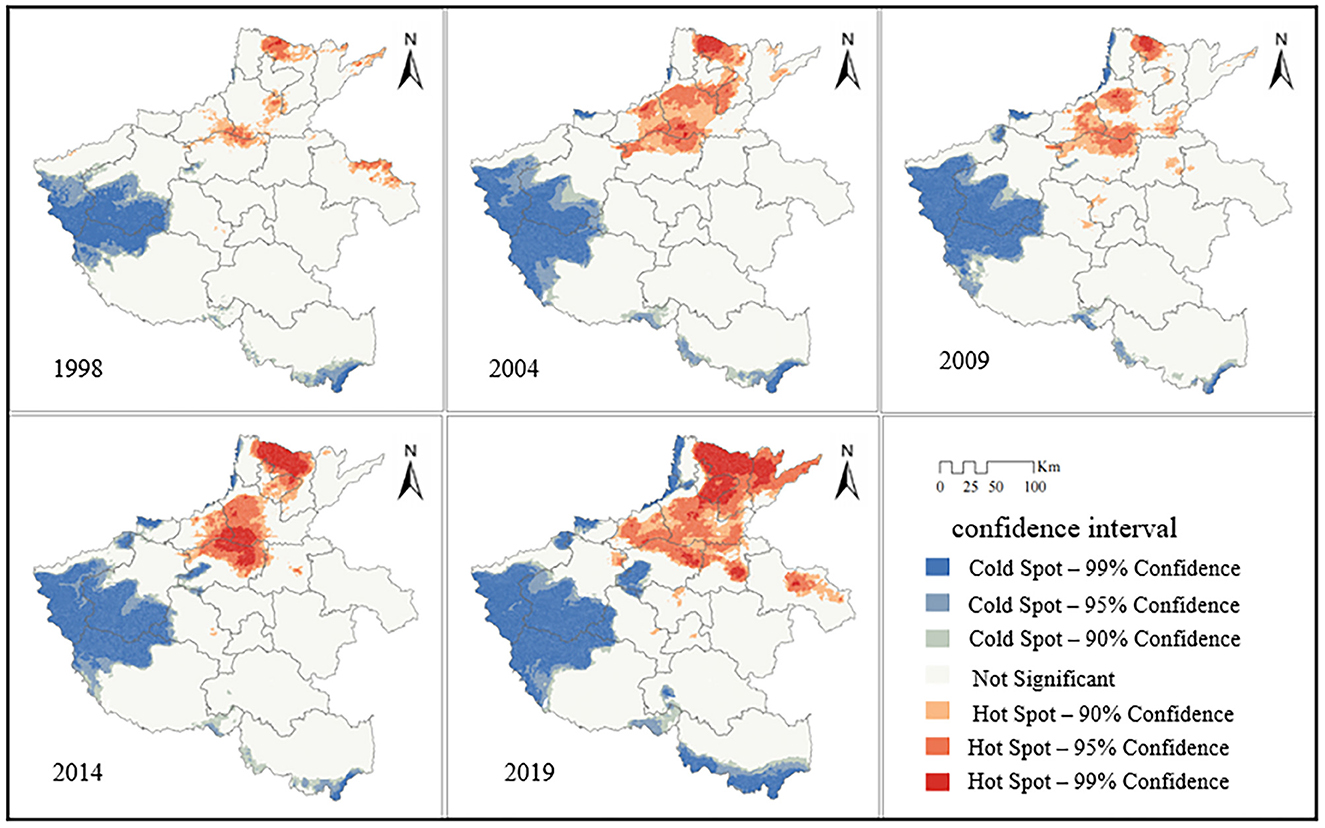
Figure 6. Spatial distribution of cold and hot spots.
3.4 Analysis of the driving mechanism
3.4.1 Comparison of the GWR model and MGWR model
This study used 2019 PM2.5 concentration and driver data to construct the PM2.5 driver mechanism. In the results of the regression analysis, higher values of goodness-of-fit R2 and smaller values of AICc and RSS indicate a better and more accurate fit of the model. From the data in Table 4, it can be deduced that: the R2 in the MGWR is greater than that in the GWR model by 0.107; the AICc value for the MGWR is considerably smaller than that of the GWR model; in addition, the RSS of MGWR is smaller, which indicates that its predicted values are closer to the truth. As a result, this study's data analysis shows that the MGWR is more accurate than the classical GWR model and may be utilized to more precisely analyze the driving mechanisms of PM2.5 concentration.
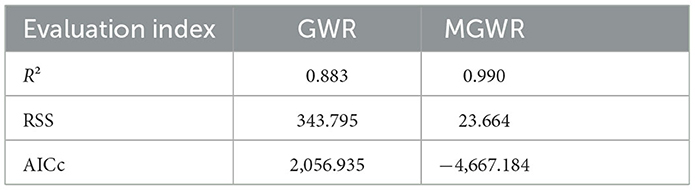
Table 4. Comparison of GWR and MGWR models.
The R2 values in Figure 7 indicate the actual strength of the selected natural and socioeconomic indicators to explain the PM2.5 concentration levels. The local R2 of all samples ranged from 0.069 to 0.988. Among them, 77.80% of the sample points had an R2 of over 0.80, and 51.86% had an R2 of over 0.90. This indicates that the 12 selected influencing factors in this study demonstrate significant and comprehensive explanatory capability for the spatial distribution of PM2.5 concentration in Henan Province. The lower R2 values in some areas of Zhoukou, Xinxiang, and Zhumadian indicate the existence of possible missing factors and the possible influence of cross-border transports of air pollutants from neighboring provinces, resulting in a lower model fit in this area.
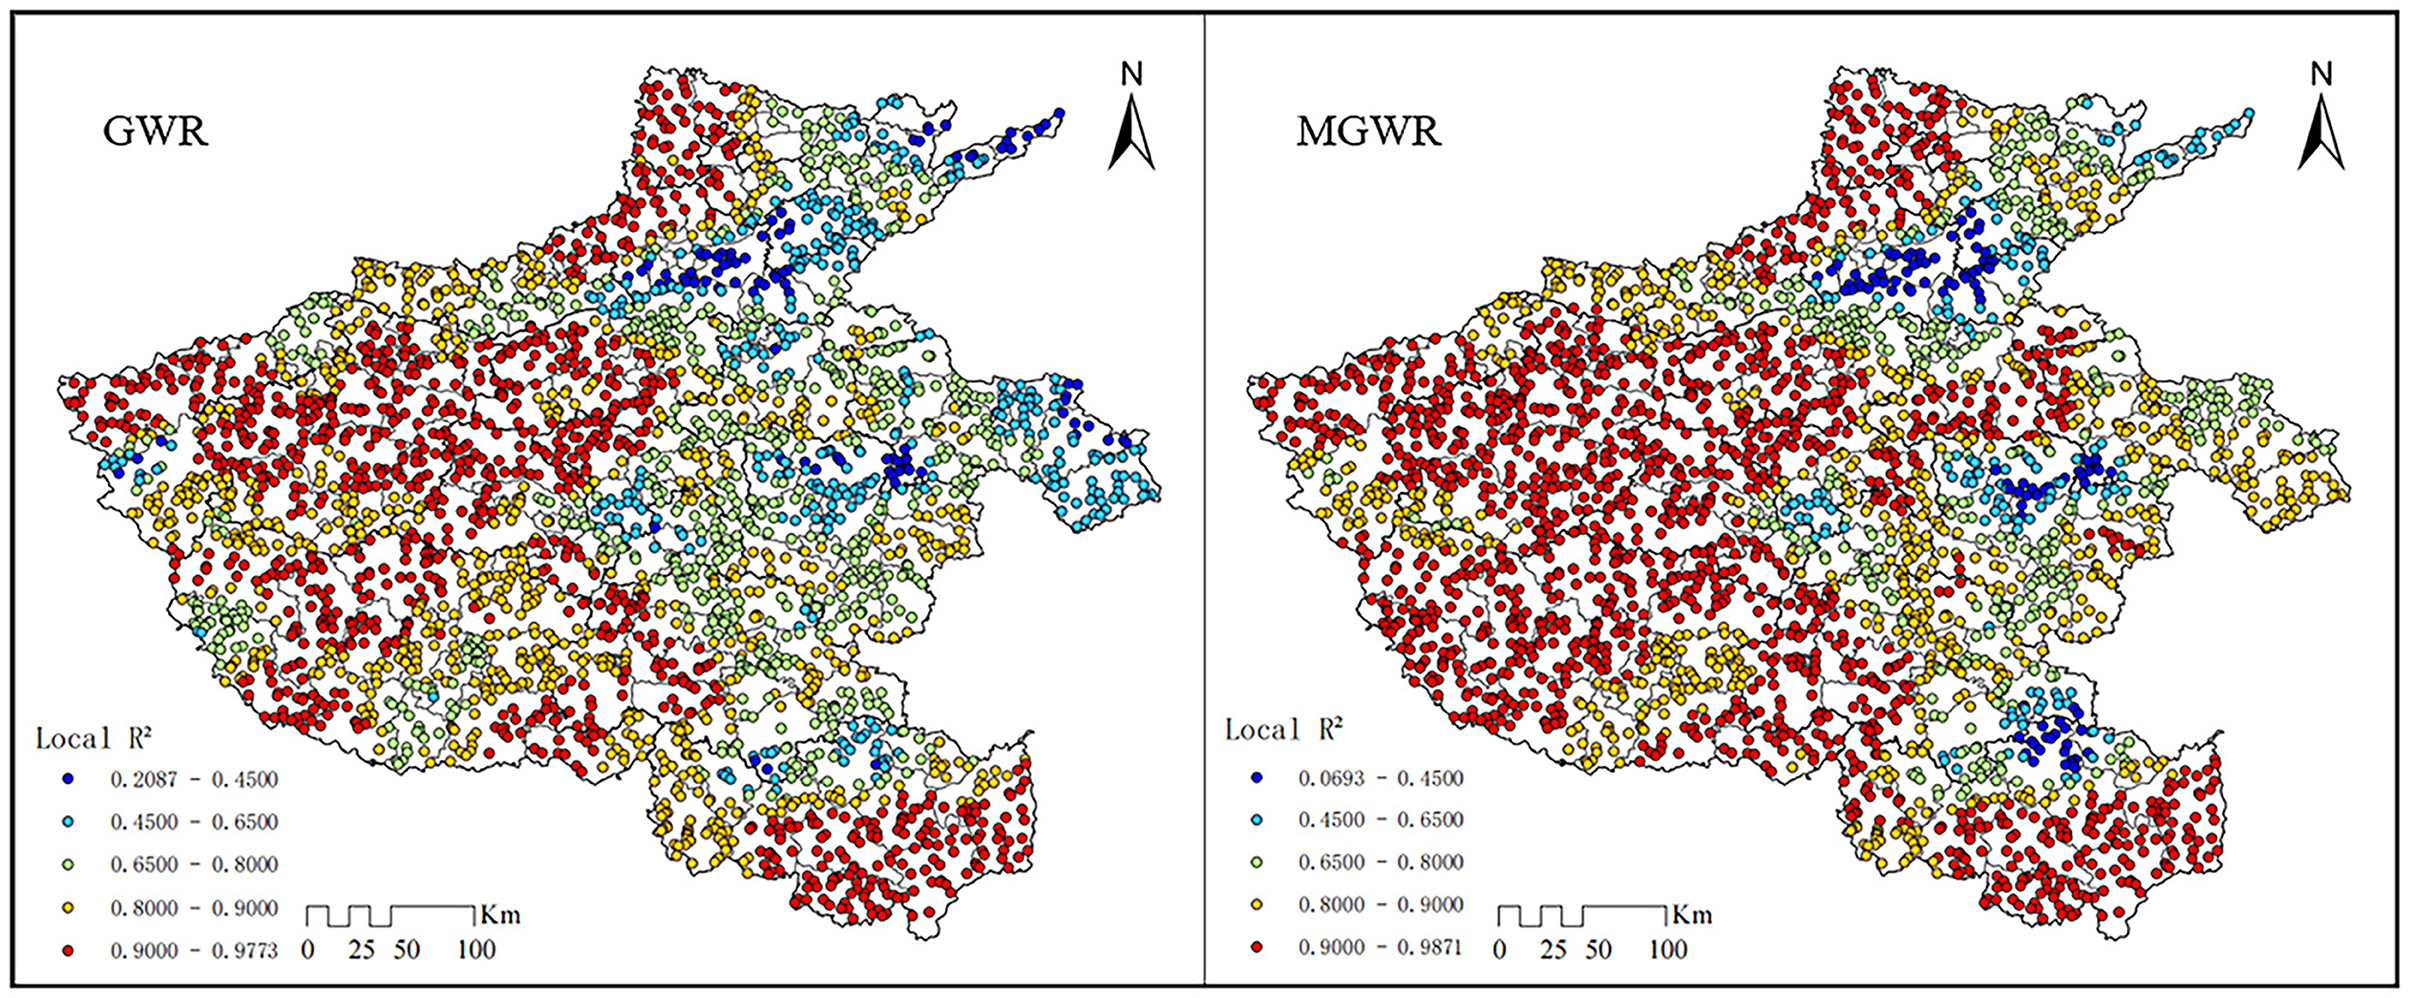
Figure 7. Comparison of local R2 spatial distribution between GWR and MGWR fitting results.
Based on the comparison of the bandwidth between the GWR model and the MGWR model (Table 5), it is evident that the MGWR model can explicitly represent the varying effect scales of different variable quantities, whereas the GWR can only represent the average effect scales of each variable. The bandwidth of the variables measures the spatial scales of action of each process, which can reflect the differences in the scales of action of different natural and socioeconomic influences on PM2.5 concentrations. The larger the action scale is, the smaller the spatial heterogeneity of the effect of the driving factor, while the opposite spatial heterogeneity is larger.
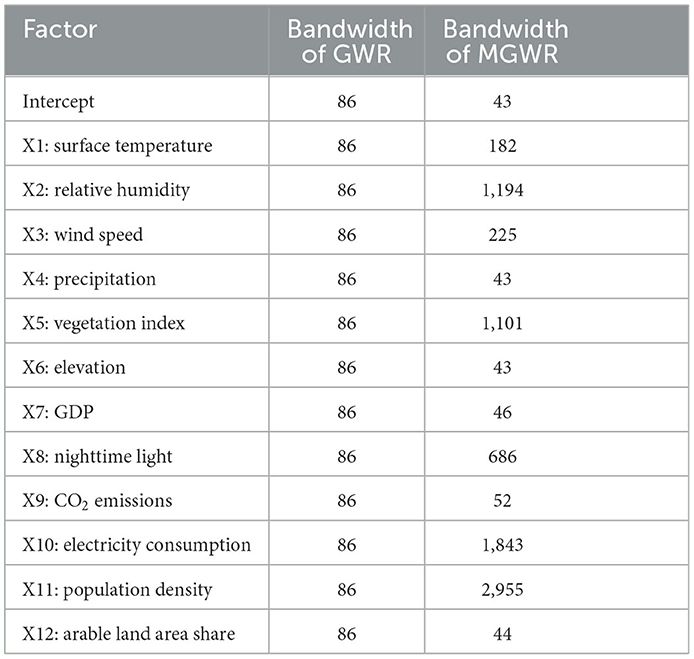
Table 5. Comparison of bandwidth between the GWR model and MGWR model.
Table 5 shows that the MGWR provides a more detailed perspective by directly reflecting the differential effect scales of various variables, while the GWR only considers the average effect scale. In addition, the bandwidth of variables is used to measure the spatial scale of their effects, revealing the differences in the scale of natural and socio-economic impacts on PM2.5 concentration. The larger the scale of action, the smaller the spatial heterogeneity of influencing factor effects. The smaller the scale of action, the greater the spatial heterogeneity.
Among the natural factors, the precipitation, elevation, mean surface temperature, and mean wind speed were 43, 43, 182, and 225, respectively, which were small (<300), and their effects on PM2.5 concentration were more spatially heterogeneous. The effect scales of GDP, the proportion of cultivated land, and CO2 emissions in the socioeconomic factors were 46, 44, and 56, respectively, all of which were relatively small (<100). Their effects on PM2.5 concentrations showed significant spatial heterogeneity. The effect scale of nighttime lights was 686, and its influence on PM2.5 concentration exhibited certain spatial heterogeneity. The effect scale of electricity consumption was 1,843, the spatial heterogeneity was relatively small. The effect scale of population density was 2,955, which was equal to the total sample size and was a global variable. There was almost no spatial heterogeneity, and the impression on PM2.5 concentration was consistent throughout Henan Province.
3.4.2 Spatial pattern of regression coefficient coefficients of drivers
Table 6 shows the statistical results of the regression coefficients of the MGWR model, and the results show the estimated coefficients of the MGWR using standardized data and the proportion of each influence factor coefficient for the different directions of PM2.5 action. The regression coefficients of the influencing factors derived from the MGWR model indicate that there is spatial heterogeneity in the effects of each indicator on regional PM2.5 concentrations. where surface temperature and humidity have positive effects; additionally, GDP, night lighting, and CO2 emissions mainly have positive effects, accounting for 93.70, 81.24, and 98.40% of the total sample, respectively. There is both a positive and a negative effect on the proportion of cultivated land area, with spatial polarization, in which the positive effect accounts for 57.37% of the total sample and the negative effect accounts for 47.64% of the total sample. Wind speed and NDVI were negative, and precipitation and elevation were mainly negative, accounting for 90.60 and 98.54% of the total samples, respectively. The intensity of the above drivers on PM2.5 concentrations, in order from highest to lowest, as seen through the absolute values of the coefficient means, are as follows: CO2 emissions (3.452), elevation (0.353), GDP (0.285), precipitation (0.271), intercept (0.231), surface temperature (0.054), wind speed (0.022), arable land area share (0.009), relative humidity (0.006), nighttime light (0.006), electricity consumption (0.002), vegetation index (0.001), and population density (0.001).
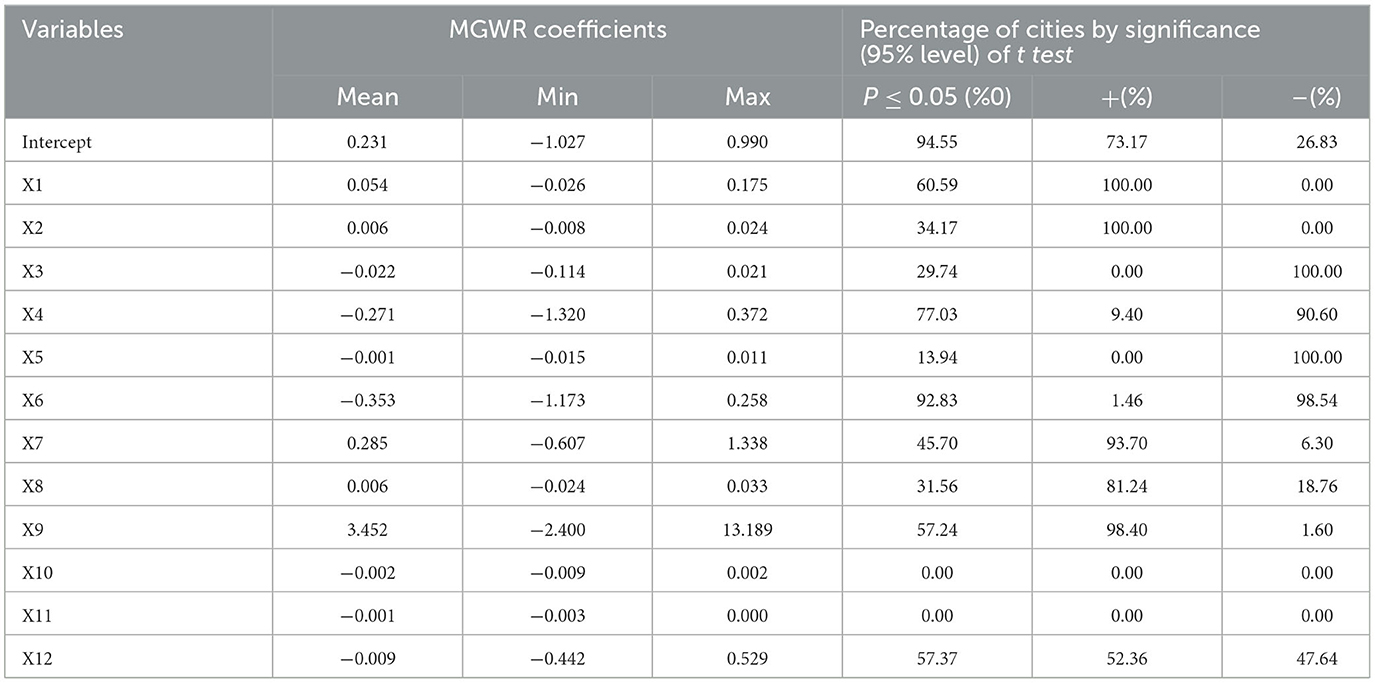
Table 6. Parameter estimates for the regression of PM2.5 concentrations using MGWR.
As seen in Figure 8, In the western part of Henan Province, the intercept parameter estimates are significantly negative, while in the rest of the area, the parameter estimates are significantly positive. This suggests that the existence of covariates has some influence on the distribution of PM2.5 concentrations in Henan Province. The lower PM2.5 concentration in western Henan may be related to the complex topography and climate, while the spread and dispersion of PM2.5 in the rest of the plain-dominated areas may be relatively easy (Figure 8A). The surface temperature has a positive influence on the PM2.5 concentration within a significant range, and the effect is strongest in the Henan section of China's second- and third-level step junctions. This result is because the fact that the junction of the second and third-level steps is in a basin surrounded by mountains. This topographic obstruction plays an important role in aerosol accumulation to some extent (56) (Figure 8B). The influence of relative humidity on PM2.5 concentration shows a positive effect, and the significant area has a circular structure, with the bordering areas of Zhengzhou, Luoyang, and Pingdingshan cities at the center; the center of gravity of influence intensity decreases to the outer side, which may be caused by the more prominent local altitude. Foggy weather with high relative humidity will lead to the inverse temperature phenomenon near the ground, which is not conducive to the diffusion of particulate matter (57), making the combination of particulate matter and water mist form PM2.5. However, when the relative humidity exceeds a certain threshold value, it causes precipitation, and the precipitation will have a flushing effect on the air to reduce the PM2.5 concentration. Since the relative humidity in Henan Province is below the threshold value, its effect on reducing PM2.5 concentration is positive (Figure 8C). Wind speed negatively affects the PM2.5 concentration, which indicates that airflow movement can effectively reduce the local PM2.5 concentration under windy conditions with good air pollutant dispersion conditions (Figure 8D). Precipitation mainly has a suppressing effect on PM2.5, with positive promotion effects found only in the southern part of Luoyang city and the central part of Nanyang city. In the rest of Henan Province, precipitation shows a significant northwest-southeast directional effect. Xinyang city, Zhumadian city, Pingdingshan city, and Sanmenxia city are high-value areas, and the influence intensity decreases on both sides (Figure 8E). The NDVI has an suppressed effect on PM2.5 concentration in the significant area, and when the NDVI value is high, it indicates that vegetation has a stronger absorption and deposition effect on atmospheric particulate matter, thus contributing to the diminution of PM2.5 concentration (Figure 8F). Elevation has a significant suppressed influence on the PM2.5 concentration in most parts of the province and has a certain positive promoting influence in only a small area south of Xinyang city. The inhibition effect forms the highest intensity in the northeast-southwest direction in Henan Province and decreases to the two sides, which is consistent with the topographic features of Henan Province (Figure 8G). In the majority of regions within Henan Province, GDP and PM2.5 concentrations show a positive correlation, which is due to the increase in emissions from pollution sources brought about by industrial development closely related to GDP, and only in some areas of Zhoukou city, Zhengzhou city and Xuchang city, it inhibits PM2.5, which is explained by the local government's increased investment in air control funds (Figure 8H). The negative effect of nighttime lighting on PM2.5 is mainly concentrated in Luoyang and Nanyang. Nighttime lighting can, to a certain extent, reflect the local economic development level (58). The negative impact of nighttime lighting on PM2.5 in these areas may be due to the tendency of Luoyang and Nanyang, which have a relatively developed level of economic development, to implement more stringent environmental protection measures (Figure 8I). There is a noticeable correlation between CO2 emissions and PM2.5 levels in the majority of areas in Henan Province, and the influence of CO2 emissions on PM2.5 increases from the northeast to the southwest. The explanation for this is that the primary origin of carbon dioxide emissions lies in the combustion of fossil fuels like coal, oil, and gas during industrial production (59). Consequently, the gases and particulate matter discharged due to industrial development play a crucial role in the rise of PM2.5 concentrations (Figure 8J). The arable land area share has strong spatial heterogeneity, and there is a bipolar influence on the PM2.5 concentration, with the capacity to suppress the PM2.5 in the plain areas of the province due to the larger and more aggregated area of cultivated land in the plain areas, and the plants in farmland have an adsorption influence on PM2.5, this is consistent with Yang et al. (46) findings that cropland has a negative effect on PM2.5 concentration in most areas of Zhengzhou City. The positive impact of cropland proportion on PM2.5 concentrations in mountainous and hilly regions may be attributed to the fact that an increase in cropland proportion leads to a decrease in forested land, resulting in an amplified extent of bare land during winter, thereby augmenting the PM2.5 source (60) (Figure 8K).
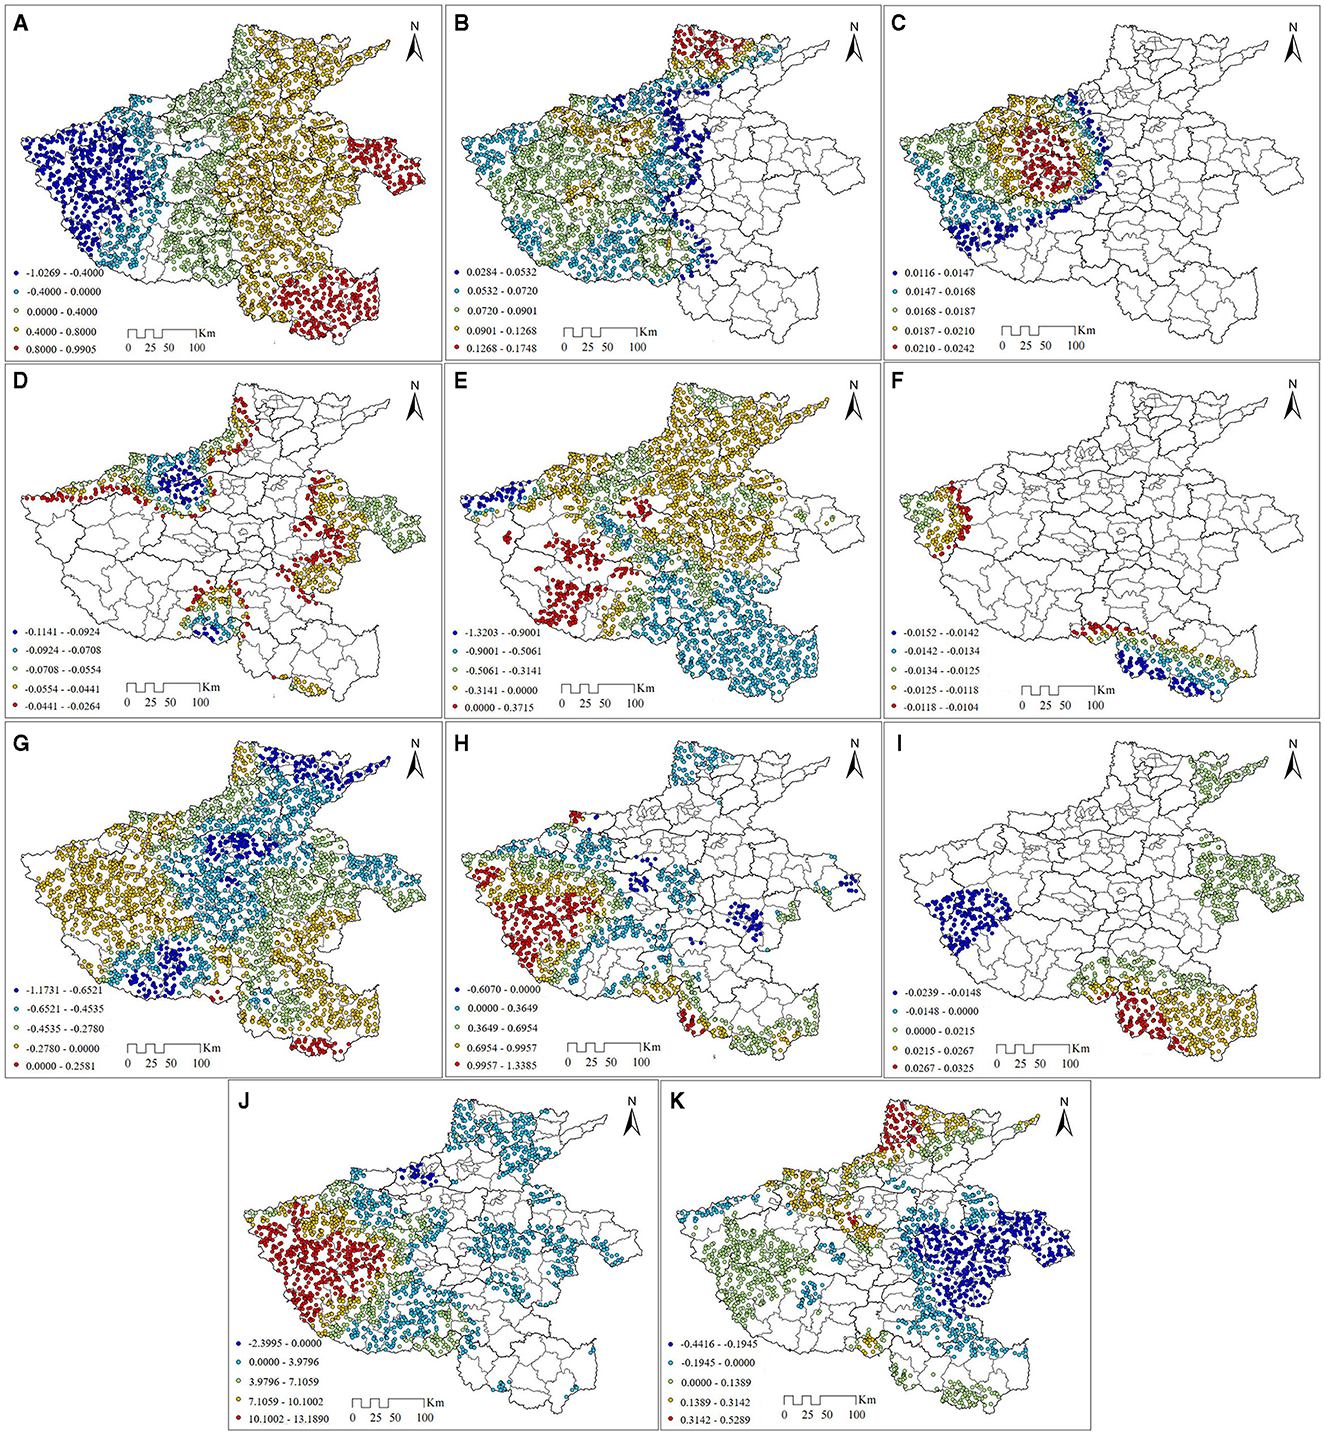
Figure 8. Spatial pattern of MGWR coefficients. (A) Intercet (bandwith = 43). (B) X1 (bandwith = 182). (C) X2 (bandwith = 1194). (D) X3 (bandwith = 225). (E) X4 (bandwith = 43). (F) X5 (bandwith = 1101). (G) X6 (bandwith = 43). (H) X7 (bandwith = 46). (I) X8 (bandwith = 686). (J) X9 (bandwith = 52). (K) X12 (bandwith = 44).
4 Conclusion and discussion
Lately, there has been considerable focus on the spillover of PM2.5 on air quality and public health. Taking Henan Province as the research object, this study used nearly 22 years of satellite remote sensing data from 1998 to 2019 to study the spatiotemporal distribution properties of PM2.5 in this region and deeply understand the influence of various driving factors on PM2.5 concentration and its spatial heterogeneity. The analysis presented above led this text to the following conclusions:
(1) PM2.5 management in Henan Province has achieved certain results in recent years, but there are still most districts and counties where the annual average concentration of PM2.5 exceeds the national category 2 standard, which indicates that there is still a long way to go in managing PM2.5 pollution in Henan Province.
(2) Between 1998 and 2019, the center of gravity of PM2.5 concentration in Henan Province as a whole shifted to the north, and the northern part of Henan Province is the key area for air pollution prevention and control.
(3) The PM2.5 concentrations from 1998 to 2019 have obvious spatial autocorrelation and significant spatial aggregation characteristics. Constructing the PM2.5 driving mechanism based on the MGWR model can reveal the effect of each influencing factor on different spatial scales, and a more realistic fitting effect can be derived. The comparison of the two models showed that the MGWR model was more applicable to the study of the PM2.5 concentration driving mechanism.
(4) Based on revealing the strength of each influencing factor, the regression coefficients of the influencing factors derived from the MGWR model in this study indicated that there were different degrees of spatial heterogeneity in the influence of each factor on PM2.5 concentrations in Henan Province.
From 1998 to 2019, the PM2.5 levels in Henan Province exhibited an “M”-shaped trend, with an overall increase in PM2.5 concentration in 2019 compared to 1998. The spatial center of gravity shift of the PM2.5 concentration in Henan Province from 1998 to 2019 showed an overall northward trend, with an overall “S” shape. The spatial center of gravity of the PM2.5 concentration was in within Zhengzhou city in 2019. This result was related to the continuous development of industry in Zhengzhou city, the large base and rapid growth rate of motor vehicle ownership, and the increased pollution emissions from motor vehicles. During the whole time interval, the overall PM2.5 center of gravity shift in Henan Province showed a northward trend, which was in line with the trend of the PM2.5 center of gravity shift in Henan Province by Ge QX (27). On this basis, we categorized the annual average PM2.5 concentrations in all districts and counties of Henan Province according to the Ambient Air Quality Standards (GB3095-2012) and found that overall, in Henan Province, although the PM2.5 pollution situation has been alleviated, most districts and counties still do not meet the national Class II standards for PM2.5 concentrations.
The PM2.5 concentrations from 1998 to 2019 had obvious spatial autocorrelation and significant spatial aggregation characteristics. The local spatial correlation analysis showed that the spatial hot spot areas were mainly dense in northern Henan Province, containing Anyang city, Hebi city, Xinxiang city, and Jiaozuo city, which coincided with the industrial structure and energy structure in northern Henan Province. Therefore, from a sustainable point of view, industrial upgrading and transformation should be encouraged or made mandatory, and there should be a shift from traditional industries that are highly polluting and emit high levels of pollutants to new industries that are clean, efficient, and emit low levels of pollutants. The cold spot areas were mainly dense in the west and south of Henan Province, including Sanmenxia city, Nanyang city, etc. This result was related to the topography and landscape, as western and southern Henan have many mountain ranges, which play the role of isolating PM2.5 transmission, so western and southern Henan have weaker PM2.5 aggregation than other areas in Henan Province.
The results of the MGWR model show that the effects of most of the influencing factors on PM2.5 concentration are spatially heterogeneous, which is consistent with the results of the Zang et al. (26) study based on the GWR model. Different from that, we reveal the different scales of the role between PM2.5 concentration and each influencing factor in Henan Province based on the MGWR model. We found that the bandwidths of precipitation, elevation, GDP, cropland ratio, and CO2 emission are smaller, which indicates that their effects on PM2.5 concentration are more spatially heterogeneous, and the multiscale effects should be taken into account when PM2.5 management or analysis is carried out through these factors.
Influencing factors such as CO2 emissions, elevation, GDP, and precipitation had a strong influence on PM2.5 concentration, which was consistent with the findings of Zang et al. (26) and Wu et al. (61). Unlike that, our results point out the spatial heterogeneity of the effects of most of the influencing factors on PM2.5 concentrations and reveal the effects of the influencing factors at the optimal scale. It is noteworthy that the proportion of arable land presents a differential effect on PM2.5 concentration in Henan Province, which is in line with the results of Hong K-r's study (62). Cultivated land, like common vegetation, can effectively reduce PM2.5, but the effect of cultivated land on PM2.5 mainly depends on the intensity of agricultural activities, so the scientific utilization of cultivated land and the adjustment of its function have a positive effect on the management of PM2.5.
The current study mainly focuses on analyzing the multi-scale effects of the role of PM2.5 influencing factors in Henan Province. In the next study, we plan to expand the study area to the Yellow River basin to form regional research results. In addition, considering that the results of the study show the existence of covariate effects, we plan to introduce more factors that may have an effect on the PM2.5 concentration and to study in depth the effects of the factors on PM2.5 at different scales, so as to provide more valuable references for the prevention and control of air pollution in China.
Data availability statement
The original contributions presented in the study are included in the article/supplementary material, further inquiries can be directed to the corresponding author/s.
Author contributions
HW: Conceptualization, Funding acquisition, Project administration, Resources, Supervision, Writing – review & editing. MZ: Formal analysis, Investigation, Methodology, Visualization, Writing – original draft. JN: Funding acquisition, Resources, Supervision, Validation, Writing – review & editing. XZ: Formal analysis, Funding acquisition, Validation, Writing – review & editing.
Funding
The author(s) declare financial support was received for the research, authorship, and/or publication of this article. This research was funded by the Open Fund of Key Laboratory of Urban Land Resources Monitoring and Simulation, Ministry of Natural Resources (Grant Number: KF-2022-07-019 to XZ), the Key Laboratory for Synergistic Prevention of Water and Soil Environmental Pollution, Xinyang Normal University (Grant Number: KLSPWSEP-A11 to JN), and the Key Scientific Research Projects of Colleges in Henan Province (Grant Numbers: 23A520001 and 21A420007 to HW).
Conflict of interest
The authors declare that the research was conducted in the absence of any commercial or financial relationships that could be construed as a potential conflict of interest.
Publisher's note
All claims expressed in this article are solely those of the authors and do not necessarily represent those of their affiliated organizations, or those of the publisher, the editors and the reviewers. Any product that may be evaluated in this article, or claim that may be made by its manufacturer, is not guaranteed or endorsed by the publisher.
References
1. Koçak E, Kizilkaya O. Towards sustainable development in china: do political rights and civil liberties matter for environmental quality? Environ Sci Pollut Res. (2020) 27:35488–500. doi: 10.1007/s11356-020-09813-x
2. Yang T, Zhou K, Ding T. Air pollution impacts on public health: evidence from 110 cities in yangtze river economic belt of China. Sci Total Environ. (2022) 851:158125. doi: 10.1016/j.scitotenv.2022.158125
3. Chen Z, Chen D, Zhao C, Kwan M-p, Cai J, Zhuang Y, et al. Influence of meteorological conditions on PM2.5 concentrations across china: a review of methodology and mechanism. Environ Int. (2020) 139:105558. doi: 10.1016/j.envint.2020.105558
4. Dai H, Huang G, Zeng H, Zhou F. PM2.5 volatility prediction by Xgboost-Mlp based on garch models. J Cleaner Prod. (2022) 356:131898. doi: 10.1016/j.jclepro.2022.131898
5. Pui DYH, Chen S-C, Zuo Z. PM2.5 in China: measurements, sources, visibility and health effects, and mitigation. Particuology. (2014) 13:1–26. doi: 10.1016/j.partic.2013.11.001
6. Zhang S, Routledge MN. The contribution of PM2.5 to cardiovascular disease in China. Environ Sci Pollut Res. (2020) 27:37502–13. doi: 10.1007/s11356-020-09996-3
7. Lin G, Fu J, Jiang D, Hu W, Dong D, Huang Y, et al. Spatio-temporal variation of PM2.5 concentrations and their relationship with geographic and socioeconomic factors in China. Int J Environ Res Public Health. (2014) 11:173–86. doi: 10.3390/ijerph110100173
8. Xie Y, Dai H, Dong H, Hanaoka T, Masui T. Economic impacts from PM2.5 pollution-related health effects in China: a provincial-level analysis. Environ Sci Technol. (2016) 50:4836–43. doi: 10.1021/acs.est.5b05576
9. He C, Hong S, Mu H, Tu P, Yang L, Ke B, et al. Characteristics and meteorological factors of severe haze pollution in China. Adv Meteorol. (2021) 2021:6680564. doi: 10.1155/2021/6680564
10. He L, Lin A, Chen X, Zhou H, Zhou Z, He P. Assessment of MERRA-2 surface PM2.5 over the Yangtze River Basin: ground-based verification, spatiotemporal distribution and meteorological dependence. Remote Sens. (2019) 11:460. doi: 10.3390/rs11040460
11. Jiang W, Gao W, Gao X, Ma M, Zhou M, Du K, et al. Spatio-temporal heterogeneity of air pollution and its key influencing factors in the yellow river economic belt of China from 2014 to 2019. J Environ Manage. (2021) 296:113172. doi: 10.1016/j.jenvman.2021.113172
12. Zhao H, Liu Y, Gu T, Zheng H, Wang Z, Yang D. Identifying spatiotemporal heterogeneity of PM2.5 concentrations and the key influencing factors in the middle and lower reaches of the yellow river. Remote Sens. (2022) 14:2643. doi: 10.3390/rs14112643
13. Shen Y, Zhang L, Fang X, Ji H, Li X, Zhao Z. Spatiotemporal patterns of recent PM2.5 concentrations over typical urban agglomerations in China. Sci Total Environ. (2019) 655:13–26. doi: 10.1016/j.scitotenv.2018.11.105
14. Liu X, Zou B, Feng H, Liu N, Zhang H. Anthropogenic factors of PM2.5 distributions in China's major urban agglomerations: a spatial-temporal analysis. J Clean Prod. (2020) 264:121709. doi: 10.1016/j.jclepro.2020.121709
15. Huang C, Liu K, Zhou L. Spatio-temporal trends and influencing factors of PM2.5 concentrations in urban agglomerations in China between 2000 and 2016. Environ Sci Pollut Res. (2021) 28:10988–1000. doi: 10.1007/s11356-020-11357-z
16. Gu J, Bai Z, Liu A, Wu L, Xie Y, Li W, et al. Characterization of atmospheric organic carbon and element carbon of PM2.5 and Pm10 at Tianjin, China. Aerosol Air Qual Res. (2010) 10:167–76. doi: 10.4209/aaqr.2009.12.0080
17. Huang YY, Zhu SJ, Wang SJ. Driving force behind PM2.5 pollution in Guangdong Province based on the interaction effect of institutional background and socioeconomic activities. Tropical Geography. (2020) 40:74–87. doi: 10.13284/j.cnki.rddl.003180
18. Zhang T, Liu P, Sun X, Zhang C, Wang M, Xu J, et al. Application of an advanced spatiotemporal model for PM2.5 prediction in Jiangsu Province, China. Chemosphere. (2020) 246:125563. doi: 10.1016/j.chemosphere.2019.125563
19. Xu X, Zhang T. Spatial-temporal variability of PM2.5 air quality in Beijing, China during 2013–2018. J Environ Manage. (2020) 262:110263. doi: 10.1016/j.jenvman.2020.110263
20. Huang Y, Ji Y, Zhu Z, Zhang T, Gong W, Xia X, et al. Satellite-based spatiotemporal trends of ambient PM2.5 concentrations and influential factors in Hubei, Central China. Atmos Res. (2020) 241:104929. doi: 10.1016/j.atmosres.2020.104929
21. Chen J, Song X, Zang L, Mao F, Yin J, Zhang Y. Spatio-temporal association mining of intercity PM2.5 pollution: Hubei province in China as an example. Environ Sci Pollut Res. (2023) 30:7256–69. doi: 10.1007/s11356-022-22574-z
22. Yang L, Hong S, He C, Huang J, Ye Z, Cai B, et al. Spatio-temporal heterogeneity of the relationships between PM2.5 and its determinants: a case study of Chinese cities in winter of 2020. Front Public Health. (2022) 10:810098. doi: 10.3389/fpubh.2022.810098
23. Fang C, Wang Z, Xu G. Spatial-temporal characteristics of PM2.5 in China: a city-level perspective analysis. J Geogr Sci. (2016) 26:1519–32. doi: 10.1007/s11442-016-1341-9
24. Wang Y, Wang F, Min R, Song G, Song H, Zhai S, et al. Contribution of local and surrounding anthropogenic emissions to a particulate matter pollution episode in Zhengzhou, Henan, China. Sci Rep. (2023) 13:8771. doi: 10.1038/s41598-023-35399-8
25. Yang H, Song X, Zhang Q. Rs&Gis based Pm emission inventories of dust sources over a provincial scale: a case study of Henan Province, Central China. Atmos Environ. (2020) 225:117361. doi: 10.1016/j.atmosenv.2020.117361
26. Zang ZF Li YH, Zhang FY, Xing Y. Spatiotemporal distribution of atmospheric pollutants and its relationship with vegetation index in the major grain-producing areas of China. Water Air Soil Pollut. (2022) 233:92. doi: 10.1007/s11270-022-05563-3
27. Ge QX, Liu Y, Yang H, Guo HL. Analysis on spatial-temporal characteristics and driving factors of PM2.5 in Henan Province from 2015 to 2019. Environ Sci. (2022) 43:1697–705. doi: 10.13227/j.hjkx.202108085
28. Zhou L, Zhou CH, Yang F, Wang B, Sun DQ. Spatio-temporal evolution and the influencing factors of PM2.5 in China between 2000 and 2011. Acta Geographica Sinica. (2017) 72:2079–92. doi: 10.11821/dlxb201711012
29. Fan P, Xu L, Yue W, Chen J. Accessibility of public urban green space in an urban periphery: the case of Shanghai. Landsc Urban Plan. (2017) 165:177–92. doi: 10.1016/j.landurbplan.2016.11.007
30. Yuan W, Sun H, Chen Y, Xia X. Spatio-Temporal evolution and spatial heterogeneity of influencing factors of SO2 Emissions in Chinese cities: fresh evidence from MGWR. Sustainability. (2021) 13:12059. doi: 10.3390/su132112059
31. Wang H, Chen Z, Zhang P. Spatial autocorrelation and temporal convergence of PM2.5 concentrations in Chinese cities. Int J Public Health. (2022) 19:13942. doi: 10.3390/ijerph192113942
32. Yan D, Zhou M, Diao Y, Yang M. Air pollution in China: spatial patterns and spatial coupling with population and economy. Front Environ Sci. (2022) 10:1040131. doi: 10.3389/fenvs.2022.1040131
33. Zhu M, Guo J, Zhou Y, Cheng X. Exploring the spatiotemporal evolution and socioeconomic determinants of PM2.5 distribution and its hierarchical management policies in 366 Chinese cities. Front Public Health. (2022) 10:843862. doi: 10.3389/fpubh.2022.843862
34. Peng J, Chen S, Lü H, Liu Y, Wu J. Spatiotemporal patterns of remotely sensed PM2.5 concentration in China from 1999 to 2011. Remote Sens Environ. (2016) 174:109–21. doi: 10.1016/j.rse.2015.12.008
35. Shi Y, Matsunaga T, Yamaguchi Y, Li Z, Gu X, Chen X. Long-term trends and spatial patterns of satellite-retrieved PM2.5 concentrations in South and Southeast Asia from 1999 to 2014. Sci Total Environ. (2018) 615:177–86. doi: 10.1016/j.scitotenv.2017.09.241
36. Mi K, Zhuang R, Zhang Z, Gao J, Pei Q. Spatiotemporal characteristics of PM2.5 and its associated gas pollutants, a case in China. Sustain Cities Soc. (2019) 45:287–95. doi: 10.1016/j.scs.2018.11.004
37. Chang JH, Tseng CY. Analysis of correlation between secondary PM2.5 and factory pollution sources by using ann and the correlation coefficient. IEEE Access. (2017) 5:22812–22. doi: 10.1109/ACCESS.2017.2765337
38. Ouyang W, Gao B, Cheng H, Hao Z, Wu N. Exposure inequality assessment for PM2.5 and the potential association with environmental health in Beijing. Sci Total Environ. (2018) 635:769–78. doi: 10.1016/j.scitotenv.2018.04.190
39. Wang JF, Xu CD. Geodetector: principle and prospective. Acta Geogr Sinica. (2017) 72:116–34. doi: 10.11821/dlxb201701010
40. Ding Y, Zhang M, Qian X, Li C, Chen S, Wang W. Using the geographical detector technique to explore the impact of socioeconomic factors on PM2.5 concentrations in China. J Clean Prod. (2019) 211:1480–90. doi: 10.1016/j.jclepro.2018.11.159
41. Xie Q, Xu X, Liu X. Is there an Ekc between economic growth and smog pollution in China? New evidence from semiparametric spatial autoregressive models. J Clean Prod. (2019) 220:873–83. doi: 10.1016/j.jclepro.2019.02.166
42. Hao Y, Liu Y-M. The influential factors of urban PM2.5 concentrations in China: a spatial econometric analysis. J Clean Prod. (2016) 112:1443–53. doi: 10.1016/j.jclepro.2015.05.005
43. Chen L, Zhang X, He F, Yuan R. Regional green development level and its spatial relationship under the constraints of Haze in China. J Clean Prod. (2019) 210:376–87. doi: 10.1016/j.jclepro.2018.11.037
44. Luo J, Du P, Samat A, Xia J, Che M, Xue Z. Spatiotemporal pattern of PM2.5 concentrations in Mainland China and analysis of its influencing factors using geographically weighted regression. Sci Rep. (2017) 7:40607. doi: 10.1038/srep40607
45. Wang SJ, Gao S, Chen J. Spatial heterogeneity of driving factors of urban haze pollution in China based on GWR model. Geogr Res. (2020) 39:651–68.
46. Yang DY, Meng F, Liu Y, Dong GP, Lu DB. Scale effects and regional disparities of land use in influencing PM2.5 concentrations: a case study in the Zhengzhou Metropolitan Area, China. Land. (2022) 11:1538. doi: 10.3390/land11091538
47. Fotheringham AS, Yue H, Li Z. Examining the influences of air quality in China's cities using multi-scale geographically weighted regression. Trans GIS. (2019) 23:1444–64. doi: 10.1111/tgis.12580
48. Fotheringham AS, Yang W, Kang W. Multiscale geographically weighted regression (Mgwr). Ann Am Assoc Geogr. (2017) 107:1247–65. doi: 10.1080/24694452.2017.1352480
49. Meng B, Wang JF. A review on the methodology of scaling with geo-data. Acta Geogr Sinica. (2005) 02:277–88. doi: 10.11821/xb200502011
50. van Donkelaar A, Martin RV Li C, Burnett RT. Regional estimates of chemical composition of fine particulate matter using a combined geoscience-statistical method with information from satellites, models, and monitors. Environ Sci Technol. (2019) 53:2595–611. doi: 10.1021/acs.est.8b06392
51. Hammer MS, van Donkelaar A, Li C, Lyapustin A, Sayer AM, Hsu NC, et al. Global estimates and long-term trends of fine particulate matter concentrations (1998–2018). Environ Sci Technol. (2020) 54:7879–90. doi: 10.1021/acs.est.0c01764
52. Zhao AZ, Xiang KZ, Liu XF, Zhang XR. Spatio-temporal evolution patterns of PM2.5 and relationship with urban expansion in Beijing-Tianjin-HebeiUrban agglomeration from 2000 to 2018. Environ Sci. (2022) 05:2274–83. doi: 10.13227/j.hjkx.202109226
53. Chen J, Gao M, Cheng S, Hou W, Song M, Liu X, et al. Global 1 Km × 1 Km gridded revised real gross domestic product and electricity consumption during 1992–2019 based on calibrated nighttime light data. Sci Data. (2022) 9:202. doi: 10.1038/s41597-022-01322-5
54. Yang J, Huang X. The 30m annual land cover dataset and its dynamics in China from 1990 to 2019. Earth Syst Sci Data. (2021) 13:3907–25. doi: 10.5194/essd-13-3907-2021
55. Yu H, Fotheringham AS, Li Z, Oshan T, Kang W, Wolf LJ. Inference in multiscale geographically weighted regression. Geogr Anal. (2020) 52:87–106. doi: 10.1111/gean.12189
56. Chuang M-T, Chiang P-C, Chan C-C, Wang C-F, Chang EE, Lee C-T. The Effects of synoptical weather pattern and complex terrain on the formation of aerosol events in the greater Taipei Area. Sci Total Environ. (2008) 399:128–46. doi: 10.1016/j.scitotenv.2008.01.051
57. Bai K, Li K, Guo J, Cheng W, Xu X. Do more frequent temperature inversions aggravate Haze Pollution in China? Geophys Res Lett. (2022) 49:e2021GL096458. doi: 10.1029/2021GL096458
58. Wang W, Samat A, Abuduwaili J, Ge Y. Spatio-temporal variations of satellite-based PM2.5 concentrations and its determinants in Xinjiang, Northwest of China. Int J Environ Res Public Health. (2020) 17:2157. doi: 10.3390/ijerph17062157
59. Wang P, Zhou W, Xiong X, Wu S, Niu Z, Yu Y, et al. Source attribution of atmospheric CO2 Using 14C and 13C as tracers in two chinese megacities during winter. J Geophys Res Atmos. (2022) 127:e2022JD036504. doi: 10.1029/2022JD036504
60. Li C, Zhang K, Dai Z, Ma Z, Liu X. Investigation of the impact of land-use distribution on PM2.5 in weifang: seasonal variations. Int J Environ Res Public Health. (2020) 17:5135. doi: 10.3390/ijerph17145135
61. Wu XH, Chen Y, Guo J, Wang G, Gong Y. Spatial concentration, impact factors and prevention-control measures of PM2.5 pollution in China. Nat Hazards. (2017) 86:393–410. doi: 10.1007/s11069-016-2697-y
Keywords: PM2.5, spatiotemporal variation, MGWR, Central China, air quality
Citation: Wang H, Zhang M, Niu J and Zheng X (2023) Spatiotemporal characteristic analysis of PM2.5 in central China and modeling of driving factors based on MGWR: a case study of Henan Province. Front. Public Health 11:1295468. doi: 10.3389/fpubh.2023.1295468
Received: 16 September 2023; Accepted: 14 November 2023;
Published: 05 December 2023.
Edited by:
Shani Tiwari, Council of Scientific and Industrial Research (CSIR), IndiaReviewed by:
Xianmang Xu, Qilu University of Technology, ChinaDongyang Yang, Henan University, China
Copyright © 2023 Wang, Zhang, Niu and Zheng. This is an open-access article distributed under the terms of the Creative Commons Attribution License (CC BY). The use, distribution or reproduction in other forums is permitted, provided the original author(s) and the copyright owner(s) are credited and that the original publication in this journal is cited, in accordance with accepted academic practice. No use, distribution or reproduction is permitted which does not comply with these terms.
*Correspondence: Jiqiang Niu, bml1amlxaWFuZ0B4eW51LmVkdS5jbg==