
94% of researchers rate our articles as excellent or good
Learn more about the work of our research integrity team to safeguard the quality of each article we publish.
Find out more
ORIGINAL RESEARCH article
Front. Public Health , 11 January 2024
Sec. Infectious Diseases: Epidemiology and Prevention
Volume 11 - 2023 | https://doi.org/10.3389/fpubh.2023.1292614
This article is part of the Research Topic Emerging and Re-emerging Viral Infections: Epidemiology, Pathogenesis and New Methods for Control and Prevention View all 31 articles
 Isaac Murisi Pedroza-Uribe1
 Natali Vega Magaña2,3
 José Francisco Muñoz-Valle3Marcela Peña-Rodriguez2Ahtziri Socorro Carranza-Aranda4Rocío Sánchez-Sánchez5
 Alberto Anthony Venancio-Landeros5Octavio Patricio García-González5Jacob Jecsan Zavala-Mejía6
 Moisés Ramos-Solano7
 Oliver Viera-Segura2*†
 Mariel García-Chagollán3*†
Introduction: Respiratory viral infections represent a significant global health burden. Historically, influenza, rhinovirus, respiratory syncytial virus, and adenovirus have been the prevalent viruses; however, the landscape shifted with the widespread emergence of SARS-CoV-2. The aim of this study is to present a comprehensive epidemiological analysis of viral respiratory infections in Jalisco, Mexico.
Methods: Data encompassing individuals with flu-like symptoms from July 2021 to February 2023 was scrutinized for viral diagnosis through PCR multiplex. The effect of social mobility on the increase in respiratory viral diagnosis infection was considered to estimate its impact. Additionally, sequences of respiratory viruses stored in public databases were retrieved to ascertain the phylogenetic classification of previously reported viruses in Mexico.
Results: SARS-CoV-2 was the most detected virus (n = 5,703; 92.2%), followed by influenza (n = 479; 7.78%). These viruses were also found as the most common co-infection (n = 11; 50%), and for those with influenza, a higher incidence of severe disease was reported (n = 122; 90.4%; p < 0.001). Regarding comorbidities and unhealthy habits, smoking was found to be a risk factor for influenza infection but a protective factor for SARS-CoV-2 (OR = 2.62; IC 95%: 1.66–4.13; OR = 0.65; IC 95%: 0.45–0.94), respectively. Furthermore, our findings revealed a direct correlation between mobility and the prevalence of influenza infection (0.214; p < 0.001).
Discussion: The study presents evidence of respiratory virus reemergence and prevalence during the social reactivation, facilitating future preventive measures.
Respiratory infections are considered nowadays a significant global health burden, causing a wide range of respiratory tract infections, mainly in the upper respiratory tract (1). Before the COVID-19 pandemic, influenza, rhinovirus, respiratory syncytial virus, and adenovirus were considered the most common etiological agents of respiratory disease (2). Except for influenza, these viruses were referred to only as “common colds,” and only a few studies focused on their epidemiological and clinical characterization (2).
Since the emergence of SARS-CoV-2 in 2019, countries have conducted strategies for viral control; one of the most significant was the non-pharmaceutical interventions consisting of city lockdowns, physical distancing, use of personal protective equipment, and individual hygiene practices (3). For instance, there has been a decrease in reported cases of the syncytial virus, Influenza A and B virus, parainfluenza virus 1–3, adenovirus, and human metapneumovirus from 2011 to 2022 (4, 5). Overall, there was a significant decline in seasonal influenza reports during the COVID-19 pandemic in many countries, including the United States, Japan, England, Australia, Canada, South Africa, Singapore, Taiwan, South Korea, and Chile (4, 6, 7). Nevertheless, in 2021, the National Health Institute reported a reemergence of non-SARS-CoV-2 respiratory viruses in the respective countries (4, 8). The viral epidemiological fluctuation could be attributable to the elimination of the non-pharmaceutical interventions and a possible replication interference between viruses (4, 9).
The clinical presentation of respiratory viral infections can vary widely, ranging from asymptomatic or mild illness to severe respiratory distress and organ failure. Coinfections with multiple respiratory viruses are uncommon, and whether they can complicate the clinical course and management of affected individuals is not well described. Moreover, underlying comorbidities, such as diabetes and hypertension, or unhealthy habits, such as smoking, can increase the risk of severe illness and complications (2, 10).
Surveillance systems play a critical role in monitoring the circulation and genetic evolution of respiratory viruses, providing essential data for public health responses, and aiding in the development of targeted interventions. According to the PAHO report, respiratory viruses followed a common epidemiological pattern in Latin America until 2020, with the emergence of the SARS-CoV-2 pandemic, in which there was a decline in the number of cases detected; but, in 2022, an increase in the diagnosis of non-SARS-CoV-2 respiratory viruses was reported (11). In Mexico, the thoroughness of the epidemiological description of SARS-CoV-2 differs from other respiratory viruses; even for the influenza virus, diagnosis and reports are uncommon. The national health institution in Mexico reported more than 10 million acute respiratory infections in 2022 (12), yet these were categorized collectively as acute respiratory infections without viral classification; Jalisco state fits in this same scenario, with no viral respiratory characterization carried despite the augment of the diagnosis of non-SARS-CoV-2 infection (12). Moreover, a previous study described the circulation of a high diversity of respiratory viruses (13). This work aims to provide an overview of the diversity of respiratory viruses and discuss the epidemiology, clinical manifestations, and social impact on the transmission dynamics, as well as its implications on disease severity.
As part of a comprehensive strategy to study and monitor the epidemiology of respiratory viruses in the Jalisco state, the Universidad de Guadalajara established a diagnosis laboratory during the COVID-19 pandemic for outpatient SARS-CoV-2 epidemiological surveillance. In this context, nasopharyngeal samples and clinical-demographic data from patients with flu-like illness (ILI) and severe acute respiratory infections (SARI) were retrospectively recovered. The eligibility criteria for the patients enrolled in the present study were as follows: (i) outpatient of any age or sex group requiring molecular diagnosis at the Laboratorio de Diagnóstico de Enfermedades Emergentes y Reemergentes (LaDEER; laboratory validated by the Mexico National Health Institute for respiratory viral diagnosis for epidemiological surveillance); (ii) people who had three or more ILI or SARI symptoms, according to the WHO surveillance case definitions, or other symptoms related to respiratory infection such as fever ≥37.0°C, anosmia, dysgeusia, cough, nasal congestion, chest pain, headache, among others. For the purpose of this study, severity degree was defined according to the number of symptoms; (iii) individuals previously in contact with people with a respiratory infection. All the clinical and epidemiological information, such as comorbidities, symptoms, and demographics, was retrieved by implementing a telephone survey, as mentioned previously (14).
A total of 6,184 nasopharyngeal samples were processed by RT-qPCR. The viral RNA was extracted with the Viral RNA Auto Extraction & Purification Kit (Cat. 3103010059, 3DMed) using the ANDiS 350 Automated Nucleic Acid Extraction System (3DMed). Initially, all samples were examined the same day they were sampled for the most common respiratory viruses, influenza, and SARS-CoV-2, employing the COVIFLU Kit Multiplex (Cat. G2LCoFM-04, Genes2life SAPI de CV, Irapuato, Mexico), which identifies the N gene of SARS-CoV-2, and the coding region of matrix protein (M) for influenza A and B using a Quant Studio 5 (Applied Biosystems); after this analysis, RNA and oro-nasopharyngeal tube were stored at −80°C for subsequent examinations. The samples that were negative for SARS-CoV-2 were screened for other viral infections using Bluefinder 22 (Cat. G2LBF22–01, Genes2Life, Mexico) in the IntelliQube automated PCR instrument (BioSearch Technologies), according to the manufacturer’s instructions; this kit is designed for the diagnosis of 22 respiratory pathogens, such as Rhinovirus, Enterovirus, Bocavirus, Metapneumovirus, Adenovirus, Influenza H1N1 (09 pdm), Influenza H3N2, Influenza B (Victoria and Yamagata lineages), Syncytial A/B, SARS-CoV-2, Parainfluenza (1, 2, 3, and 4), and Human coronavirus (OC43, 229E, NL63, and HKU1). A sample was considered positive when Ct-values were below 35 and when a clear sigmoid curve was observed for the corresponding marker; additionally, a coinfection was defined when an individual tested positive for two or more viruses.
In order to evaluate the relationship between the epidemic behavior of respiratory pathogens and the mobility rate in the Jalisco state, we used the database from Google, LLC website (15). With this information and the epidemiological data, we analyzed the shifting patterns of respiratory virus distribution according to the impact of the local population mobility in the Jalisco state.
A comprehensive search through the Nucleotide section in the public database from the National Center for Biotechnological Information (NCBI), using the keywords “(Virus),” “and,” “Jalisco,” “complete genome” of the main respiratory virus circulating in West Mexico was performed; however, since no results were obtained, we amplified the search to include the entirety of the country. A search for Influenza, Respiratory Syncytial Virus, Human Coronavirus, Adenovirus, Parainfluenza, and Rhinovirus was carried out. Using only the downloaded sequence data, we performed a multiple alignment using MAFFT v.7. A phylogenetic tree was constructed using the Neighbor-Joining algorithm, employing Tamura-Nei as the substitution model of DNA evolution. Phylogenetic tree statistical reliability was evaluated by bootstrap analysis of 10,000 replicates.
All qualitative data was summarized as frequencies and percentages, while quantitative data as median and standard deviation. The chi-square test or Fisher’s exact test was performed for comparative analyses. Kruskal-Wallis and Nemenyi post hoc tests were used to determine the most common combinations of symptoms and the most prevalent comorbidities. In addition, the correlation between the mobility rate from July 2021 to February 2023 with viral incidence was evaluated by the Kendall-Tau test. All data was analyzed with R Studio software (RStudio Team, 2020) and graphics in GraphPad Prism version 9. Statistically significant differences were considered with a cut-off value of p <0.05.
A total of 6,184 individuals were included in the present study, corresponding to 24.1, 75.8, and 0.1% recruited in 2021, 2022, and 2023, respectively. The overall mean age of the population was 37.29 ± 15.98 (males 37.79 ± 16.33; females 36.91 ± 15.69), with a predominant representation of female individuals (n = 3,533, 57.1%). Data stratification involved categorizing participants into age groups (<18, 18–60, and > 60 years) to compare the distribution between males and females. The main prevalence was observed in the 18–60 age group, consisting of 4,947 individuals (80%), with a female predominance. 3,591 individuals (70.2%) of the population manifested symptoms; headache was reported by 46.6% (n = 2,421; from 5,190 with clinical data) of the individuals, followed by cough and sore throat with 42.1% (n = 2,183) and 39.2% (n = 2,032), respectively. Moreover, the comparative analysis revealed a higher proportion of females experiencing symptomatology compared to males and, excluding fever, fatigue, myalgia, and arthralgia, common respiratory symptoms were more common in women.
Furthermore, the survey revealed comorbidities or unhealthy habits in 26.4% (n = 1,372) of the patients, with obesity as the most prevalent condition (10.8%; n = 559), followed by smoking and hypertension (9.8 and 6.3%, respectively). Additionally, males presented the highest proportion of any comorbidity. When evaluating comorbidity information independently, the proportion of males reporting a previous disease was the largest (Table 1).
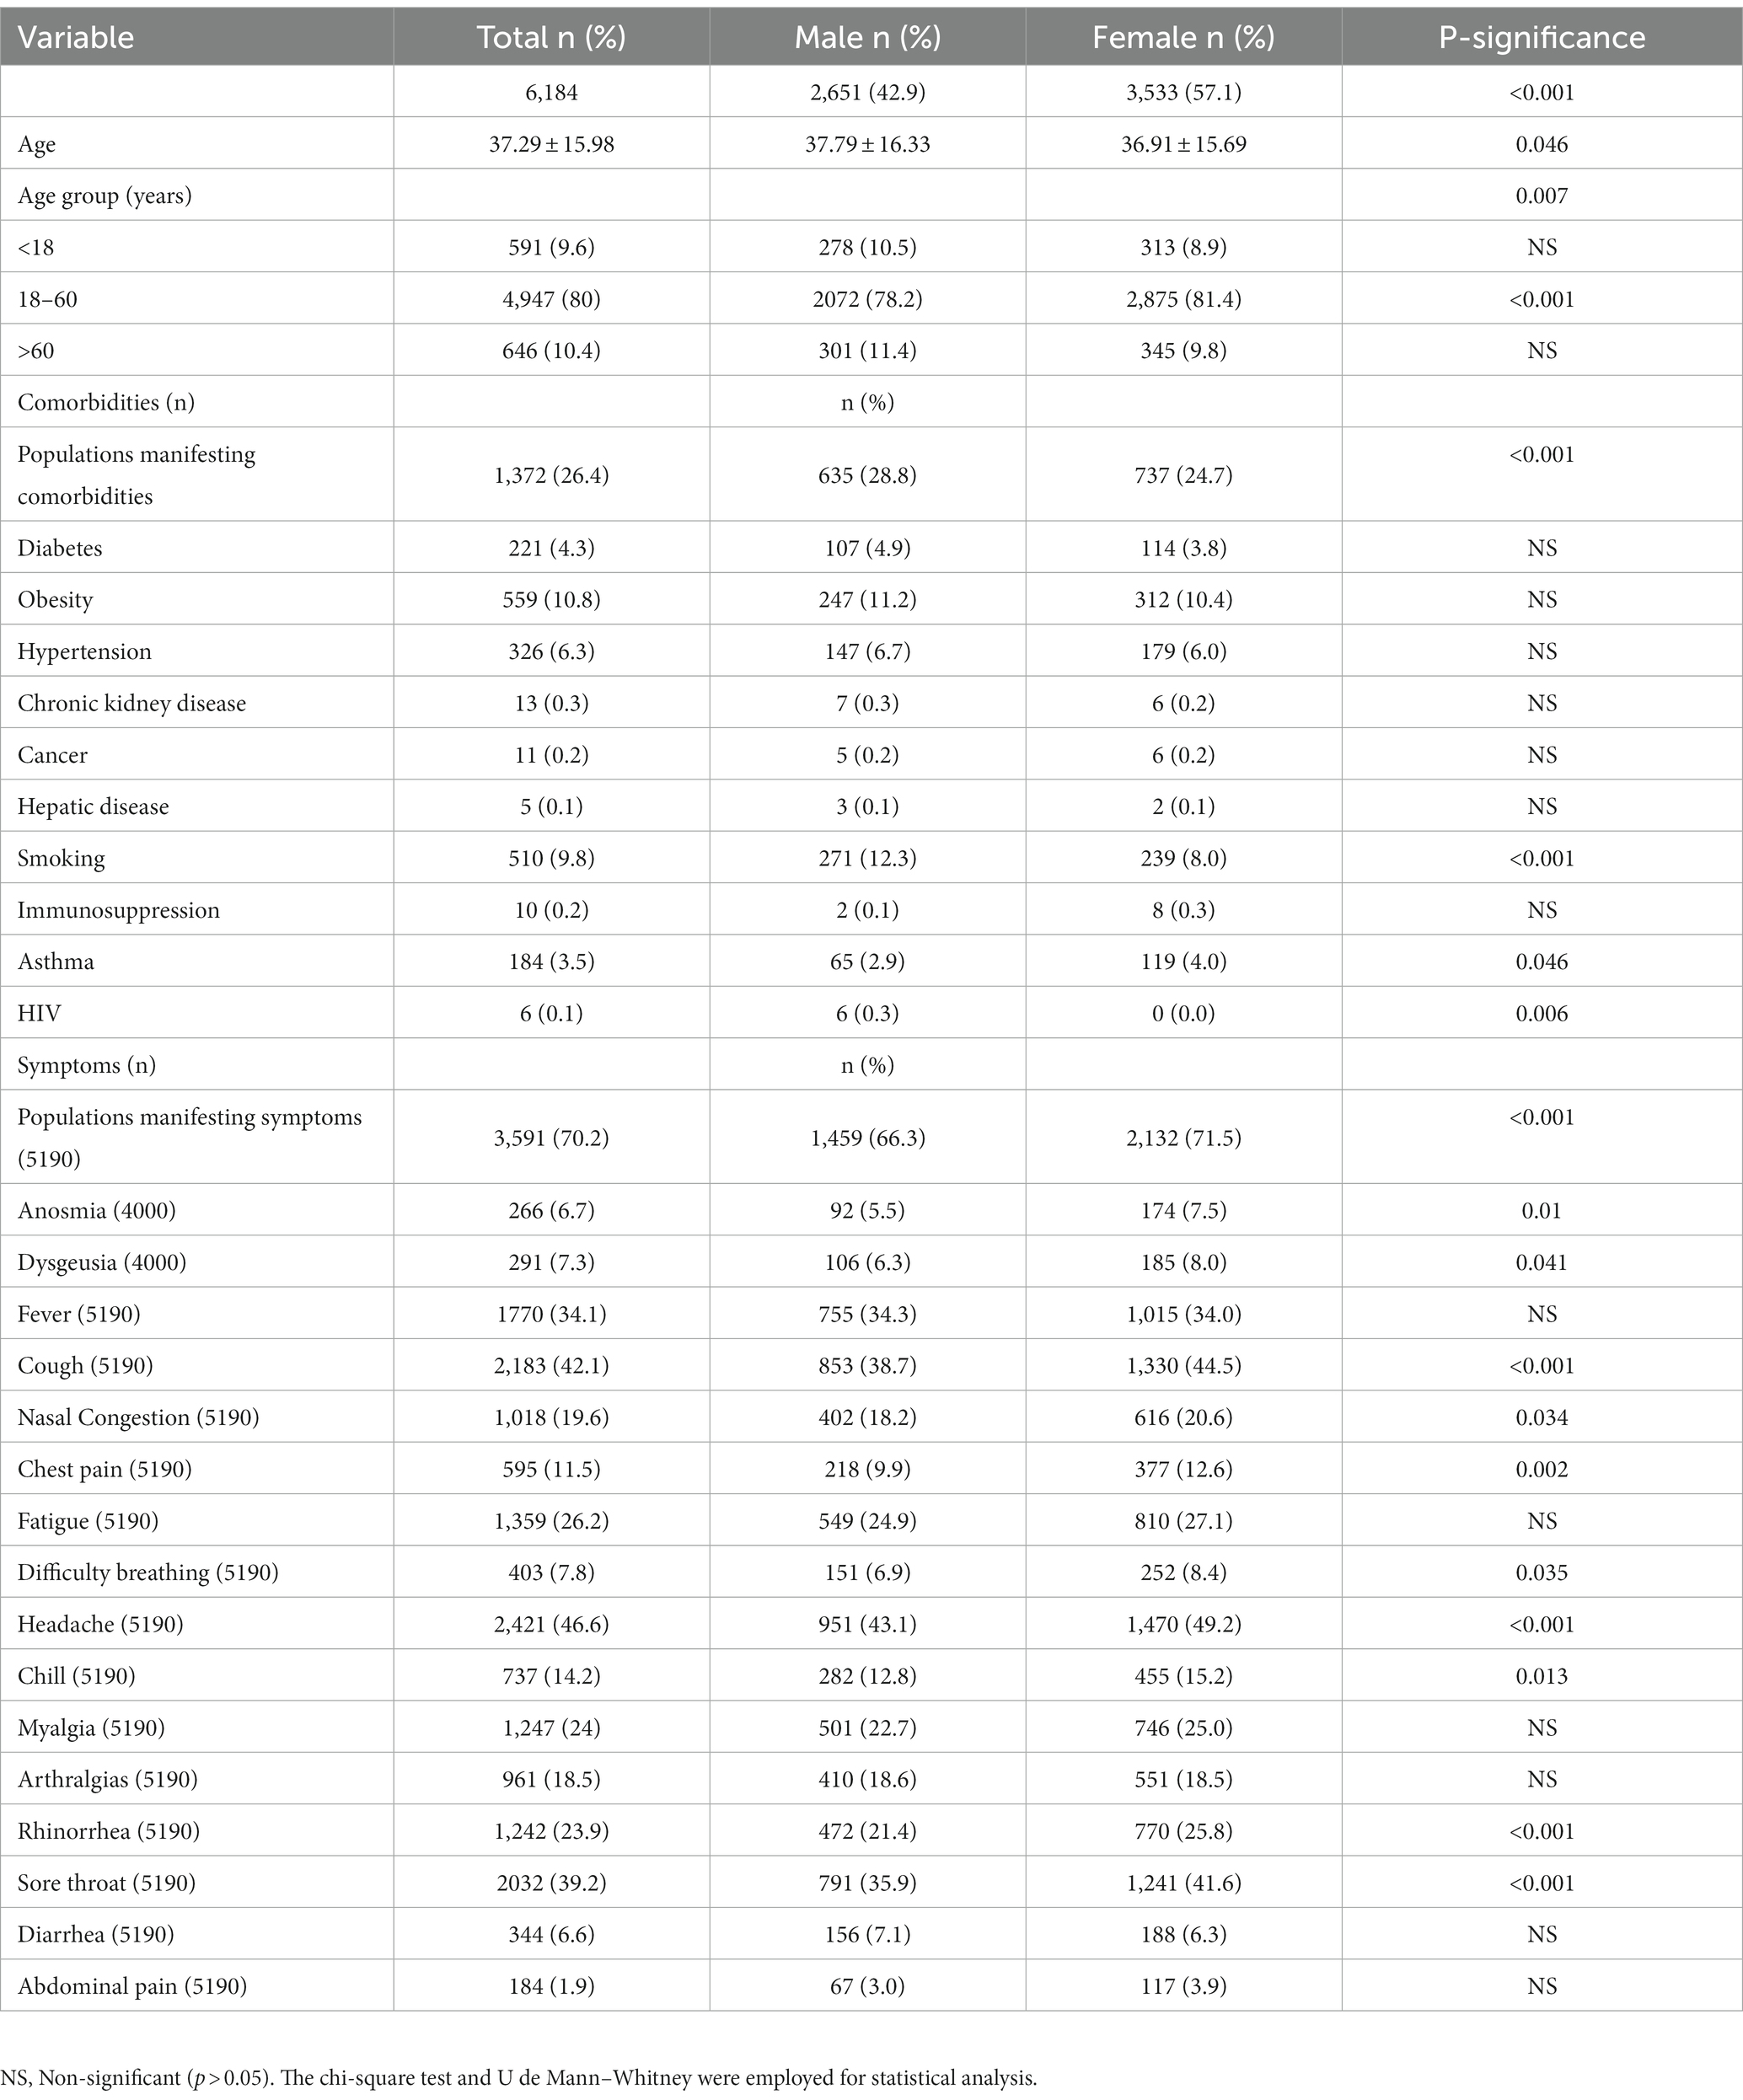
Table 1. Clinical and demographic information of the included population.
From the analyzed samples, mono-infections were represented by 99.58% (n = 6,158), while the rest, 0.42% (n = 26), were coinfections (Figure 1A). SARS-CoV-2 was the most prevalent viral agent found as a mono-infection, with 5,703 individuals identified and a total of 481 cases of non-SARS-CoV-2 respiratory virus, representing 7.78% (Figure 1B). From this last, 479 participants were infected with influenza (477 corresponded to lineage A, from which 263 cases, 54.9%, were subsequently identified as H3N2 lineage), two of Influenza B (from the Victoria lineage), two human coronaviruses, five adenoviruses, one Bocavirus, three rhinoviruses, one Syncytial virus, and one Enterovirus (Figure 1B). The main coinfection observed was SARS-CoV-2 and Influenza A virus, detected in 13 samples. Besides SARS-CoV-2 and Influenza virus, HKU was the only one identified as a mono-infection. It is important to point out that influenza was present in most of the coinfection states. Likewise, coinfection cases involving SARS-CoV-2, Rhinovirus, and Enterovirus were identified (Figure 1C).
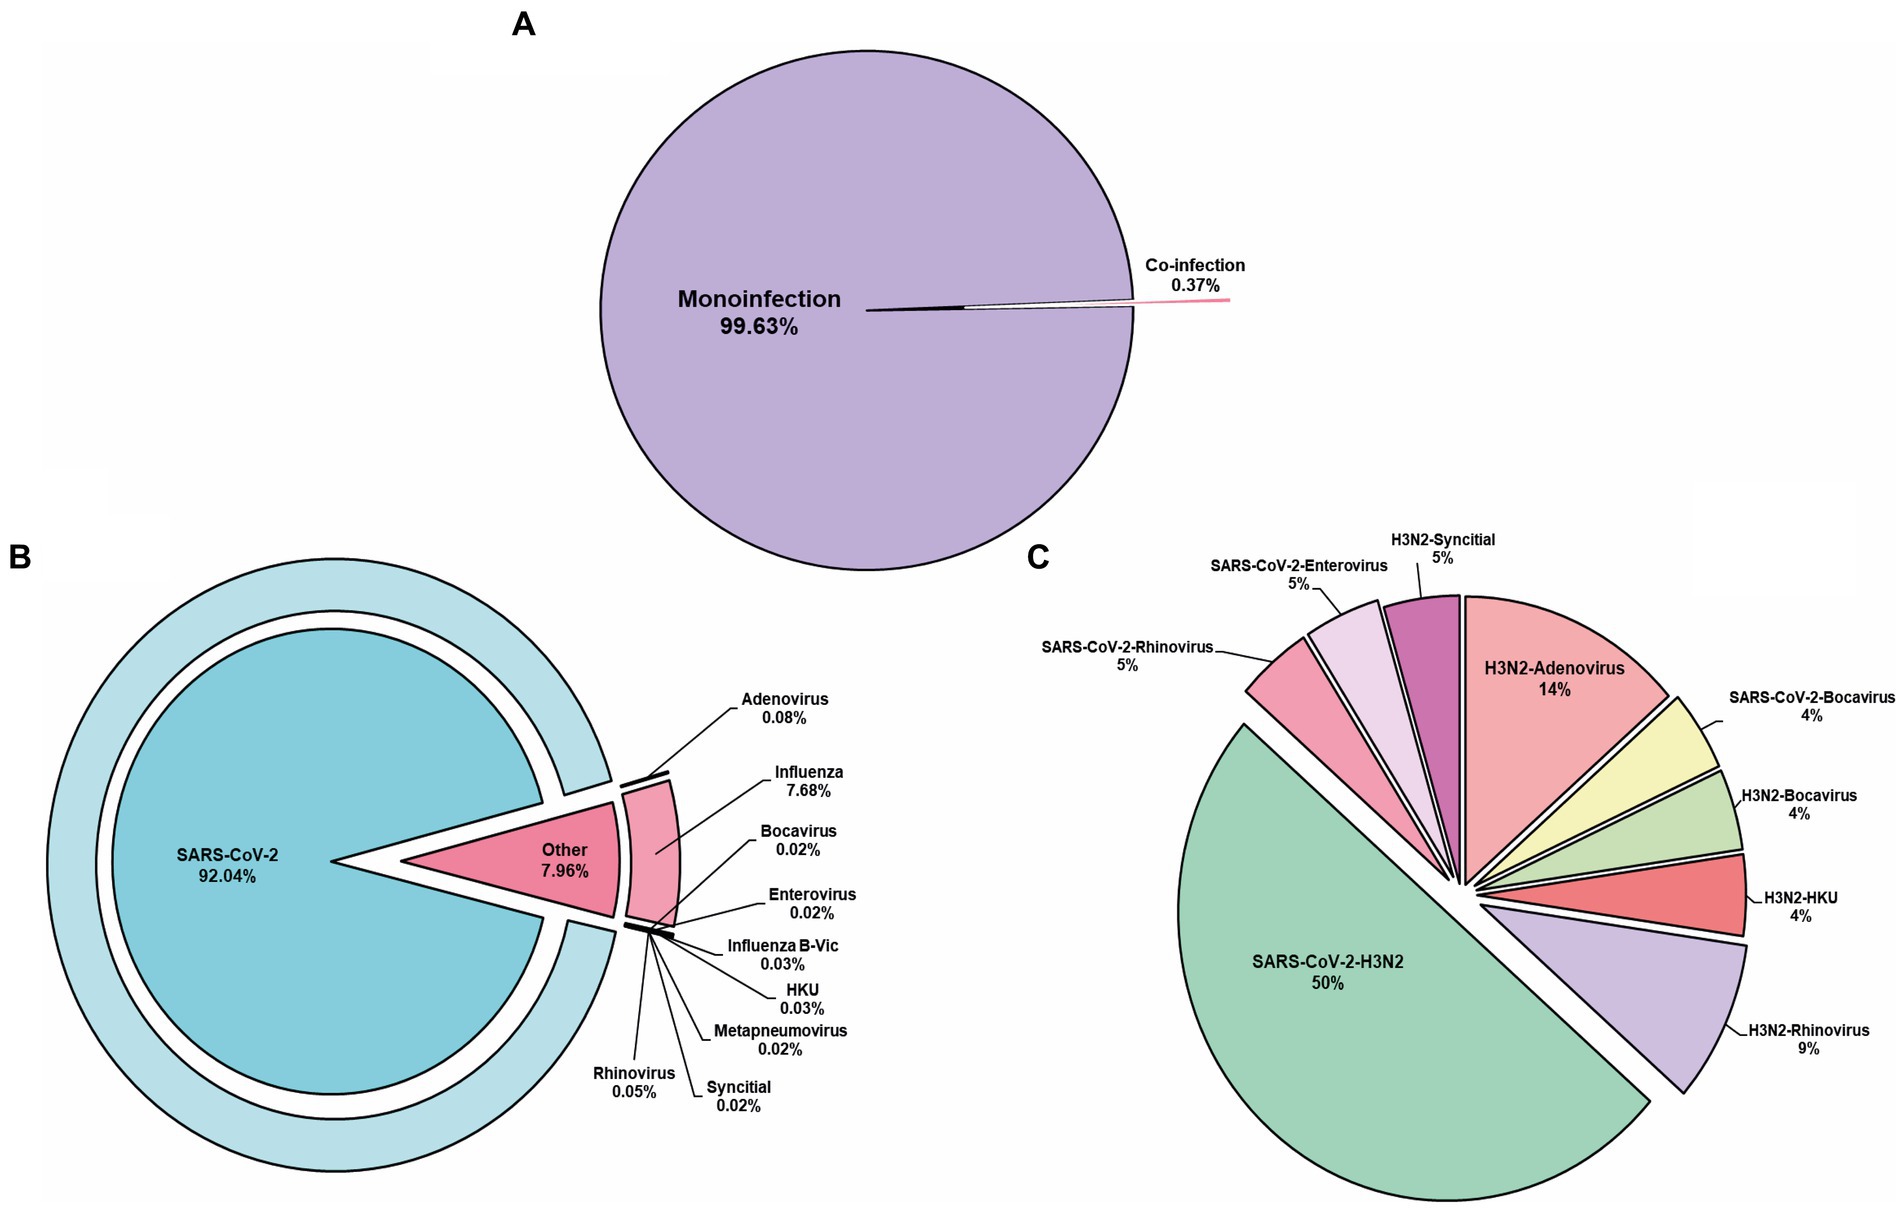
Figure 1. Respiratory viruses determined. (A) Mono-infection represents the major cause of disease found in our population. (B) From the mono-infection, SARS-CoV-2 was the prevalent virus identified. (C) Represents the co-infection identified. HKU, Human coronavirus.
According to the local public health institute database, no respiratory viruses were detected in West Mexico during the pandemic lockdown in 2020. Similarly, our epidemiological surveillance system has not detected the circulation of influenza in the region; nonetheless, influenza cases were reported at the end of 2021 (8). As so, we focused on evaluating if the reappearance of this virus was associated with the mobility change in Jalisco (Mexico) due to the removal of lockdown restrictions. The analysis showed that since December 2021, a re-emergence of Influenza infection cases was observed, in parallel with the trend of increased mobility observed at the end of October 2021 (Figure 2). The maximum peak of detected cases of respiratory viruses was registered during the fourth SARS-CoV-2 wave caused by the Omicron variant in January 2022, corresponding to the second epidemiological week. Additionally, we used the Kendall-tau correlation to quantify the relationship between the Influenza cases and the mobility data; mobility showed a positive correlation with infection cases of 0.214 (p < 0.001). No data further than October 2022 was retrieved due to the end of the aforementioned Google project.
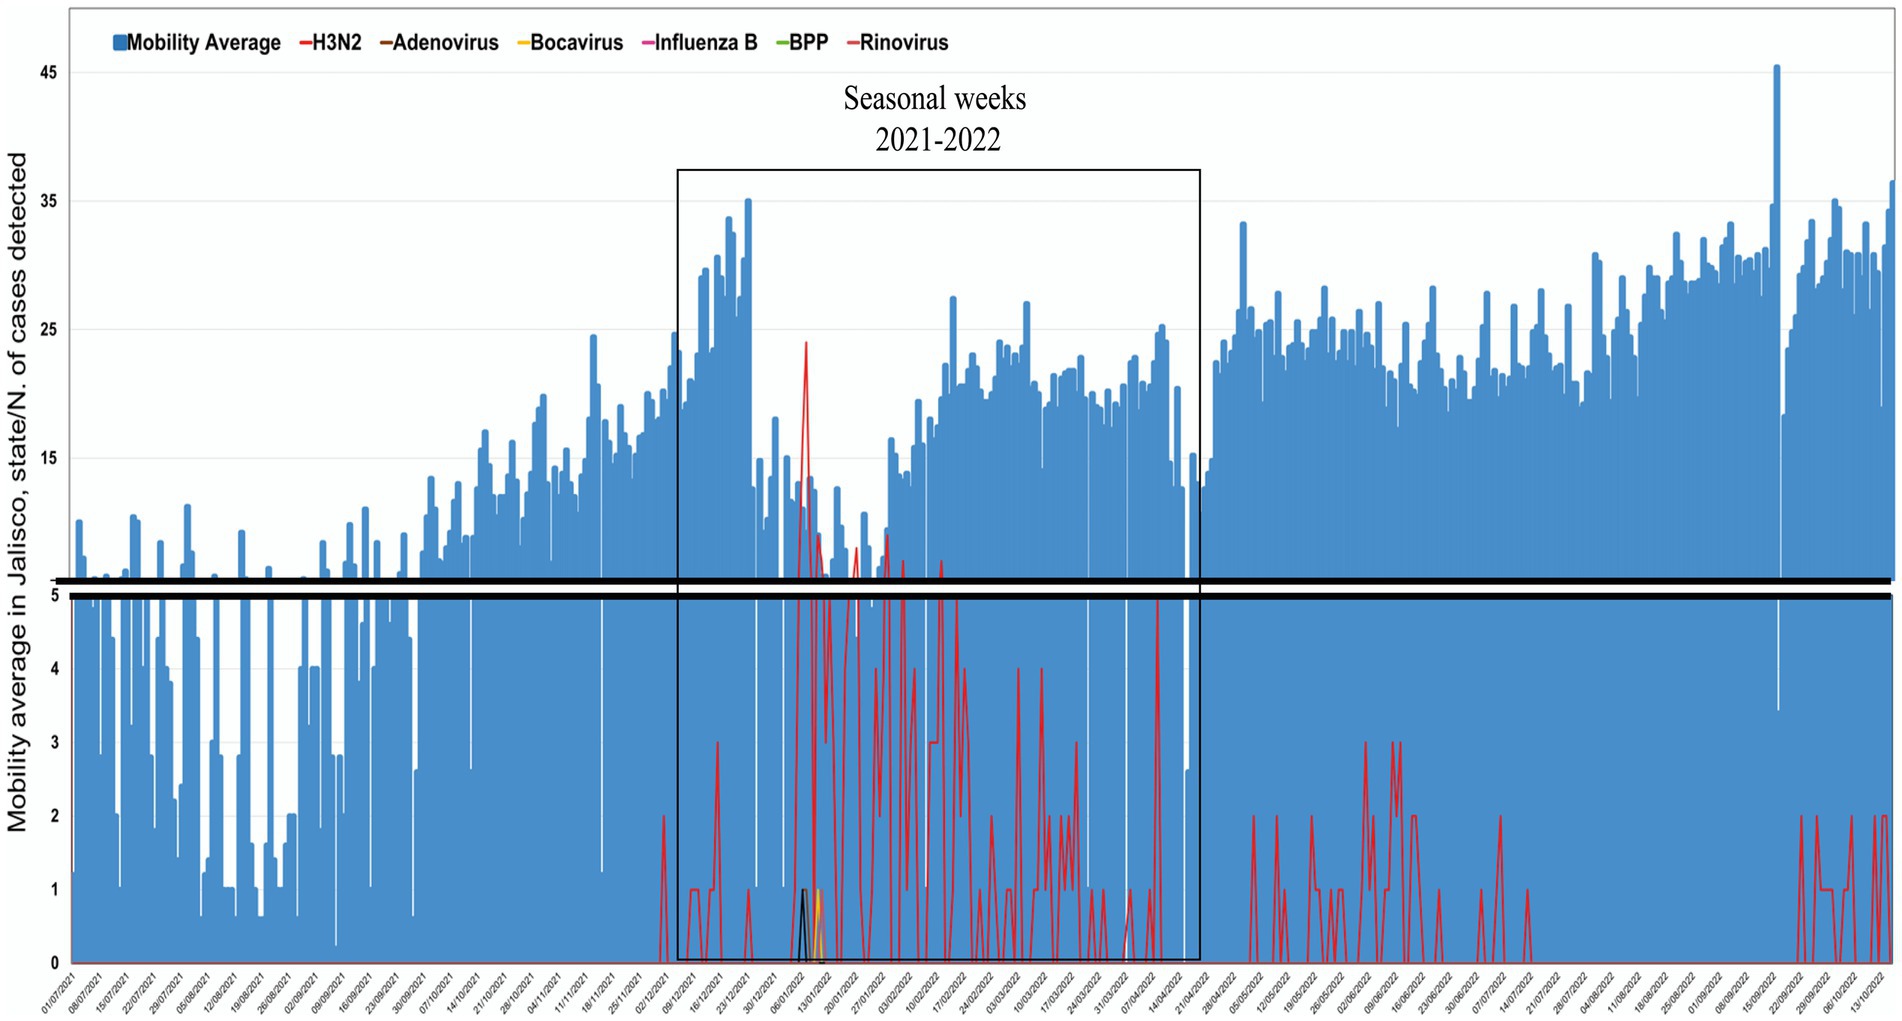
Figure 2. Impact of social mobility on viral respiratory detection. An increase in social mobility was observed in the second half of 2021, which correlates with the new viral respiratory detection.
Illness produced by respiratory viruses presents a similar clinical behavior that can hardly be differentiated without a molecular diagnosis. In this regard, we recovered information such as symptoms and comorbidities (n = 5,841; missing clinical data of n = 343). Briefly, 3,591 individuals (69.3%) reported any symptoms; the female population exhibited a statistically significant increase compared to males (female = 59.4% vs. males = 40.6%; <0.001), with the highest proportion of people reporting 4–6 symptoms (n = 1,654; 46.06%). The people infected with the Influenza virus were prone to manifest illness-like symptoms at 90.37%; while Bocavirus, Human Coronavirus, and Rhinovirus had 100%, respectively; however, the information from Bocavirus, Human Coronavirus, and Rhinovirus should be interpreted cautiously since only a few cases were detected and mainly as a coinfection. In this sense, Influenza stands as an infection that causes an increased severity. On the other hand, 60.9% of subjects with SARS-CoV-2 presented symptoms (Figure 3A). Headaches (n = 2,421; 46.6%), cough (n = 2,183; 42.1%), sore throat (n = 2,032; 39.2%), and fever (n = 1,770; 34.1%) were the most frequent symptoms reported, independently of the viral infection.
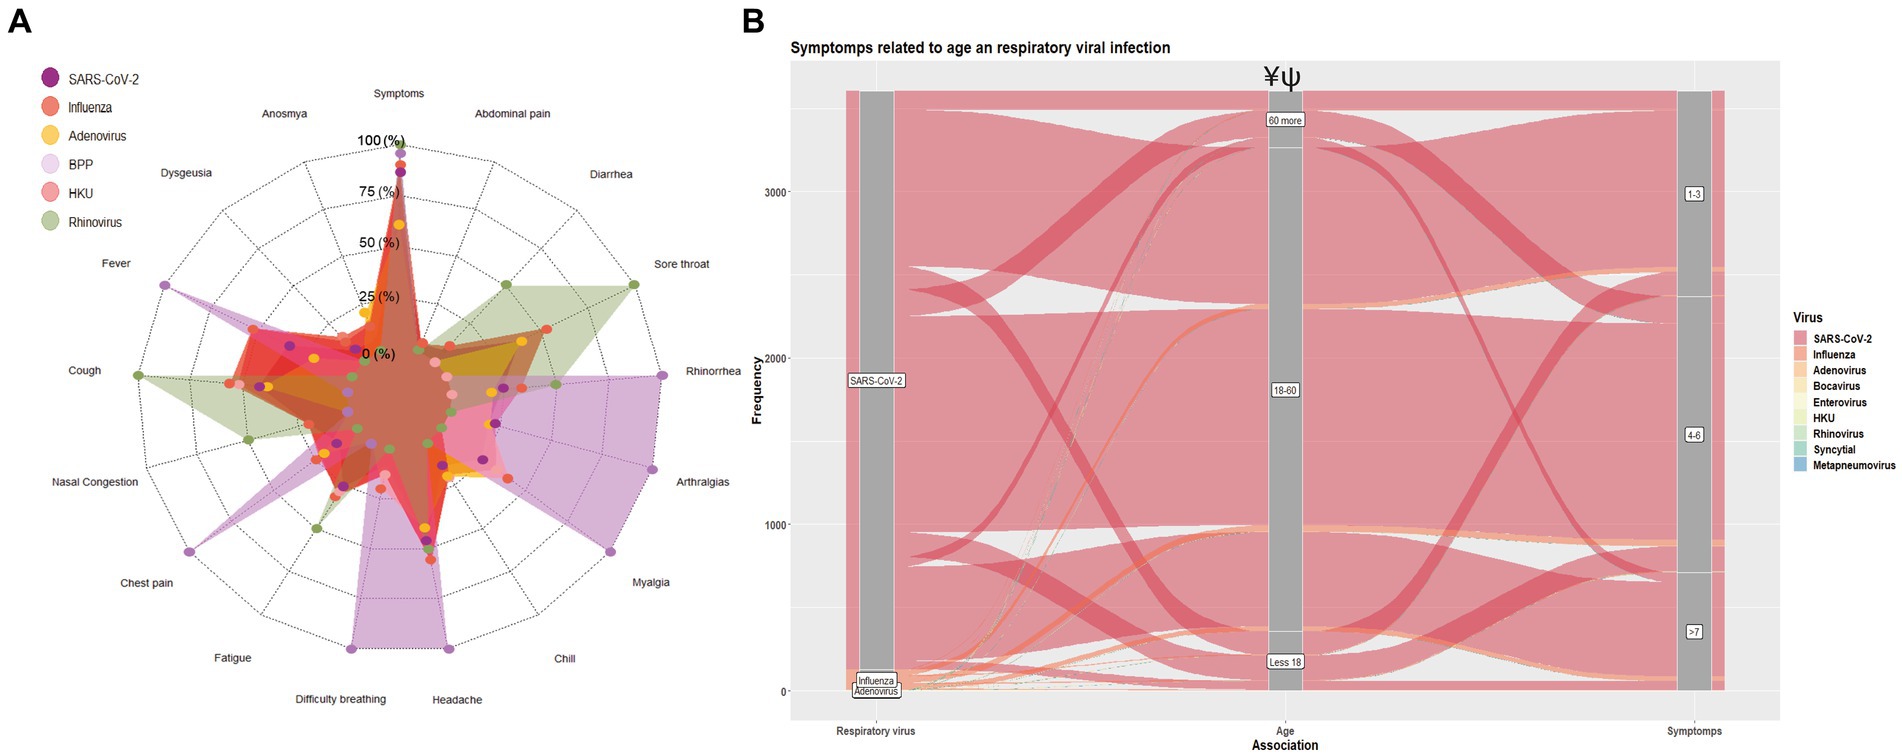
Figure 3. Impact of respiratory virus infection on the clinical presentation. (A) Prevalence of symptoms description according to the viral infection. (B) Sankey plot showing the distribution of the number of symptoms (0, 1–3, 4–6, and > 7) according to the age group and viral infection. Significant differences between age groups ¥: Influenza vs. SARS-CoV-2; ψ: Influenza/SARS-CoV-2 vs. Influenza. The chi-square test was used to compare proportions, and a value of p <0.05 was considered significant.
Concerning viral infection and the related age (<18, 18–60, and > 60), we grouped the participants according to the number of symptoms reported (1–3, 4–6, and > 7) as is shown in Figure 3B; individuals infected with SARS-CoV-2 or Influenza in the age rank groups from 18 to 40 and 40 to 61 years old presented a significant highest proportion of symptoms (SARS-CoV-2: n = 2,905, 50.8%; 1,733, 30.3%; Influenza: 300, 12.2%, 92, 19.2%, respectively; p < 0.001): these population exhibited mostly 4–6 symptoms. This same age group showed the highest proportion of individuals with more than 7 symptoms (61.23 and 33.84, respectively). People from the 18–60 age group exhibited a higher proportion of symptomatology of different severity (80.6%), see Supplementary Table S1.
Regarding SARS-CoV-2 and Influenza coinfections, 100% (n = 9) manifested symptomatology; yet, when we evaluated this viral infection individually, influenza showed a significant difference (90.37%) compared to SARS-CoV-2 (60.9%; p < 0.001). Once that is re-grouped according to the number of symptoms, those infected with influenza tend to have a higher proportion of severe disease than SARS-CoV-2 since 26.4% of people had >7 symptoms. Notably, those co-infected with SARS-CoV-2 and Influenza were prone to have an augmented disease severity (33.3%; p < 0.001), represented by a higher number of reported symptoms. With respect to sex influence over the disease severity, females showed statistical differences versus males in symptomatology reported (females 59.4% vs. males 40.6%; <0.001); these differences were maintained in people with SARS-CoV-2 mono-infection. Regarding the population with Influenza infection, we only observed differences between sex group in those with >7 (females 33.8% vs. males 19.61%); see Table 2.
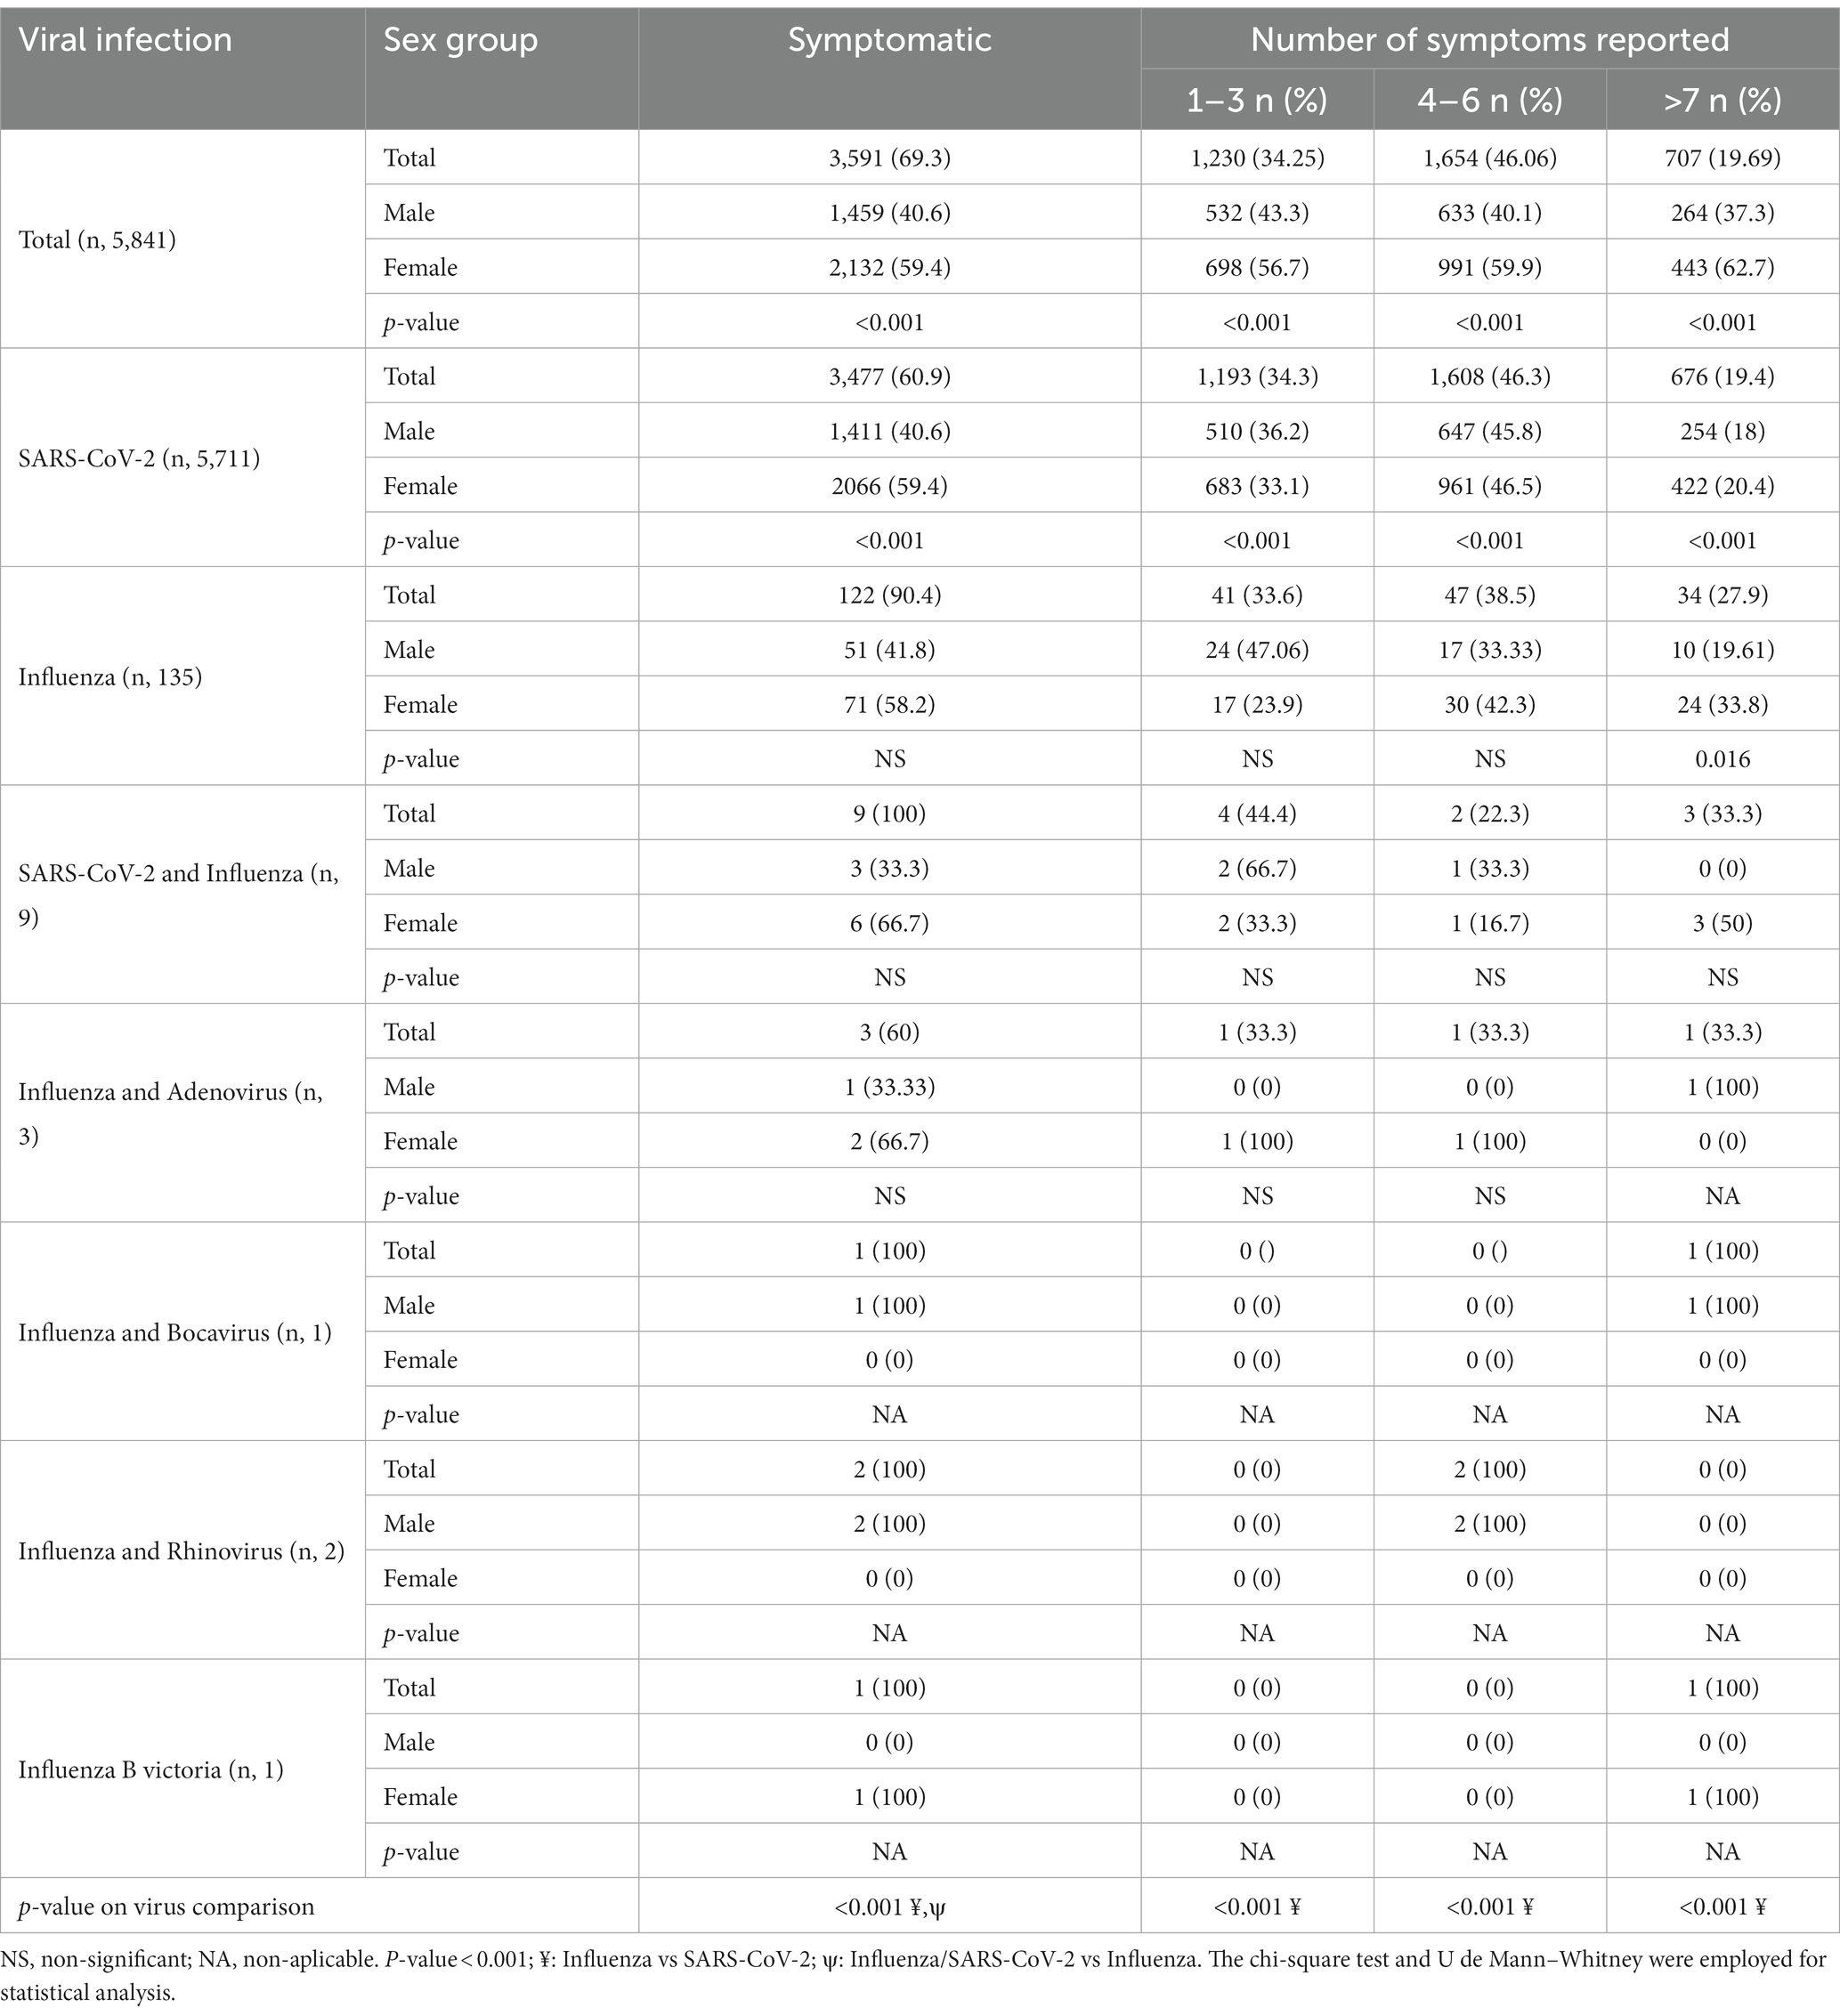
Table 2. The number of symptoms among respiratory viral infections as mono-infection and poli-infection.
In order to evaluate the impact of the comorbidities or unhealthy habits on respiratory viral infection, a univariate analysis was carried out. Firstly, we observed that individuals with rhinovirus have the largest proportion of comorbidities (50%), but since only two subjects responded to the survey, the data could not be representative. Patients monoinfected with Influenza and SARS-CoV-2 have 35 and 26% of previous comorbidities, respectively; the most reported was smoking (18 and 10%, respectively), followed by obesity (12 and 11%, respectively) and hypertension (7 and 6%, respectively; Figure 4A). Remarkably, in the context of Influenza infection, comorbidity represents a risk factor for the infection, with an OR = 1.86; IC 95%: 1.29–2.67, as smoking (OR = 2.62; IC 95%: 1.66–4.13). While these comorbidities are shown as a protective factor for SARS-CoV-2 infection (OR = 0.65; IC 95%: 0.45–0.94); in this sense, no risk factors were detected in SARS-CoV-2 diagnosed people, quite the opposite, cancer, hepatic disease, smoking, immunosuppression, and HIV were shown as a protective factor (Figure 4B). No risk factors were observed for adenovirus, but the number of cases was scarce.

Figure 4. Association among respiratory viruses and comorbidities. (A) Prevalence of comorbidities description according to the viral infection. (B) Forest plot showing the risk for the viral infection according to the comorbidities; smoking showed a contrasting result as a risk factor for influenza and protection for SARS-CoV-2 infection.
A total of 334 respiratory viral sequences were found in Mexico (Table 3); 120 were partial sequences, and 214 were complete genomes; the most representative were influenza and rhinovirus, with a total of 123 sequences each, representing 36.82% of all viral respiratory infections reported from 2009 to 2018, (for influenza, mainly H1N1 were reported with a total of 114 sequences, and 9 were H3N2; while for rhinovirus serotype A was prevalent with 76 sequences, serotype B with 4, and serotype C a total of 43), followed by Bocavirus with a total of 37 sequences, with an 11.07% reported from 2001 to 2016, (all the sequences retrieved were HBoV1), Parainfluenza obtained a total of 27 sequences in the years 1995 to 2019, which represents 8.08% (the most significant were serotype 3 with 21 sequences and serotype 1 with six sequences). For the human syncytial virus, 21 sequences (6.28%) from 1980 to 2020 were recovered, mainly represented by serotype A with a total of 16 sequences and serotype B with 5. The metapneumovirus was less common, having only three genotype A sequences between 1983 and 2018 (0.89%) (Table 3). It is important to remark that for HKU, only one sequence has been sequenced and reported on public databases in Mexico, the OC63; no further sequences have been found. As for adenovirus, no sequences obtained for respiratory infections were reported (Supplementary Figure S1).
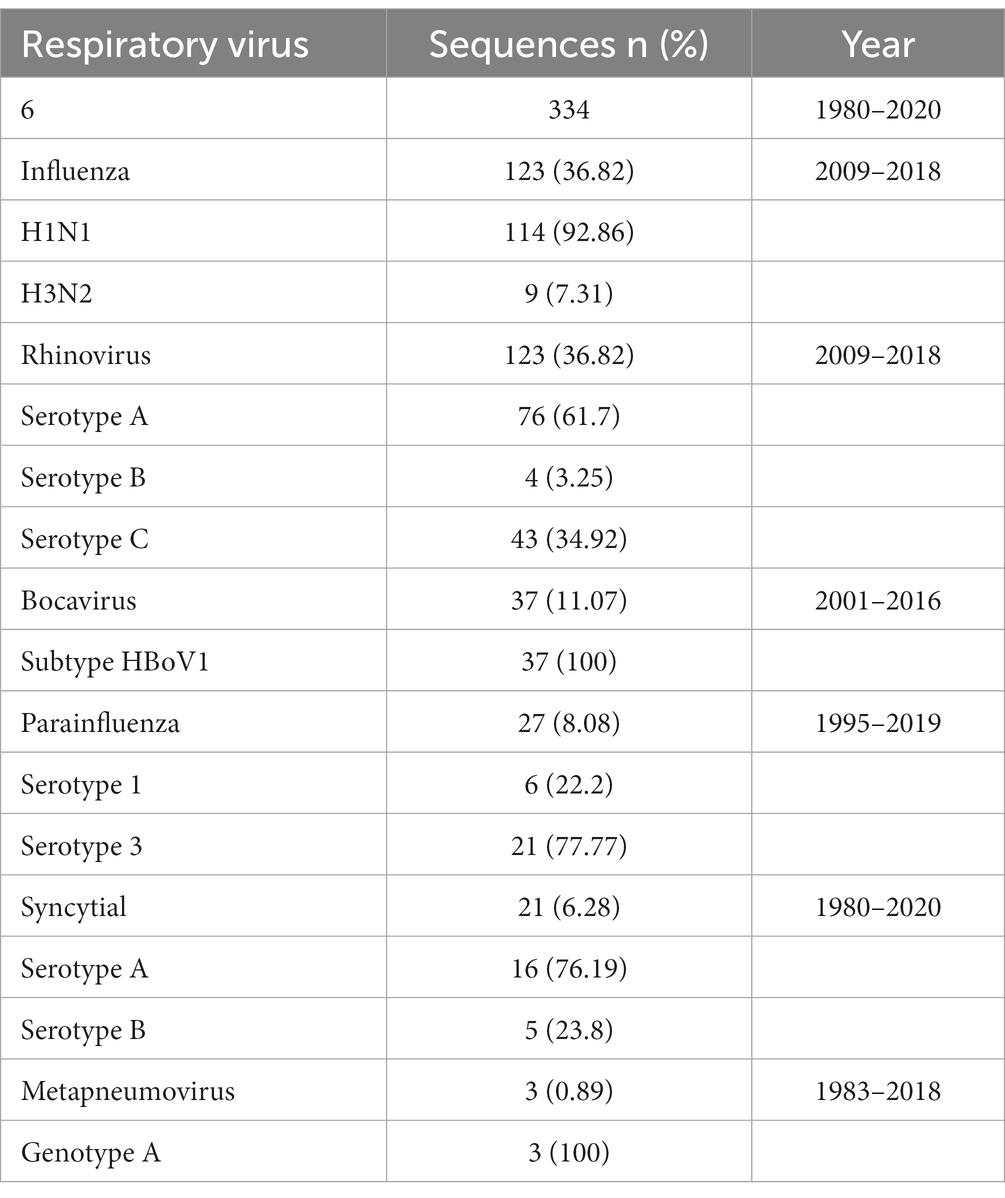
Table 3. Respiratory viruses reported in a public database from Mexico.
In the last year, the world experienced a return to social activity, resulting from the removal of non-pharmacological interventions, which had been reported to have an impact on the reemergence of respiratory viruses since the WHO surveillance data reflected a substantial increase in global viral circulation, after the decrease during COVID-19 pandemic (16). Respiratory infections represent one of the leading causes of morbidity and mortality worldwide (17, 18). In México, the national health authorities reported 10 million respiratory infections in 2021, representing a decrease compared to 2019, which presented with more than 20 million infections (12). However, since the end of 2021 and the beginning of 2022, an increase in the number of cases of infection with non-SARS-CoV-2 respiratory virus was reported (9, 12), but the information is scarce; additionally, most of the efforts on respiratory virus diagnostics are focused solely on influenza (13), which affect the public health since the circulation of respiratory viruses different from Influenza and SARS-CoV-2 goes largely unnoticed. In the present document, we intend to describe the epidemiological and clinical characteristics of the respiratory viruses circulating in Jalisco, Mexico, and how social mobility might be involved in viral recirculation.
On average, the adult population experiences around two or five episodes of respiratory infection annually, with certain age groups, such as children and the older adult, more likely to be affected by more than seven events per year (7) demonstrated by numerous studies that prove pediatric populations are the most susceptible to respiratory infections (13, 19, 20), while the older adult are prone to demise (18). However, our study population was mostly 18 to 40 years old; this is in line with previous studies in the region of Jalisco, where people with SARS-CoV-2 were mainly in this age group (14, 21), probably due to the burden of economic activity placed on young adults. (22).
Throughout history, numerous infectious agents, including bacteria, viruses, and fungi, have been identified as causes of respiratory tract infections, with viral agents being the most prominent. Rhinovirus stands out as responsible for 50% of all respiratory infections worldwide, followed by human Coronaviruses (23). This information is consistent with Fernandes-Matano et al., which found rhinovirus as the most prevalent non-influenza respiratory virus circulating in Mexico, followed by syncytial and metapneumovirus (13). Historically, the influenza virus has been the main etiological agent of respiratory disease; because of this, the national health system has focused efforts on the diagnosis of this virus, ignoring the epidemiological distribution of other viral respiratory different to Influenza or SARS-CoV-2; therefore, the information regarding it needs to be improved. Herein, we reported that, in order, SARS-CoV-2, Influenza (lineage H3N2 and few cases of B Victoria), and adenovirus are the most prevalent, which is consistent with the epidemiological reports from the national health authority (12), with the exception of adenovirus, from which, the information in adults is limited and has been reported mainly in the pediatric population (24). Lately, public health institutions have been reporting a national prevalence of influenza H3N2 and Omicron subvariants (25).
Our data shows that social mobility was associated with the reemergence of the influenza virus at the end of 2021 and the beginning of 2022; additionally, new cases of other respiratory viruses were diagnosed during this period, although no correlation was observed between the incidence of these respiratory viruses and mobility. It has been well established that non-pharmacological interventions impact the number of infections reported; one of the most important measures is social mobility, which previously showed utility for this analysis (26–28). For the present study, no residential mobility data were included since we were looking for the impact of public spaces; Kishore K et al. demonstrated a negative correlation between the epidemiological data and the epidemiological indicators (28). Yet, it is important to remark that the correlation that we observed can be classified as weak; however, since LaDEER provides outpatient care for diagnosing respiratory viruses, the information may not reflect what occurs at the hospital level, where the correlation and number of infections may be even higher. Although mobility information from Google is no longer available, this was a handy tool that might have helped the national health authorities in the decision-making process during the COVID-19 pandemic; moreover, this and other mobility tools might be used to control future outbreaks, especially in Mexico, where monitoring of the epidemiological distribution of respiratory viruses is insufficient.
It has been published that respiratory disease symptoms share similar clinical characteristics with some clinical variations in the presence of certain symptoms (18). In order to differentiate the clinical presentation, a meta-analysis evaluating the clinical outcomes of the principal respiratory etiologies showed that respiratory diseases mainly present fever, sore throat, rhinorrhea, headache, myalgia, and cough; for COVID-19 and the common cold, fever was predominant, while influenza was characterized by myalgia and cold (29). A study published earlier in the COVID-19 pandemic reported that compared to influenza cases, runny nose, dyspnea, sore throat, and rhinorrhea were uncommon in patients with COVID-19 (30). These studies concord with our data since we reported that cough, sore throat, and fever were the most frequent symptoms manifested by our population; however, we observed that headache was the most recurrently described by the studied individuals but uncommon in the meta-analysis.
Recent studies focused on the population with COVID-19 from Jalisco showed that headaches were one of the most recurrent symptoms, which was in line with our findings (14, 21). Considering the coinfection, no statistical differences with mono-infections were found in our study; the information in this regard is inconsistent. A study published by Crotty et al. concluded that multiple viral infections were high-risk factors for patient mortality (31–33). Otherwise, several studies have shown that multiple viral infections do not increase the disease severity (31, 34–37); in fact, some studies have shown an inverse association among pediatric patients coinfected with respiratory viruses compared with sole infection (38, 39). This data is contradictory, but a possible explanation for a reduced risk of the worst clinical outcome could be due to secondary viral interference by the generation of interferon in infected patients because of a first viral entrance (40). It is difficult to solve this problem with our analysis since our study population is not significant. Future studies and meta-analyses that include SARS-CoV-2 and new influenza lineages should be conducted.
Our research shows a high risk of infection with influenza and smoking, contrary to the data from SARS-CoV-2 infected people, in which a low risk for viral infection was found. The unhealthy smoking habit and the risk for influenza infection association are well studied, and the data demonstrates that people who consume tobacco have more infections than those who do not (41). Nevertheless, regarding SARS-CoV-2 and smoking, the information is unclear. A similar result was found in California, where a significantly low-risk level for SARS-CoV-2 positivity was found (42, 43); Kashyap et al. suggest that a possible explanation could be a weak immune response and large and deep deliberate exhalations, which expel large quantities and concentrations of viral particles (44). Other possible mechanisms have been reviewed by Shariq-Usman et al., which include low production of pro-inflammatory cytokines, local vasodilatation, low expression of ACE2, and high production of nitric oxide; however, the authors recommend that this information should be taken with caution since several biases and knowledge gaps were identified (45), and it was demonstrated that smokers have a worst diseases prognosis at the time of infection (46, 47). Furthermore, when the data was evaluated according to the existence of any comorbidity, statistical analysis showed that people have lower odds of infection with SARS-CoV-2; this should be interpreted carefully since our data is from a local population, of which 80% present a comorbidity (48), leading to a bias in the calculation.
One of the principal limitations of this study is the lack of consideration for vaccination status against SARS-CoV-2 or other viruses. This is noteworthy because previous vaccination has been demonstrated to impact infection rates with various respiratory viruses, particularly the influence of the Influenza vaccine on SARS-CoV-2 infection. It’s crucial to acknowledge that there might be a statistical bias due to the small population size associated with viruses other than Influenza and SARS-CoV-2. Furthermore, this study provides data at the local level, and it’s essential to recognize that analyzing information at the local level can influence epidemiological statistics. Therefore, caution is advised when extrapolating these findings to estimate data at the state or national level. Lastly, it’s important to highlight that the diagnostic evaluation for respiratory viruses, aside from SARS-CoV-2 and Influenza, was limited. Consequently, the epidemiological burden information presented in this study may be underrepresented.
In conclusion, we present evidence regarding the social activation and the endemic respiratory virus reemergence as well the description of their prevalence in Jalisco, Mexico, which may lay the groundwork for follow-up in future studies that provide information in the establishment of prevention measures for epidemiological control. Nevertheless, many unanswered questions remain regarding the impact of reduced antigenic exposure to viral agents on the severity of respiratory infections in the coming years and its implications for rearranging the genotypic distribution of various respiratory viruses in the post-pandemic period.
The raw data supporting the conclusions of this article will be made available by the authors, without undue reservation.
The studies involving humans were approved by Comité de ética en Investigación, CUCS, Universidad de Guadalajara (registry number CONBIOÉTICA-14-CEI-002-20191003; protocol code: CI-04821). The studies were conducted in accordance with the local legislation and institutional requirements. The human samples used in this study were acquired from tacit consent through a privacy notice in the diagnosis results. This notice informed how patients could object to the processing of their data. Written informed consent for participation was not required from the participants or the participants' legal guardians/next of kin in accordance with the national legislation and institutional requirements.
IP-U: Data curation, Methodology, Writing – original draft. NV: Funding acquisition, Project administration, Writing – review & editing. JM-V: Funding acquisition, Project administration, Writing – review & editing. MP-R: Methodology, Validation, Writing – review & editing. AC-A: Methodology, Validation, Writing – review & editing. RS-S: Methodology, Supervision, Writing – review & editing. AV-L: Methodology, Validation, Writing – review & editing. OG-G: Methodology, Validation, Writing – review & editing. JZ-M: Formal analysis, Writing – review & editing. MR-S: Methodology, Validation, Writing – review & editing. OV-S: Conceptualization, Project administration, Supervision, Writing – review & editing. MG-C: Conceptualization, Project administration, Supervision, Writing – review & editing.
The author(s) declare financial support was received for the research, authorship, and/or publication of this article. This study was financially supported by the Universidad de Guadalajara (project number 260998).
We appreciate all technical support given by the staff of Laboratorio de Diagnóstico de Enfermedades Emergentes y Reemergentes (LaDEER), Universidad de Guadalajara and Itzel A. Ruvalcaba for editing the manuscript.
The authors declare that the research was conducted in the absence of any commercial or financial relationships that could be construed as a potential conflict of interest.
All claims expressed in this article are solely those of the authors and do not necessarily represent those of their affiliated organizations, or those of the publisher, the editors and the reviewers. Any product that may be evaluated in this article, or claim that may be made by its manufacturer, is not guaranteed or endorsed by the publisher.
The Supplementary material for this article can be found online at: https://www.frontiersin.org/articles/10.3389/fpubh.2023.1292614/full#supplementary-material
1. Respiratory Infections. CDC Yellow Book 2024. (2023). Available at: https://wwwnc.cdc.gov/travel/yellowbook/2024/posttravel-evaluation/respiratory-infections
2. Thomas, M, and Bomar, PA. Upper respiratory tract infection. Florida: Statpearls Publishing (2023).
3. Zhang, W, Wu, Y, Wen, B, Zhang, Y, Wang, Y, Yin, W, et al. Nonpharmaceutical interventions for COVID-19 reduced the incidence of infectious diseases: a controlled interrupted time-series study. Infect Dis Poverty. (2023) 12:15. doi: 10.1186/s40249-023-01066-3
4. Chow, EJ, Uyeki, TM, and Chu, HY. The effects of the COVID-19 pandemic on community respiratory virus activity. Nat Rev Microbiol. (2023) 21:195–210. doi: 10.1038/s41579-022-00807-9
5. Li, Y, Wang, X, Blau, DM, Caballero, MT, Feikin, DR, Gill, CJ, et al. Global, regional, and national disease burden estimates of acute lower respiratory infections due to respiratory syncytial virus in children younger than 5 years in 2019: a systematic analysis. Lancet. (2022) 399:2047–64. doi: 10.1016/S0140-6736(22)00478-0
6. Tang, JW, Lam, TT, Zaraket, H, Lipkin, WI, Drews, SJ, Hatchette, TF, et al. Global epidemiology of non-influenza RNA respiratory viruses: data gaps and a growing need for surveillance. Lancet Infect Dis. (2017) 17:e320–6. doi: 10.1016/S1473-3099(17)30238-4
7. Lai, YH, Lin, KY, Chang, CH, and Chang, SC. Collateral benefit of non-pharmacological interventions against COVID-19 to prevent community-acquired pneumonia in Jin-Shan, new Taipei, April to December 2020. J Formos Med Assoc. (2021) 120:2195–6. doi: 10.1016/j.jfma.2021.08.004
8. Comunicación Social Del Gobierno Del Estado De Jalisco. (2023). Se reportan en Jalisco los primeros dos casos de influenza estacional Gobierno del Estado de Jalisco. Available at: https://www.jalisco.gob.mx/es/prensa/noticias/136552
9. Principi, N, Autore, G, Ramundo, G, and Esposito, S. Epidemiology of Respiratory Infections during the COVID-19 pandemic. Viruses. (2023) 15:1160. doi: 10.3390/v15051160
10. Zhu, L, Luo, T, Yuan, Y, Yang, S, Niu, C, Gong, T, et al. Epidemiological characteristics of respiratory viruses in hospitalized children during the COVID-19 pandemic in southwestern China. Front Cell Infect Microbiol. (2023) 13:1142199. doi: 10.3389/fcimb.2023.1142199
11. Epidemiological Alert. (2023). Influenza, respiratory syncytial virus and SARS-CoV-2. Available at: https://www.paho.org/en/documents/epidemiological-alert-influenza-respiratory-syncytial-virus-and-sars-cov-2-6-june-2023
12. Dirección General de Epidemiología. (2023). Dirección General de Epidemiología Anuario de Morbilidad 1984 -2022. Available on: https://epidemiologia.salud.gob.mx/anuario/html/index.html
13. Fernandes-Matano, L, Monroy-Muñoz, IE, Angeles-Martínez, J, Sarquiz-Martinez, B, Palomec-Nava, ID, Pardavé-Alejandre, HD, et al. Prevalence of non-influenza respiratory viruses in acute respiratory infection cases in Mexico. PLoS One. (2017) 12:e0176298. doi: 10.1371/journal.pone.0176298
14. Peña Rodríguez, M, Hernández Bello, J, Vega Magaña, N, Viera Segura, O, García Chagollán, M, Ceja Gálvez, HR, et al. Prevalence of symptoms, comorbidities, and reinfections in individuals infected with wild-type SARS-CoV-2, Delta, or omicron variants: a comparative study in western Mexico. Front Public Health. (2023) 11:1149795. doi: 10.3389/fpubh.2023.1149795
15. COVID-19 Community Mobility Report. (2023). COVID-19 community mobility report. Available at: https://www.google.com/covid19/mobility?hl=es
16. Huang, QS, Wood, T, Jelley, L, Jennings, T, Jefferies, S, Daniells, K, et al. Impact of the COVID-19 nonpharmaceutical interventions on influenza and other respiratory viral infections in New Zealand. Nat Commun. (2021) 12:1001. doi: 10.1038/s41467-021-21157-9
17. GBD 2016 Lower Respiratory Infections Collaborators. Estimates of the global, regional, and national morbidity, mortality, and aetiologies of lower respiratory infections in 195 countries, 1990-2016: a systematic analysis for the global burden of disease study 2016. Lancet Infect Dis. (2018) 18:1191–210. doi: 10.1016/S1473-3099(18)30310-4
18. Respiratory infections. (2023). Deaths by sex and age group for a selected country or area and year. Available at: https://platform.who.int/mortality/themes/theme-details/topics/topic-details/MDB/respiratory-infections
19. Agca, H, Akalin, H, Saglik, I, Hacimustafaoglu, M, Celebi, S, and Ener, B. Changing epidemiology of influenza and other respiratory viruses in the first year of COVID-19 pandemic. J Infect Public Health. (2021) 14:1186–90. doi: 10.1016/j.jiph.2021.08.004
20. Huang, XB, Yuan, L, Ye, CX, Zhu, X, Lin, CJ, Zhang, DM, et al. Epidemiological characteristics of respiratory viruses in patients with acute respiratory infections during 2009-2018 in southern China. Int J Infect Dis. (2020) 98:21–32. doi: 10.1016/j.ijid.2020.06.051
21. Viera-Segura, O, Vega-Magaña, N, García-Chagollán, M, Peña-Rodríguez, M, Muñoz-Sánchez, G, Carranza-Aranda, AS, et al. A comprehensive descriptive epidemiological and clinical analysis of SARS-CoV-2 in West-Mexico during COVID-19 pandemic 2020. Int J Environ Res Public Health. (2021) 18:10644. doi: 10.3390/ijerph182010644
22. INEGI. (2023). México en cifras Instituto Nacional de Estadística y Geografía. INEGI. Available at: https://www.inegi.org.mx/app/areasgeograficas/
23. Kardos, P, and Malek, FA. Common cold -an umbrella term for acute Infections of nose, throat, Larynx and Bronchi. Pneumologie. (2017) 71:221–6. doi: 10.1055/s-0042-116112
24. Wong-Chew, RM, Farfán-Quiroz, R, Sánchez-Huerta, JL, Nava-Frías, M, Casasola-Flores, J, and Santos-Preciado, JI. Frecuencia de virus respiratorios y características clínicas de niños que acuden a un hospital en México. Mexico: Salud Pública de Mexico (2010).
25. CONACYT. (2023). Vigilancia de variantes del virus SARS-CoV-2. Available at: https://salud.conacyt.mx/coronavirus/variantes/
26. Sadique, MZ, Edmunds, WJ, Smith, RD, Meerding, WJ, de Zwart, O, Brug, J, et al. Precautionary behavior in response to perceived threat of pandemic influenza. Emerg Infect Dis. (2007) 13:1307–13. doi: 10.3201/eid1309.070372
27. Saha, J, Barman, B, and Chouhan, P. Lockdown for COVID-19 and its impact on community mobility in India: an analysis of the COVID-19 community mobility reports, 2020. Child Youth Serv Rev. (2020) 116:105160. doi: 10.1016/j.childyouth.2020.105160
28. Kishore, K, Jaswal, V, Verma, M, and Koushal, V. Exploring the utility of Google mobility data during the COVID-19 pandemic in India: digital epidemiological analysis. JMIR Public Health Surveill. (2021) 7:e29957. doi: 10.2196/29957
29. Czubak, J, Stolarczyk, K, Orzeł, A, Frączek, M, and Zatoński, T. Comparison of the clinical differences between COVID-19, SARS, influenza, and the common cold: a systematic literature review. Adv Clin Exp Med. (2021) 30:109–14. doi: 10.17219/acem/129573
30. Pormohammad, A, Ghorbani, S, Khatami, A, Razizadeh, MH, Alborzi, E, Zarei, M, et al. Comparison of influenza type a and B with COVID-19: a global systematic review and meta-analysis on clinical, laboratory and radiographic findings. Rev Med Virol. (2021) 31:e2179. doi: 10.1002/rmv.2179
31. Crotty, MP, Meyers, S, Hampton, N, Bledsoe, S, Ritchie, DJ, Buller, RS, et al. Epidemiology, co-Infections, and outcomes of viral pneumonia in adults: an observational cohort study. Medicine. (2015) 94:e2332. doi: 10.1097/MD.0000000000002332
32. Harada, Y, Kinoshita, F, Yoshida, LM, Minh, LN, Suzuki, M, Morimoto, K, et al. Does respiratory virus coinfection increases the clinical severity of acute respiratory infection among children infected with respiratory syncytial virus? Pediatr Infect Dis J. (2013) 32:441–5. doi: 10.1097/INF.0b013e31828ba08c
33. Tran, QL, Benitez, G, Shehadeh, F, Kaczynski, M, and Mylonakis, E. Clinical outcomes associated with SARS-CoV-2 co-infection with rhinovirus and adenovirus in adults-a retrospective matched cohort study. Int J Environ Res Public Health. (2022) 20:646. doi: 10.3390/ijerph20010646
34. Li, Y, Pillai, P, Miyake, F, and Nair, H. The role of viral coinfections in the severity of acute respiratory infections among children infected with respiratory syncytial virus (RSV): a systematic review and meta-analysis. J Glob Health. (2020) 10:010426. doi: 10.7189/jogh.10.010426
35. Asner, SA, Rose, W, Petrich, A, Richardson, S, and Tran, DJ. Is virus coinfection a predictor of severity in children with viral respiratory infections? Clin Microbiol Infect. (2015) 21:264.e1–6. doi: 10.1016/j.cmi.2014.08.024
36. Lim, FJ, de Klerk, N, Blyth, CC, Fathima, P, and Moore, HC. Systematic review and meta-analysis of respiratory viral coinfections in children. Respirology. (2016) 21:648–55. doi: 10.1111/resp.12741
37. Asner, SA, Science, ME, Tran, D, Smieja, M, Merglen, A, and Mertz, D. Clinical disease severity of respiratory viral coinfection versus single viral infection: a systematic review and meta-analysis. PLoS One. (2014) 9:e99392. doi: 10.1371/journal.pone.0099392
38. Martínez-Roig, A, Salvadó, M, Caballero-Rabasco, MA, Sánchez-Buenavida, A, López-Segura, N, and Bonet-Alcaina, M. Viral coinfection in childhood respiratory tract infections. Arch Bronconeumol. (2015) 51:5–9. doi: 10.1016/j.arbres.2014.01.018
39. Canducci, F, Debiaggi, M, Sampaolo, M, Marinozzi, MC, Berrè, S, Terulla, C, et al. Two-year prospective study of single infections and coinfections by respiratory syncytial virus and viruses identified recently in infants with acute respiratory disease. J Med Virol. (2008) 80:716–23. doi: 10.1002/jmv.21108
40. Piret, J, and Boivin, G. Viral interference between Respiratory viruses. Emerg Infect Dis. (2022) 28:273–81. doi: 10.3201/eid2802.211727
41. Lawrence, H, Hunter, A, Murray, R, Lim, WS, and McKeever, T. Cigarette smoking and the occurrence of influenza -systematic review. J Infect. (2019) 79:401–6. doi: 10.1016/j.jinf.2019.08.014
42. Young-Wolff, KC, Slama, N, Alexeeff, SE, Sakoda, LC, Fogelberg, R, Myers, LC, et al. Tobacco smoking and risk of SARS-CoV-2 infection and disease severity among adults in an integrated healthcare system in California. Nicotine Tob Res. (2023) 25:211–20. doi: 10.1093/ntr/ntac090
43. Li, J, Martinez, MC, Frosch, DL, and Matt, GE. Effects of smoking on SARS-CoV-2 positivity: a study of a large health system in northern and Central California. Tob Use Insights. (2022) 15:1179173X2211147. doi: 10.1177/1179173X221114799
44. Kashyap, VK, Dhasmana, A, Massey, A, Kotnala, S, Zafar, N, Jaggi, M, et al. Smoking and COVID-19: adding fuel to the flame. Int J Mol Sci. (2020) 21:6581. doi: 10.3390/ijms21186581
45. Usman, MS, Siddiqi, TJ, Khan, MS, Patel, UK, Shahid, I, Ahmed, J, et al. Is there a smoker’s paradox in COVID-19? BMJ Evid Based Med. (2021) 26:279–84. doi: 10.1136/bmjebm-2020-111492
46. Chen, R, Hui, KPY, Liang, Y, Ng, KC, Nicholls, JM, Ip, MSM, et al. SARS-CoV-2 infection aggravates cigarette smoke-exposed cell damage in primary human airway epithelia. Virol J. (2023) 20:65. doi: 10.1186/s12985-023-02008-z
47. Chavez, J, and Hai, R. Effects of cigarette smoking on influenza virus/host interplay. Pathogens. (2021) 10:1636. doi: 10.3390/pathogens10121636
48. INEGI. (2023). Estadística de Defunciones Registradas de Enero a Junio de 2022 (Preliminar). Available at: https://www.inegi.org.mx/contenidos/saladeprensa/boletines/2023/DR/DR-Ene-jun2022.pdf
Keywords: SARS-CoV-2, respiratory viruses, epidemiological survey, clinical impact, viral coinfections
Citation: Pedroza-Uribe IM, Vega Magaña N, Muñoz-Valle JF, Peña-Rodriguez M, Carranza-Aranda AS, Sánchez-Sánchez R, Venancio-Landeros AA, García-González OP, Zavala-Mejía JJ, Ramos-Solano M, Viera-Segura O and García-Chagollán M (2024) Beyond SARS-CoV-2: epidemiological surveillance of respiratory viruses in Jalisco, Mexico. Front. Public Health. 11:1292614. doi: 10.3389/fpubh.2023.1292614
Edited by:
Jawhar Gharbi, King Faisal University, Saudi ArabiaReviewed by:
Annapina Palmieri, National Institute of Health (ISS), ItalyCopyright © 2024 Pedroza-Uribe, Vega Magaña, Muñoz-Valle, Peña-Rodriguez, Carranza-Aranda, Sánchez-Sánchez, Venancio-Landeros, García-González, Zavala-Mejía, Ramos-Solano, Viera-Segura and García-Chagollán. This is an open-access article distributed under the terms of the Creative Commons Attribution License (CC BY). The use, distribution or reproduction in other forums is permitted, provided the original author(s) and the copyright owner(s) are credited and that the original publication in this journal is cited, in accordance with accepted academic practice. No use, distribution or reproduction is permitted which does not comply with these terms.
*Correspondence: Oliver Viera-Segura, by52aWVyYXNlZ3VyYUBnbWFpbC5jb20=; Mariel García-Chagollán, Y2hhZ29sbGFuQGFjYWRlbWljb3MudWRnLm14
†These authors share senior authorship
Disclaimer: All claims expressed in this article are solely those of the authors and do not necessarily represent those of their affiliated organizations, or those of the publisher, the editors and the reviewers. Any product that may be evaluated in this article or claim that may be made by its manufacturer is not guaranteed or endorsed by the publisher.
Research integrity at Frontiers
Learn more about the work of our research integrity team to safeguard the quality of each article we publish.