 Siwoo Jeong
 Sung Bum Yun3
 Sungchul Mun
- 1Convergence Institute of Human Data Technology, Jeonju University, Jeonju, Republic of Korea
- 2Department of Sports Rehabilitation Medicine, Kyungil University, Gyeongsan, Republic of Korea
- 3Urban Strategy Research Division, Seoul Institute of Technology, Seoul, Republic of Korea
- 4Department of Industrial Engineering, Jeonju University, Jeonju, Republic of Korea
Introduction: The rising prevalence of obesity has become a public health concern, requiring efficient and comprehensive prevention strategies.
Methods: This study innovatively investigated the combined influence of individual and social/environmental factors on obesity within the urban landscape of Seoul, by employing advanced machine learning approaches. We collected ‘Community Health Surveys’ and credit card usage data to represent individual factors. In parallel, we utilized ‘Seoul Open Data’ to encapsulate social/environmental factors contributing to obesity. A Random Forest model was used to predict obesity based on individual factors. The model was further subjected to Shapley Additive Explanations (SHAP) algorithms to determine each factor’s relative importance in obesity prediction. For social/environmental factors, we used the Geographically Weighted Least Absolute Shrinkage and Selection Operator (GWLASSO) to calculate the regression coefficients.
Results: The Random Forest model predicted obesity with an accuracy of >90%. The SHAP revealed diverse influential individual obesity-related factors in each Gu district, although ‘self-awareness of obesity’, ‘weight control experience’, and ‘high blood pressure experience’ were among the top five influential factors across all Gu districts. The GWLASSO indicated variations in regression coefficients between social/environmental factors across different districts.
Conclusion: Our findings provide valuable insights for designing targeted obesity prevention programs that integrate different individual and social/environmental factors within the context of urban design, even within the same city. This study enhances the efficient development and application of explainable machine learning in devising urban health strategies. We recommend that each autonomous district consider these differential influential factors in designing their budget plans to tackle obesity effectively.
1. Introduction
The global prevalence of obesity has seen a significant increase over the past decades, with the World Health Organization reporting that the obese population has tripled since 1975, and exceeded 340 million children and adolescents in 2016 (1). Particularly in South Korea, where up to 40% of the population is affected by obesity (2), there have been substantial economic and individual impacts, stemming from increased healthcare costs and various comorbidities such as cardiovascular risk (3, 4) and diabetes (5). Given this escalating trend and its profound health and economic implications, there is a need for effective strategies to manage and mitigate the escalating obesity epidemic.
Medical and pharmaceutical interventions for obesity have proven effective in curbing its prevalence (6–8). These interventions encompass a range of treatments, from weight loss medications that modulate appetite (9–12) or reduce fat absorption (13–16) to more invasive procedures such as bariatric surgeries (17–20). While they offer substantial benefits, they are not without drawbacks. For instance, weight loss medications can result in adverse effects including gastrointestinal disturbances (21, 22) and cardiovascular risk (10, 23, 24). Moreover, these medical solutions, despite being critical for some patients, predominantly address the symptoms without targeting the fundamental causes of obesity (25–27). This often results in the neglect of underlying societal and behavioral factors. Therefore, there is a demand for alternative, more comprehensive solutions to managing obesity.
Obesity prevention programs aim to address the multifaceted root causes of the condition while minimizing associated side effects. Root causes involve individual factors such as dietary habits, physical activity, genetic predisposition, and lifestyle choices. Concurrently, social/environmental factors including access to healthy food options, availability of recreational facilities, socioeconomic status, and urban planning play crucial roles (28–35). Based on their primary focus, prevention programs for obesity can be broadly classified as individual-based or social/environmental-based categories (36). Whereas individual-based programs focus on nutritional behavior, physical activity, and media consumption (37–43), social/environmental-based programs target factors such as neighborhood socioeconomic status, accessibility to green parks, and public transportation frequency (36, 44). Neither approach is universally effective, as individual-based programs might not reach certain at-risk groups (36), and social/environmental-based interventions could potentially be less effective overall (45). Therefore, it is essential for successful obesity prevention to integrate individual and social factors, exploring their simultaneous influence on obesity.
Machine learning approaches are well-suited for developing obesity-related models due to their ability to handle numerous multidomain influencing factors and identify complex relationships (46–48). However, machine-learning approaches have limitations in determining obesity-related factors. First, it is not interpretable for machine learning models due to its black-box properties. Although machine learning classification models distinguish obesity with high accuracy and reveal obesity risk factors (49–51), the extent to which each variable contributes to obesity is not provided. When developing an obesity prevention program or policy, the most influential factors should be considered to ensure its efficiency and effectiveness. However, traditional machine learning models are not explainable, which prevents the selection of the most influential obesity risk factors. Second, public social/environmental factors are rarely labeled as obesity. Since social/environmental data are usually gathered by using public statistical data or open sources and not by individual surveys, these factors cannot be directly connected to dependent variables such as weight, body mass index (BMI), or obesity. This limitation prevents the development of classification models for social/environmental factors.
To circumvent these limitations, this study used Shapley additive explanations (SHAP), an explainable machine-learning model (52, 53), to determine how obesity risk factors influence obesity. After the implementation of the machine learning classification models, the model can be applied to SHAP, which identifies the contribution of each factor to obesity. Additionally, geographically weighted least absolute shrinkage and selection operator (GWLASSO) was used to reveal how social/environmental factors influenced obesity by considering spatial relationships (54). GWLASSO may improve the reliability of the results by deriving the factors influencing individuals’ activity range, including neighboring cities or districts. The integration of SHAP and GWLASSO in this study provides a comprehensive and spatially nuanced understanding of the multifaceted factors contributing to obesity, enhancing our ability to develop targeted and effective interventions.
Despite the increasing volume of research on obesity and its risk factors worldwide (55–57), a comprehensive understanding of the intricate interplay between individual and social/environmental factors within a specific population or region remains elusive. Bohnert et al. investigated childhood overweight and obesity rates in the United States, emphasizing their persistence into adulthood, as well as associated healthcare costs and health issues (58). They explored how principles from developmental psychopathology, including multilevel modeling, can enhance the understanding of obesity risk examining developmental pathways and complex processes. Their findings offered a novel perspective for more effective intervention and prevention efforts in addressing the obesity epidemic. Zare et al. also delved into the intricate interplay of multiple factors, including income levels, racial and ethnic differences, and employed multiple modeling approaches to understand their relationship with obesity among U.S. adult men (59). By utilizing data spanning from 1999 to 2016, income was categorized, and income inequality was measured through the Gini coefficient. Their findings highlighted a noteworthy association between income and obesity, particularly among Non-Hispanic White and Non-Hispanic Black populations. This underscored the importance of developing race-specific strategies to address income inequality within the context of obesity prevention, while using insights gained from these diverse modeling techniques. Previous studies, however, including those utilizing multilevel modeling in the United States, have investigated the impacts of individual behaviors and neighborhood-level factors on obesity prevalence and offered valuable insights into the multifaceted nature of obesity risk factors. They have also highlighted the interrelation between individual behaviors and neighborhood-level attributes (60–62). However, these studies often did not consider environmental factors such as urban planning or availability of public spaces for physical activity, which are crucial for a comprehensive exploration of obesity risk factors. Moreover, the generalization of these findings to regions distinct in their cultural, social, and urban environments can be problematic due to inherent regional discrepancies. This underscores the importance of research tailored to the distinct characteristics and needs of each specific region.
While there has been a sharp increase in obesity in South Korea, there have been few studies that investigated both individual and other social level factors of obesity within the same region. Considering the individualistic nature of Korean society, where interactions with the neighborhood are minimal, there is a need for integrated research examining both social/environmental and individual factors. Considering the specific societal dynamics of South Korea, a detailed exploration of the interplay between social/environmental and individual factors is essential. To address this, our study utilized advanced machine learning approaches, such as SHAP and GWLASSO, to investigate the factors impacting obesity in Seoul, South Korea, focusing on both individual and social/environmental factors. Therefore, this study aimed to (1) identify the influential factors related to obesity from both individual and social/environmental perspectives for each Gu district of Seoul using machine learning models, including SHAP and GWLASSO, and (2) assessed the relative contributions of these factors to obesity prevalence. The results of this study could provide critical insights for the development of comprehensive and effective obesity prevention strategies and inform urban design decisions that promote healthier living.
2. Methods
Three different public and open datasets were collected from Seoul City and the Korean Ministry of Health and Welfare (MOHW). Three diverse public and open datasets were collated from Seoul City and the MOHW, specifically community health survey data, credit card usage data, and Seoul Open Data. These datasets underwent a preprocessing stage to mitigate the impact of noisy data and outliers and were subsequently categorized at the Gu-administrative district level in Seoul City. For the community health survey data, entries with ‘no response’ were systemically excluded, ensuring the removal of the corresponding individual’s data from analysis. The credit card data, refined and provided by Shinhan Card Company (South Korea), were assessed to be devoid of noise, representing reliable average values for the respective areas. For Seoul City’s open data, any erroneous values were replaced with the overall district average to ensure data integrity and reliability. To derive the individual influential factors leading to obesity in each Gu district, contributing features were selected and applied to a machine learning model (Random Forest model). The trained model was validated using 10-fold cross-validation and interpreted using SHAP, which extracted the values of the contribution of each feature to obesity. Regarding social/environmental factors, GWLASSO was used to determine the coefficient in the regression model between obesity and social/environmental factors (Figure 1). More details on the data collection, feature selection, and processes for determining the best-performing model in the test sets are described in the following subsections.
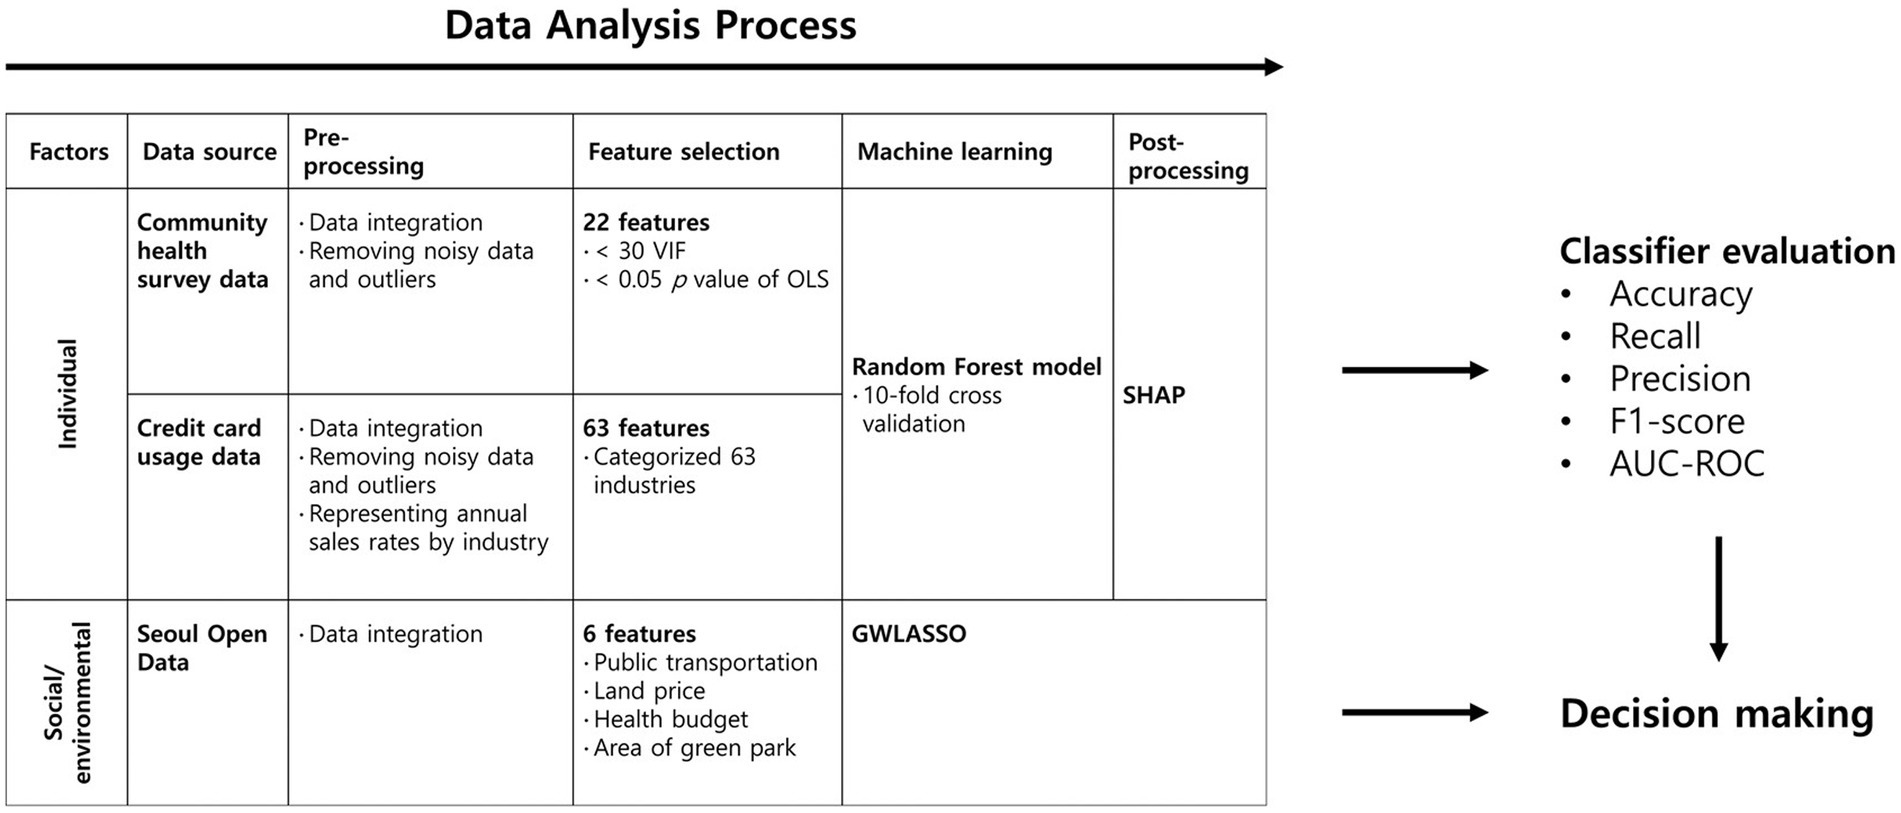
Figure 1. Methodology of predicting obesity risk and deriving the influential factors of obesity.
2.1. Data collection
In the current study, community health survey data, credit card usage data, and Seoul Open Data were used to identify the influential factors leading to obesity. These data were acquired from the MOHW and Seoul City with authorization. The credit card data used in this study were provided by Shinhan Card Company. These data were released for research purposes after undergoing a reprocessing by Shinhan Card Company to ensure confidentiality and compliance with data protection regulations. Before releasing the data, Shinhan Card obtained consent from cardholders by having them check a third-party information provision consent form when issuing the card, which legally authorizes the use of such data for research purposes. Community health survey data and credit card usage data were utilized for individual data, and Seoul Open Data were utilized for social/environmental data (Table 1). We calculated the BMI using the available height and weight data. Based on the World Health Organization’s classification, participants were then categorized into obesity and non-obesity groups using a BMI of 25 as the dividing line. Subsequently, analyzes were conducted incorporating both the obesity and non-obesity groups. Random oversampling was conducted to match the number of obesity and non-obesity data points.
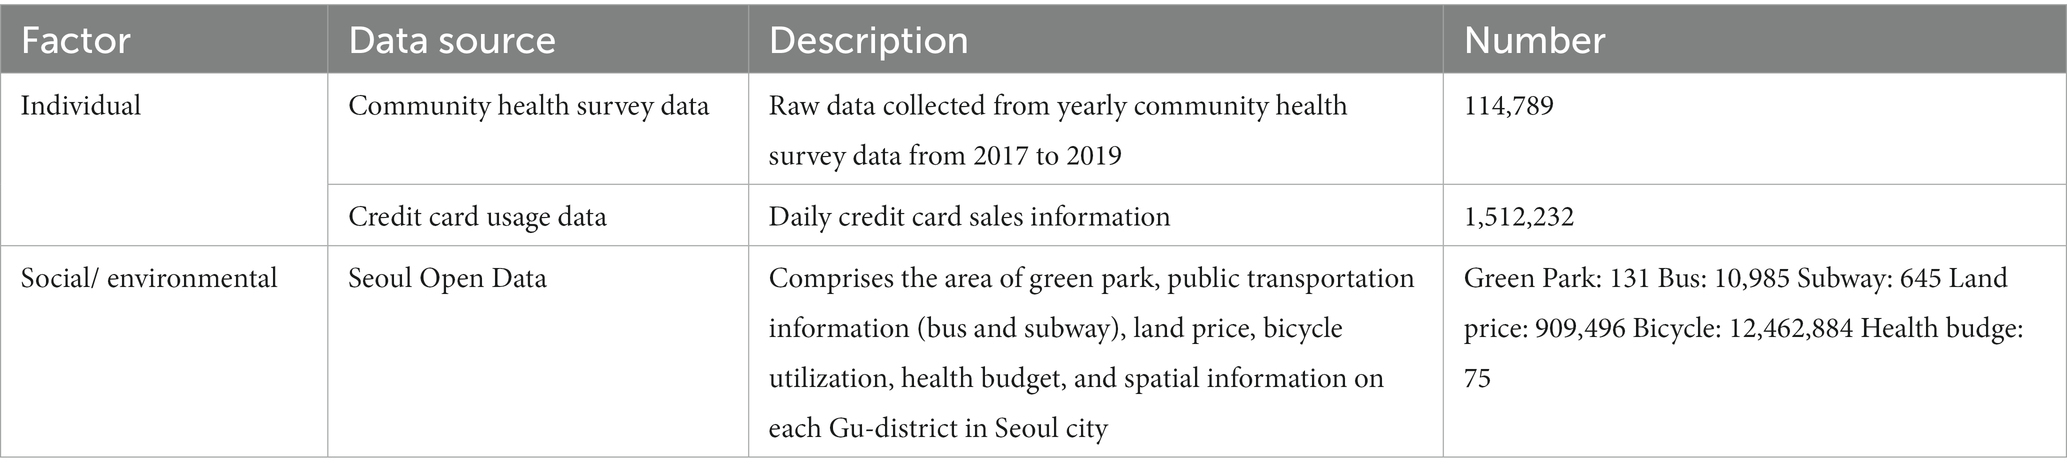
Table 1. Data sets used for model training.
2.1.1. Community health survey data
The target population of the community health survey data was adults aged over 19 years living in South Korea at the time of the survey (16th August, annually). Surveys were divided into household and individual levels and collected from 2017 to 2019. A household survey was conducted to obtain data on household income, type of house, type of household, and basic livelihood security recipient. The health measurement data in this study were obtained from self-reported responses of the participants. Special attention was given to providing clear instructions to participants, enhancing the accuracy and reliability of the collected data. Self-reported data covered a range of factors, including personal measurements (blood pressure, height, and body weight), health-related information (obesity, weight, smoking, drinking, safety awareness, physical utilization, diet, oral health, and mental health), medical screenings (influenza vaccination, health checkups, and cancer screening), morbidities (chronic disease diagnosis experience and management level of major diseases), medical care use (number of visits in a year), accidents (experiences of major accidents), activity restrictions, and quality of life (subjective health level, EQ-5D scores). The study also considered factors related to the use of health institutions, socio-physical environments (duration of residence in urban areas or specific districts, which is critical due to substantial urban-rural disparities in living conditions and lifestyles), personal hygiene, women’s health (pregnancy status), education, and economic activities (occupation, education, marital status) as shown in Table 1. The ‘community health survey data’ used in this study included a broad spectrum of health-related variables. For the purpose of our study, we specifically selected a subset of these variables, mainly those relevant to obesity and its associated factors. The selected survey data for individuals living in Seoul City were categorized into the Gu-administrative district level and the lower level of the city. Categorized data were used along with other datasets.
2.1.2. Credit card usage data
Credit card usage data were used to identify the expenditure patterns of individuals living in each district of Seoul (Table 1). Credit card data included daily average sales information and, to use this data along with other datasets, the spatial unit was changed to that in other datasets. The sales data were aggregated at the Gu-administrative district level and the annual average values were calculated.
2.2. Data processing and analysis
Community health survey data were categorized into individual factors. Raw data were preprocessed to integrate them and eliminate redundant data and outliers. A total of 32 common responses suitable for analyzing obesity-related factors were extracted, excluding sub-questions and questions unrelated to obesity (Table 2; Figure 2). Credit card usage data were categorized into individual factors and converted to the annual sales rate by industry (Table 3). Social/environmental factors were obtained from Seoul Open Data, which was preprocessed. Since each Gu-administrative district had a different area and population size, all data categorized by district were normalized by dividing data by the population of each district, resulting in data per person for each district.
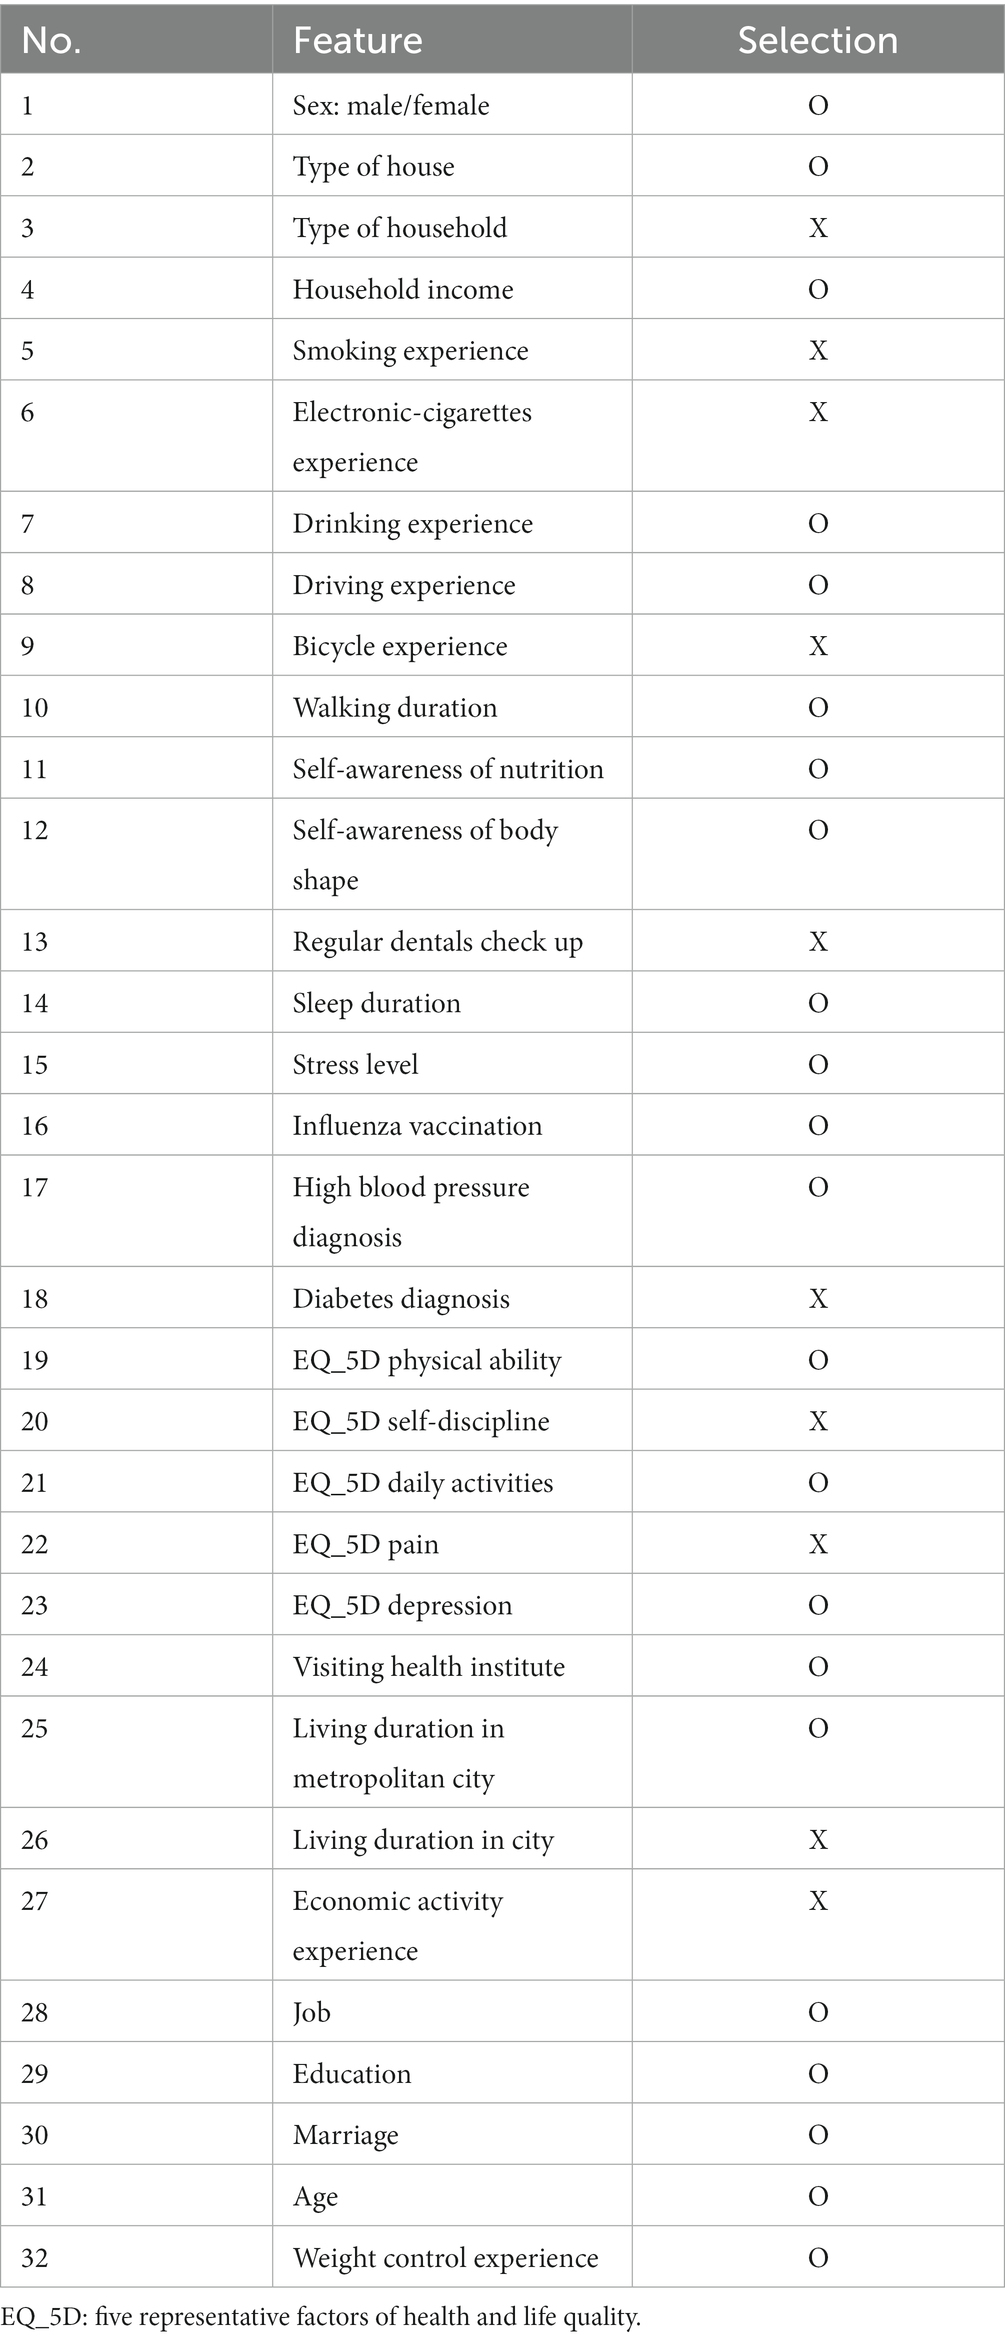
Table 2. Features for individual factors from ‘Community health survey data.
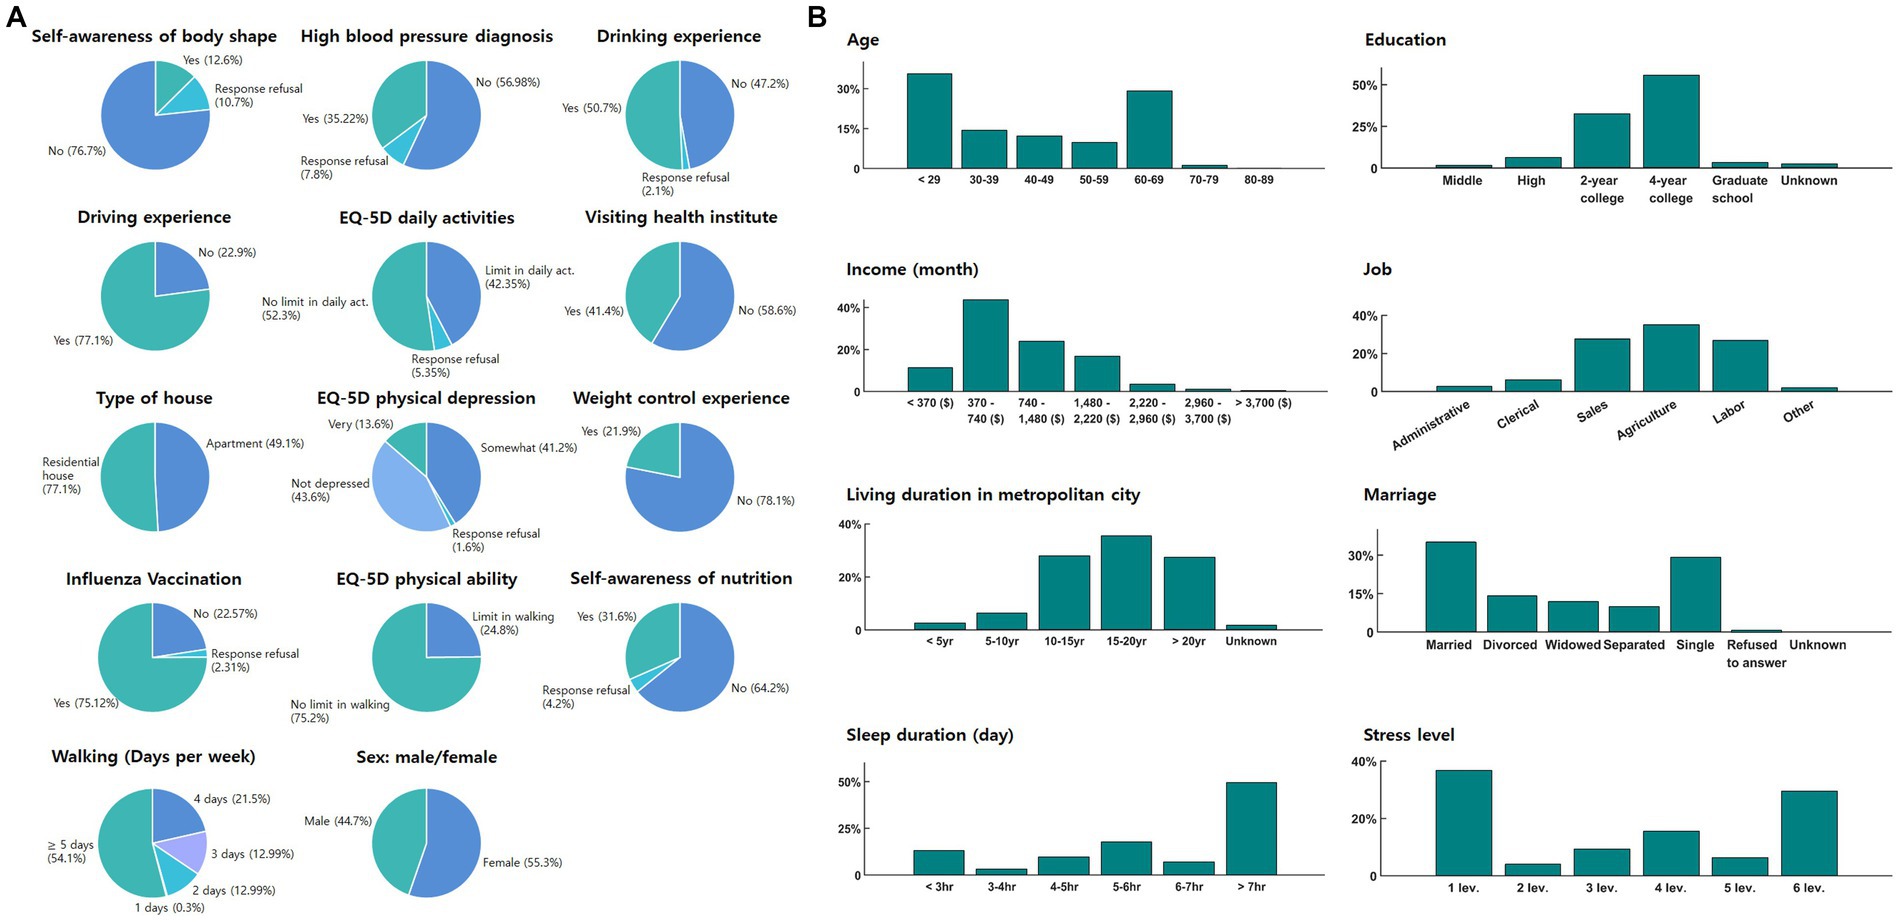
Figure 2. Descriptive statistics diagrams of selected features from ‘Community Health Survey Data’: (A) pie chart and (B) bar graph. (A) The pie chart provides a detailed representation of the distribution of various categorical variables such as ‘Self-awareness of body shape’, ‘High blood pressure diagnosis’, ‘Drinking experience’, ‘Driving experience’, ‘EQ-5D indexes’, ‘Visiting health institute’, ‘Type of house’, ‘Weight control experience’, ‘Influenza vaccination’, ‘Self-awareness of nutrition’, ‘Walking’, and ‘Sex’, categorized as ‘male’ or ‘female’. (B) The bar graph illustrates the distribution of variables like ‘Age’, ‘Education’, ‘Income’, ‘Job’, ‘Living duration in metropolitan city’, ‘Marriage’, ‘Sleep duration’, and ‘Stress level’.
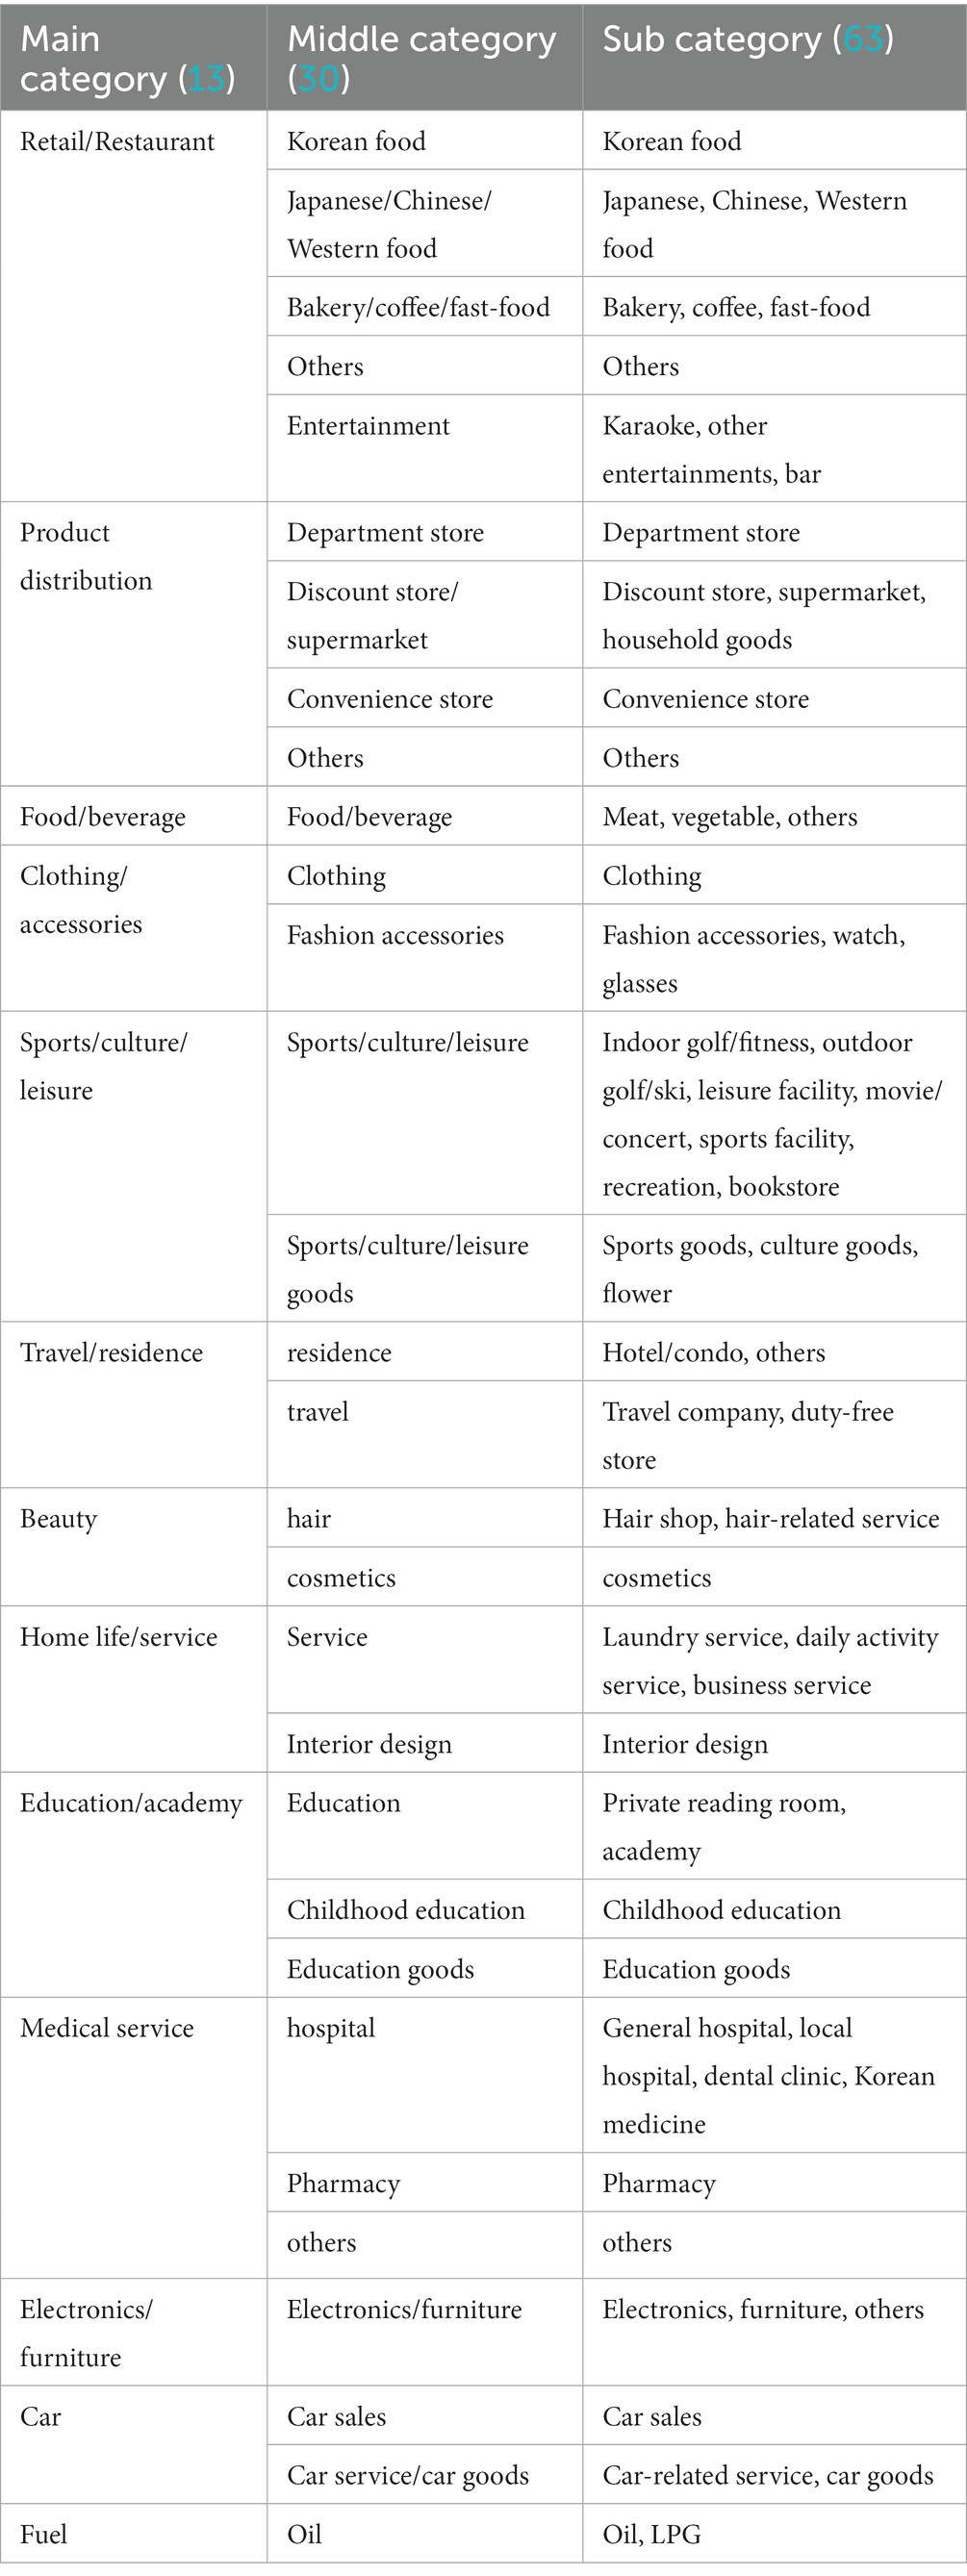
Table 3. Categories of credit card data.
2.2.1. Feature selection
Before feature selection, we considered a range of individual and social/environmental risk factors based on the existing literature on obesity (36–42, 44, 45). For individual factors, we included variables such as age, sex: male/female, occupation, education level, dietary habits, smoking, physical activity, sleep duration, stress level, blood pressure, diabetes, marriage, influenza vaccination, self-awareness of nutrition and body shape, and weight control experience. For social/environmental factors, we considered variables such as the availability of public transportation, green spaces, and recreational facilities, as well as socioeconomic indicators such as official land prices and individual health budgets for residents. The rationale for including these factors was based on their potential impact on obesity prevalence in Seoul City and their relevance in previous research.
To improve model performance, features were selected using the following statistical methods: The variance inflation factor (VIF) was used for the 32 respondents in the community health survey to evaluate multicollinearity. Although a VIF value greater than 10 typically indicates multicollinearity (63), employing a threshold of 10 VIF was deemed unsuitable in this study because it led to the removal of critical factors. Kim suggested that VIF values between 10 and 30 may indicate the presence of multicollinearity, but it is not strong (64). Therefore, through trial and error, we determined that a 30 VIF threshold effectively reduced multicollinearity without excluding crucial factors from the analysis. Additionally, ordinary least squares regression was performed to obtain a simple linear regression for the dataset. Obesity was set as the dependent variable. Variables showing a value of p greater than 0.05 were excluded. Ultimately, 22 factors from the ‘Community Health Survey Data’ were selected as individual features applied to the machine learning model (Table 2). From the ‘Credit card use data’, 63 categorized factors were also used as individual features to develop obesity-related machine learning models (Table 3). Selected social and environmental features included factors related to the area of green parks, public transportation, bicycles, and official land prices.
2.2.2. Machine learning models
For classification purposes, four different machine-learning models were applied: Logistic Regression, Random Forest, XGBoost, and Gradient Boosting. All classification models were trained and validated using community health survey data. Specifically, 10-fold cross-validation was employed. The results showed that the random forest model outperformed the other classification models in this dataset. Therefore, the random forest model was selected to classify obesity using the selected 22 features from Community health survey data and Credit card use data to derive the influential individual features leading to obesity.
The random forest algorithm is a decision-tree algorithm that uses an ensemble learning mechanism to create classification or regression models (65). Similar to the decision tree algorithm, the random forest algorithm requires target and input variables, where the target variable is a predefined class, such as a category or a continuous value. The target variable was used as the basis for the tree model analysis. The input variables were “pool of data” from which the random forest algorithm could extract factors that influence the pre-defined class or continuous value. The major difference between the original decision tree and the random forest is that the random forest algorithm creates multiple trees by randomly selecting variables from the given input variables through the process of bagging. This procedure reduces overfitting, which is a critical disadvantage of the original decision tree algorithm. In this study, the random number of trees to be created was set to 5,000 to ensure the full random usage of all data.
2.2.3. SHAP algorithm (Shapley analysis)
The results of machine learning algorithms are not interpretable due to their “black box” properties. To derive obesity-related factors from the machine learning results, the SHAP algorithm was used to provide the influential weight of each feature for prediction (66). The influential weight represents the extent to which individual features contribute to the prediction.
There are two approaches to the SHAP algorithm: KernelSHAP and TreeSHAP (67). In this study, treeSHAP was used because of its faster processing speed than kernelSHAP. The SHAP results were presented as SHAP summary and dependence plots. The SHAP summary plot showed the extent to which individual features influenced the prediction with the combined value of feature importance and feature effects (Figure 3A). A SHAP dependence plot was used to investigate discriminant features of the SHAP summary plot results. This plot showed how the responses to each survey question were related to obesity (Figure 3B).
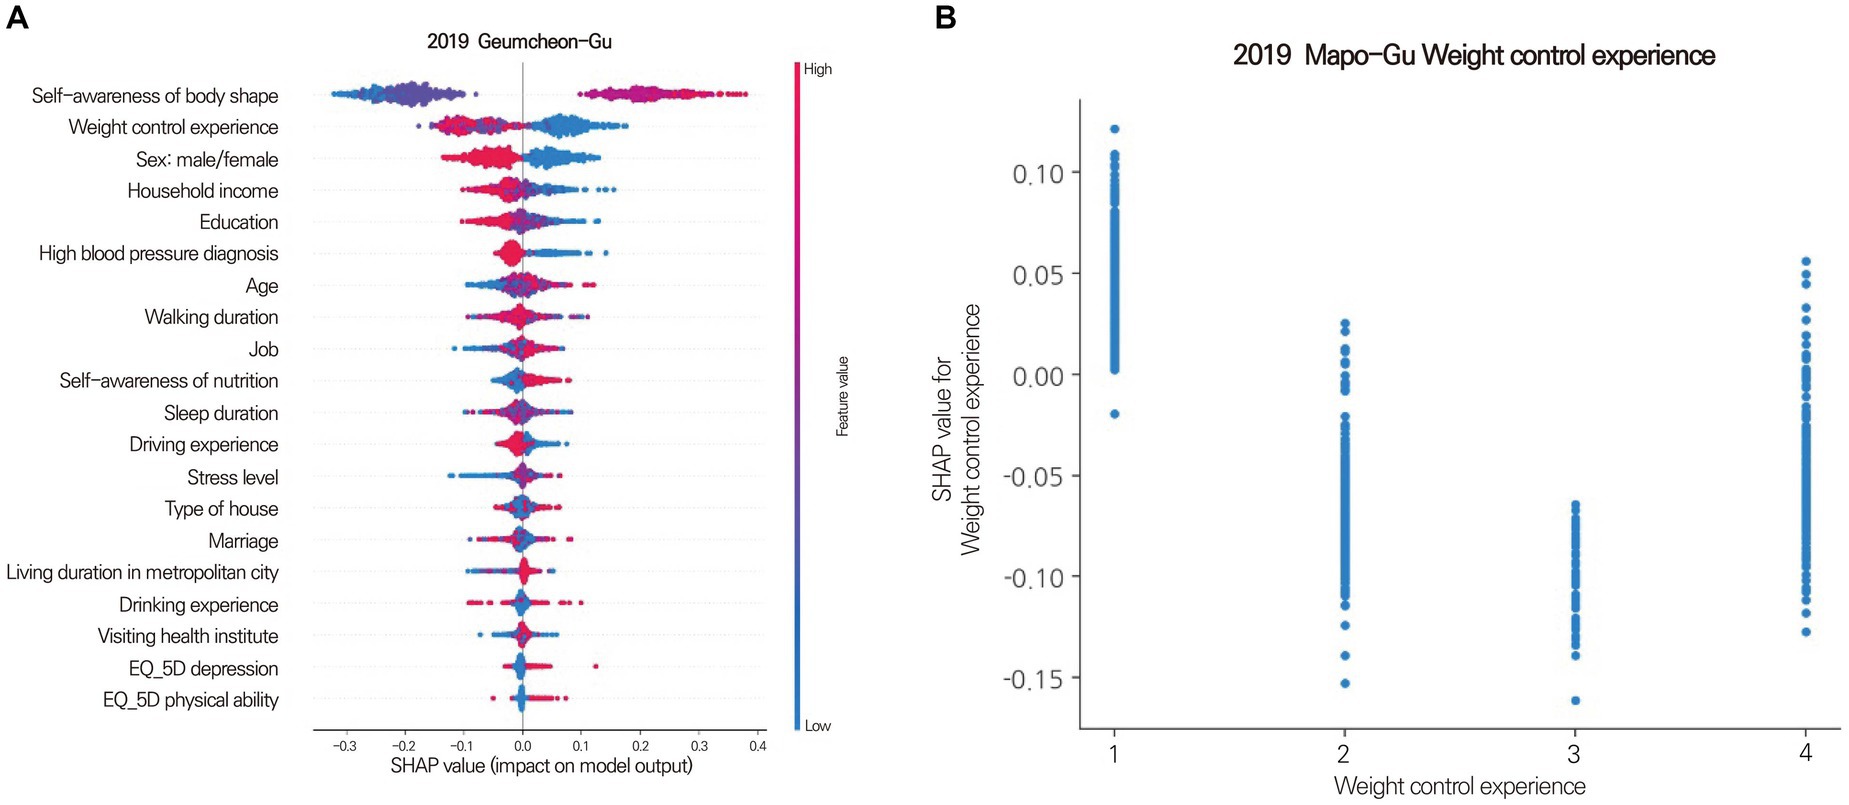
Figure 3. Shapley summary plot (A) for Geumcheon-Gu and dependence plots (B) for Mapo-Gu. (A) The SHAP value (x-axis) represents the impact on obesity. Positive values indicate contributions to obesity, while negative values indicate contributions to non-obesity. The absolute value signifies the magnitude of the contribution, with a SHAP value of 0 meaning no contribution. Features are sorted in descending order of importance from top to bottom. Colors represent the response value of the feature, with red indicating high values and blue indicating low values. For instance, red in the age feature represents older age, while blue signifies younger age. A clear separation of colors for each feature based on a SHAP value of 0 suggests that the feature is an influential factor. (B) The Shapley dependence plot illustrates how each response contributes to the SHAP value. The x-axis represents the responses to the question about weight control experience, with higher numbers indicating more frequent experiences of weight control. The y-axis represents the SHAP value for weight control experience. In Mapo-Gu, individuals with less experience in weight control have a higher likelihood of developing obesity.
2.2.4. GWLASSO
The shrinkage method in statistical learning is used to reduce the effects of sampling variation. The least absolute shrinkage and selection operator (LASSO) is widely used for variable selection. GWLASSO is a modified LASSO that alleviates the collinearity effect among explanatory factors by adding geographical weights, which allows the implementation of variable selection with spatial information (68). In this study, GWLASSO was used to identify the social/environmental influencing factors leading to obesity with potential spatial relationship patterns among Gu districts using the Euclidean distance between each district (54). The GWLASSO equation is as follows:
where and represent the rate of obesity in i Gu district and k social/environmental factor in i Gu district, respectively. represents the estimated regression coefficient of the k factor. represents the residual at i Gu district, and and indicate the position in longitude and latitude, respectively. The GWLASSO coefficient estimates were defined as:
The optimal for each Gu district was selected within the range of 0.001 to 0.03.
2.2.5. Evaluation of classification performance
The developed machine learning model, using the random forest algorithm for classification, was evaluated by comparing the predicted labels with the true labels. The performance of the model was defined based on accuracy, precision, recall, f1-score, and AUC.
True positive (TP) referred to the number of participants correctly labeled as obese, true negative (TN) referred to the number of participants correctly labeled as non-obese, false positive (FP) referred to the number of participants incorrectly labeled as obese, and false negative (FN) referred to the number of participants incorrectly labeled as non-obese. The accuracy and precision indicated how close the predicted obesity was to the true obesity and the quality of the positive obesity label, respectively. The recall indicated the ability of the model to recognize obesity. The F1-score represented the harmonic mean of precision and recall.
3. Results
3.1. The rate of obesity
According to the community health survey data, all Gu districts in Seoul have experienced an increased obesity rate since 2017. Gangnam-Gu (21.3%, 2017; 24.3%, 2018; 27.0%, 2019) and Seocho-Gu (23.1%, 2017; 23.5%, 2018; 23.5%, 2019) had the lowest obesity rates in 2017, 2018, and 2019. In contrast, Jungrang-Gu (29.7%, 2017; 33.9%, 2018; 35.4%, 2019) and Dobong-Gu (28.2%, 2017; 28.6%, 2018; 37.0%, 2019) had the highest obesity rates in 2017, 2018, and 2019. The difference between the lowest and highest obesity rates was approximately 10% annually (Figure 4). The rate of obesity in women (22.5 ± 5.3%) was approximately 10% higher than that in men (36.9 ± 3.9%) (Figure 5), and older adults (31.5 ± 6.7%, > 69 years of age) showed approximately 10% higher rate of obesity compared to young adults (20.2 ± 4.0%, < 29 years of age) in all districts (Figure 6).
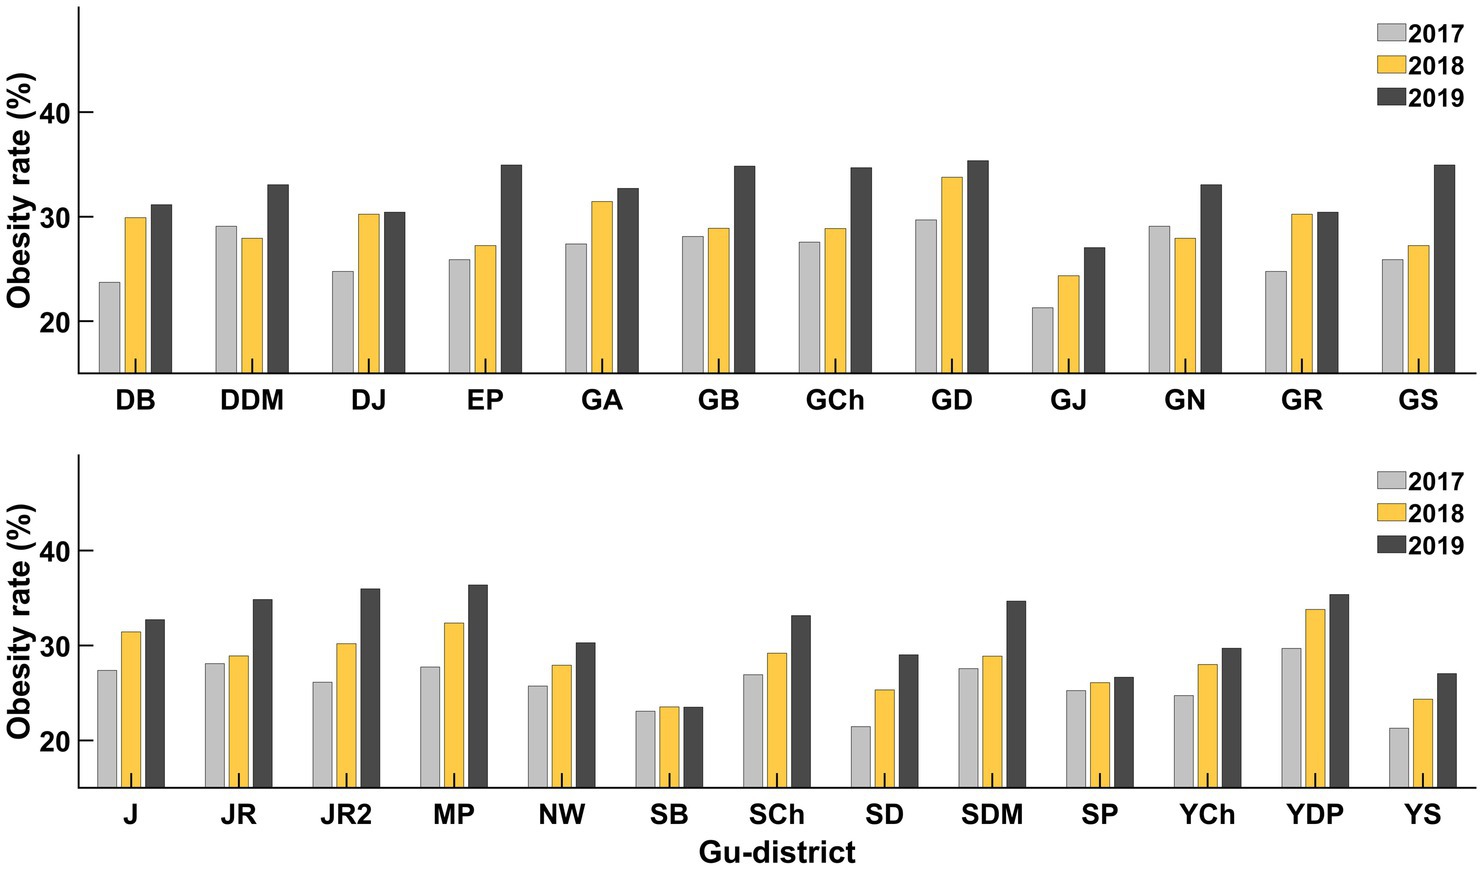
Figure 4. Obesity rates for all gu-districts from 2017 to 2019. The rate of obesity increased from 2017 (gray) to 2019 (black) in all gu-districts. In every gu-district, the obesity rate in 2019 was higher than in 2017 (DB, Dobong-gu; DDM, Dongdaemoon-gu; DJ, Dongjak-gu; EP, Eunpyung-gu; GA, Gwanak-gu; GB, Gangbuk-gu; GCh, Geumcheon-gu; GD, Gangdong-gu; GJ, Gwangjin-gu; GN, Gangnam-gu; GR, Guro-gu; GS, Gangseo-gu; J, Jung-gu; JR, Jungrang-gu; JR2, Jongro-gu; MP, Mapo-gu; NW, Nowon-gu; SB, Seongbuk-gu; SCh, Seocho-gu; SD, Seongdong-gu; SDM, Seodaemoon-gu; SP, Songpa-gu; YCh, Yangcheon-gu; YDP, Youngdeungpo-gu; YS, Yongsan-gu).
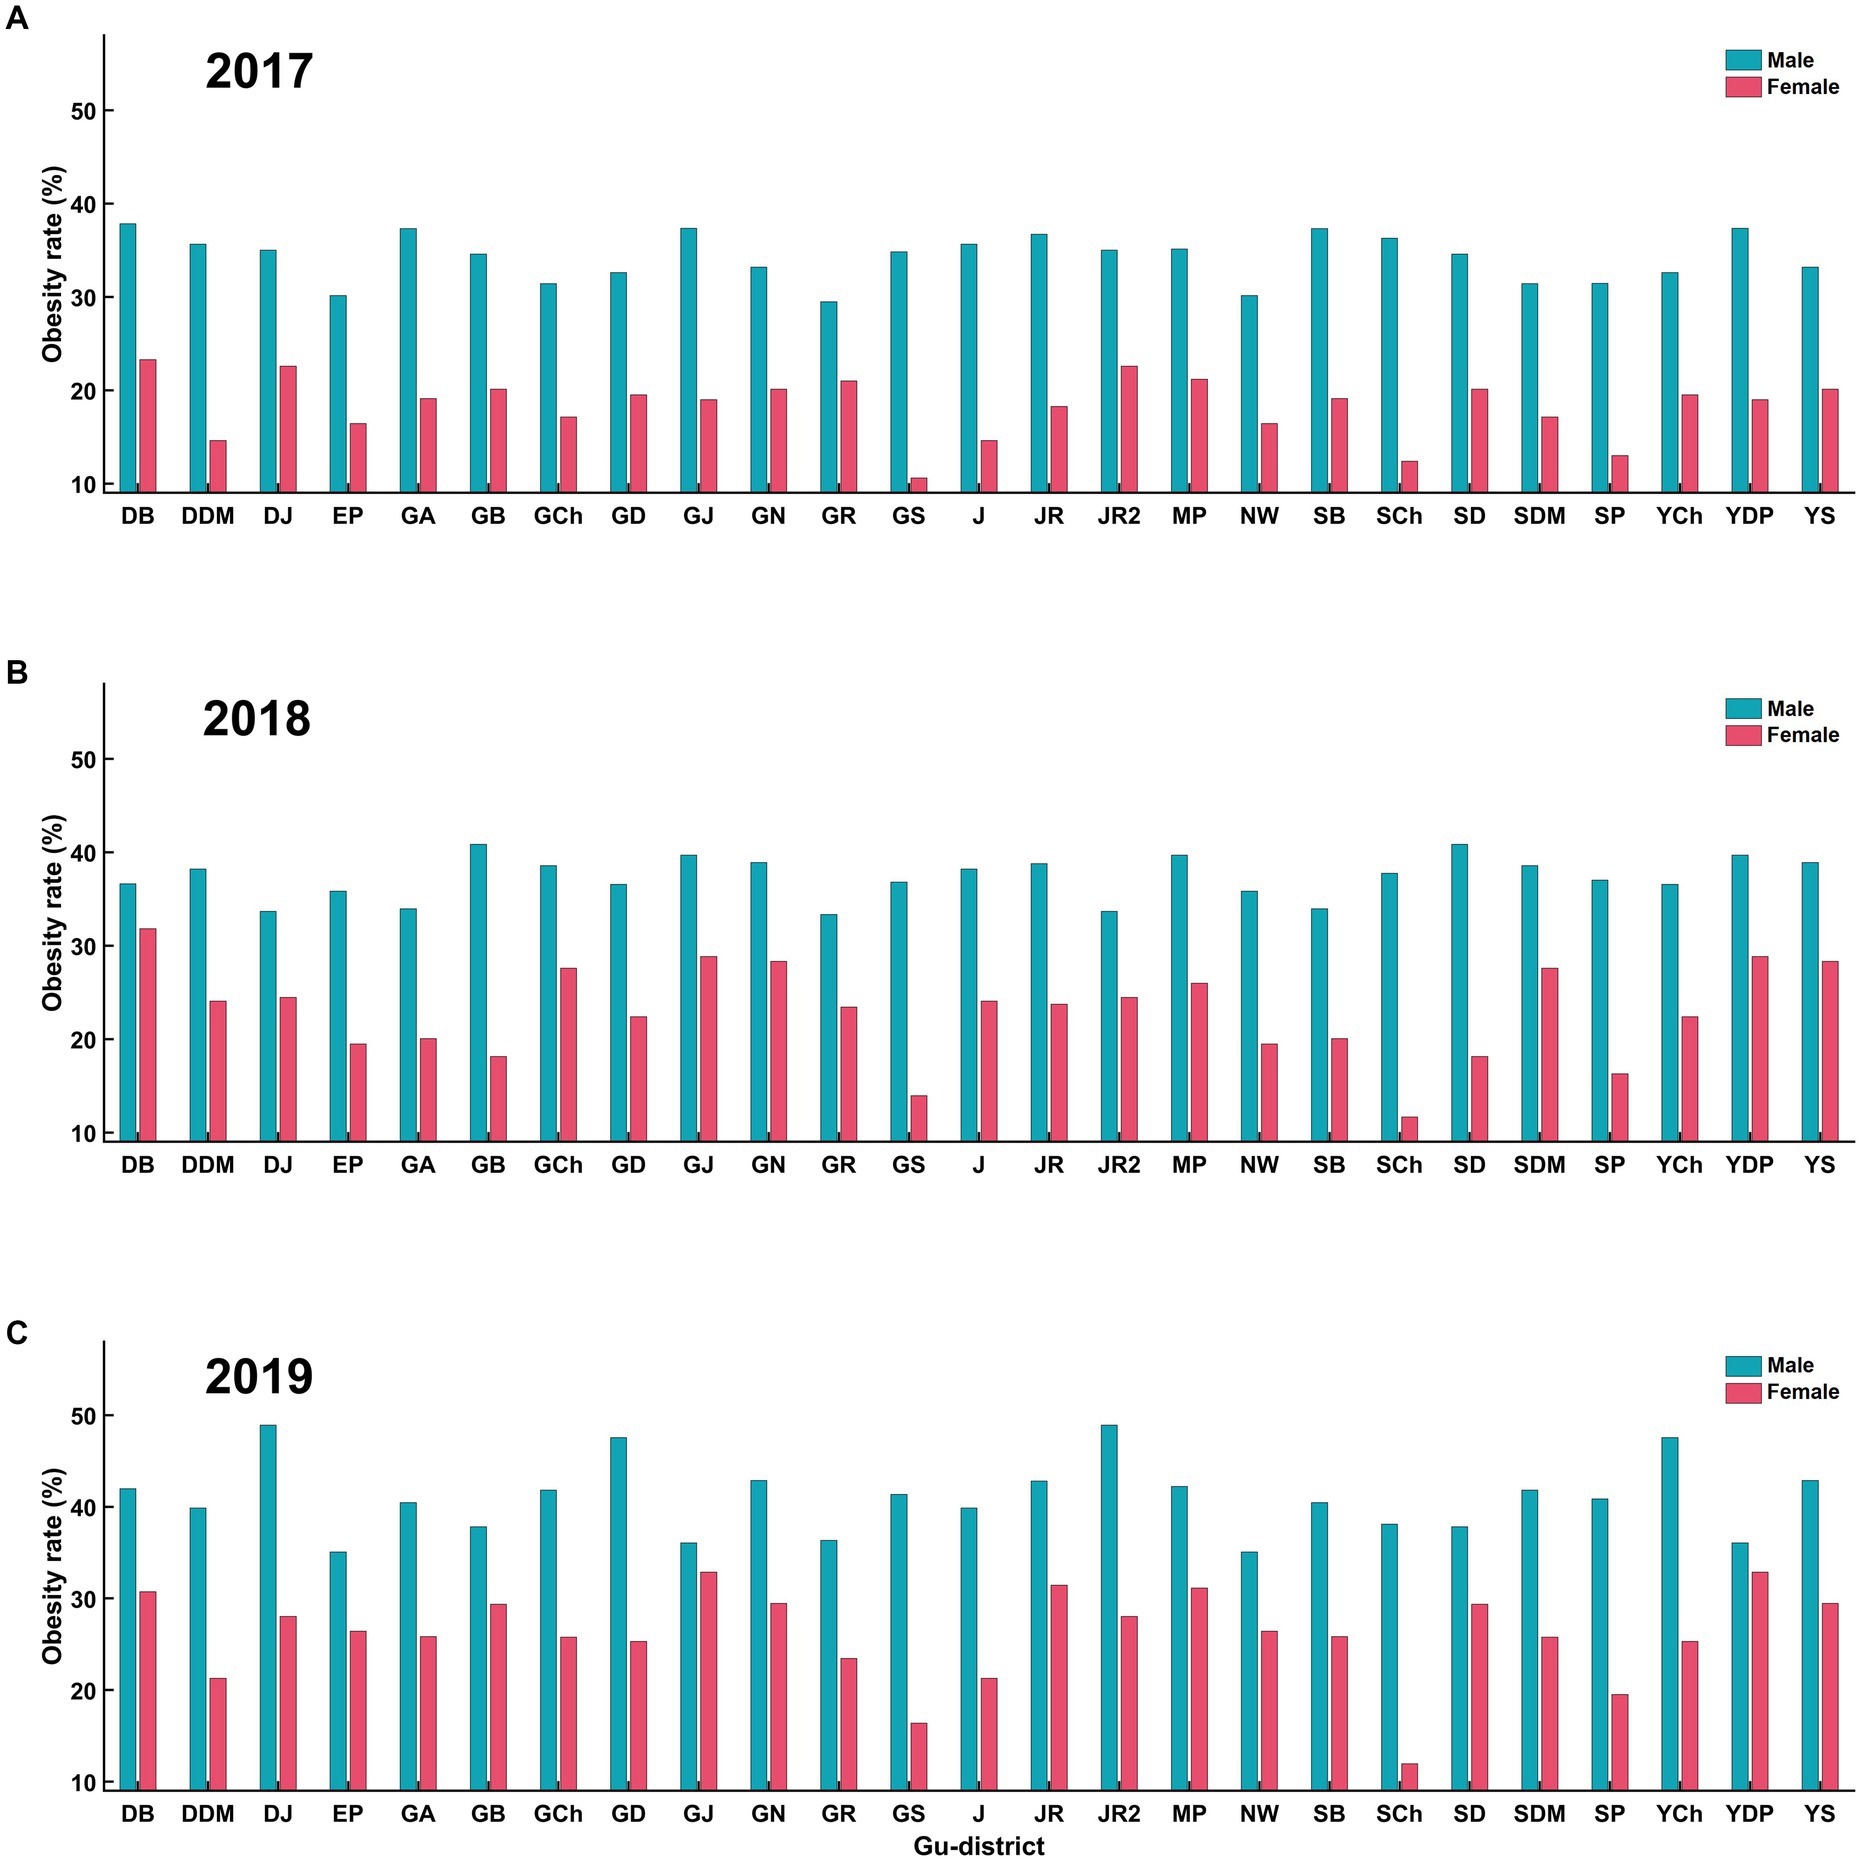
Figure 5. Obesity rates by sex for all gu-districts on (A) 2017, (B) 2018, and (C) 2019. (A) represents obesity rates in 2017, with males (blue) consistently having higher rates than females (red) across all gu-districts. (B) displays the same trend for 2018. Similarly, (C) represents data for 2019. Across these years, male obesity rates in all gu-districts were consistently higher than those for females.
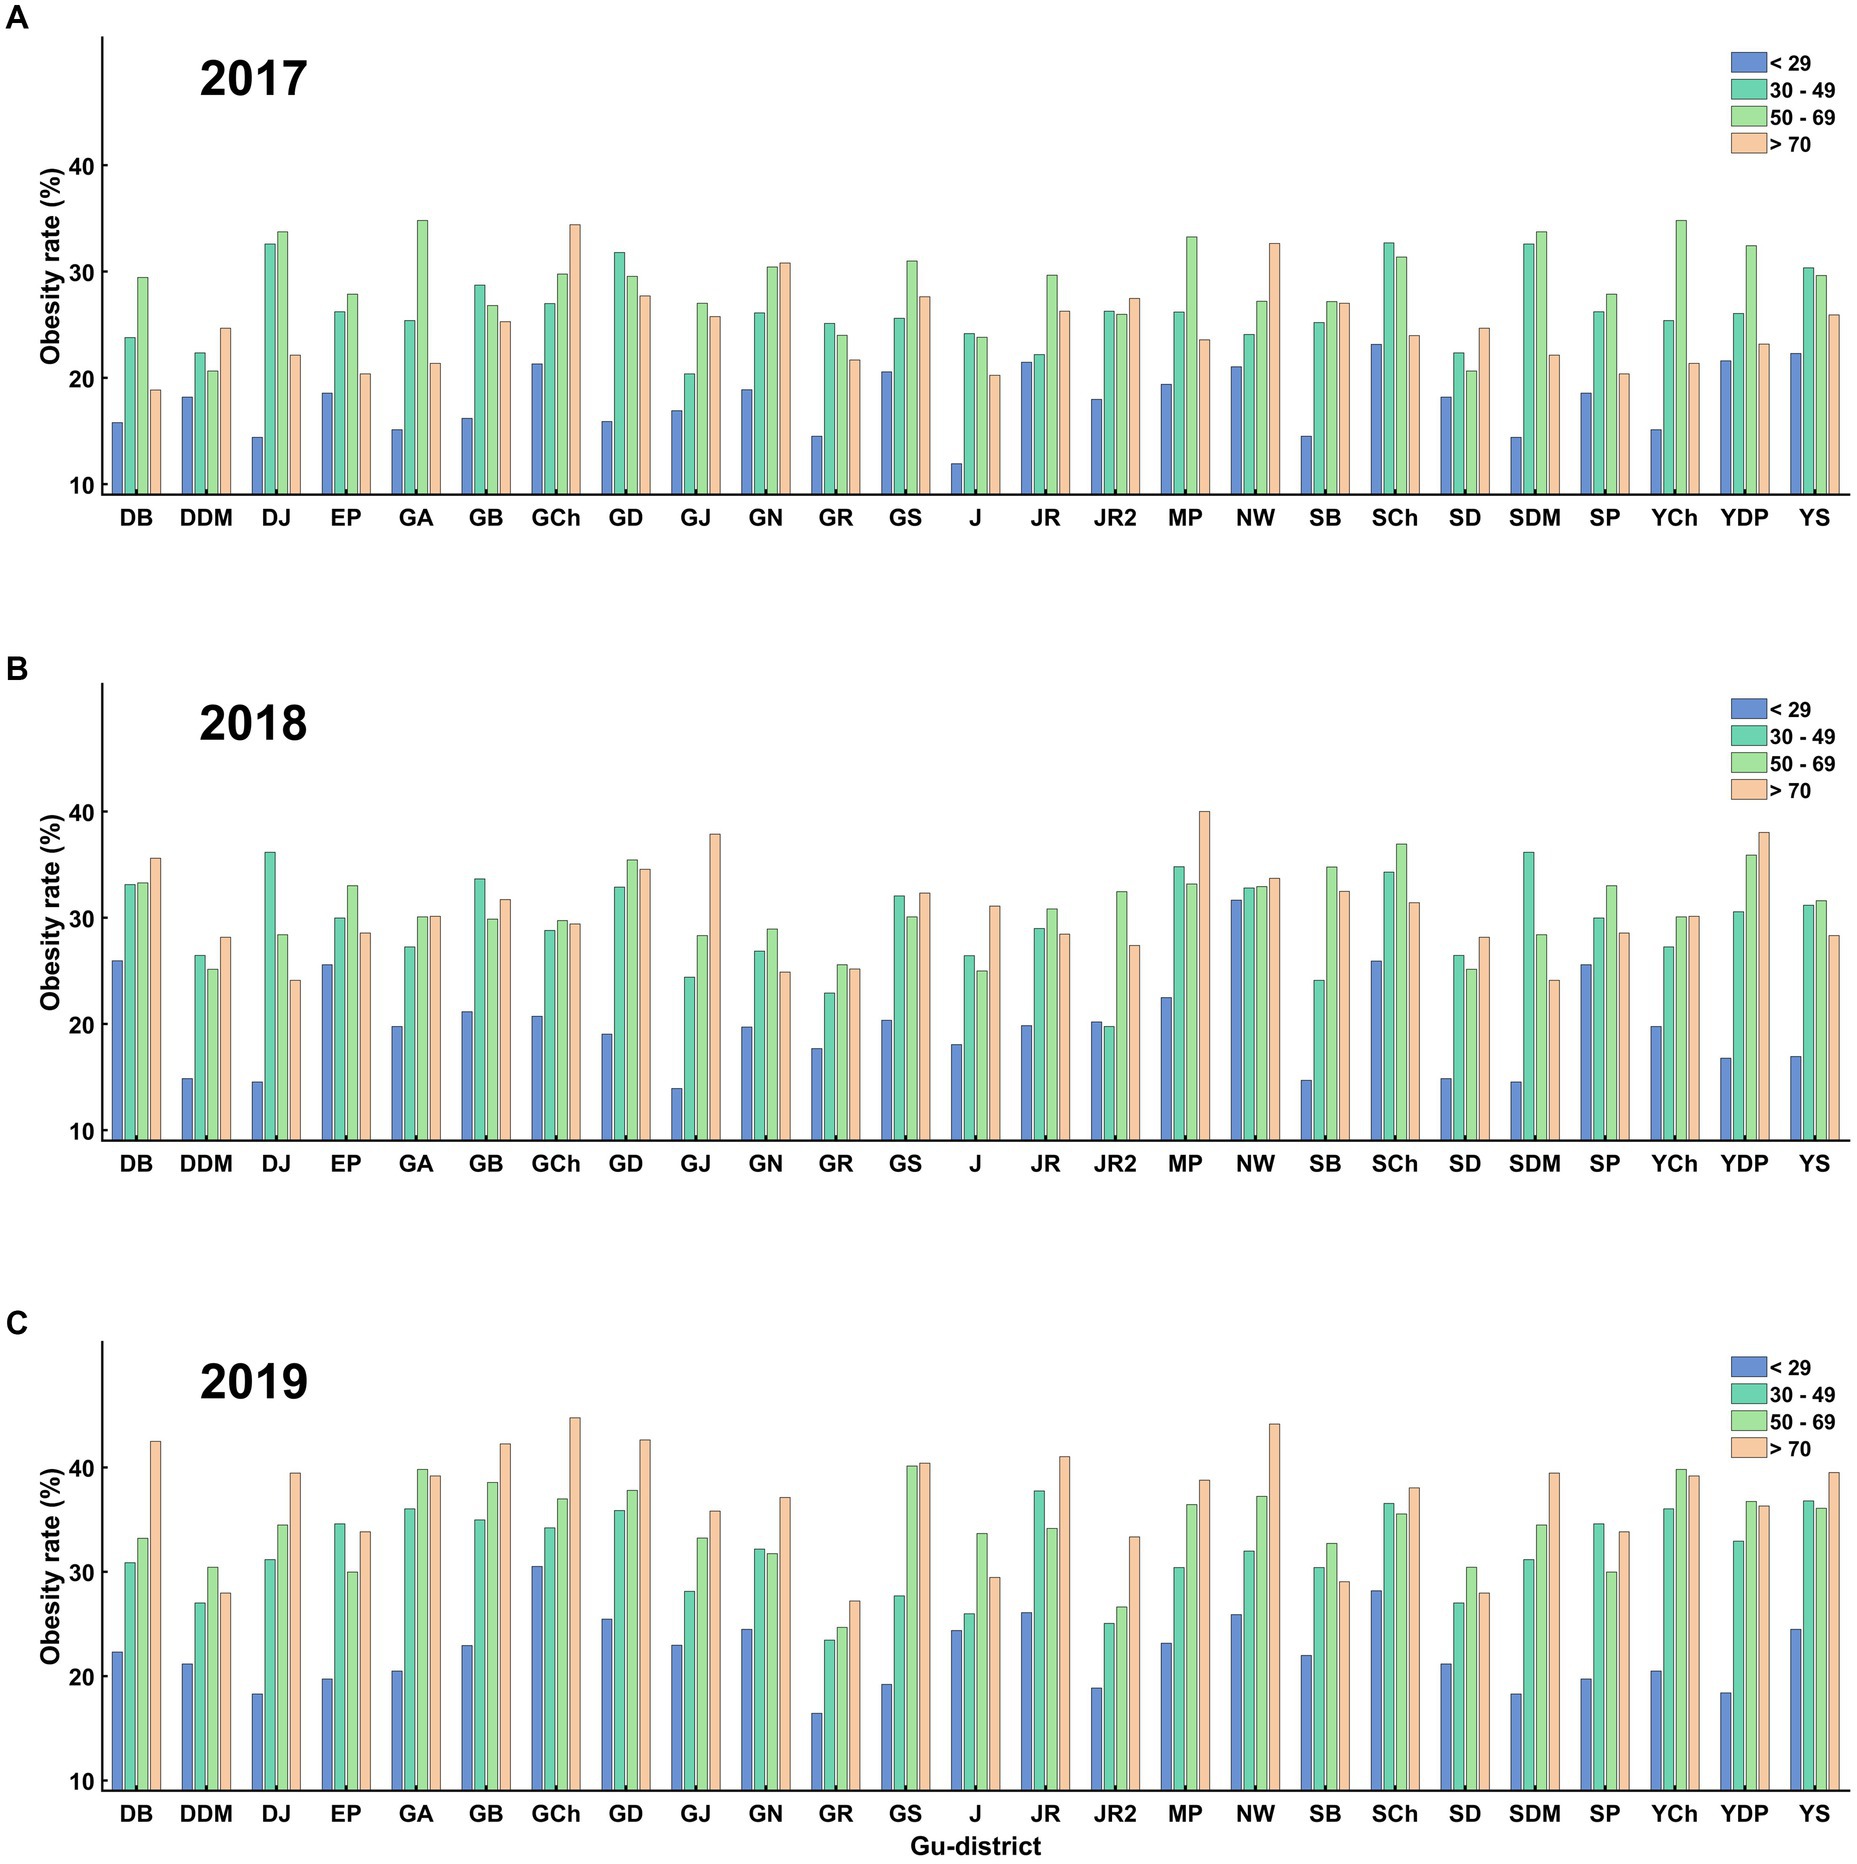
Figure 6. Obesity rates for different age groups across all gu-districts on (A) 2017, (B) 2018, and (C) 2019. (A) shows the obesity rates across age groups in 2017. The trend indicates that older individuals (>70 years) have a consistently higher obesity rate than younger individuals (<29 years). (B) displays the same trend for 2018, and (C) for 2019. Throughout these years, the obesity rate of older age groups was consistently higher than the younger age groups in all gu-districts.
3.2. Classification of obesity at each Gu district level
The classification results are presented in detail in Table 4. The random forest model showing the best classification performance was used for the classification of obesity in each Gu district of Seoul City. The pre-processed 88 individual features were applied to the random forest model. The random forest approach for distinguishing between obesity and non-obesity yielded the highest performance, with an accuracy of 96%, in the Songpa-Gu district and the lowest performance, with an accuracy of 83%, in the Dondaemoon-Gu district. The average (SD) of accuracy, precision, recall, and f1-score were 90% (3%), 95% (4%), 85 (5%), and 89% (3%), respectively (Table 4).

Table 4. Accuracy, precision, recall, and F1-score values of random forest model used to classify obesity.
3.3. SHAP algorithm to determine contributing factors of obesity
In this study, the SHAP algorithm extracted the top five features leading to obesity as individual factors. “Self-awareness of body shape” was the most influential factor in all districts. “Weight control experience” was the second most influential factor in 15 districts. Other significant influential factors were “fast food intake,” “Sex: male/female,” “high blood pressure,” “household income,” and “level of education” (Table 5; Figure 7). Although most districts had similar influential individual factors, some districts differed. In Gangseo-Gu, “house type” was an important factor leading to obesity. “Stress level,” “sleep duration,” and “smoking” were among the top five influential individual factors in Dongdaemoon-Gu, Songpa-Gu, and Jongro-Gu.
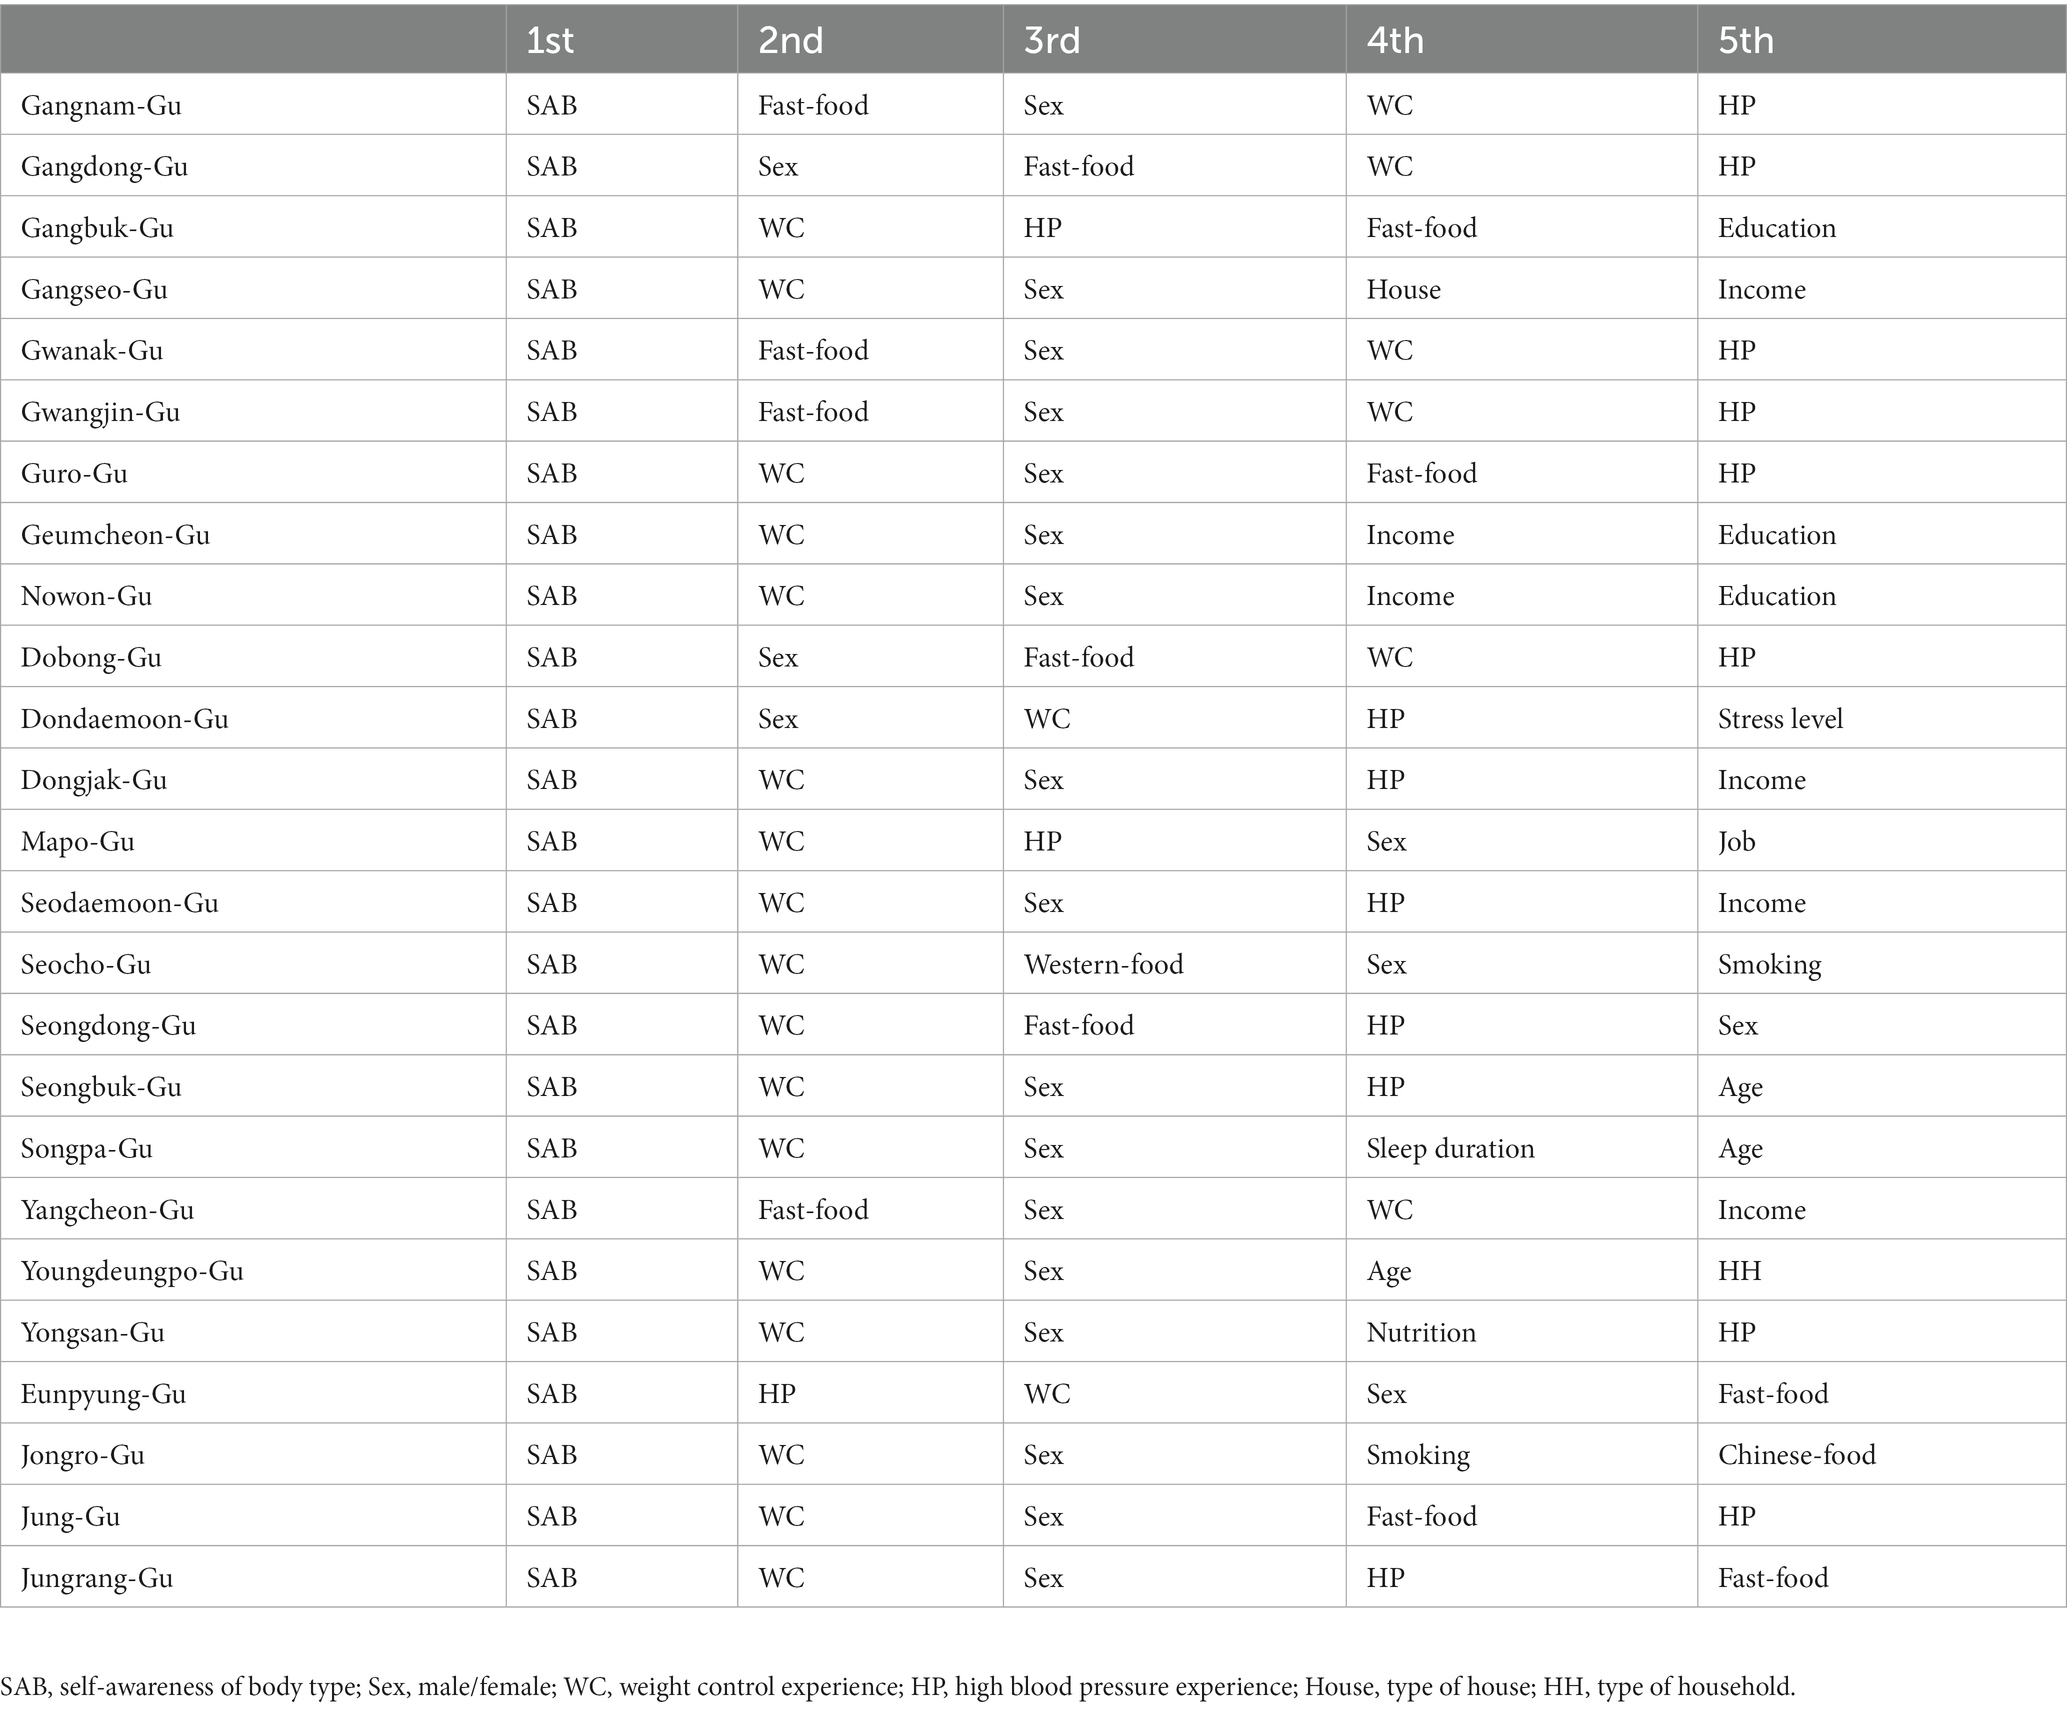
Table 5. Top 5 influential individual factors leading to obesity in SHAP analysis.
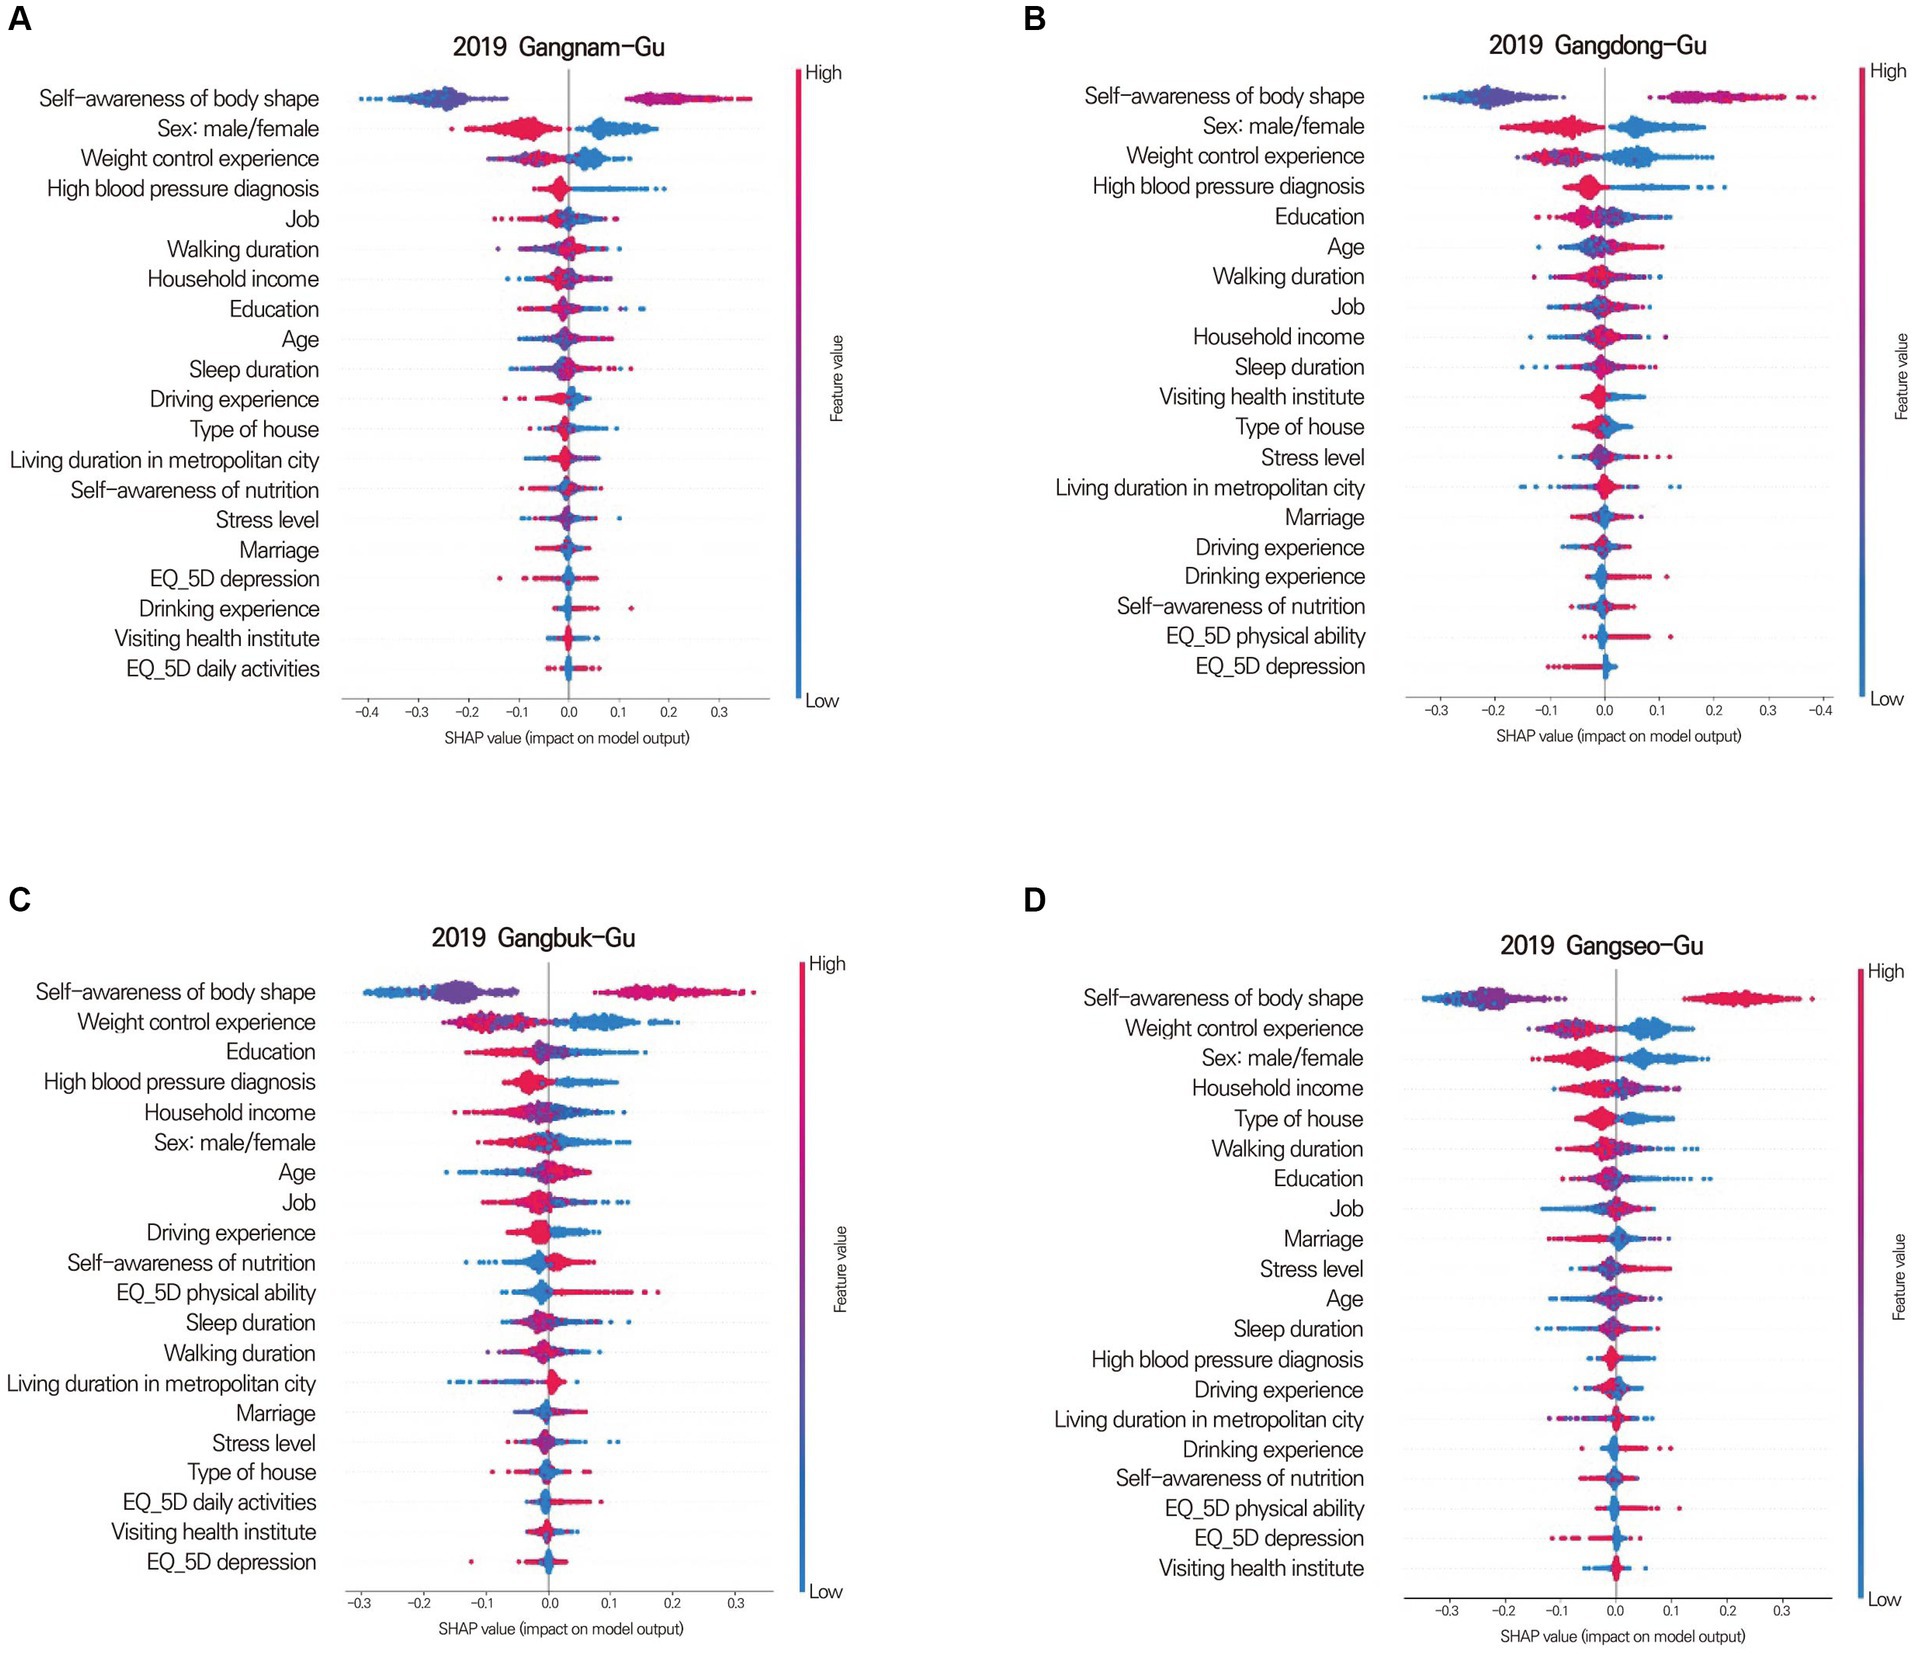
Figure 7. Shapley summary plot for Gangnam-Gu (A), Gangdong-Gu (B), Gangbuk-Gu (C), and Gangseo-Gu (D). The Shapley summary plot shows which factors significantly contribute to obesity, sorted in descending order of importance. For instance, in Gangnam-gu, Gangdong-gu, Gangbuk-gu, and Gangseo-gu, self-awareness of body type is the most crucial factor in determining obesity. The order of importance for each district (gu) varies in terms of the factors that contribute to obesity.
3.4. GWLASSO for correlating social/environmental factors with spatial obesity rate
GWLASSO was used to derive the social/environmental factors related to obesity by considering spatial relationships. The “green park area per individual” was negatively correlated with obesity in all districts. The maximal correlation value was −0.80 in Nowon-Gu, and Seongbuk-Gu and Dobong-Gu also had a relatively strong negative correlation between the “green park area per individual” and obesity. “Land price” was negatively related to obesity in all districts. The highest correlation coefficient was −0.89 in Gwanak-Gu, and the lowest was −0.26 in Yongsan-Gu. The area around Gangnam-Gu, including Songpa-Gu and Seocho-Gu, had a relatively high negative correlation with “land prices.” “Bus utilization rate” had the opposite result from “Bus utilization rate during rush hour” and “Bicycle utilization rate” in all districts; “Bus utilization rate” was positively correlated, while “Bus utilization rate during rush hour” and “Bicycle utilization rate” were negatively correlated with obesity. The obesity rate decreased with increasing “Personal health budget” in 22 of the 25 districts, however, the coefficient was not significantly higher than other social/environmental factors (Table 6; Figure 8).
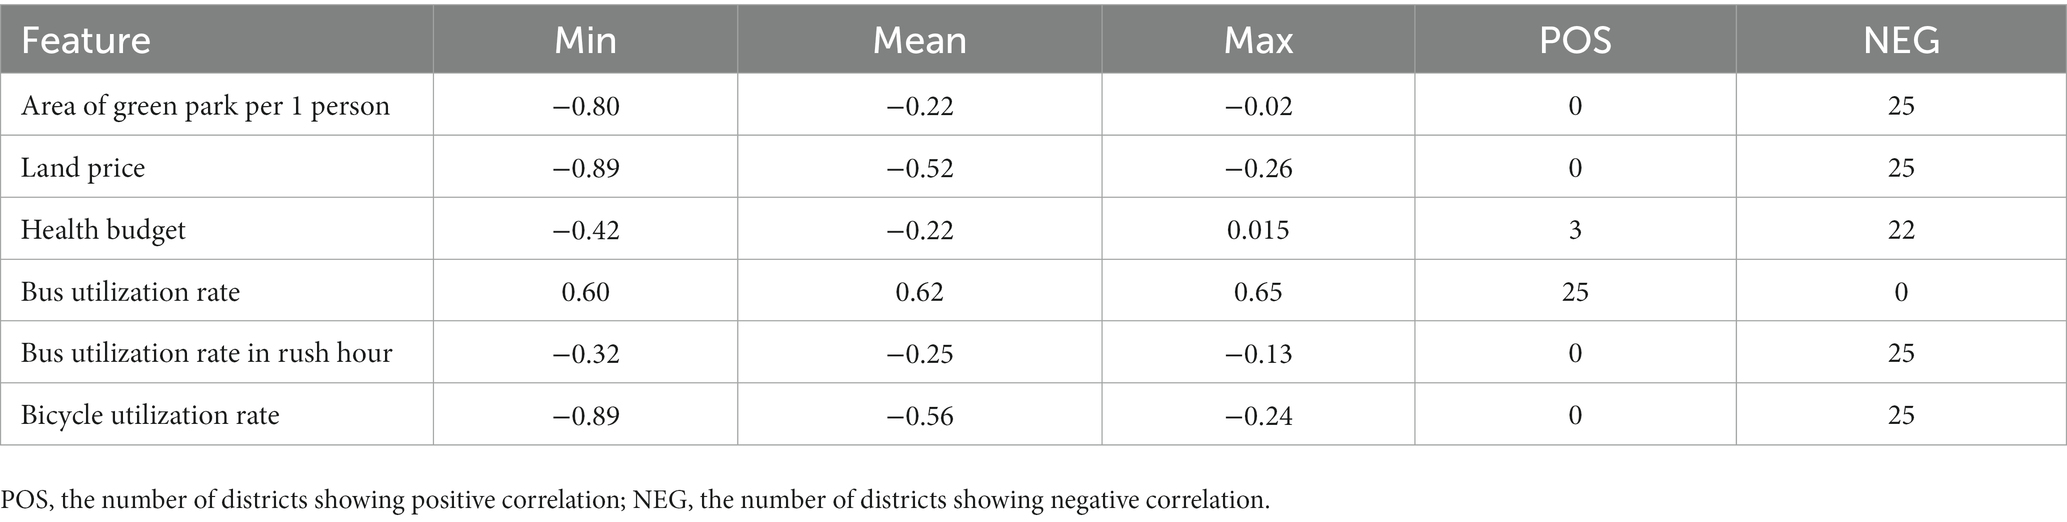
Table 6. The correlation coefficient between a social/environmental factor and obesity in GWLASSO.
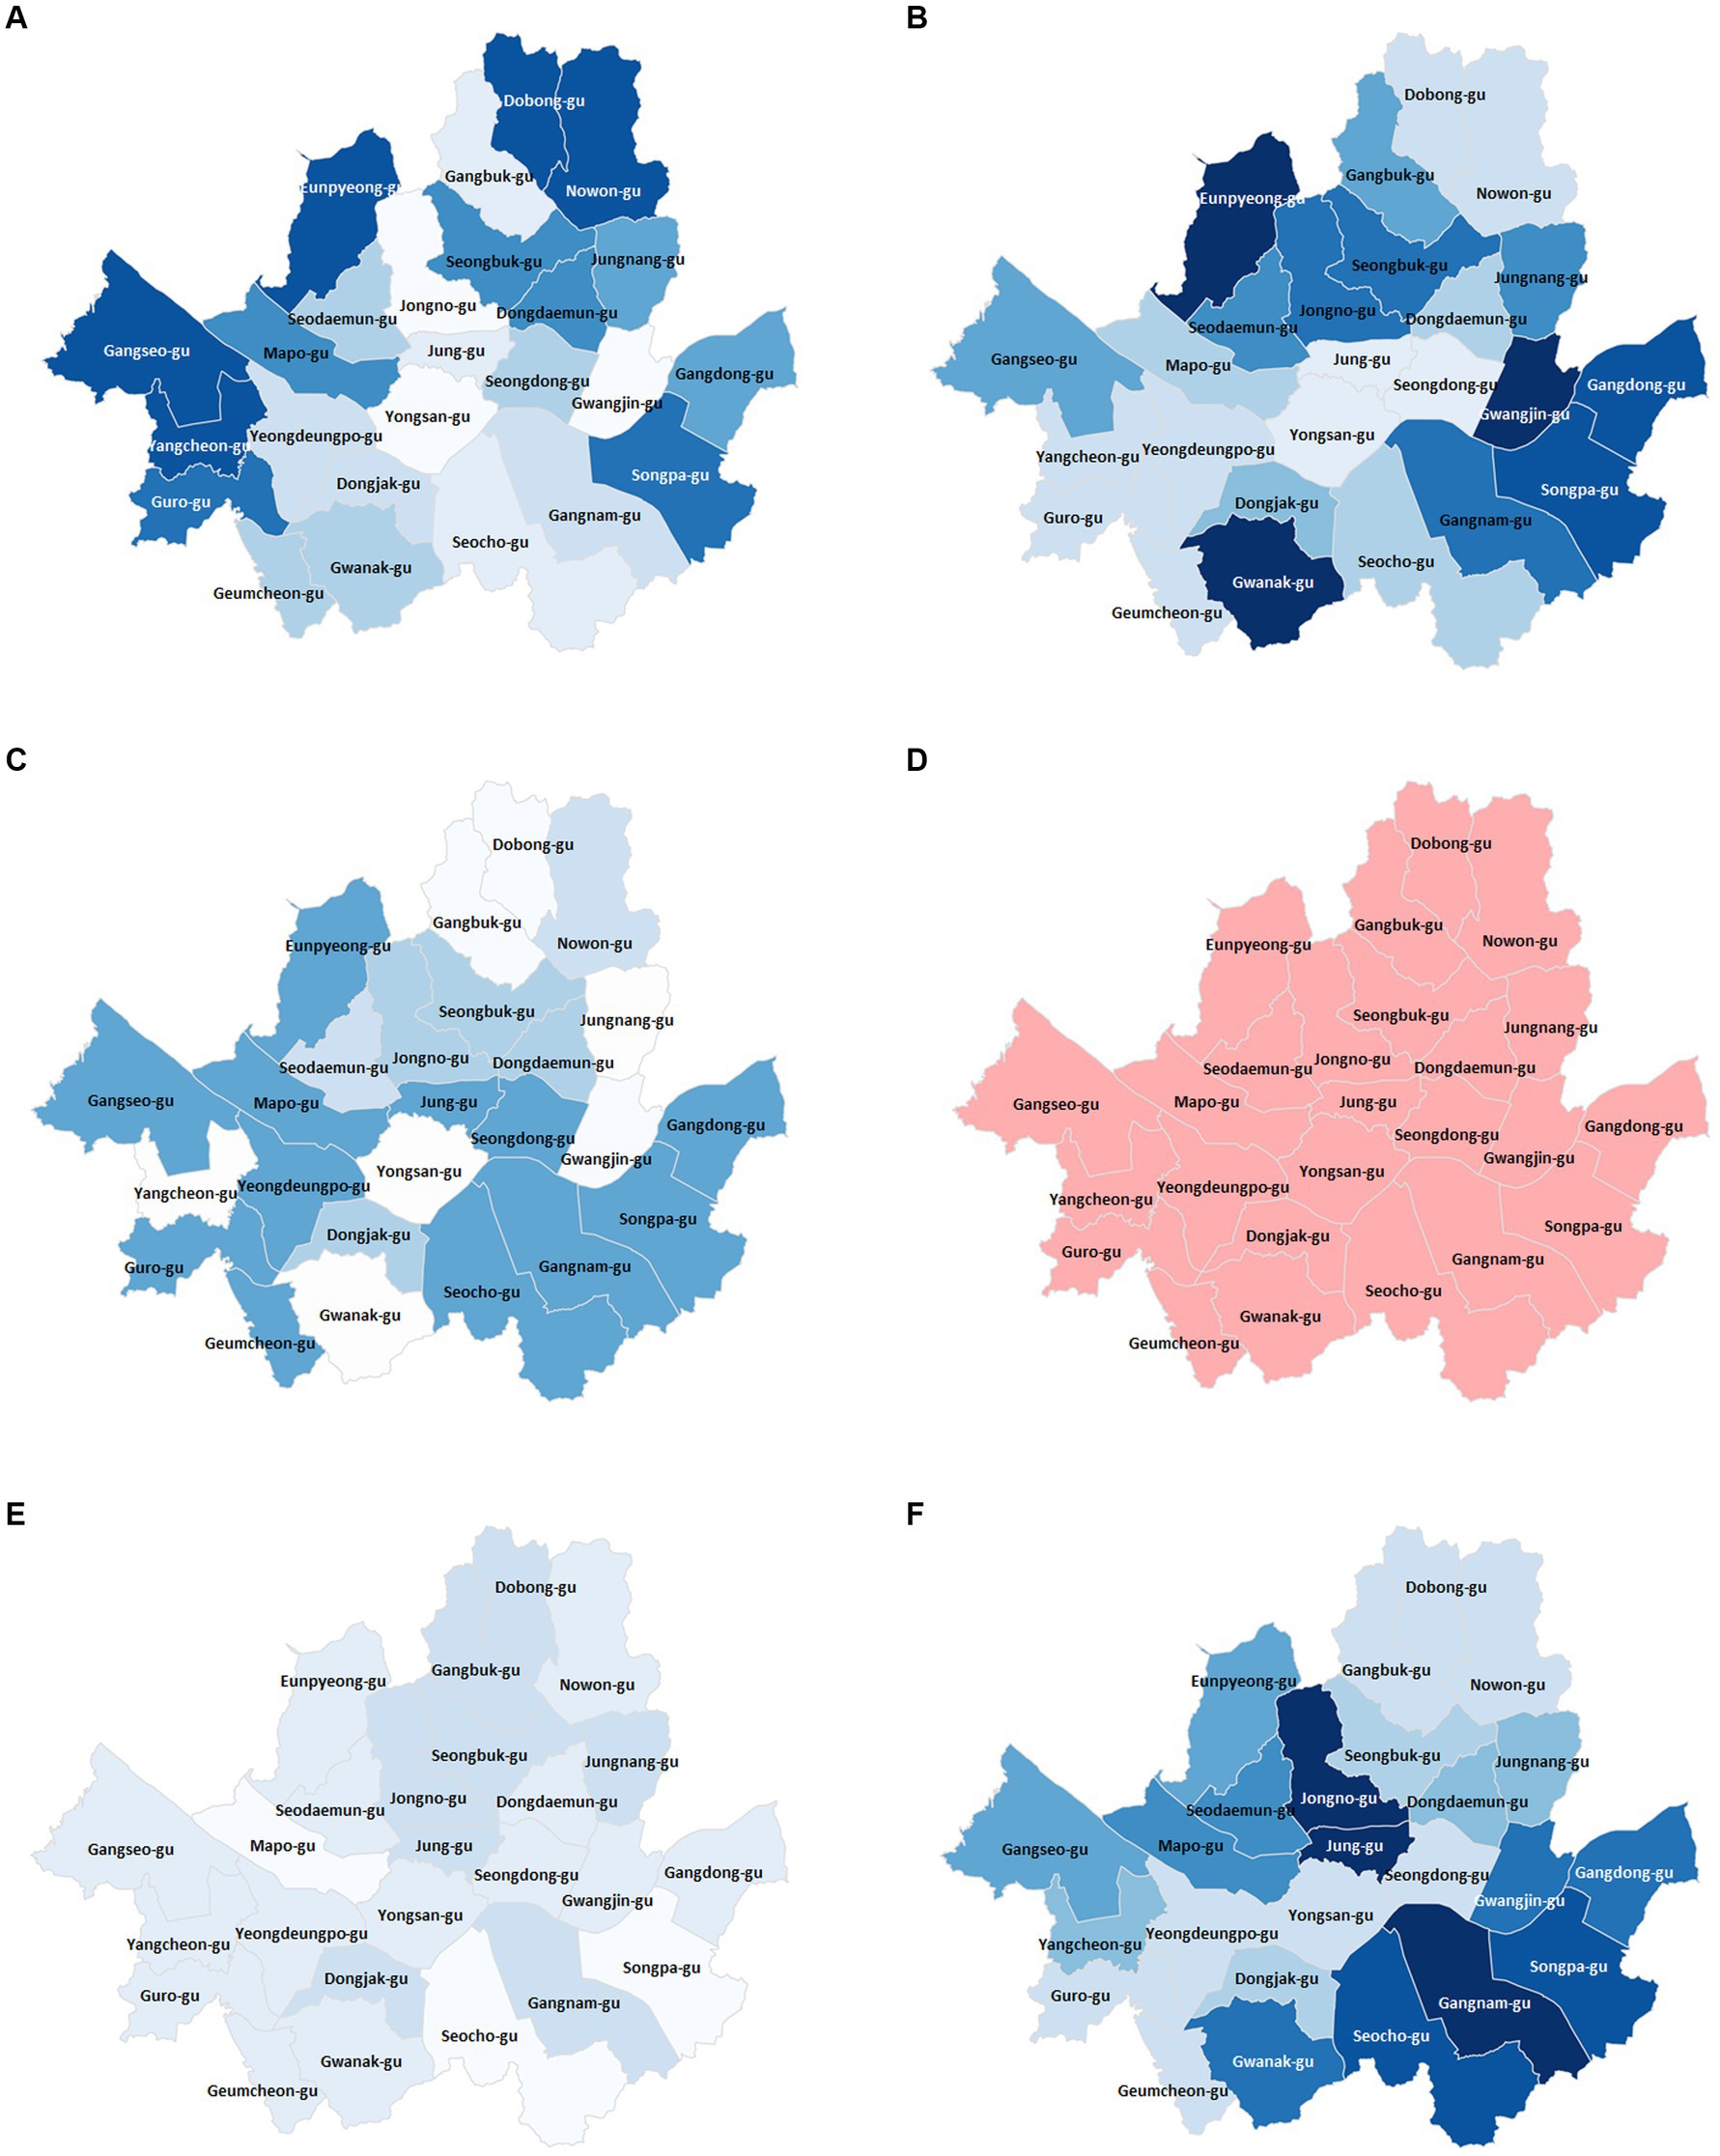
Figure 8. Obesity-related geographic information diagrams of geographically weighted least absolute shrinkage and selection operator for area of green park per person (A), land price (B), health budget (C), bus utilization rate (D), bus utilization rate during rush hour (E), and bicycle utilization rate (F). The color intensity of each district represents the correlation between obesity rate and the social/environmental factor. The stronger the color, the higher the correlation. Red and blue colors indicate negative and positive correlations, respectively. (A) Nowon-Gu exhibited the highest negative correlation between obesity and area of green park per person. The obesity rate in Dobong-Gu and Seongbuk-Gu, adjacent to Nowon-Gu, is also relatively highly correlated with the green park area. (B) All gu-districts showed decreasing obesity rates with increasing land prices. The area adjacent to Gangnam-Gu displayed a strong negative correlation between the obesity rate and land price. (C) Songpa-Gu had the highest negative correlation between the obesity rate and health budget. Adjacent areas such as Gandong-Gu, Gangnam-Gu, and Seocho-Gu also showed similar correlations to Songpa-Gu. (D) All gu-districts depicted a consistent color, reflecting that their correlation coefficients lie within the 0.60 to 0.65 range. This suggests a similar positive correlation between bus utilization rate and obesity rate across all districts. (E) Unlike bus utilization rate, bus utilization rate during rush hour was negatively correlated with obesity. However, the correlation coefficients were relatively small, with the highest and lowest values being −0.32 and −0.12, respectively. (F) The spatial correlation between bicycle utilization rate and obesity rate showed a negative relationship across all gu-districts. Among them, Gangnam-Gu exhibited the strongest negative correlation. Spatially, the neighboring areas around the district also had a similarly high negative correlation.
4. Discussion
4.1. Overview of study approach and findings
This study aimed to develop a machine learning model to discriminate obesity and extract significant influential individual factors using the SHAP algorithm and to derive obesity-related social/environmental factors from GWLASSO. The community health survey and credit card use data were employed to identify individual factors, while Seoul open data were used to determine social/environmental factors. Regarding individual factors, the random forest algorithm was selected by evaluating performance in the community health survey data. All individual data were used to train and validate the random forest algorithm after preprocessing to integrate the coding types, remove outliers, and normalize the data. The SHAP algorithm determined the individual-related feature importance by calculating the contribution of each feature to the prediction. Additionally, the GWLASSO identified the social/environmental factors influencing obesity by considering the spatial relationships of each district. The main findings showed that: (1) the trained model with the random forest algorithm yielded an accuracy of 90% (SD = 3%) for discriminating obesity. (2) The most influential individual factors were “weight control experience,” “fast food intake,” “Sex: male/female,” “high blood pressure experience,” “household income,” “sleep duration,” and “level of education.” (3) The GWLASSO revealed that obesity was negatively correlated with “green park area per individual,” “official land price,” “personal health budget,” “bus utilization rate during rush hour,” and “bicycle utilization rate,” in contrast to “bus utilization rate,” which positively correlated with obesity.
The random forest model trained by using survey data successfully predicted obesity with an accuracy exceeding 90%. Several studies have been performed to develop statistical and machine learning models to predict obesity. Dugan et al. developed a Naïve Bayes machine learning model that was trained and validated using clinical data (49). The accuracy of the trained model was 85%. Similar to the present study, a random forest algorithm was used to develop an obesity prediction model. The model was trained by using a dataset related to the participants’ demographic data and predicted obesity with an accuracy of 90% (69). Hammond et al. used electronic health records to develop a machine-learning model to classify childhood obesity (70). The accuracy of the model was 82% for girls and 76% for boys (70). The performance of the obesity prediction model in the present study was comparable to or better than those reported in previous studies. This suggests that a model trained by using open public data can reasonably predict obesity.
4.2. Individual factors identified by the SHAP algorithm
The SHAP algorithm was employed to address the non-interpretable nature of the machine learning model, revealing the elements that significantly contribute to obesity classification. Notably, the most influential individual factor for obesity classification, according to the SHAP results, was ‘self-awareness of body shape’. This finding suggests that getting individuals interested in their own body shape, rather than a behavior change, is an essential element for preventing obesity. However, it is essential to approach this recommendation with sensitivity, acknowledging the body positivity movement’s emphasis on self-acceptance and mental well-being over mere physical appearance. Media and education can play important roles in promoting a comprehensive view of health (71–73). Rather than emphasizing narrow ideals of body shape, media can focus on the broader benefits of maintaining a healthy lifestyle and the intrinsic advantages of feeling good in one’s body. Educational environments can provide learning opportunities that foster an appreciation for diverse body types and the importance of mental health. Finally, individuals could develop a balanced “self-awareness of body shape” that prioritizes a healthy body shape.
Personal experiences of weight control and high blood pressure were identified as crucial factors in the development of obesity. “Weight control experience” is related to “self-awareness of body shape.” If individuals recognize their current body shape status, they can decide whether they need to control their weight. Education on healthy body shapes may encourage overweight individuals to control their weight. “High blood pressure experience” potentially leads to “weight control experience.” Obesity is considered a high-risk factor for high blood pressure (74–76). Once individuals are diagnosed with high blood pressure, physicians usually recommend weight control. Therefore, this study’s findings suggest that education regarding body shape and regular medical checks might be associated with reduced risk of obesity development.
In the results of the SHAP algorithms, “fast-food intake” and “household income” were in the top five influential factors related to obesity in 16 of the 25 districts. Previous studies reported that the prevalence of obesity increases with decreasing household income and that household income has a significant negative relationship with fast-food intake (77–79). That is, lower income is one of the main reasons for increasing fast-food intake, which contributes to the development of obesity. To address the relationship between household income and fast-food intake, knowledge transfer for the optimization of nutritional behavior should be implemented for having healthy food regardless of income.
4.3. Social/environmental factors identified by GWLASSO
The GWLASSO findings suggest that, among social/environmental factors, “green park area per individual,” “bus utilization rate during rush hour,” and “bicycle utilization rate” were negatively correlated with obesity. These factors partially represent physical activity. The green park areas were related to accessibility. Bus or bicycle use induces more physical activity than the use of one’s own vehicle. Interestingly, “bus utilization rates” were positively correlated with obesity rates across all gu-districts, in contrast to “bus utilization during rush hour”. People are more compelled to use public transportation during rush hours. This might cause “bus utilization during rush hour” to have a less pronounced relationship with income. However, general bus utilization might be more closely tied to income, a significant factor for obesity. Typically, lower income correlates with higher obesity rates. These findings support a previous study in which the decreasing obesogenic environment was an important reason for the impeding obesity epidemic (45, 80, 81). Unlike individual-related factors, social/environmental factors affect most individuals around the public transportation system or healthy living spaces while minimizing the dead zone (36). Therefore, the number of public facilities, including green parks and public transportation, should be increased to prevent obesity.
The GWLASSO results demonstrated how the social/environmental determinants of obesity varied between districts. For example, the influence of “green park area per individual” on obesity ranged widely, from a negative correlation (Nowon-Gu, r = −0.80) to a weak positive correlation (Gangnam-Gu, r = 0.04). Similarly, the impact of “health budget” on obesity also varied between a negative correlation (Songpa-Gu, r = −0.42) and a weak positive correlation (Dobong-Gu, r = 0.015). In contrast, “land prices” impeded obesity across all districts. Each district had distinct characteristics. Factors with a wide range of correlations would depend on the characteristics of each district; however, the relatively consistent factor among different districts was partially independent of the characteristics of the district. Therefore, this finding suggests that how influential factors respond to the characteristics of an area should be considered when developing obesity-prevention policies or programs.
4.4. Combined influence of individual and social/environmental factors on obesity
Interpreting the combined influence of individual and social/environmental factors allows us to envision a comprehensive approach toward obesity prevention. For instance, the current study reveals an interaction between ‘bus utilization rate during rush hour’ as a social/environmental factor and ‘weight control experience’ as an individual factor. Increased bus utilization during rush hour, indicative of enhanced physical activity, associates negatively with obesity rates. This relationship presents a potential strategic initiative where promoting the benefits of public transportation usage and its link to physical activity could stimulate healthier behaviors. However, such an initiative necessitates a reliable public transportation system, underscoring the importance of strategic urban planning in fostering healthier lifestyles.
Unlike individual factors, social/environmental factors are not directly related to individual weight or BMI. This characteristic of social/environmental factors creates a challenge for the development of machine learning models. To address this limitation, social/environmental factors were mapped to the rate of obesity considering spatial relationships. Although GWLASSO revealed the relationship between social/environmental factors and obesity in each Gu district, it was limited in defining an accurate relationship between the rate of obesity and more detailed factors. The labeled social/environmental data accumulation would improve the ability of the model to identify the exact effects of social/environmental factors on obesity.
4.5. Implications for urban planning and obesity prevention strategies
In this study, we aimed to comprehensively understand the interplay between individual and social/environmental factors contributing to obesity in each district of Seoul city. By utilizing public data provided by MHOW and Seoul city, we were able to derive these contributing factors. Developing efficient and effective obesity prevention programs requires the identification of universal factors that encompass both individual and social/environmental aspects. While previous studies have reported significant individual or social/environmental obesity-related factors, integrating these results can be challenging due to the heterogeneity of each study. Our research addressed this limitation by examining both factors within the same area, thereby providing a more comprehensive understanding of obesity-related factors. This approach enables the design of targeted interventions that consider the intricate interdependencies between individual behaviors and social/environmental influences. The insights obtained by the universal factors may inform data-driven urban planning and infrastructure decisions for promoting healthier lifestyles and mitigating obesity prevalence.
4.6. Implications of the COVID-19 pandemic and recovery on obesity prevention
The global health crisis presented by the COVID-19 pandemic has had multifaceted impacts on public health, of which obesity is a significant concern (82–84). Previous studies have suggested that the pandemic exacerbated the pre-existing obesity trends due to various factors. First, lockdown measures and movement restrictions led to limited access to gyms, parks, and other recreational areas. The reduced access to public spaces led to a shift in behavioral patterns toward decreased physical activity (85–87). Moreover, disruptions to supply chains affected the availability and cost of fresh and nutritious foods, potentially leading to increased consumption of convenient and calorie-dense foods (88, 89). Economic uncertainties and pandemic-related stress have also been linked with unhealthy dietary choices and overeating.
While our study dealt with data from the pre-COVID era, the machine learning models and approaches developed here could be instrumental in understanding the post-pandemic obesity landscape. The SHAP algorithm and the GWLASSO can provide insights into new individual and environmental factors contributing to obesity in the pandemic. For instance, patterns of fast-food intake and household income dynamics might have further evolved during this period. Similarly, the significance of public spaces, such as green parks, has become more evident when considering how the limitations on outdoor activities affect obesity rates.
As cities adapt to the “new normal” post-pandemic, it is essential to consider these changing dynamics in obesity prevention strategies. The interplay between individual behaviors, social shifts, and environmental factors, as illustrated by our models, offers an integrated viewpoint that can inform future urban planning and health interventions. Emphasizing the importance of public spaces for physical activity, fostering resilience through community-driven initiatives, and developing awareness campaigns on healthy dietary habits tailored to specific factors are potential strategies to counteract the increased obesity epidemic.
4.7. Limitations and future directions of the study
Our study has successfully identified various social and environmental factors associated with obesity in Seoul City, and provided insights into how these factors interact spatially. Despite these contributions, several limitations exist within the study. First, our data was limited to datasets available up to 2019, which might not fully capture more recent trends in obesity-related factors. Factors affecting obesity rates are subject to change over time, influenced by the growth of social networking services and generational shifts in attitudes toward obesity. To devise the most efficient obesity prevention programs, it is essential to investigate risk factors using the most current resources available. Second, methodologically, the choice of machine learning algorithms and feature selection processes could have impacted the results, as different approaches might yield different outcomes. Future research should explore alternative machine learning and feature selection methods to obtain more reliable results. Lastly, the Euclidean distance used in the GWLASSO analysis might not accurately reflect the actual distance between Gu districts, because it does not account for transportation networks, topography, or other geographical barriers. In the future, analyzing data at finer spatial scales is necessary for improved accuracy.
5. Conclusion
This study utilized machine learning approaches to discriminate obesity and identify significant individual and social/environmental factors influencing each Gu district in Seoul by using public and open data. In addition to traditional machine-learning approaches, this study determined individual factors’ contribution to obesity using the SHAP algorithm. Furthermore, spatially dependent relationships between obesity and social/environmental factors were derived based on GWLASSO, which overcame the limitation of social/environmental factors not being labeled. This study’s findings contribute to the development of a more efficient obesity prevention program by suggesting the most significant individual and social/environmental obesity-related factors for each Gu district. This study’s findings are expected to facilitate the combination of individual-based programs with social/environment-based programs and contribute to the development of more effective and efficient obesity prevention programs.
Data availability statement
The raw data supporting the conclusions of this article will be made available by the authors, without undue reservation.
Author contributions
SJ: Conceptualization, Visualization, Writing – original draft. SY: Formal analysis, Investigation, Methodology, Validation, Writing – review & editing. SP: Funding acquisition, Project administration, Resources, Supervision, Writing – review & editing. SM: Conceptualization, Funding acquisition, Project administration, Resources, Supervision, Writing – review & editing.
Funding
The author(s) declare financial support was received for the research, authorship, and/or publication of this article. This research was partly funded by the National Research Foundation of Korea (NRF) grant funded by the Korea Government (MSIT) (No. NRF-2022R1C1C1010458, Cross Bio-Sensing System for the Future XR Interface, 50%), and Korea Institute of Police Technology (KIPoT) grant funded by the Korean government (KNPA) (No. 092021C26S02000, Development of Transportation Safety Infrastructure Technology for Lb.4 Connected Autonomous Driving, 50%).
Conflict of interest
The authors declare that the research was conducted in the absence of any commercial or financial relationships that could be construed as a potential conflict of interest.
Publisher’s note
All claims expressed in this article are solely those of the authors and do not necessarily represent those of their affiliated organizations, or those of the publisher, the editors and the reviewers. Any product that may be evaluated in this article, or claim that may be made by its manufacturer, is not guaranteed or endorsed by the publisher.
References
1. World health organization. Obesity and overweight. (2021). Available at: https://www.who.int/news-room/fact-sheets/detail/obesity-and-overweight.
2. Nam, GE, Kim, Y-H, Han, K, Jung, J-H, Rhee, E-J, and Lee, W-Y. Obesity fact sheet in Korea, 2020: prevalence of obesity by obesity class from 2009 to 2018. J Obes Metab Syndr. (2021) 30:141–8. doi: 10.7570/jomes21056
3. Juonala, M, Magnussen, CG, Berenson, GS, Venn, A, Burns, TL, Sabin, MA, et al. Childhood adiposity, adult adiposity, and cardiovascular risk factors. N Engl J Med. (2011) 365:1876–85. doi: 10.1056/NEJMoa1010112
4. Twig, G, Yaniv, G, Levine, H, Leiba, A, Goldberger, N, Derazne, E, et al. Body-mass index in 2.3 million adolescents and cardiovascular death in adulthood. N Engl J Med. (2016) 374:2430–40. doi: 10.1056/NEJMoa1503840
5. Liang, Y, Hou, D, Zhao, X, Wang, L, Hu, Y, Liu, J, et al. Childhood obesity affects adult metabolic syndrome and diabetes. Endocrine. (2015) 50:87–92. doi: 10.1007/s12020-015-0560-7
6. Apovian, CM. The obesity epidemic–understanding the disease and the treatment. N Engl J Med. (2016) 374:177–9. doi: 10.1056/NEJMe1514957
7. Heymsfield, SB, and Wadden, TA. Mechanisms, pathophysiology, and management of obesity. N Engl J Med. (2017) 376:254–66. doi: 10.1056/NEJMra1514009
8. Jakobsen, GS, Småstuen, MC, Sandbu, R, Nordstrand, N, Hofsø, D, Lindberg, M, et al. Association of bariatric surgery vs medical obesity treatment with long-term medical complications and obesity-related comorbidities. JAMA. (2018) 319:291–301. doi: 10.1001/jama.2017.21055
9. Haddock, CK, Poston, WSC, Dill, PL, Foreyt, JP, and Ericsson, M. Pharmacotherapy for obesity: a quantitative analysis of four decades of published randomized clinical trials. Int J Obes. (2002) 26:262–73. doi: 10.1038/sj.ijo.0801889
10. Hendricks, EJ, Greenway, FL, Westman, EC, and Gupta, AK. Blood pressure and heart rate effects, weight loss and maintenance during long-term phentermine pharmacotherapy for obesity. Obesity. (2011) 19:2351–60. doi: 10.1038/oby.2011.94
11. Hampp, C, Kang, EM, and Borders-Hemphill, V. Use of prescription antiobesity drugs in the United States. Pharmacotherapy. (2013) 33:1299–307. doi: 10.1002/phar.1342
12. Munro, JF, MacCuish, AC, Wilson, EM, and Duncan, LJ. Comparison of continuous and intermittent anorectic therapy in obesity. Br Med J. (1968) 1:352–4. doi: 10.1136/bmj.1.5588.352
13. Sjöström, L, Rissanen, A, Andersen, T, Boldrin, M, Golay, A, Koppeschaar, HPF, et al. Randomised placebo-controlled trial of orlistat for weight loss and prevention of weight regain in obese patients. Lancet. (1998) 352:167–72. doi: 10.1016/S0140-6736(97)11509-4
14. Davidson, MH, Hauptman, J, DiGirolamo, M, Foreyt, JP, Halsted, CH, Heber, D, et al. Weight control and risk factor reduction in obese subjects treated for 2 years with orlistat: a randomized controlled trial. JAMA. (1999) 281:235–42. doi: 10.1001/jama.281.3.235
15. Hauptman, J, Lucas, C, Boldrin, MN, Collins, H, and Segal, KR. Orlistat in the long-term treatment of obesity in primary care settings. Arch Fam Med. (2000) 9:160–7. doi: 10.1001/archfami.9.2.160
16. Rössner, S, Sjöström, L, Noack, R, Meinders, AE, and Noseda, G. Weight loss, weight maintenance, and improved cardiovascular risk factors after 2 years treatment with orlistat for obesity. European Orlistat Obesity Study Group. Obes Res. (2000) 8:49–61. doi: 10.1038/oby.2000.8
17. Sjöström, L. Bariatric surgery and reduction in morbidity and mortality: experiences from the SOS study. Int J Obes. (2008) 32:S93–7. doi: 10.1038/ijo.2008.244
18. Mingrone, G, Panunzi, S, De Gaetano, A, Guidone, C, Iaconelli, A, Leccesi, L, et al. Bariatric surgery versus conventional medical therapy for type 2 diabetes. N Engl J Med. (2012) 366:1577–85. doi: 10.1056/NEJMoa1200111
19. Schauer, PR, Kashyap, SR, Wolski, K, Brethauer, SA, Kirwan, JP, Pothier, CE, et al. Bariatric surgery versus intensive medical therapy in obese patients with diabetes. N Engl J Med. (2012) 366:1567–76. doi: 10.1056/NEJMoa1200225
20. Carlsson, LMS, Peltonen, M, Ahlin, S, Anveden, Å, Bouchard, C, Carlsson, B, et al. Bariatric surgery and prevention of type 2 diabetes in Swedish obese subjects. N Engl J Med. (2012) 367:695–704. doi: 10.1056/NEJMoa1112082
21. Smits, MM, and Van Raalte, DH. Safety of semaglutide. Front Endocrinol (Lausanne). (2021) 12:645563. doi: 10.3389/fendo.2021.645563
22. Chanoine, J-P, Hampl, S, Jensen, C, Boldrin, M, and Hauptman, J. Effect of orlistat on weight and body composition in obese adolescents: a randomized controlled trial. JAMA. (2005) 293:2873–83. doi: 10.1001/jama.293.23.2873
23. Greenway, FL, Fujioka, K, Plodkowski, RA, Mudaliar, S, Guttadauria, M, Erickson, J, et al. Effect of naltrexone plus bupropion on weight loss in overweight and obese adults (COR-I): a multicentre, randomised, double-blind, placebo-controlled, phase 3 trial. Lancet. (2010) 376:595–605. doi: 10.1016/S0140-6736(10)60888-4
24. Chao, AM, Wadden, TA, Berkowitz, RI, Quigley, K, and Silvestry, F. The risk of cardiovascular complications with current obesity drugs. Expert Opin Drug Saf. (2020) 19:1095–104. doi: 10.1080/14740338.2020.1806234
25. Petridou, A, Siopi, A, and Mougios, V. Exercise in the management of obesity. Metabolism. (2019) 92:163–9. doi: 10.1016/j.metabol.2018.10.009
26. Kushner, RF. Weight loss strategies for treatment of obesity: lifestyle management and pharmacotherapy. Prog Cardiovasc Dis. (2018) 61:246–52. doi: 10.1016/j.pcad.2018.06.001
27. Swift, DL, McGee, JE, Earnest, CP, Carlisle, E, Nygard, M, and Johannsen, NM. The effects of exercise and physical activity on weight loss and maintenance. Prog Cardiovasc Dis. (2018) 61:206–13. doi: 10.1016/j.pcad.2018.07.014
28. Barnett, TA, Contreras, G, Ghenadenik, AE, Zawaly, K, Van Hulst, A, Mathieu, M-È, et al. Identifying risk profiles for excess sedentary behaviour in youth using individual, family and neighbourhood characteristics. Prev Med Rep. (2021) 24:101535. doi: 10.1016/j.pmedr.2021.101535
29. Blüher, M. Obesity: global epidemiology and pathogenesis. Nat Rev Endocrinol. (2019) 15:288–98. doi: 10.1038/s41574-019-0176-8
30. De Bont, J, Márquez, S, Fernández-Barrés, S, Warembourg, C, Koch, S, Persavento, C, et al. Urban environment and obesity and weight-related behaviours in primary school children. Environ Int. (2021) 155:106700. doi: 10.1016/j.envint.2021.106700
31. Fernández-Barrés, S, Robinson, O, Fossati, S, Márquez, S, Basagana, X, de Bont, J, et al. Urban environment and health behaviours in children from six European countries. Environ Int. (2022) 165:107319. doi: 10.1016/j.envint.2022.107319
32. Jia, P, Pan, X, Liu, F, He, P, Zhang, W, Liu, L, et al. Land use mix in the neighbourhood and childhood obesity. Obes Rev. (2021) 22:e13098. doi: 10.1111/obr.13098
33. Pan, X-F, Wang, L, and Pan, A. Epidemiology and determinants of obesity in China. Lancet Diabetes Endocrinol. (2021) 9:373–92. doi: 10.1016/S2213-8587(21)00045-0
34. Wang, Z, Zhao, L, Huang, Q, Hong, A, Yu, C, Xiao, Q, et al. Traffic-related environmental factors and childhood obesity: a systematic review and meta-analysis. Obes Rev. (2021) 22:e12995. doi: 10.1111/obr.12995
35. Zou, Y, Ma, Y, Wu, Z, Liu, Y, Xu, M, Qiu, G, et al. Neighbourhood residential density and childhood obesity. Obes Rev. (2021) 22:e13037. doi: 10.1111/obr.13037
36. Weihrauch-Blüher, S, Kromeyer-Hauschild, K, Graf, C, Widhalm, K, Korsten-Reck, U, Jödicke, B, et al. Current guidelines for obesity prevention in childhood and adolescence. Obes Facts. (2018) 11:263–76. doi: 10.1159/000486512
37. Fiorito, LM, Marini, M, Francis, LA, Smiciklas-Wright, H, and Birch, LL. Beverage intake of girls at age 5 y predicts adiposity and weight status in childhood and adolescence. Am J Clin Nutr. (2009) 90:935–42. doi: 10.3945/ajcn.2009.27623
38. Haynos, AF, and O’Donohue, WT. Universal childhood and adolescent obesity prevention programs: review and critical analysis. Clin Psychol Rev. (2012) 32:383–99. doi: 10.1016/j.cpr.2011.09.006
39. Kavey, RE. How sweet it is: sugar-sweetened beverage consumption, obesity, and cardiovascular risk in childhood. J Am Diet Assoc. (2010) 110:1456–60. doi: 10.1016/j.jada.2010.07.028
40. Klein, D, De Toia, D, Weber, S, Wessely, N, Koch, B, Dordel, S, et al. Effects of a low threshold health promotion intervention on the BMI in pre-school children under consideration of parental participation. E Spen Eur E J Clin Nutr Metab. (2010) 5:e125–31. doi: 10.1016/j.eclnm.2010.03.002
41. Muckelbauer, R, Libuda, L, Clausen, K, Reinehr, T, and Kersting, M. A simple dietary intervention in the school setting decreased incidence of overweight in children. Obes Facts. (2009) 2:282–5. doi: 10.1159/000229783
42. Skouteris, H, DellˈAquila, D, Baur, LA, Dwyer, GM, McCabe, MP, Ricciardelli, LA, et al. Physical activity guidelines for preschoolers: a call for research to inform public health policy. Med J Aust. (2012) 196:174–6. doi: 10.5694/mja11.11015
43. Tremblay, MS, LeBlanc, AG, Carson, V, Choquette, L, Connor Gorber, S, Dillman, C, et al. Canadian physical activity guidelines for the early years (aged 0–4 years). Appl Physiol Nutr Metab. (2012) 37:345–56. doi: 10.1139/h2012-018
44. Lange, D, Wahrendorf, M, Siegrist, J, Plachta-Danielzik, S, Landsberg, B, and Müller, MJ. Associations between neighbourhood characteristics, body mass index and health-related behaviours of adolescents in the Kiel obesity prevention study: a multilevel analysis. Eur J Clin Nutr. (2011) 65:711–9. doi: 10.1038/ejcn.2011.21
45. Gose, M, Plachta-Danielzik, S, Willié, B, Johannsen, M, Landsberg, B, and Müller, MJ. Longitudinal influences of neighbourhood built and social environment on children’s weight status. Int J Environ Res Public Health. (2013) 10:5083–96. doi: 10.3390/ijerph10105083
46. González-Muniesa, P, Mártinez-González, MA, Hu, FB, Després, JP, Matsuzawa, Y, Loos, RJF, et al. Obesity. Nat Rev Dis Primers. (2017) 3:17034. doi: 10.1038/nrdp.2017.34
47. Larqué, E, Labayen, I, Flodmark, C-E, Lissau, I, Czernin, S, Moreno, LA, et al. From conception to infancy—early risk factors for childhood obesity. Nat Rev Endocrinol. (2019) 15:456–78. doi: 10.1038/s41574-019-0219-1
48. Sweeting, HN. Measurement and definitions of obesity in childhood and adolescence: a field guide for the uninitiated. Nutr J. (2007) 6:1–8. doi: 10.1186/1475-2891-6-32
49. Dugan, TM, Mukhopadhyay, S, Carroll, A, and Downs, S. Machine learning techniques for prediction of early childhood obesity. Appl Clin Inform. (2015) 6:506–20. doi: 10.4338/ACI-2015-03-RA-0036
50. Gerl, MJ, Klose, C, Surma, MA, Fernandez, C, Melander, O, Männistö, S, et al. Machine learning of human plasma lipidomes for obesity estimation in a large population cohort. PLoS Biol. (2019) 17:e3000443. doi: 10.1371/journal.pbio.3000443
51. Singh, B, and Tawfik, H. Machine learning approach for the early prediction of the risk of overweight and obesity in young people. International Conference on Computational Science. Springer, pp. 523–535. (2020).
52. Aumann, RJ, and Myerson, RB. Endogenous formation of links between players and of coalitions: an application of the Shapley value In: B Dutta and MO Jackson, editors. Networks and Groups. Berlin: Springer (2003). 207–20.
53. Fréchette, A, Kotthoff, L, Michalak, T, Rahwan, T, Hoos, H, and Leyton-Brown, K. Using the shapley value to analyze algorithm portfolios. Proc AAAI Conf Artif Intell. (2016) 30:10440. doi: 10.1609/aaai.v30i1.10440
54. Setiyorini, A, Suprijadi, J, and Handoko, B. Implementations of geographically weighted lasso in spatial data with multicollinearity (case study: poverty modeling of Java Island). AIP conference Proceedings. AIP Publishing LLC, p. 020003. (2017).
55. Chooi, YC, Ding, C, and Magkos, F. The epidemiology of obesity. Metabolism. (2019) 92:6–10. doi: 10.1016/j.metabol.2018.09.005
56. Kansra, AR, Lakkunarajah, S, and Jay, MS. Childhood and adolescent obesity: a review. Front Pediatr. (2021) 8:866. doi: 10.3389/fped.2020.581461
57. Lin, X, and Li, H. Obesity: epidemiology, pathophysiology, and therapeutics. Front Endocrinol (Lausanne). (2021) 12:706978. doi: 10.3389/fendo.2021.706978
58. Bohnert, AM, Loren, DM, and Miller, AL. Examining childhood obesity through the lens of developmental psychopathology: framing the issues to guide best practices in research and intervention. Am Psychol. (2020) 75:163–77. doi: 10.1037/amp0000581
59. Zare, H, Gilmore, DR, Meyerson, NS, and Thorpe, RJ Jr. Income inequality, race/ethnicity, and obesity in US men 20 years and older: 1999 to 2016. Am J Mens Health. (2022) 16:1238. doi: 10.1177/15579883221123852
60. Powell-Wiley, TM, Cooper-McCann, R, and Ayers, C. Change in neighborhood socioeconomic status and weight gain: Dallas heart study. Am J Prev Med. (2022) 49:72–9. doi: 10.1016/j.amepre.2015.01.013
61. Robert, SA, and Reither, EN. A multilevel analysis of race, community disadvantage, and body mass index among adults in the US. Soc Sci Med. (2004) 59:2421–34. doi: 10.1016/j.socscimed.2004.03.034
62. Ruel, E, Reither, EN, Robert, SA, and Lantz, PM. Neighborhood effects on BMI trends: examining BMI trajectories for black and white women. Health Place. (2010) 16:191–8. doi: 10.1016/j.healthplace.2009.09.009
63. O’Brien, RM. A caution regarding rules of thumb for variance inflation factors. Qual Quant. (2007) 41:673–90. doi: 10.1007/s11135-006-9018-6
64. Kim, JH. Multicollinearity and misleading statistical results. Korean J Anesthesiol. (2019) 72:558–69. doi: 10.4097/kja.19087
66. Mangalathu, S, Hwang, S-H, and Jeon, J-S. Failure mode and effects analysis of RC members based on machine-learning-based SHapley additive exPlanations (SHAP) approach. Eng Struct. (2020) 219:110927. doi: 10.1016/j.engstruct.2020.110927
67. Lundberg, SM, and Lee, S-I. A unified approach to interpreting model predictions. Adv Neural Inf Process Syst. (2017) 30:16115. doi: 10.48550/arXiv.1705.07874
68. Wheeler, DC. Simultaneous coefficient penalization and model selection in geographically weighted regression: the geographically weighted lasso. Environ Plan A. (2009) 41:722–42. doi: 10.1068/a40256
69. Jindal, K, Baliyan, N, and Rana, PS. Obesity prediction using ensemble machine learning approaches In: K Jindal, editor. Recent findings in intelligent computing techniques. Berlin: Springer (2018). 355–62. doi: 10.1007/978-981-10-8636-6_37
70. Hammond, R, Athanasiadou, R, Curado, S, Aphinyanaphongs, Y, Abrams, C, Messito, MJ, et al. Correction: predicting childhood obesity using electronic health records and publicly available data. PLoS One. (2019) 14:e0223796. doi: 10.1371/journal.pone.0223796
71. Cwynar-Horta, J. The commodification of the body positive movement on Instagram. Stream. (2016) 8:36–56. doi: 10.21810/strm.v8i2.203
72. Cohen, R, Irwin, L, Newton-John, T, and Slater, A. #bodypositivity: a content analysis of body positive accounts on Instagram. Body Image. (2019) 29:47–57. doi: 10.1016/j.bodyim.2019.02.007
73. Cohen, R, Fardouly, J, Newton-John, T, and Slater, A. #BoPo on Instagram: an experimental investigation of the effects of viewing body positive content on young women’s mood and body image. New Media Soc. (2019) 21:1546–64. doi: 10.1177/1461444819826530
74. Garrison, RJ, Kannel, WB, Stokes, J III, and Castelli, WP. Incidence and precursors of hypertension in young adults: the Framingham offspring study. Prev Med (Baltim). (1987) 16:235–51. doi: 10.1016/0091-7435(87)90087-9
75. Pausova, Z. From big fat cells to high blood pressure: a pathway to obesity-associated hypertension. Curr Opin Nephrol Hypertens. (2006) 15:173–8. doi: 10.1097/01.mnh.0000214775.42103.a5
76. Rahmouni, K, Morgan, DA, Morgan, GM, Mark, AL, and Haynes, WG. Role of selective leptin resistance in diet-induced obesity hypertension. Diabetes. (2005) 54:2012–8. doi: 10.2337/diabetes.54.7.2012
77. Griffith, R, Lluberas, R, and Lührmann, M. Gluttony and sloth? Calories, labor market activity and the rise of obesity. J Eur Econ Assoc. (2016) 14:1253–86. doi: 10.1111/jeea.12183
78. Martorell, R, Kettel Khan, L, Hughes, ML, and Grummer-Strawn, LM. Obesity in women from developing countries. Eur J Clin Nutr. (2000) 54:247–52. doi: 10.1038/sj.ejcn.1600931
79. Monteiro, CA, Moura, EC, Conde, WL, and Popkin, BM. Socioeconomic status and obesity in adult populations of developing countries: a review. Bull World Health Organ. (2004) 82:940–6.
80. Giles-Corti, B, Macintyre, S, Clarkson, JP, Pikora, T, and Donovan, RJ. Environmental and lifestyle factors associated with overweight and obesity in Perth. Aust Am J Health Promot. (2003) 18:93–102. doi: 10.4278/0890-1171-18.1.93
81. Swinburn, B, Egger, G, and Raza, F. Dissecting obesogenic environments: the development and application of a framework for identifying and prioritizing environmental interventions for obesity. Prev Med (Baltim). (1999) 29:563–70. doi: 10.1006/pmed.1999.0585
82. Dietz, W, and Santos-Burgoa, C. Obesity and its implications for COVID-19 mortality. Obesity. (2020) 28:1005. doi: 10.1002/oby.22818
83. Popkin, BM, Du, S, Green, WD, Beck, MA, Algaith, T, Herbst, CH, et al. Individuals with obesity and COVID-19: a global perspective on the epidemiology and biological relationships. Obes Rev. (2020) 21:e13128. doi: 10.1111/obr.13128
84. Sattar, N, McInnes, IB, and McMurray, JJV. Obesity is a risk factor for severe COVID-19 infection: multiple potential mechanisms. Circulation. (2020) 142:4–6. doi: 10.1161/CIRCULATIONAHA.120.047659
85. Ammar, A, Brach, M, Trabelsi, K, Chtourou, H, Boukhris, O, Masmoudi, L, et al. Effects of COVID-19 home confinement on eating behaviour and physical activity: results of the ECLB-COVID19 international online survey. Nutrients. (2020) 12:1583. doi: 10.3390/nu12061583
86. Tison, GH, Avram, R, Kuhar, P, Abreau, S, Marcus, GM, Pletcher, MJ, et al. Worldwide effect of COVID-19 on physical activity: a descriptive study. Ann Intern Med. (2020) 173:767–70. doi: 10.7326/M20-2665
87. Peçanha, T, Goessler, KF, Roschel, H, and Gualano, B. Social isolation during the COVID-19 pandemic can increase physical inactivity and the global burden of cardiovascular disease. American journal of physiology-heart and circulatory. Physiology. (2020) 318:H1441–6. doi: 10.1152/ajpheart.00268.2020
88. Hobbs, JE. Food supply chains during the COVID-19 pandemic. Can J Agric Econ. (2020) 68:171–6. doi: 10.1111/cjag.12237
Keywords: obesity, machine learning, SHAP, GWLASSO, influential factors
Citation: Jeong S, Yun SB, Park SY and Mun S (2023) Understanding cross-data dynamics of individual and social/environmental factors through a public health lens: explainable machine learning approaches. Front. Public Health. 11:1257861. doi: 10.3389/fpubh.2023.1257861
Edited by:
Evelyn Frias-Toral, Catholic University of Santiago de Guayaquil, EcuadorReviewed by:
Tony Kuo, University of California, Los Angeles, United StatesChristian E. Vazquez, University of Texas at Arlington, United States
Copyright © 2023 Jeong, Yun, Park and Mun. This is an open-access article distributed under the terms of the Creative Commons Attribution License (CC BY). The use, distribution or reproduction in other forums is permitted, provided the original author(s) and the copyright owner(s) are credited and that the original publication in this journal is cited, in accordance with accepted academic practice. No use, distribution or reproduction is permitted which does not comply with these terms.
*Correspondence: Soon Yong Park, cHN5QHNpdC5yZS5rcg==; Sungchul Mun, c3VuZ2NodWwubXVuQGpqLmFjLmty
†These authors have contributed equally to this work