
94% of researchers rate our articles as excellent or good
Learn more about the work of our research integrity team to safeguard the quality of each article we publish.
Find out more
ORIGINAL RESEARCH article
Front. Public Health, 18 December 2023
Sec. Public Health Policy
Volume 11 - 2023 | https://doi.org/10.3389/fpubh.2023.1251020
 Tetyana Kendzerska1,2,3*†
 David T. Zhu1,4†Michael Pugliese1,3
 Douglas Manuel1,3Mohsen Sadatsafavi5Marcus Povitz6Therese A. Stukel3,7,8Teresa To3,8,9,10Shawn D. Aaron1,2Sunita Mulpuru1,2Melanie Chin1,2Claire E. Kendall3,11,12
 Kednapa Thavorn1,3,13
 Rebecca Robillard14Andrea S. Gershon3,7,8,9,10,15
Background: The COVID-19 pandemic led to global disruptions in non-urgent health services, affecting health outcomes of individuals with ambulatory-care-sensitive conditions (ACSCs).
Methods: We conducted a province-based study using Ontario health administrative data (Canada) to determine trends in outpatient visits and hospitalization rates (per 100,000 people) in the general adult population for seven ACSCs during the first pandemic year (March 2020–March 2021) compared to previous years (2016–2019), and how disruption in outpatient visits related to acute care use. ACSCs considered were chronic obstructive pulmonary disease (COPD), asthma, angina, congestive heart failure (CHF), hypertension, diabetes, and epilepsy. We used time series auto-regressive integrated moving-average models to compare observed versus projected rates.
Results: Following an initial reduction (March–May 2020) in all types of visits, primary care outpatient visits (combined in-person and virtual) returned to pre-pandemic levels for asthma, angina, hypertension, and diabetes, remained below pre-pandemic levels for COPD, and rose above pre-pandemic levels for CHF (104.8 vs. 96.4, 95% CI: 89.4–104.0) and epilepsy (29.6 vs. 24.7, 95% CI: 22.1–27.5) by the end of the first pandemic year. Specialty visits returned to pre-pandemic levels for COPD, angina, CHF, hypertension, and diabetes, but remained above pre-pandemic levels for asthma (95.4 vs. 79.5, 95% CI: 70.7–89.5) and epilepsy (53.3 vs. 45.6, 95% CI: 41.2–50.5), by the end of the year. Virtual visit rates increased for all ACSCs. Among ACSCs, reductions in hospitalizations were most pronounced for COPD and asthma. CHF-related hospitalizations also decreased, albeit to a lesser extent. For angina, hypertension, diabetes, and epilepsy, hospitalization rates reduced initially, but returned to pre-pandemic levels by the end of the year.
Conclusion: This study demonstrated variation in outpatient visit trends for different ACSCs in the first pandemic year. No outpatient visit trends resulted in increased hospitalizations for any ACSC; however, reductions in rates of asthma, COPD, and CHF hospitalizations persisted.
The COVID-19 pandemic led to significant disruptions in the accessibility and provision of non-urgent health services in Canada and globally that affected the management and health outcomes of patients (1). Ambulatory-care-sensitive conditions (ACSCs) are health conditions for which timely access to outpatient care and effective management is known to improve prognosis and prevent emergency department (ED) visits and hospitalizations (2). Thus, inpatient visits for ACSCs are usually accepted as an indicator of the quality and accessibility of outpatient care (3).
Previous studies on the impact of the COVID-19 pandemic on the management, treatment, and care of ACSC patients were limited in several ways: they focused only on the initial parts of the pandemic (4, 5) and failed to note trends once events had settled down and became more routine; they typically focused on a specific type of health service use (i.e., ED visits or hospitalizations) without exploring how disruption in outpatient visits related to acute care use, and either examined an individual single chronic disease without comparing trends between different chronic conditions or aggregated “chronic diseases” as an outcome (6–13).
In our recent population-based study, we did not observe an increase in ED visits or hospital admission rates for all ACSCs combined in a general adult population during the first year of the pandemic, despite a reduction in outpatient visit rates at the beginning of the pandemic (12). These findings were corroborated by global trends in chronic disease health service utilization during the COVID-19 pandemic (14–18). However, we may have failed to find trends for individual diseases in our aggregate results (12) due to disease-specific healthcare needs, natural history, development, and progression (19).
Therefore, to address gaps in the literature and understand how disruption in outpatient visits related to acute care use, we conducted a province-based cohort study to compare actual (observed) and projected (counterfactual estimates based on pre-COVID-19 pandemic periods) trends in outpatient and inpatient visits for seven separate ACSCs – asthma, chronic obstructive pulmonary disease (COPD), angina, congestive heart failure (CHF), hypertension, diabetes mellitus, and epilepsy – in the general adult population. We hypothesized a steep reduction in outpatient and inpatient visits for seven separate ACSCs during the initial phase of the pandemic (March–May 2020) compared to the pre-pandemic data, followed by a slow recovery during the later phase of the pandemic. We also hypothesize variations in trends for different ACSCs.
We used provincial health administrative data from Ontario, Canada, during the first year of the COVID-19 pandemic (March 2020–March 2021) to compare to similar periods in previous years (January 2016–December 2019). Ontario is the most populous province of Canada, with a population of more than 14.5 million (20) and universal health insurance.
ICES is an independent non-profit institution and a prescribed entity under Personal Health Information Protection Act (PHIPA) in Ontario. Under section 45 of PHIPA, ICES is authorized to collect personal health information without consent to compile statistical information or analysis concerning managing, allocating resources to, monitoring, evaluating or planning for the health system. Projects that use health administrative databases collected by ICES under section 45 of PHIPA are exempt from REB review. This study was authorized under section 45 of PHIPA and approved by Privacy and Legal Office at ICES.
ICES invested in health informatics for population health and health services research and housed individual-level high-quality health administrative databases on publicly funded services, including outpatient and inpatient visits (ED visits or hospitalizations) within Ontario (21). These databases are regularly updated and validated for accuracy (22, 23).1 The Registered Persons Database (RPDB) contains data on vital statistics, demographics and residence location. The Ontario Health Insurance Plan (OHIP) database captures 95% of physician billing. The National Ambulatory Care Reporting System Database (NACRS) records ED visits. The Discharge Abstract Database (DAD) records hospitalizations, and the Canadian Census includes neighborhood socioeconomic details. The COVID-19 Integrated Testing Dataset includes all available COVID-19 diagnostic laboratory results in Ontario. In Ontario, Canada, physician billing codes in response to COVID-19 were effective since March 14, 2020, and extended until September 30, 2022 (24). These databases were linked using unique encoded identifiers. Please see Supplementary Table S1 for details on the ICES databases used.
We adopted an open-cohort design where all adult Ontario residents (18 years and older) prior to and during the COVID-19 pandemic (January 2016–March 2021) who were alive at the beginning of each month were considered for inclusion. We excluded individuals younger than 18 years old, older than 105 years old, those who are not Ontario residents and with missing information on sex. The open cohort design allows individuals to enter the cohort as they age or leave the cohort when they die or move out of the province compared to a closed cohort with a fixed membership when after it is defined and follow-up begins, no one can be added to a cohort. We selected an open- vs. a closed-cohort study design to represent a real-world situation. We considered March 17, 2020, when the state of emergency was declared in Ontario (25), as the start of the pandemic. Follow-up continued until March 31, 2021.
To avoid arbitrarily chosen categorization of the main period of interest (first year of the pandemic), observed versus projected rates with 95% confidence intervals (CIs) were visualized monthly. Only for comparisons, the main period of interest was divided into four time periods (26): (i) pre-COVID-19: January–February 2020; (ii) Wave I: March–May 2020; (iii) Summer Lull: June–August 2020; and (iv) Wave II: September 2020–March 2021.
On March 15, 2020, the Ministry of Health in Ontario requested to ramp down non-emergent clinical activities to liberate health system capacity (27). Effective March 14, 2020, temporary billing codes were introduced to allow remote outpatient sleep clinic visits to continue. After an initial increase in the number of COVID-19 cases in March–May 2020 (Wave I), a reduction was noted during June–August 2020 (Summer Lull), with a steep increase since September 2020 (Wave II) (28).
The primary outcomes were outpatient visits, ED visits, and hospitalizations, with the most responsible diagnosis for ACSCs considered separately (see Supplementary Table S2 for definition details) (29, 30). Outpatient visits were categorized by: (i) combined (virtual or in-person) primary care visits, (ii) combined (virtual or in-person) visits from a specialist with a relevant specialty (respirologist, cardiologist, endocrinologist, neurologist, internal medicine), and (ii) virtual outpatient visits. In Ontario, physician billing codes in response to the COVID-19 pandemic, including virtual visits (phone or video), were implemented on March 14, 2020, and extended until December 1, 2022 (24).
These outcomes were chosen because they reflect the acute and ambulatory care people receive for some of the most prevalent chronic diseases. We also wanted to assess how outcomes changed relative to each other to obtain a more fulsome understanding of the impact of the pandemic.
We used a similar analytic approach from our previous study of combined ACSCs patterns (12). Briefly, we aggregated data monthly to create a 63-period time series from January 2016 to March 2021 and calculated monthly rates as the number of events per 100,000 people. Auto-regressive integrated moving-average (ARIMA) modelling was used to calculate projected outcome rates based on observed monthly rates from similar periods in previous years (January 2016–December 2019). Specifically, to account for underlying trends and seasonality, ARIMA models regress a series of current observed rates on past values, fitting autoregressive and moving-average terms (31). We used SAS software’s adaption of the United States Census Bureau’s X-13ARIMA-SEATS program (X13) (32, 33), which also includes an automated model selection procedure (34). The selection procedure uses multiple algorithms to select ARIMA terms and the best fitting model using the Bayesian Information Criterion (32). Please see more details in the Data Supplement (Supplementary Text S1; Supplementary Figure S1).
The ARIMA procedure was chosen to allow for an automated model specification that would create projections taking into account secular and seasonal trends. We could then easily compare observed rates to projected rates and their 95% confidence intervals to determine how pandemic trends differed from what would be expected based on historic trends.
There is no definitive guidance on how many time points are required to apply ARIMA modelling (35). A minimum of 50 time points has been recommended (31), but this has no empirical basis and has not been tested formally. In uncomplicated cases, ARIMA can perform satisfactorily with short time series, as long as there are enough time points to estimate all parameters on the ARIMA model (36). In the presence of seasonality, there should be enough time points to identify the seasonal effects and to account for seasonal differencing. Usually, at least 4–5 years of data is recommended to forecast for 1–2 years, which was implemented in our study. More historical data also allows for greater flexibility in ARIMA model parameter selection as higher order models require more observations (36).
For each outcome, we used the best fitting model identified using the selection procedure described above to project monthly rates for 13 months following February 2020. While comparing observed vs. projected rates, we considered observed rates outside the projected 95% CIs to be significantly different (37). We graphically presented comparisons between observed and projected monthly rates as a time series. Mean rates across the four time periods were presented in tabular form.
All data analyses were performed using SAS (version 9.4 using SAS Enterprise guide version 7.15.3) following Ontario privacy standards in the secure environment at ICES.
We stratified analyses by sex and age group (18–24, 25–34, 35–49, 50–64, and 65 years and older).
In March 2020, there were 12,211,898 adults in Ontario: 51.1% females and 21.9% 65 years and older.
Variations in rates and rate ratios of outpatient visits, ED visits, and hospitalizations compared to similar periods in previous years were found between ACSC, as presented in Tables 1–4 and Supplementary Tables S4–S9. Rates of virtual outpatient visits were significantly elevated during the first year of the pandemic for all ACSCs (Tables 1, 3).
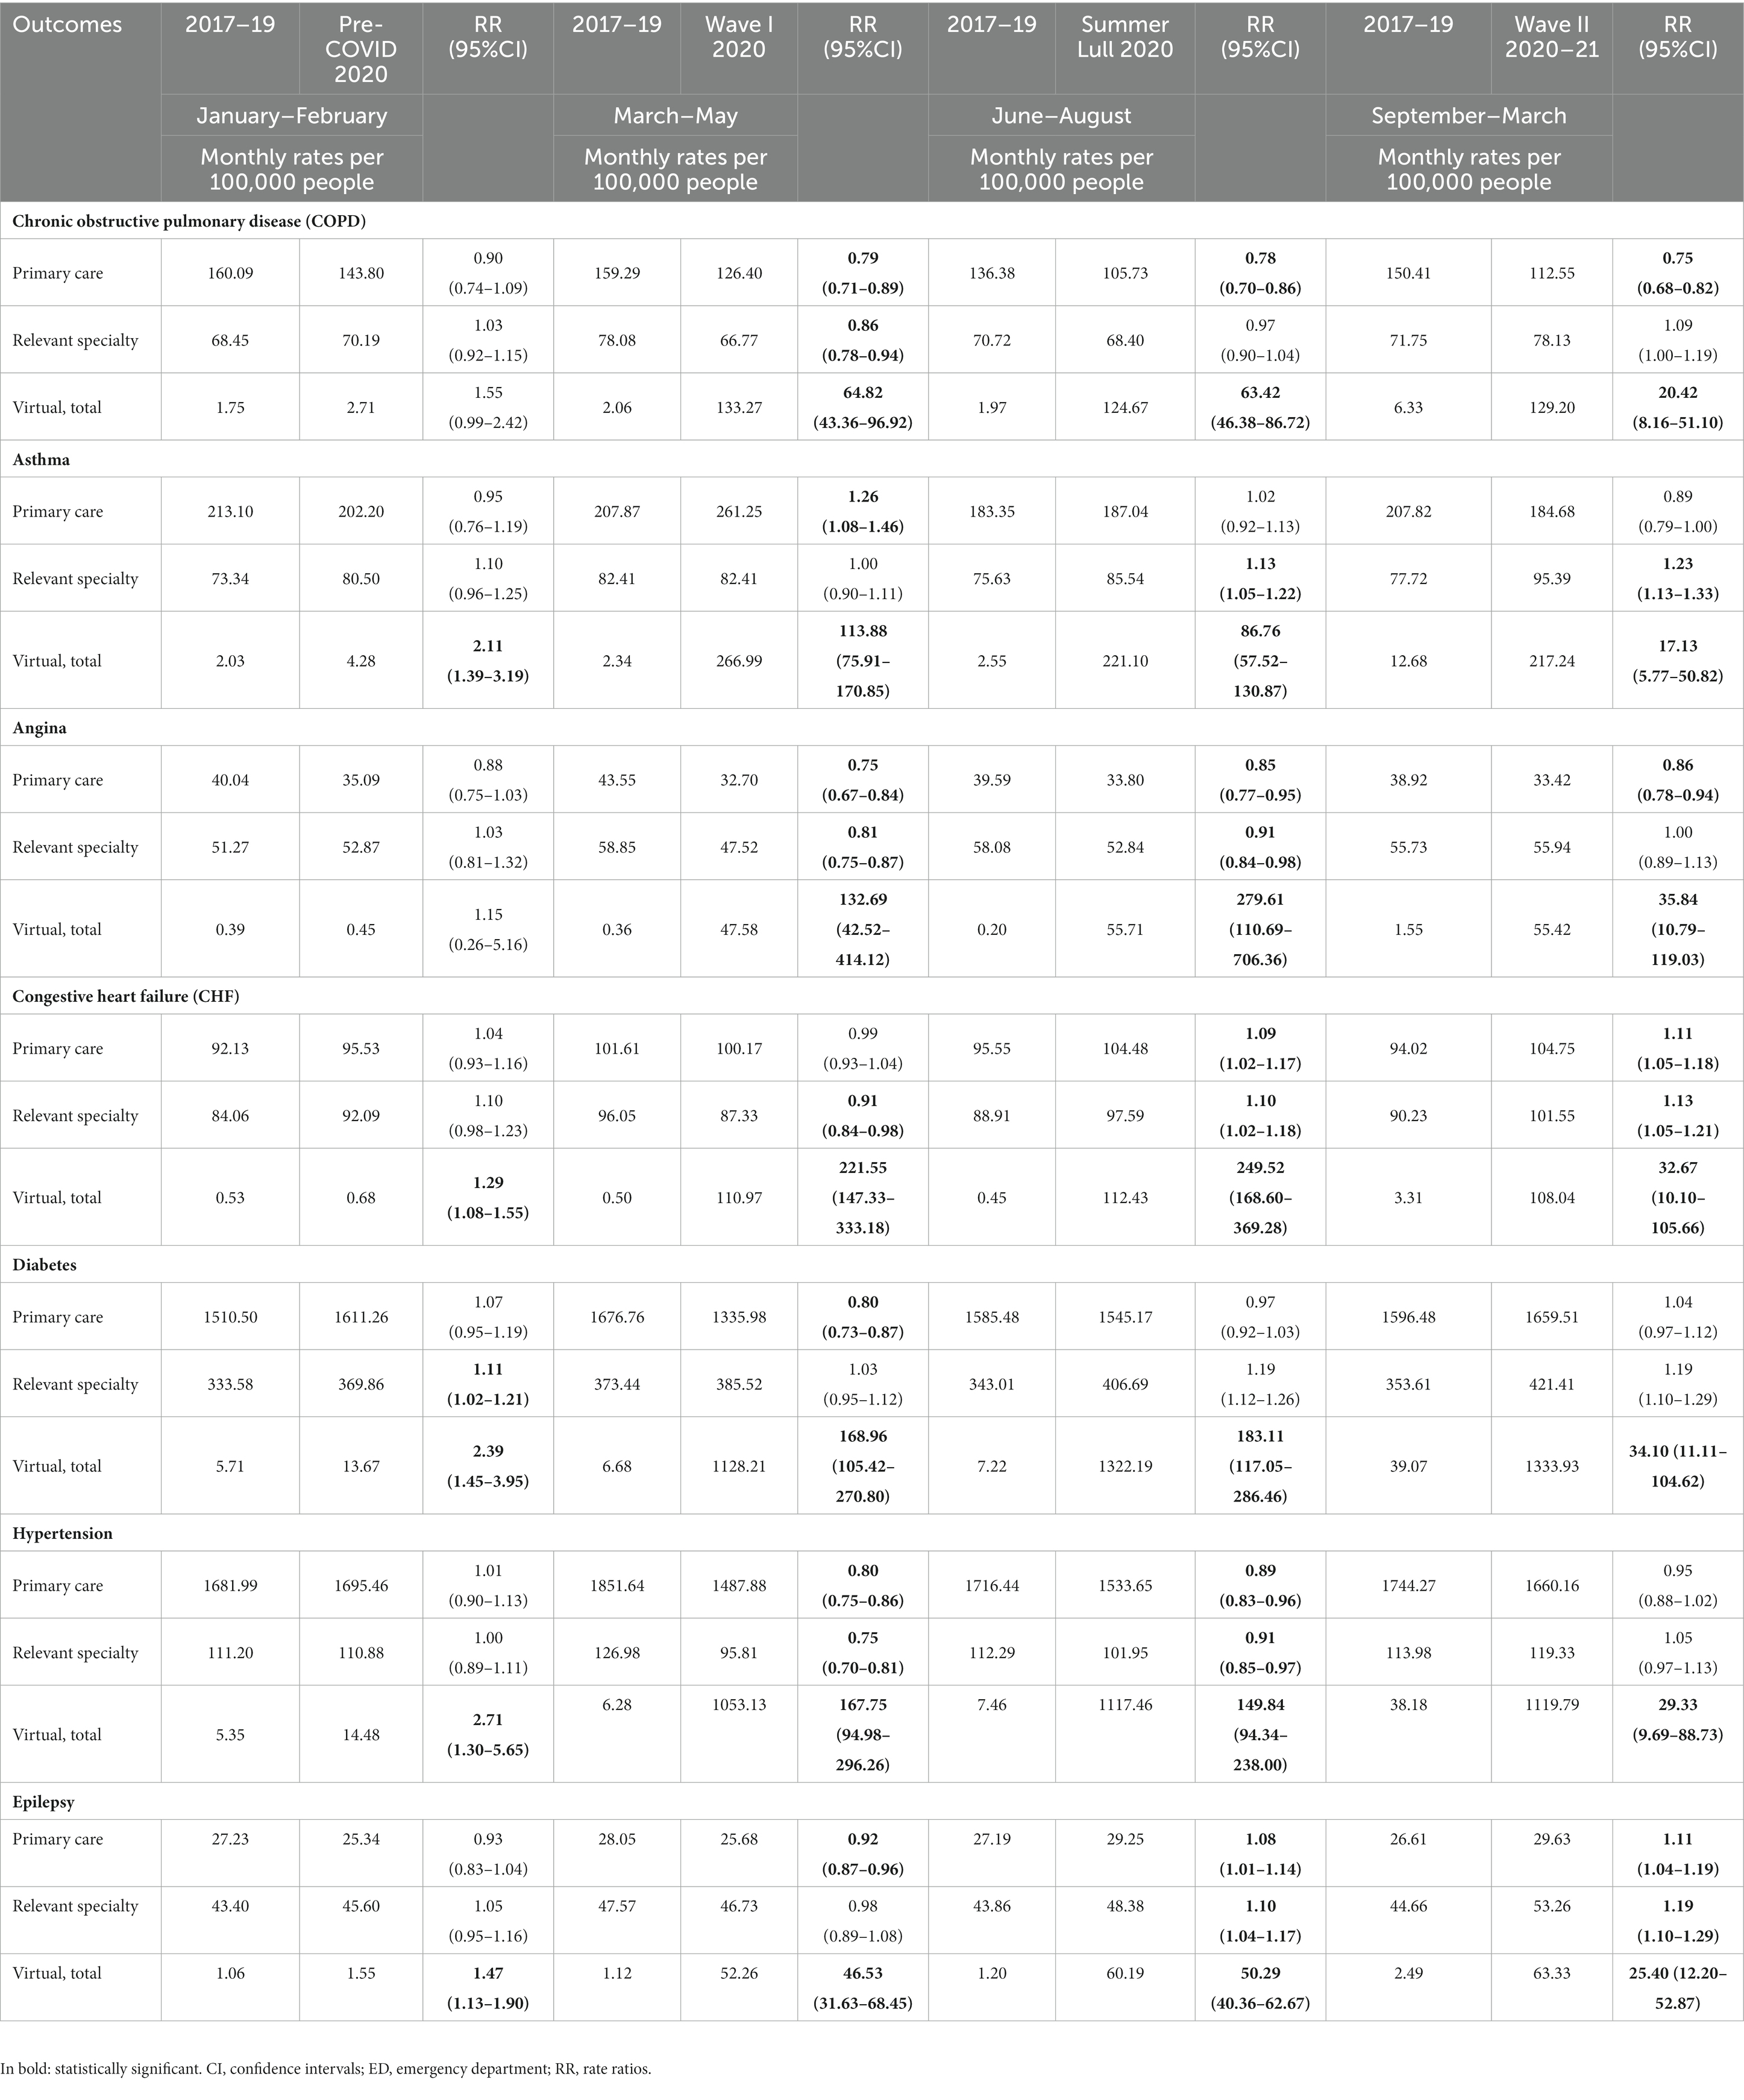
Table 1. Monthly crude rates of outpatient visits for the separate Ambulatory Care Sensitive Conditions (ACSCs) during the first year of the COVID-19 pandemic with the crude rate ratios (RR) and confidence intervals (CI) to compare to similar periods in previous years.
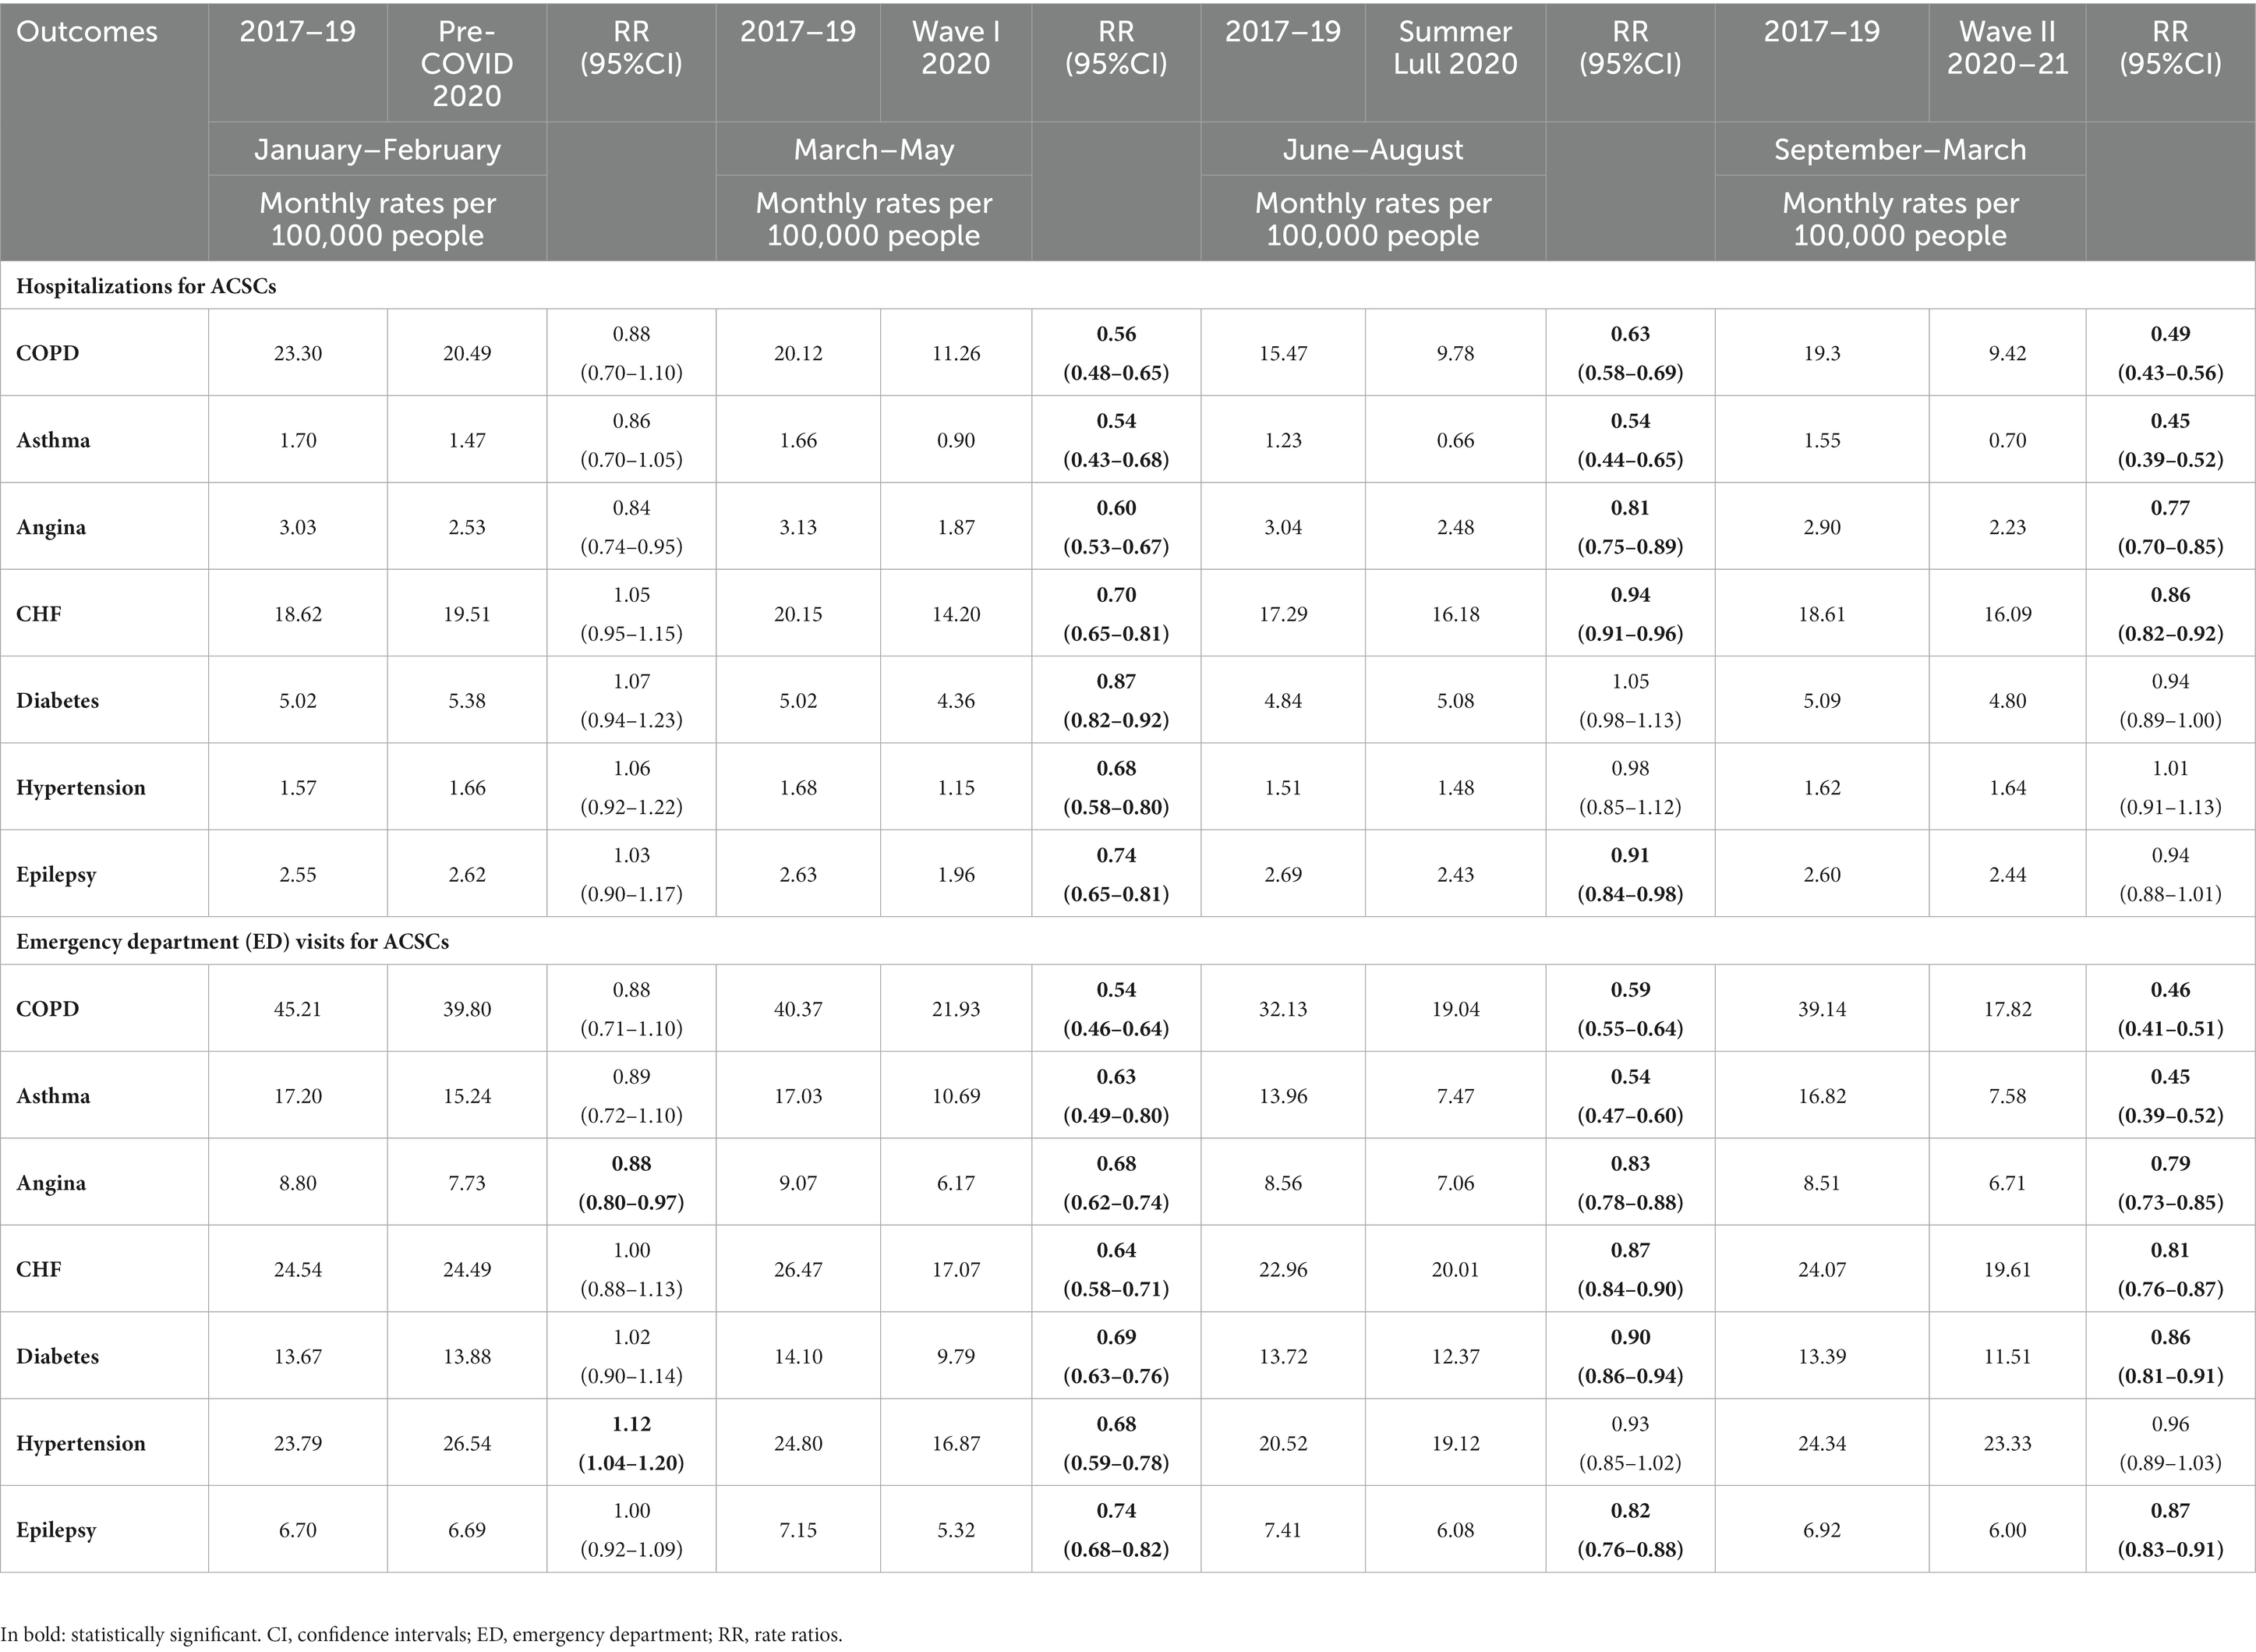
Table 2. Monthly crude rates of hospitalizations and emergency department (ED) for the separate Ambulatory Care Sensitive Conditions (ACSCs) during the first year of the COVID-19 pandemic with the crude rate ratios (RR) and confidence intervals (CI) to compare to similar periods in previous years.
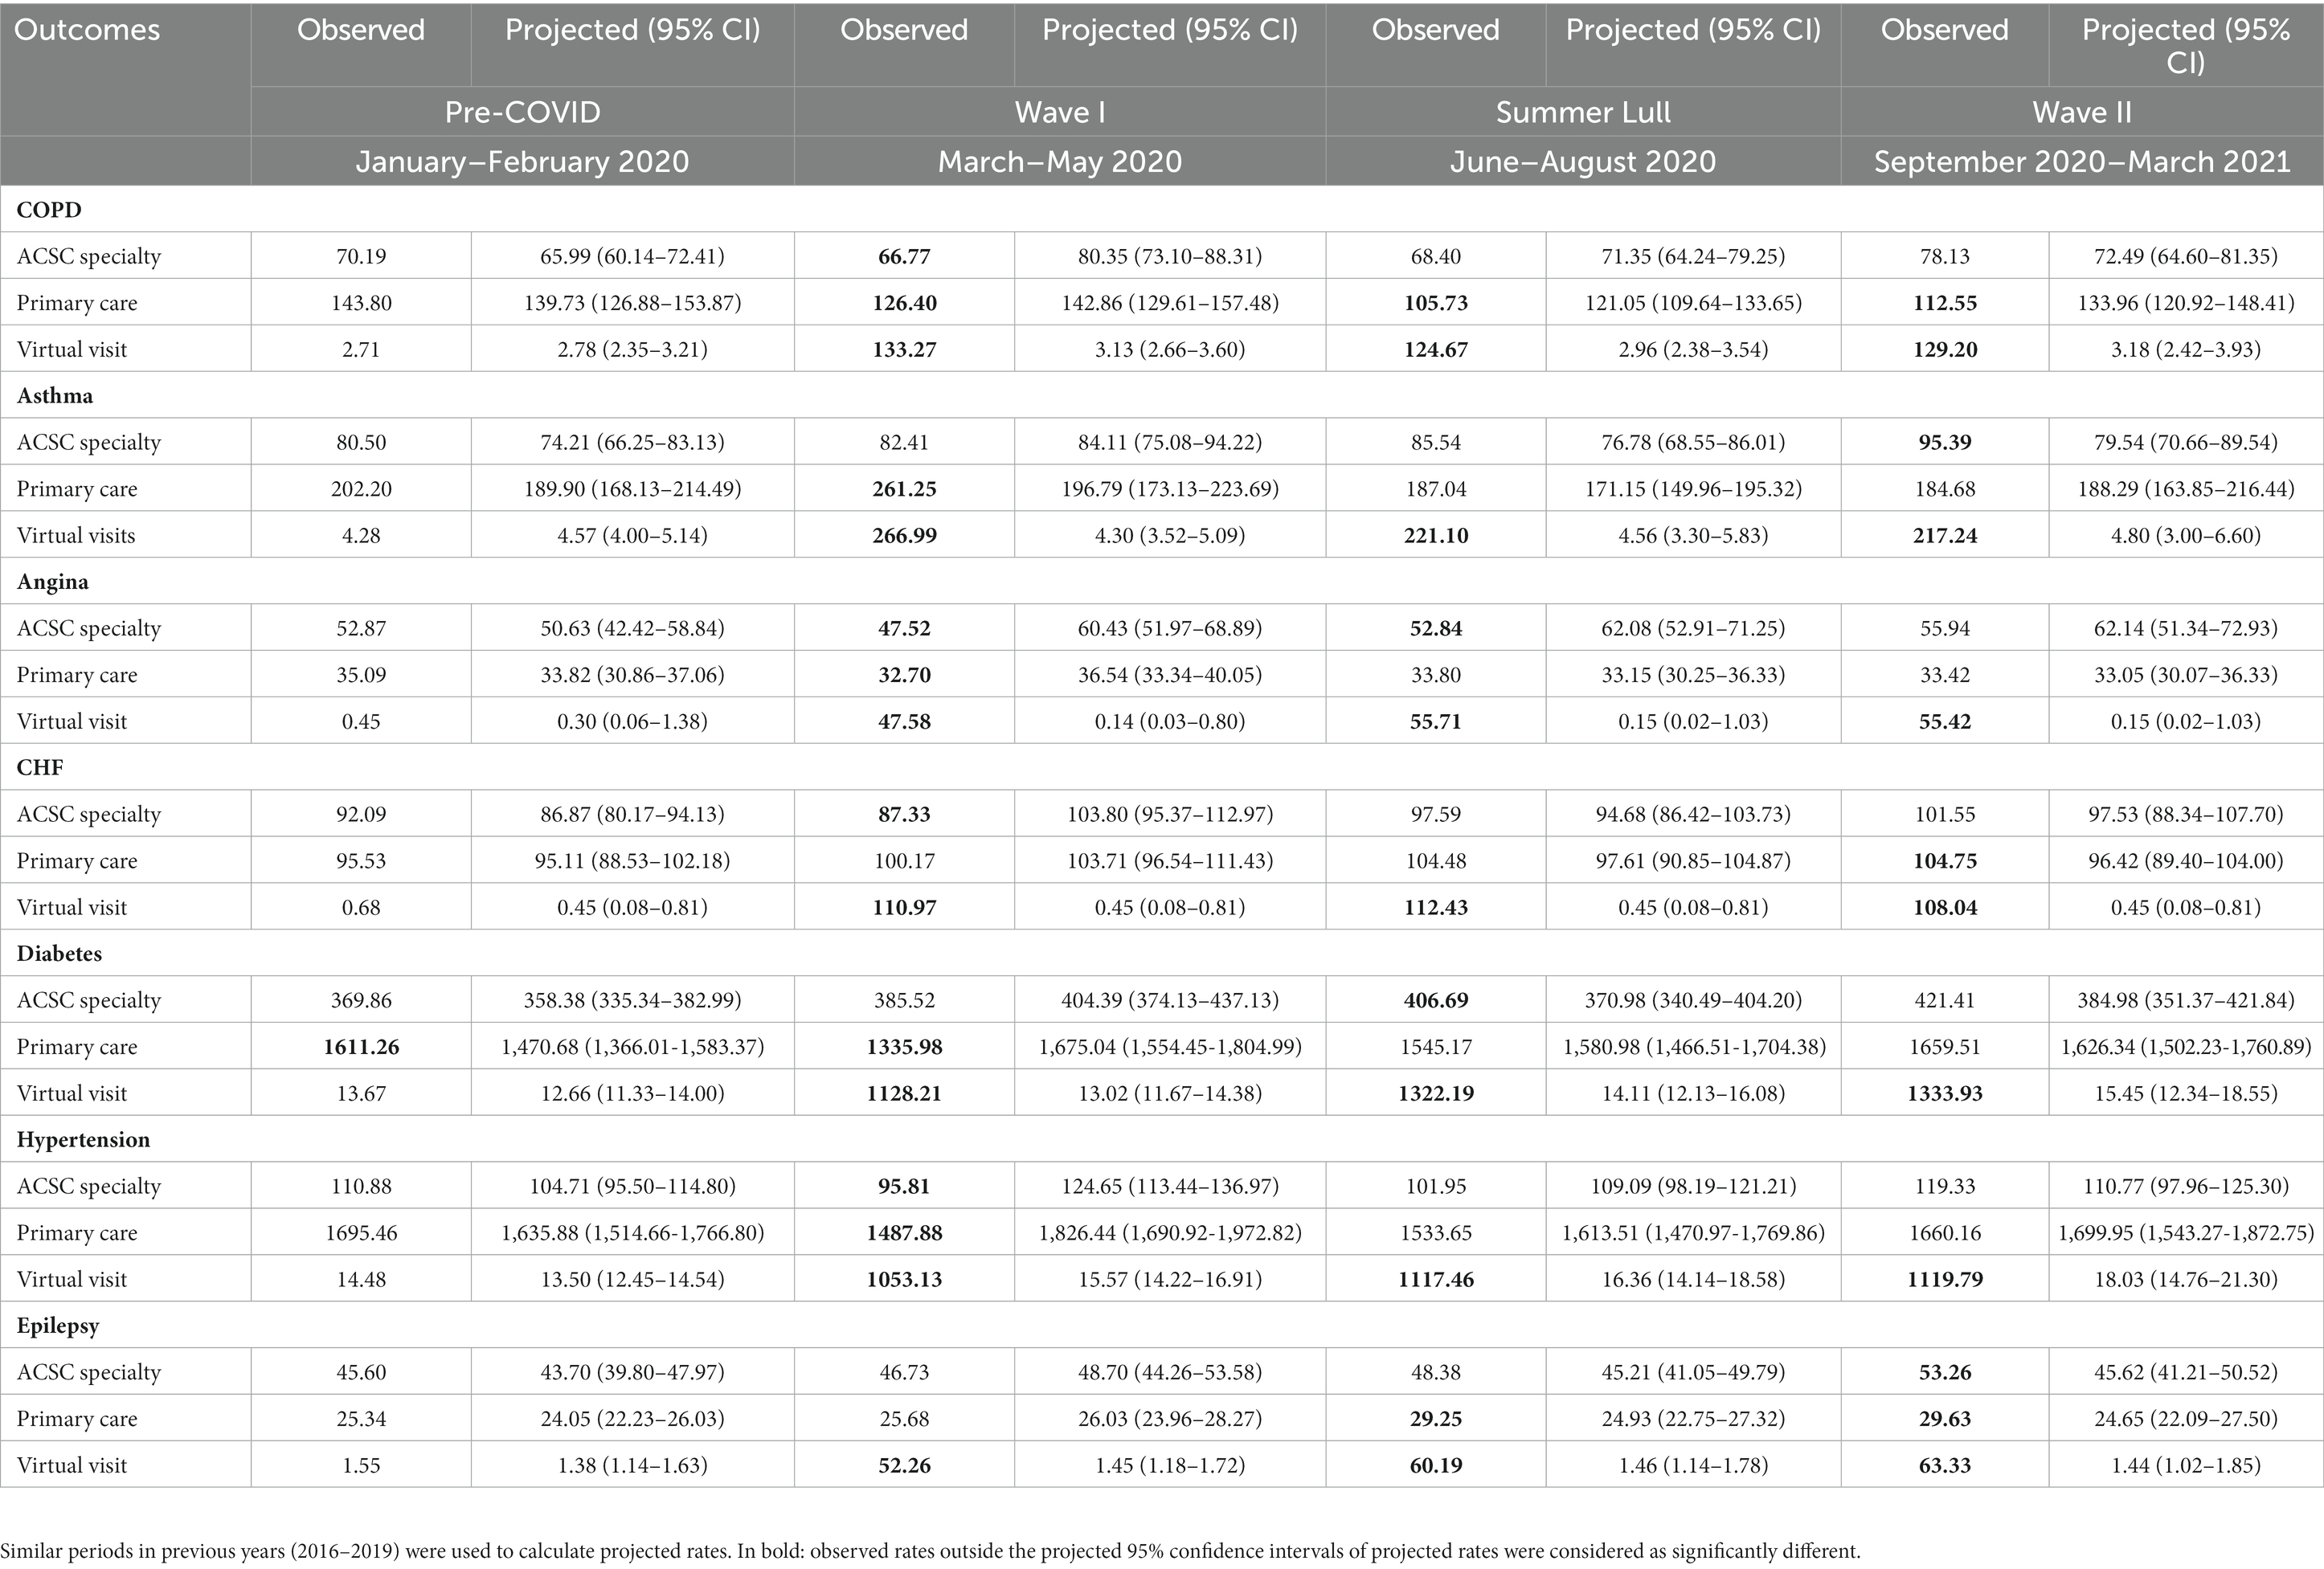
Table 3. Observed and projected monthly rates and 95% confidence intervals (CI) estimated by ARIMA Models for outpatient visits for the separate Ambulatory Care Sensitive Conditions (ACSCs) during the first year of the COVID-19 pandemic: rates were calculated as the number of events per 100,000 people at risk.
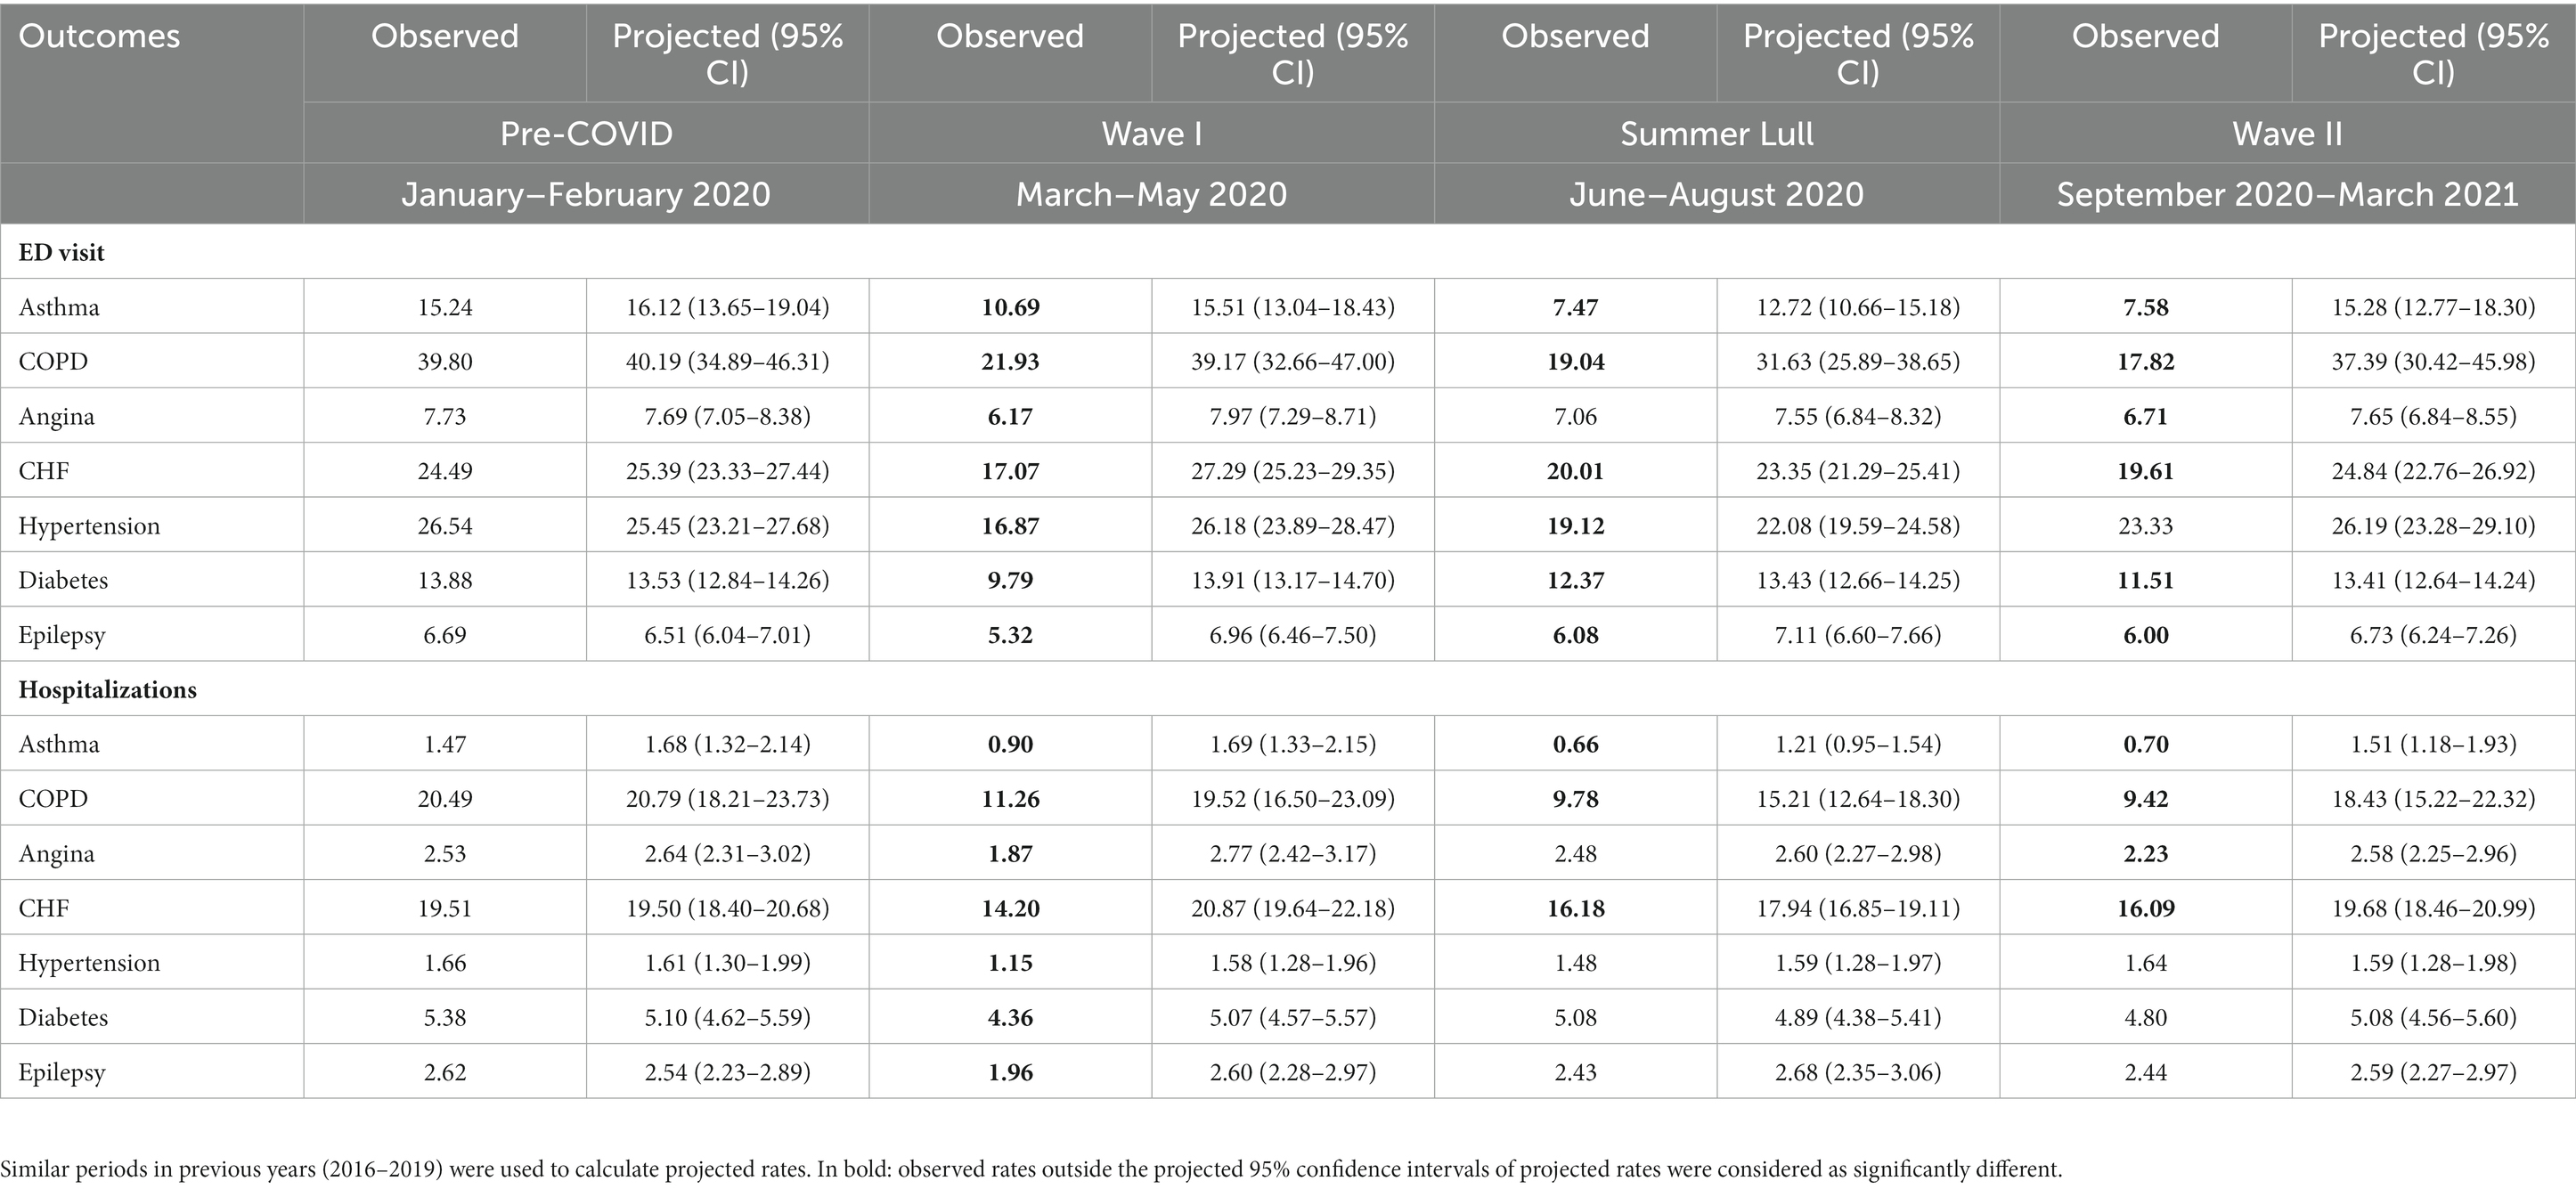
Table 4. Observed and projected monthly rates and 95% confidence intervals (CI) estimated by ARIMA Models for hospitalizations and emergency department (ED) for the separate Ambulatory Care Sensitive Conditions (ACSCs) during the first year of the COVID-19 pandemic: rates were calculated as the number of events per 100,000 people at risk.
Primary care visit rates were higher than projected during Wave I (261.3 vs. 196.8, 95% CI: 173.1–223.7), but returned to projected during Summer Lull and Wave II (Figure 1). Specialty visit rates remained as projected during Wave I and Summer Lull and were higher than projected during Wave II (95.4 vs. 79.5, 95% CI: 70.7–89.5) (Figure 1). We observed significant reductions in ED visits and hospitalizations vs. projected rates during the first year of the pandemic (Figure 1).
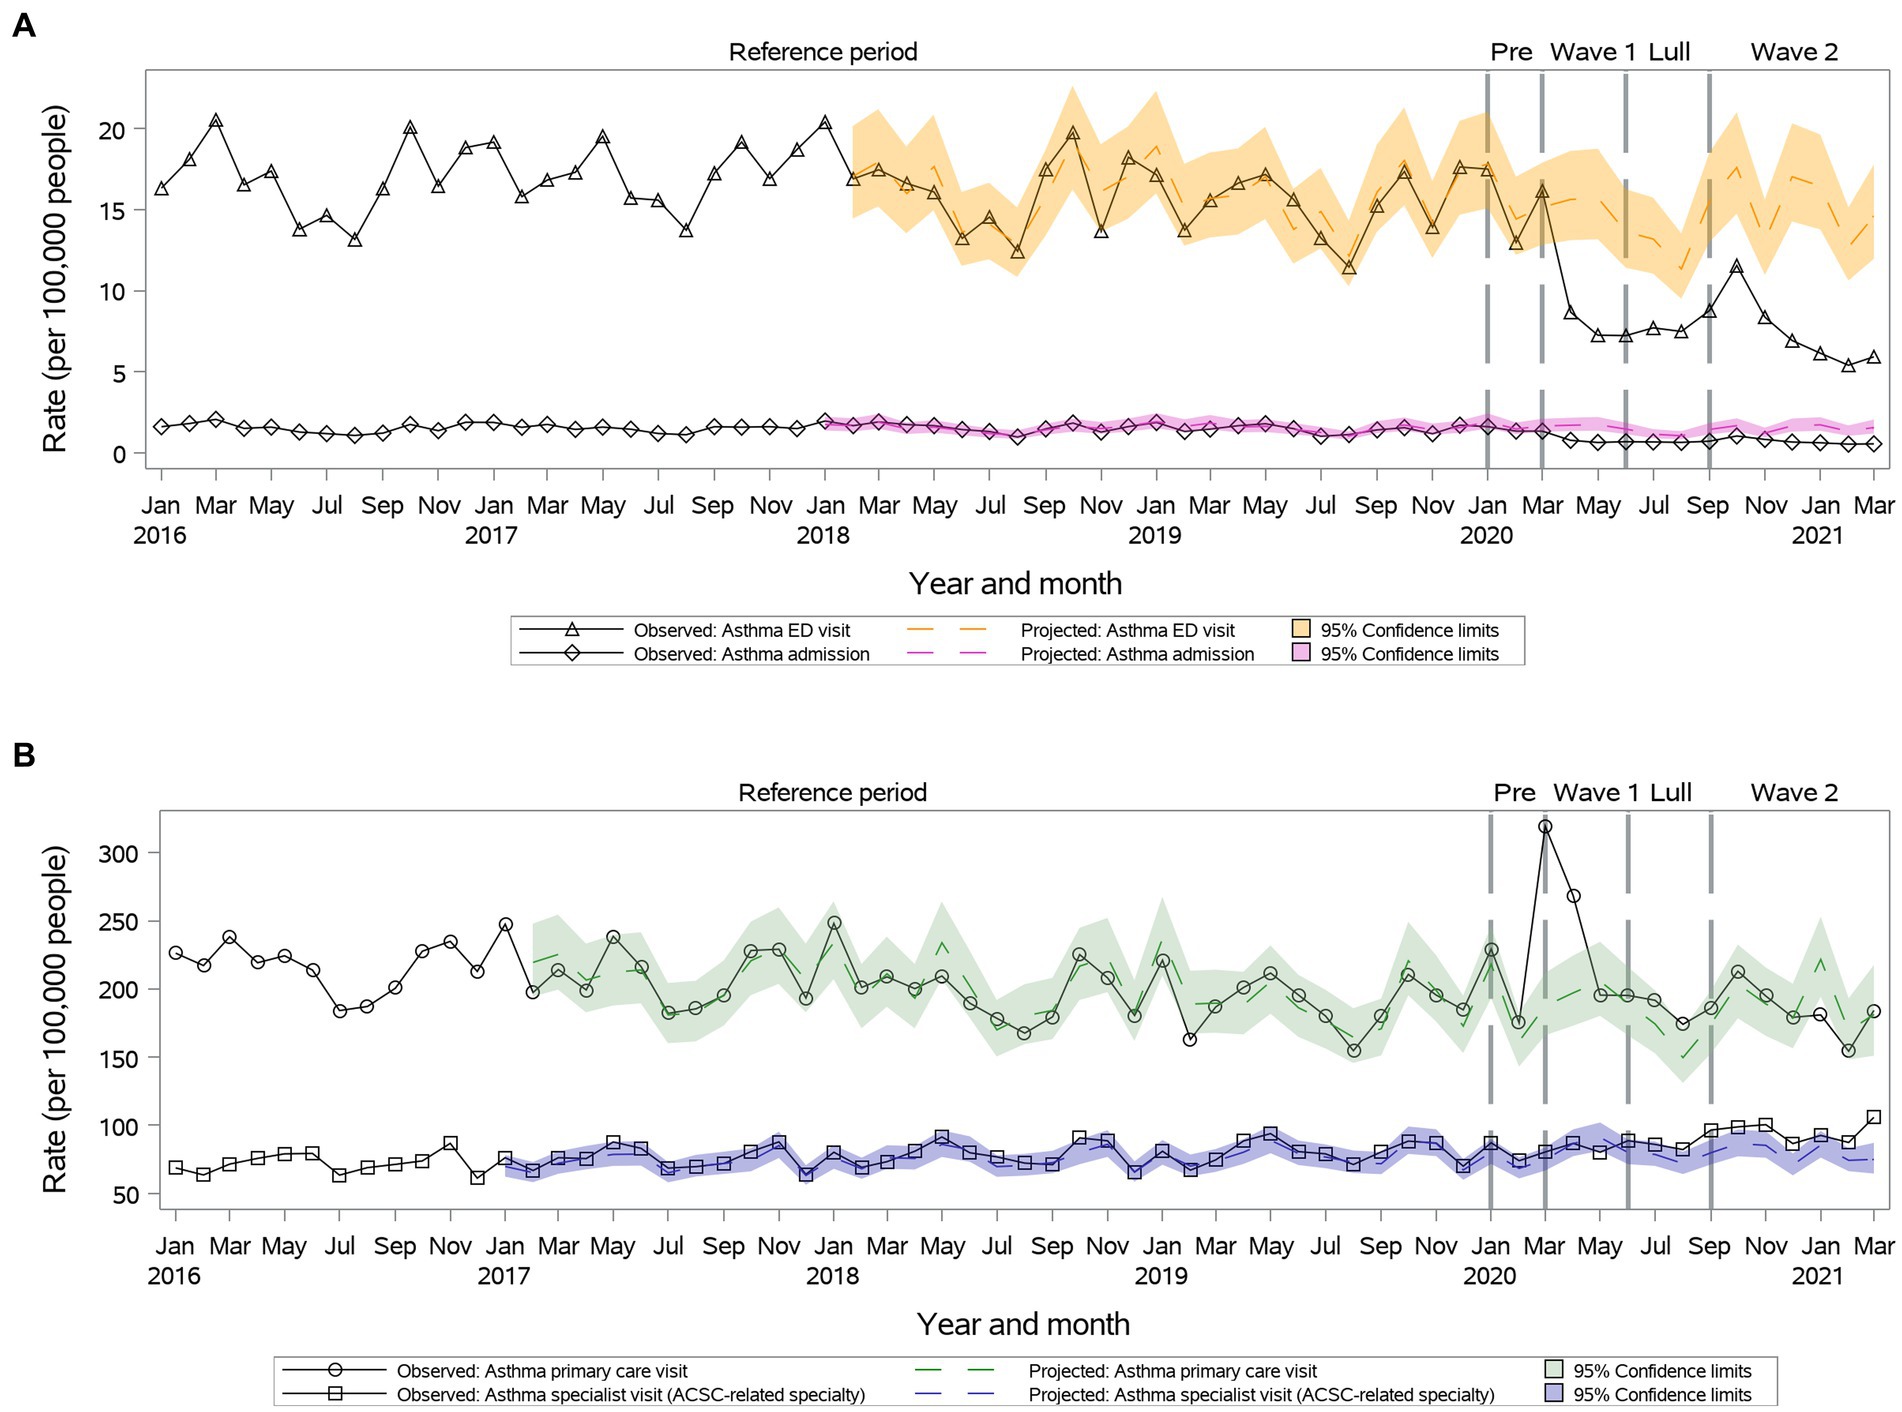
Figure 1. Observed versus projected monthly rates per 100,000 people at-risk for asthma: (A) Acute care visits: emergency department (ED) visits or hospitalizations; (B) Outpatient visits: primary care or relevant specialty visits; ambulatory-care-sensitive conditions (ACSCs).
During Wave I, primary care visits were above projected for all, but individuals 65 years or older. Similarly, specialist care during Wave II remained above projected for all, but individuals 65 years or older. Age and sex did not influence inpatient visit trends.
We observed a significant reduction in primary care visit rates during the first year of the pandemic (112.6 vs. 134.0, 95% CI: 120.9–148.4 during Wave II) (Figure 2). Observed speciality visit rates were lower than projected during Wave I, but then returned to projected during Summer Lull and Wave II (Figure 2). Further, during the first year of the pandemic, we observed significant reductions in ED visits and hospitalizations observed vs. projected rates (Figure 2).
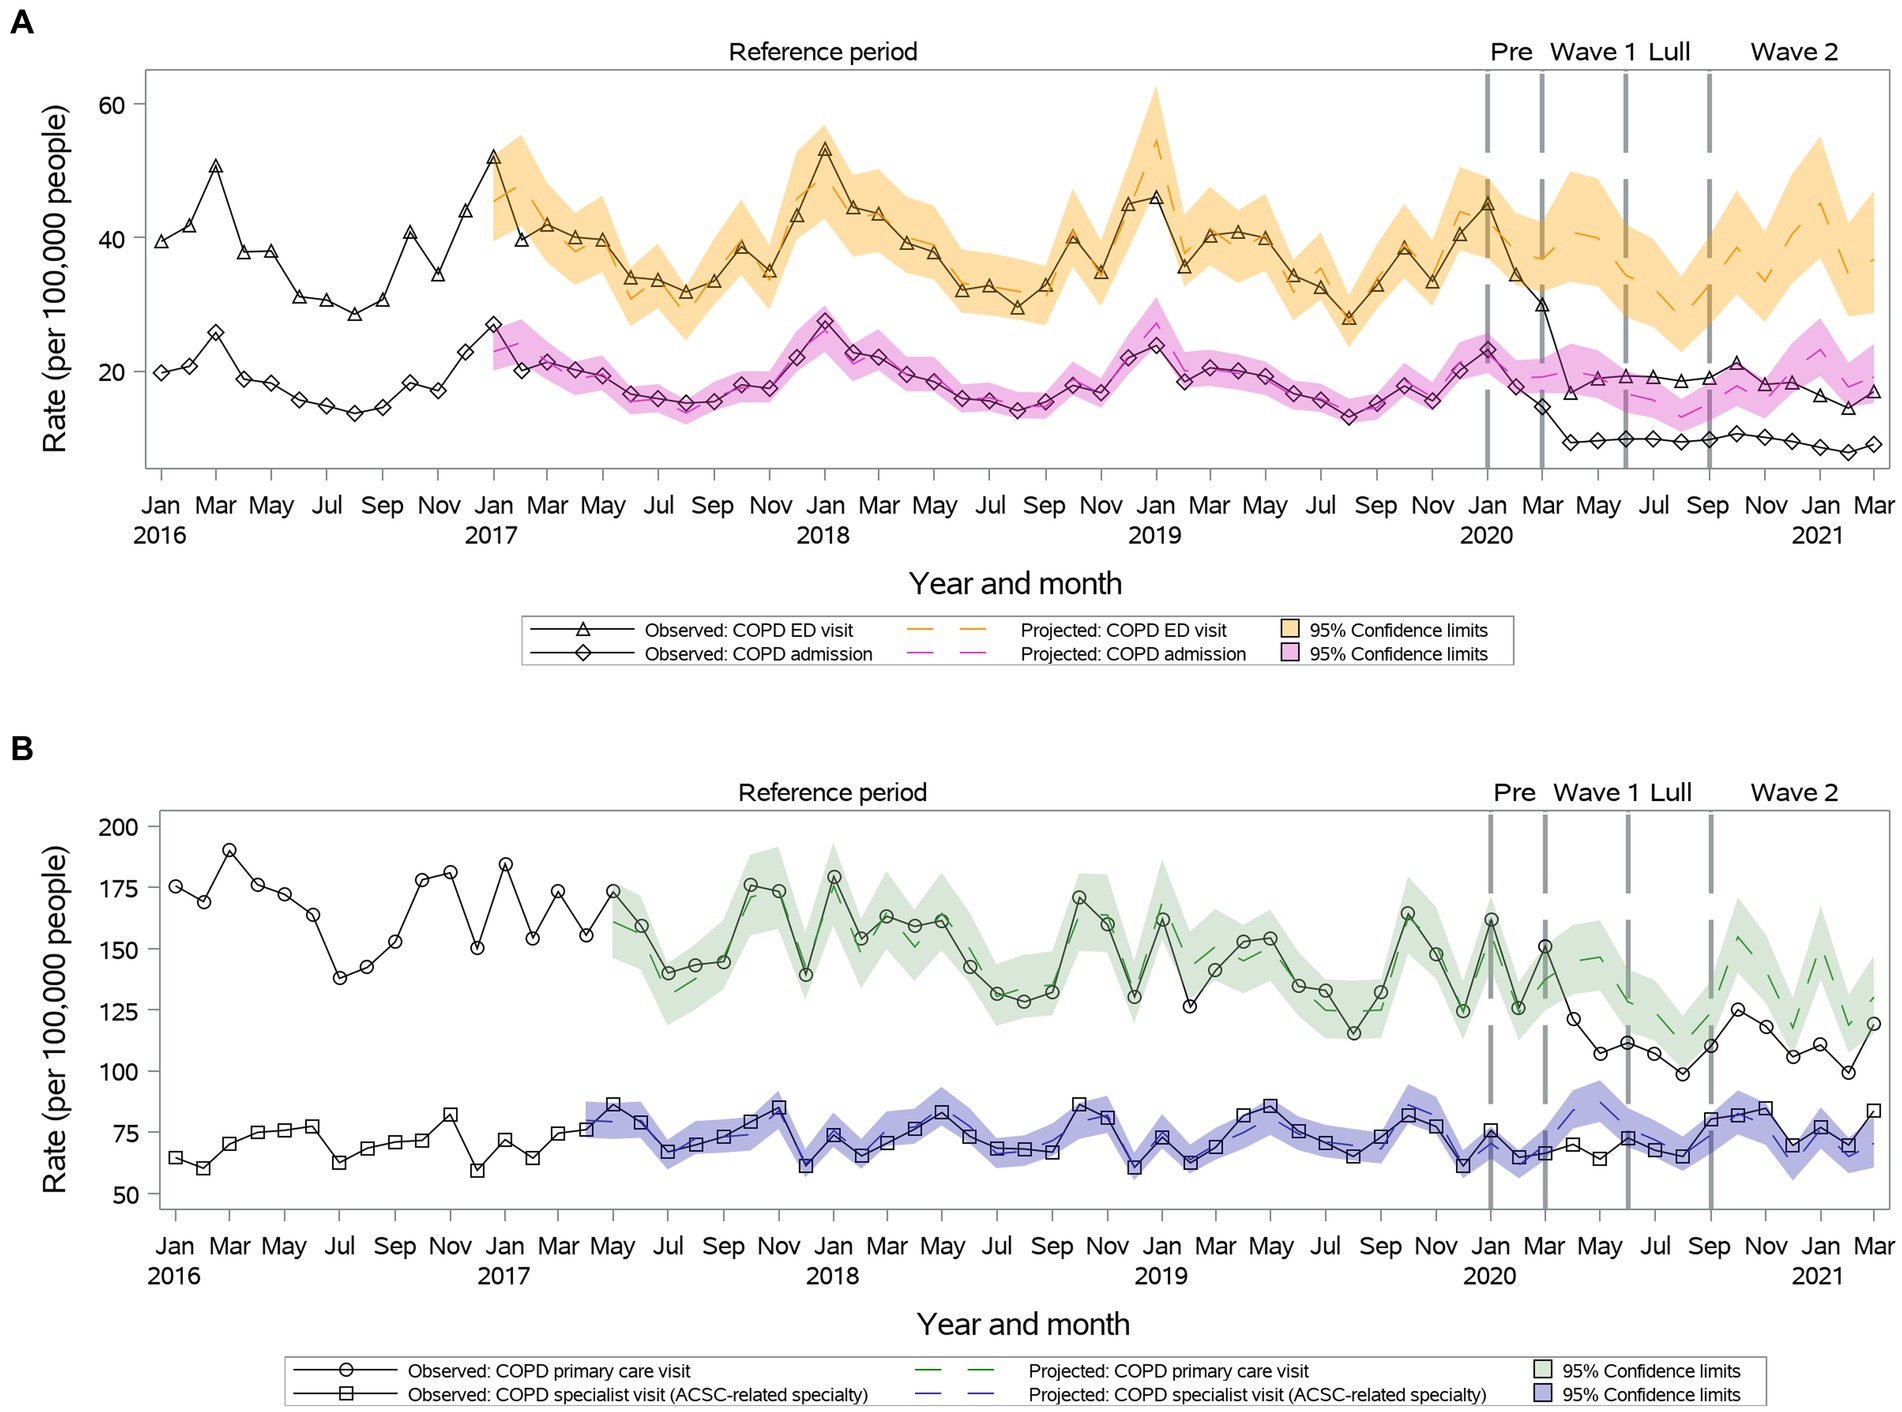
Figure 2. Observed versus projected monthly rates per 100,000 people at-risk for chronic obstructive pulmonary disease (COPD): (A) Acute care visits: emergency department (ED) visits or hospitalizations; (B) Outpatient visits: primary care or relevant specialty visits; ambulatory-care-sensitive conditions (ACSCs).
Age and sex did not influence outpatient and inpatient visit trends.
Primary care visit rates were lower than projected during Wave I, but then returned to projected during Summer Lull and Wave II (33.4 vs. 33.1, 95% CI: 30.1–36.3 during Wave II) (Figure 3). Specialty visit rates were lower than projected during Wave I and Summer Lull and returned to projected during Wave II (55.9 vs. 62.1, 95% CI: 51.3–72.9) (Figure 3). We observed significant reductions in ED visits and hospitalizations rates vs. projected rates during Waves I and II, which returned to projected during Summer Lull (Figure 3).
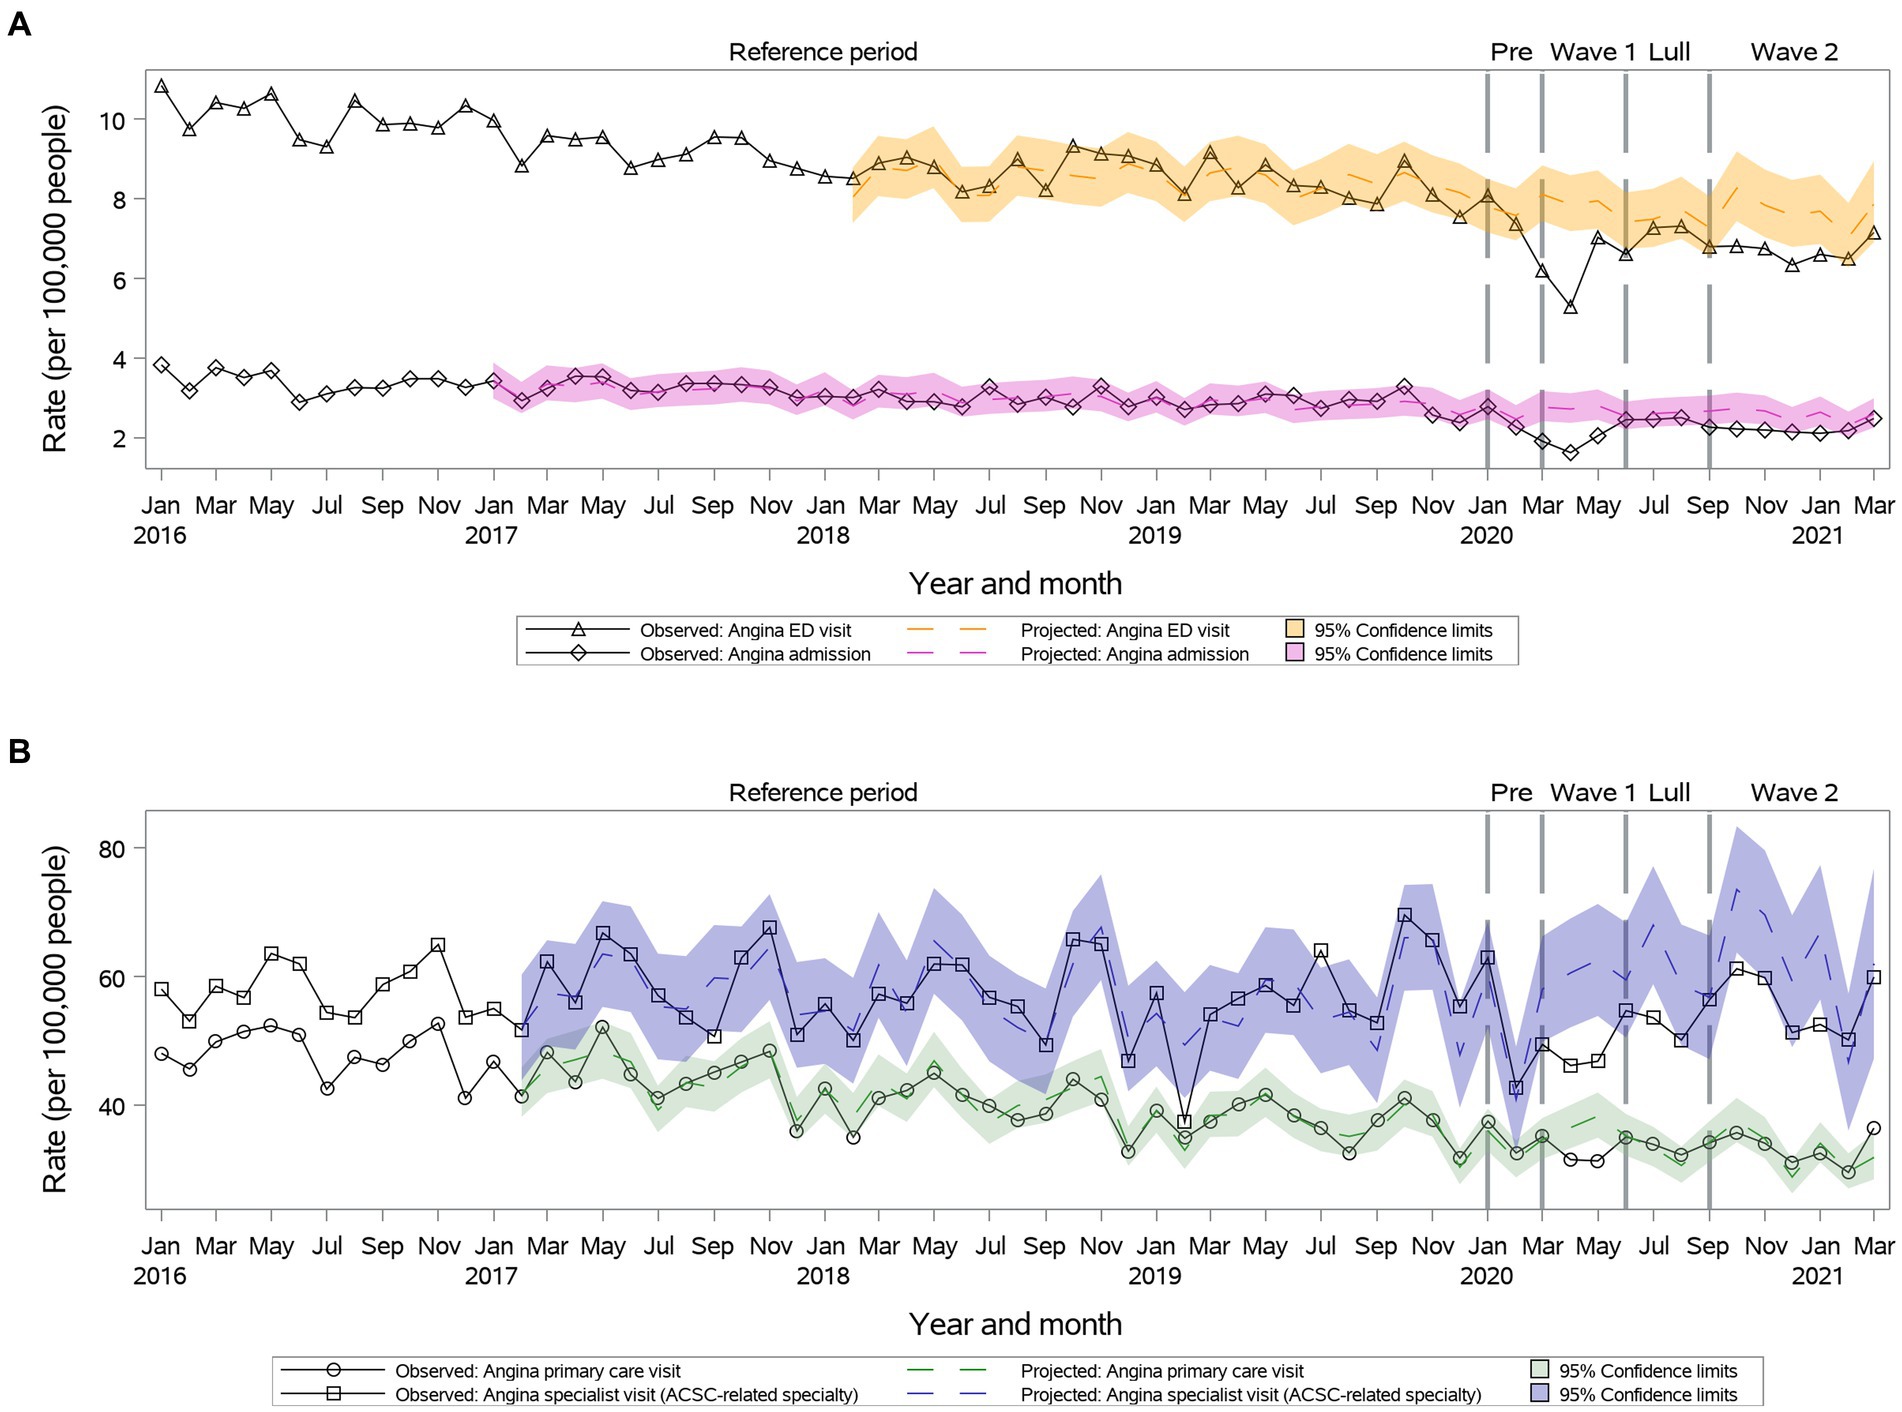
Figure 3. Observed versus projected monthly rates per 100,000 people at-risk for angina: (A) Acute care visits: emergency department (ED) visits or hospitalizations; (B) Outpatient visits: primary care or relevant specialty visits; ambulatory-care-sensitive conditions (ACSCs).
Primary and specialty care visits, ED visits and hospitalizations rates remained as projected during the first year of the pandemic for individuals 18–34 years old. In females, hospitalizations remained below projected during the first year of the pandemic. In men, hospitalizations returned to projected during Summer Lull and Wave II.
Primary outpatient visit rates remained as projected during Wave I and Summer Lull and became significantly higher than projected during Wave II (104.8 vs. 96.4, 95% CI: 89.4–104.0) (Figure 4). Specialty visits were reduced during Wave I and then returned to the projected during Summer Lull and Wave II (Figure 4). We observed significant reductions in ED visits and hospitalizations rates vs. projected rates during the first year of the pandemic (Figure 4).
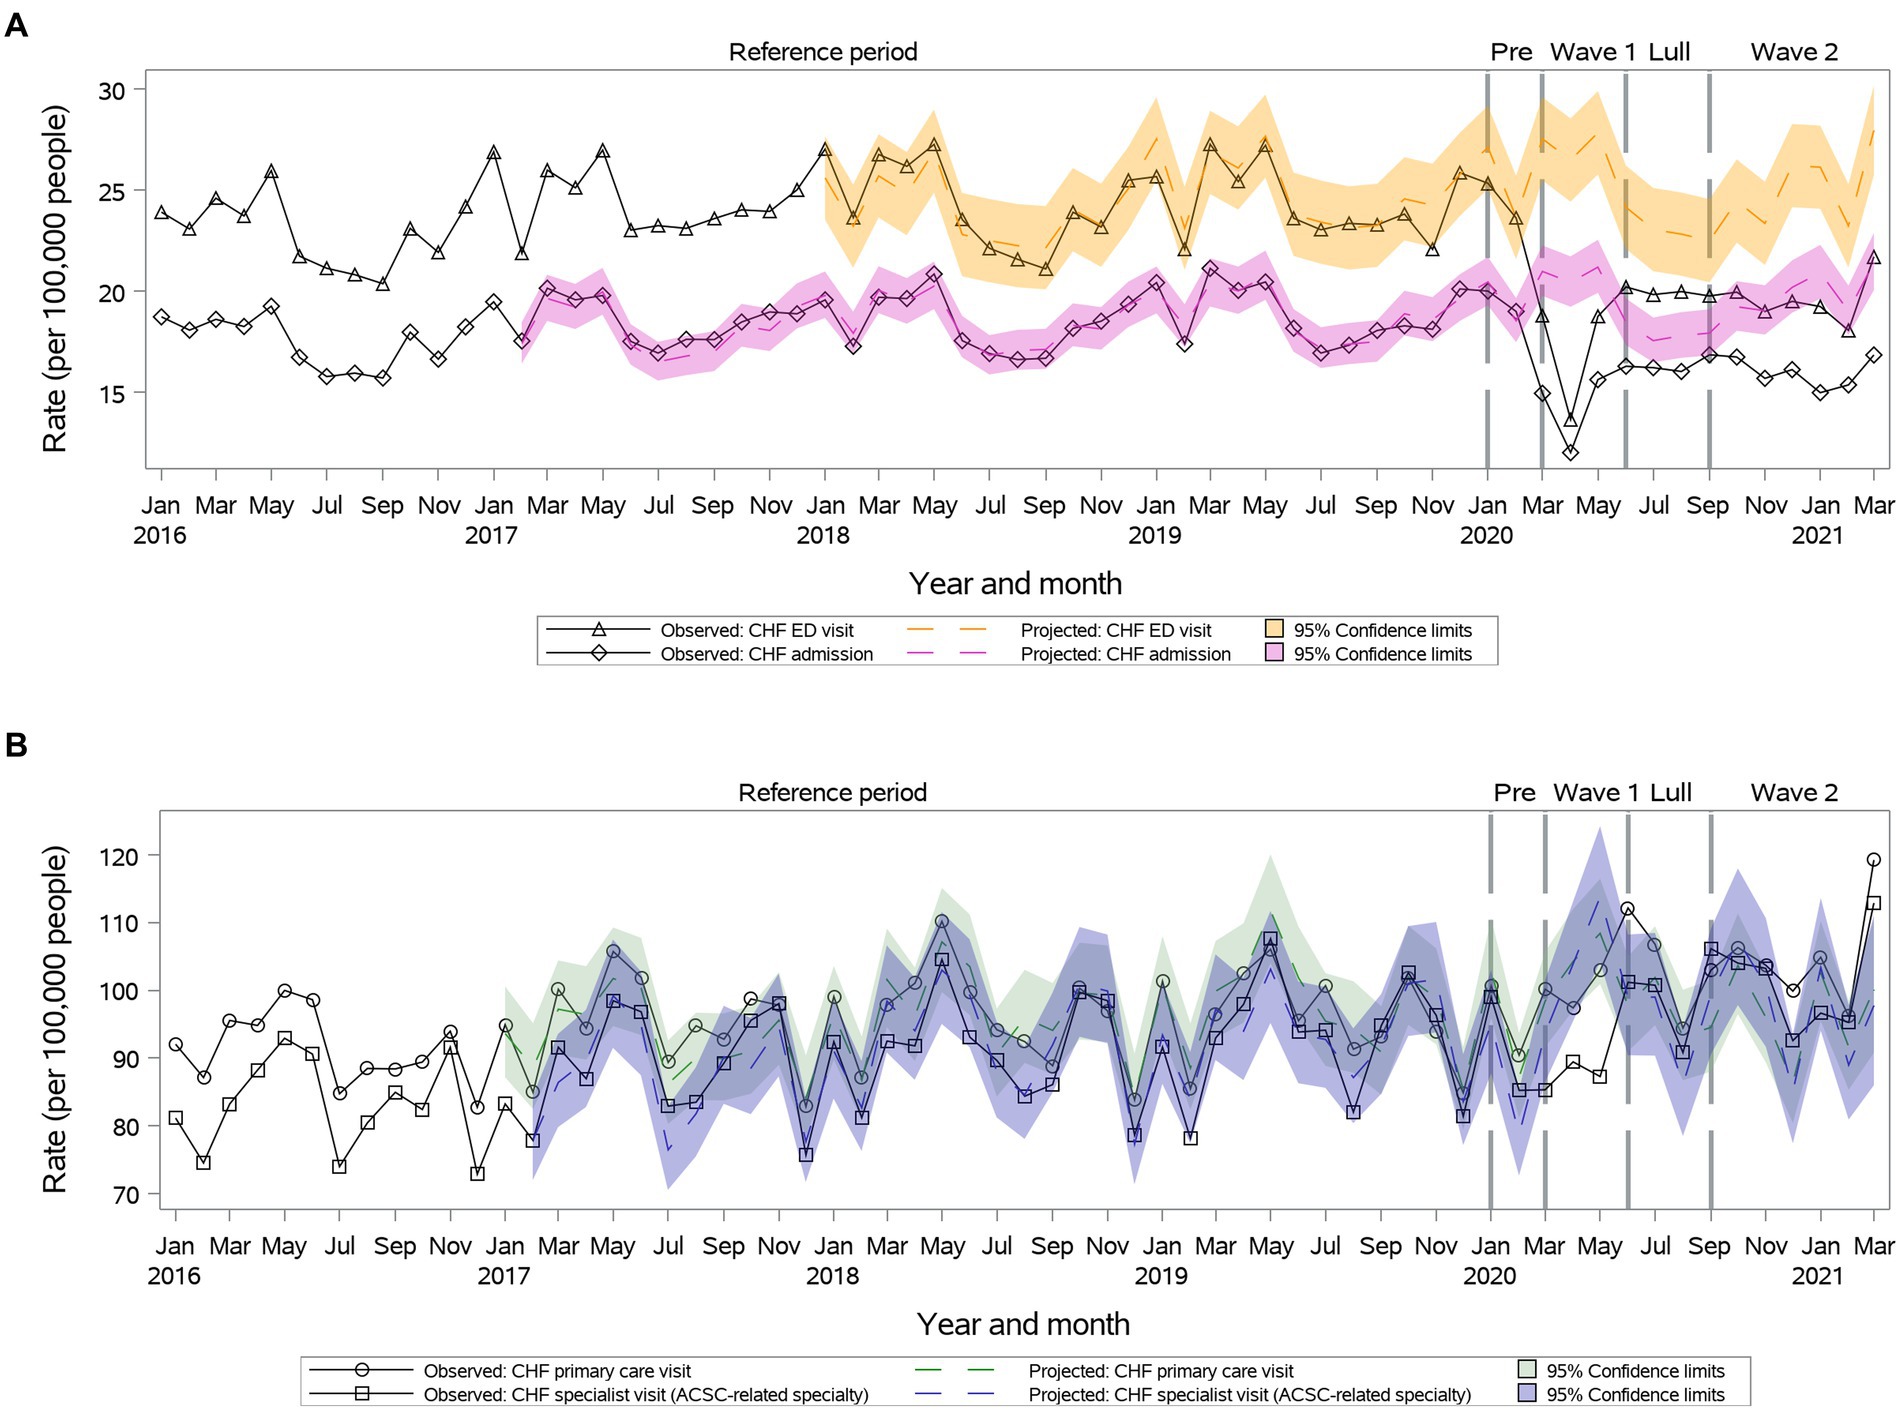
Figure 4. Observed versus projected monthly rates per 100,000 people at-risk for congestive heart failure (CHF): (A) Acute care visits: emergency department (ED) visits or hospitalizations; (B) Outpatient visits: primary care or relevant specialty visits; ambulatory-care-sensitive conditions (ACSCs).
Primary care visit rates remained as projected during the first year of the pandemic for individuals 18–34 and older than 65 years old. Specialty care visit rates remained as projected during the first year of the pandemic for individuals 18–34 years old. The ED visits and hospitalizations remained as projected for individuals 18–49 years old.
Primary care and specialty visits were reduced during Wave I and returned to projected during Summer Lull and Wave II (Figure 5). There was a significant decrease in ED visit rates during Wave I and Summer Lull, which returned to the projected during Wave II (23.3 vs. 26.2, 95% CI: 23.3–29.1) (Figure 5). We observed a significant reduction in hospitalizations rates only during Wave I, which returned to the projected during Summer Lull and Wave II (Figure 5).
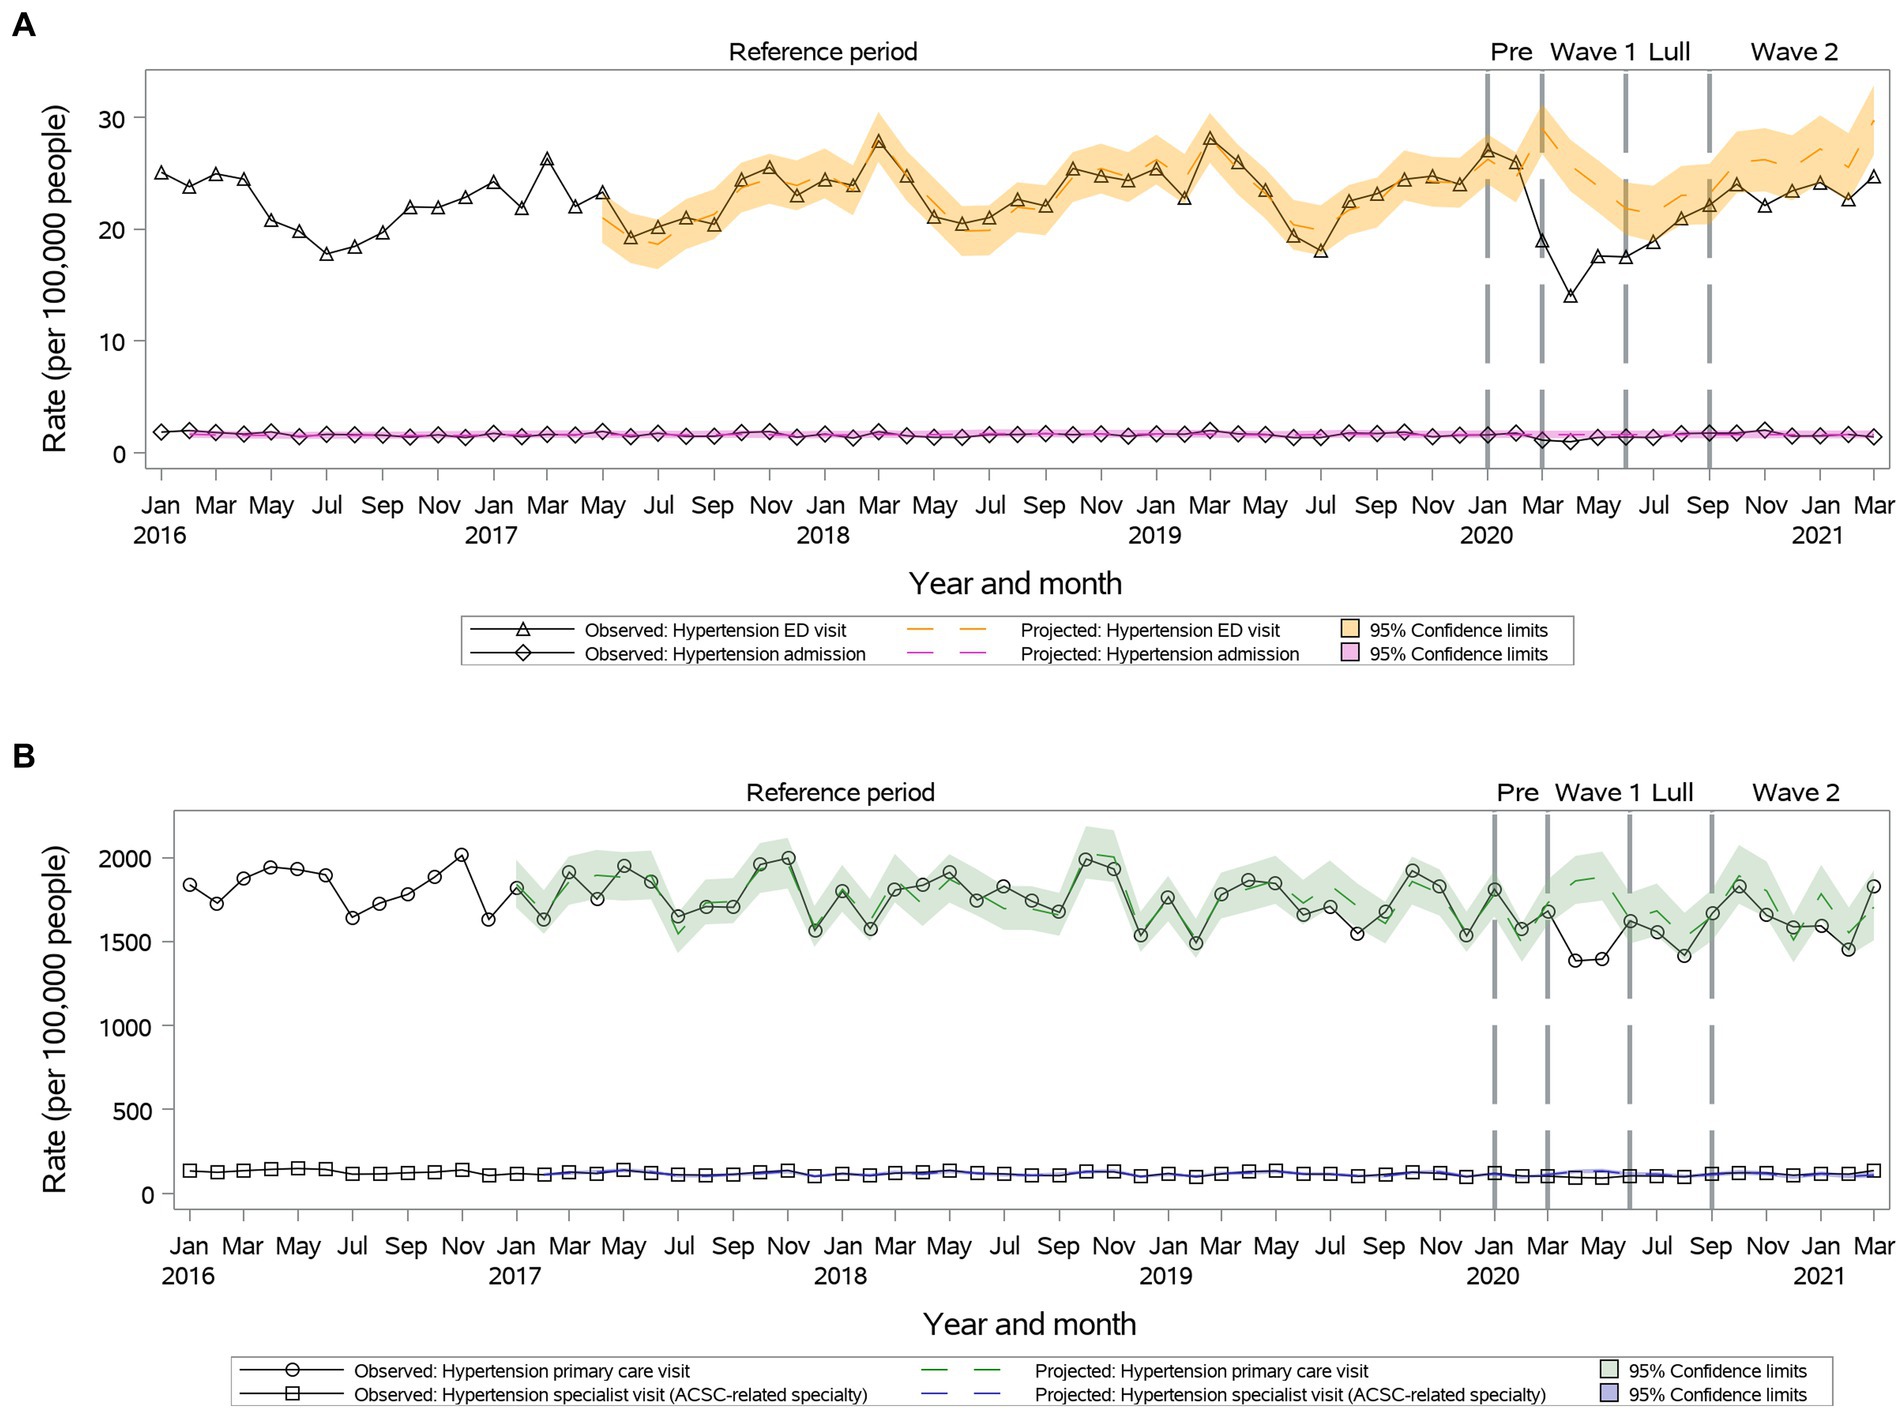
Figure 5. Observed versus projected monthly rates per 100,000 people at-risk for hypertension: (A) Acute care visits: emergency department (ED) visits or hospitalizations; (B) Outpatient visits: primary care or relevant specialty visits; ambulatory-care-sensitive conditions (ACSCs).
Primary care pattern was similar across age and sex subgroups. Specialty visit rates remained as projected for the entire year in individuals 25–34 years old. Hospitalization rates remained as projected in individuals 18–64 years old.
During Wave I, we observed a significant reduction in primary care visit rates (1,336.0 vs. 1,675.0, 95% CI: 1,554.5-1,805.0); rates returned to the projected during Summer Lull and Wave II (Figure 6). The specialty visit rates were reduced compared to the projected during Wave I and then returned to the projected (Figure 6). We observed a significant reduction in ED visit rates during the first year of the pandemic (Figure 6). A significant reduction in hospitalization rates was observed only during only Wave I, which returned to the projected during Summer Lull and Wave II (Figure 6).
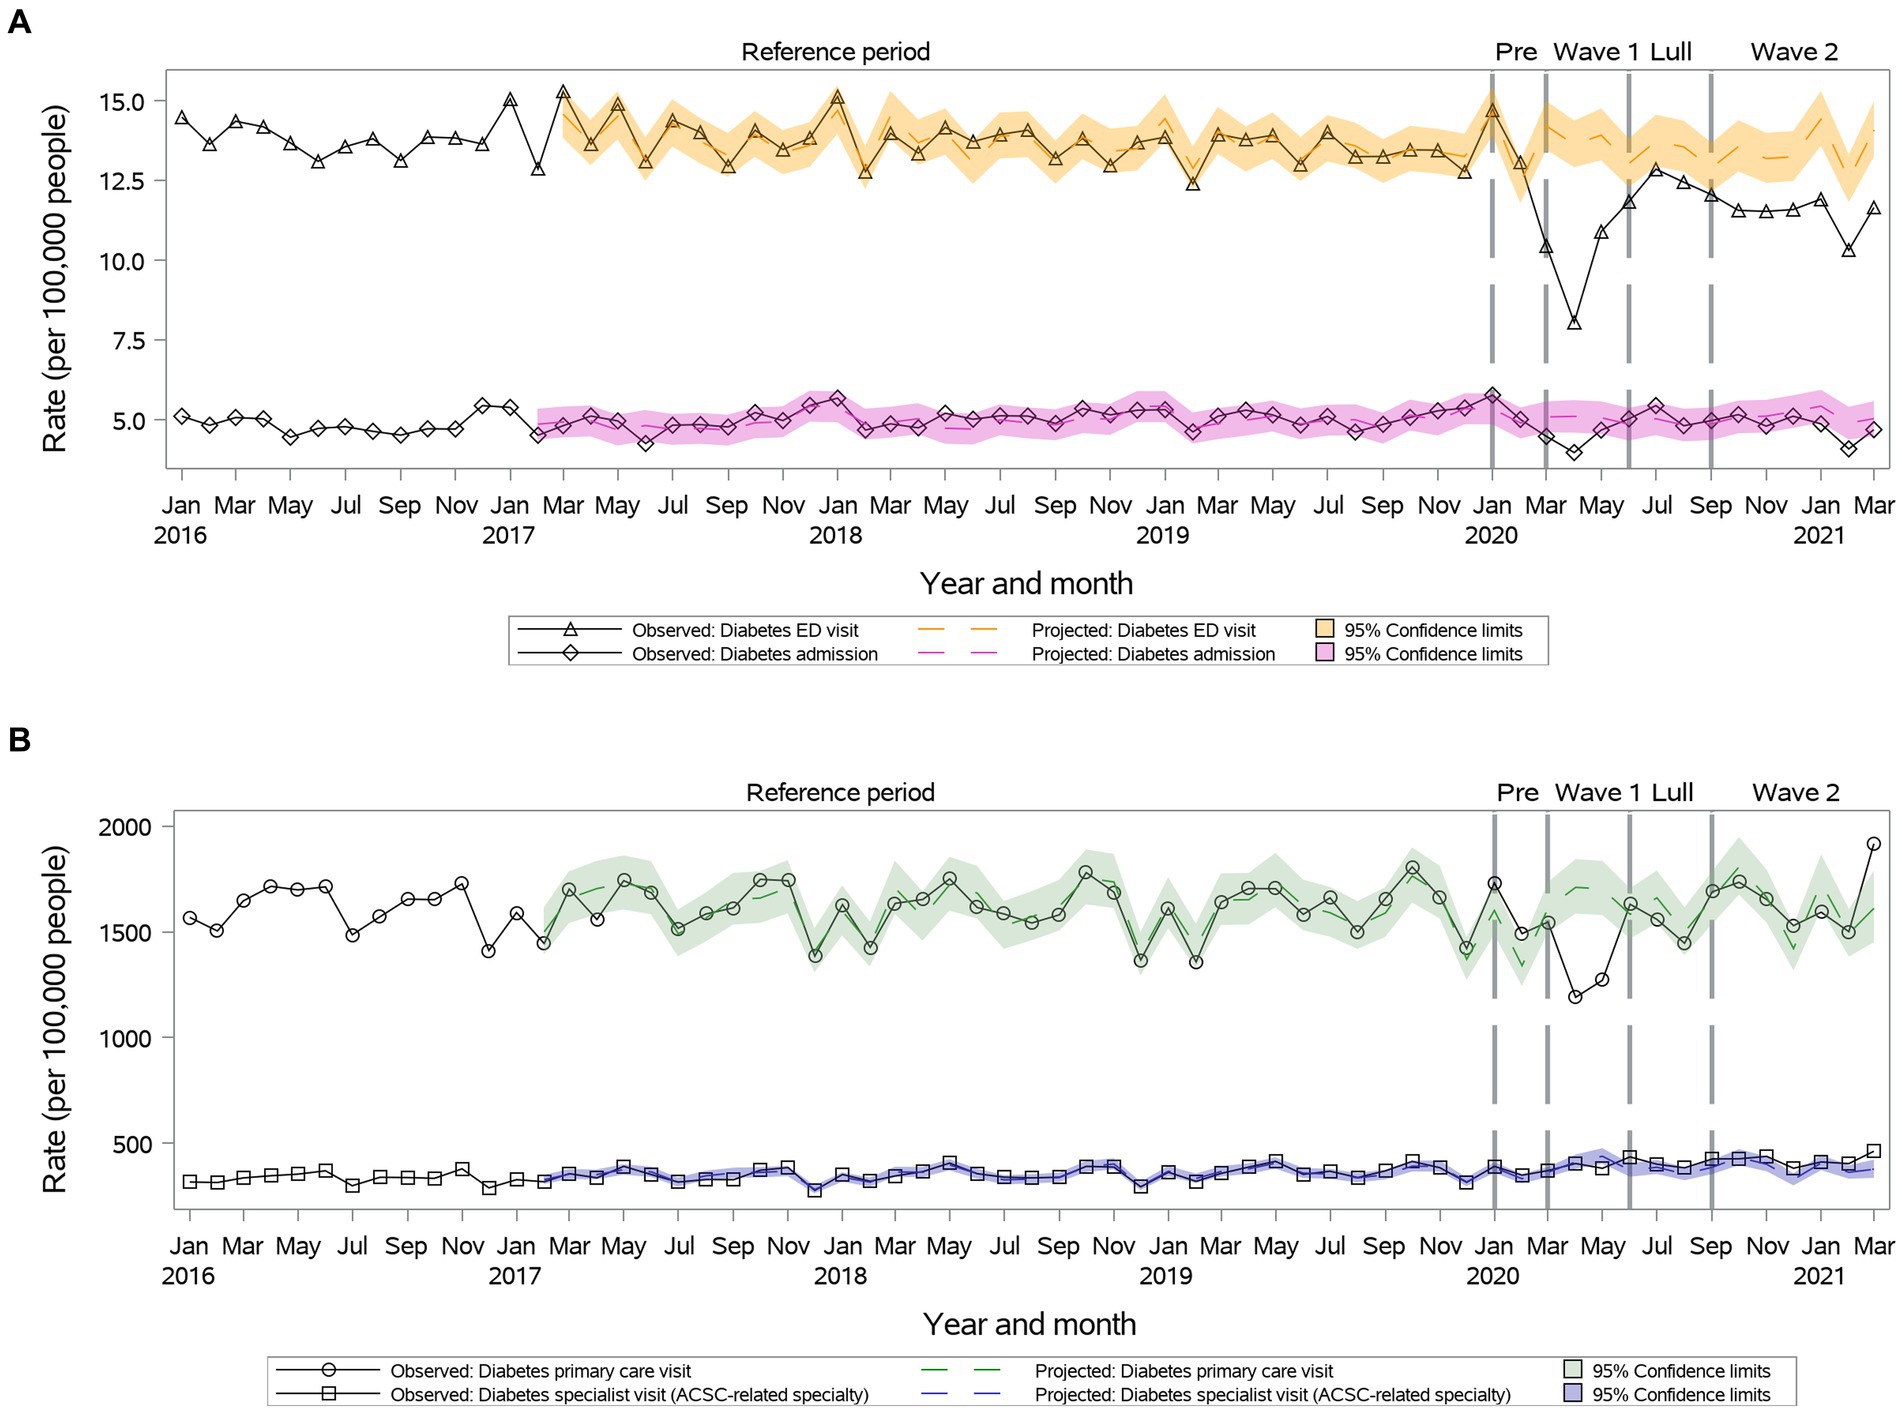
Figure 6. Observed versus projected monthly rates per 100,000 people at-risk for diabetes: (A) Acute care visits: emergency department (ED) visits or hospitalizations; (B) Outpatient visits: primary care or relevant specialty visits; ambulatory-care-sensitive conditions (ACSCs).
Primary care rates increased above projected during Wave II in individuals 18–34 years old. Specialty visit rates increased above projected during Wave II in individuals 18–49 years old and females. Hospitalization rates remained as projected for individuals 35–64 years old for the entire year.
While outpatient primary care visits remained as projected during Wave I, rates increased significantly above the projected during Summer Lull and Wave II (29.6 vs. 24.7, 95% CI: 22.1–27.5 during Wave II) (Figure 7). Specialty visits remained as projected during Wave I and Summer Lull, then increased significantly during Wave II (53.26 vs. 45.62, 95% CI: 41.21–50.52) (Figure 7). We observed a significant reduction in ED visit rates during the first year of the pandemic (Figure 7). A significant reduction in hospitalization rates was observed only during Wave I, which returned to the projected during Summer Lull and Wave II (Figure 7).
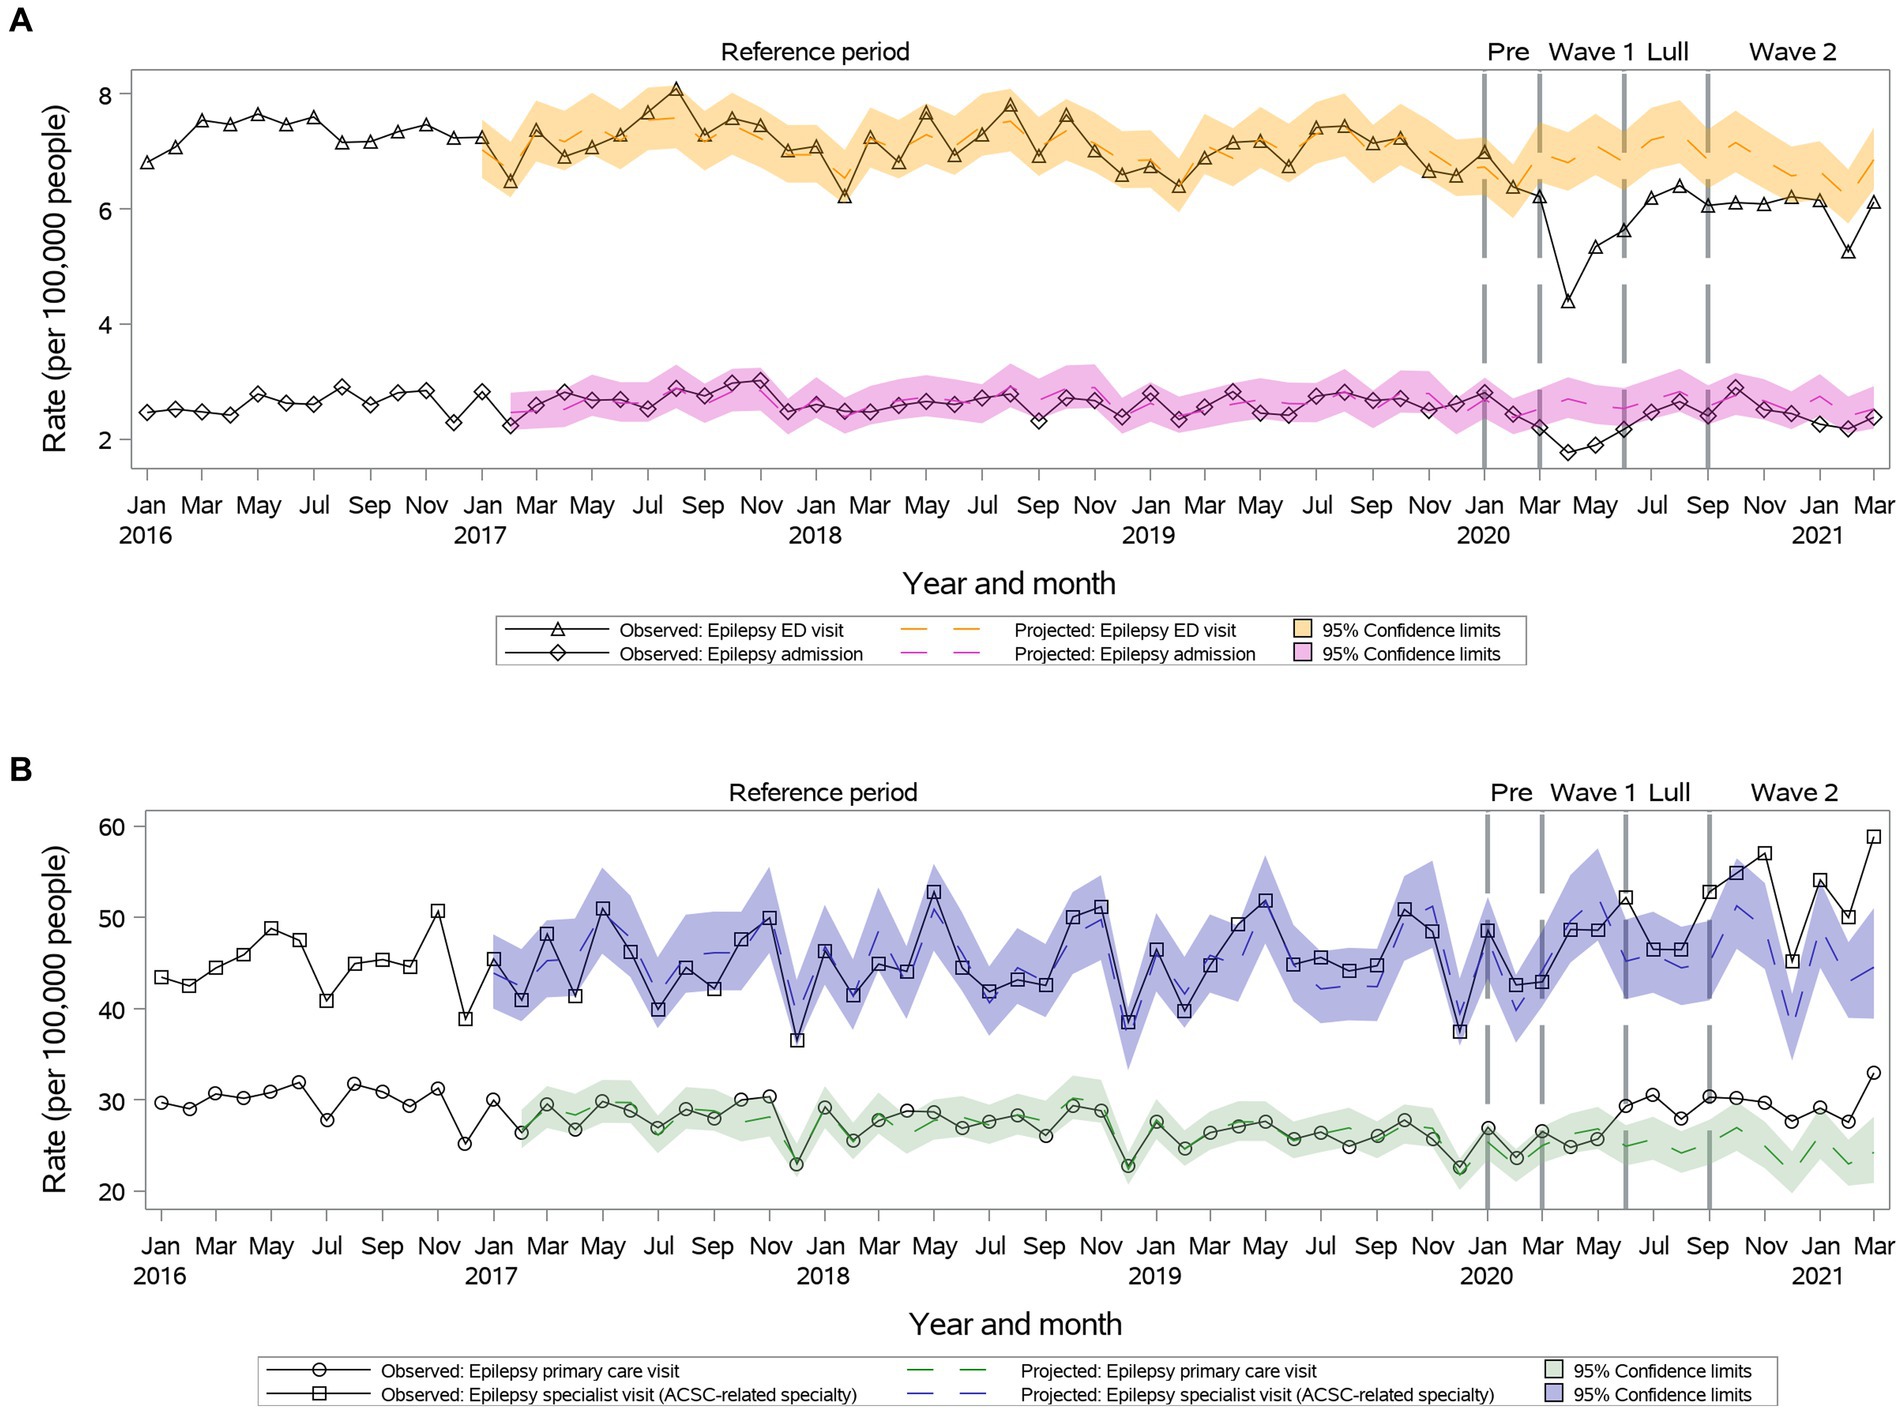
Figure 7. Observed versus projected monthly rates per 100,000 people at-risk for epilepsy: (A) Acute care visits: emergency department (ED) visits or hospitalizations; (B) Outpatient visits: primary care or relevant specialty visits; ambulatory-care-sensitive conditions (ACSCs).
Age and sex did not influence outpatient care visit rates. Hospitalization rates remained as projected among individuals 18–24 and 34–49 years old.
We conducted a population study of trends in outpatient visits, ED visits, and hospitalizations in the first year of the COVID-19 pandemic and found notable variations for seven ACSCs. While initial reductions in outpatient visits resolved towards the end of the first year, they remained low for COPD. Encouragingly, these reductions did not result in more hospitalizations for any ASCS; in fact, hospitalizations were low for asthma, COPD, and CHF. To the best of our knowledge, ours is the first population study examining trends in all outpatient visits, ED visits, and hospitalizations for seven ACSCs. Its examination of seven ACSC conditions and their rates compared to previous years reveal significant disruption in the healthcare system lasting well beyond the initial shock at the beginning of the pandemic. Luckily this shock did not seem to lead to an overwhelming number of hospitalizations, and it is important to understand how catastrophe was avoided.
Regardless of outpatient visit trends, observed ED visits and hospitalizations did not exceed projected rates in post-pandemic periods. Rates of ED visits remained below projected during the first year of the pandemic for asthma, COPD, angina, diabetes, and epilepsy, and returned to projected for CHF and hypertension. Among the seven ACSCs, reductions in inpatient visits (both ED visits and hospitalizations) were most pronounced for COPD and asthma. CHF-related hospitalizations also consistently decreased during the pandemic, albeit to a lesser extent.
There are several possible explanations for why low rates of outpatient visits did not result in more ED visits and hospitalizations as would be expected of ACSCs. First, patients avoided the ED and hospital because they feared catching COVID-19 (1, 38–40). This is concerning because not seeking care may have resulted in them being admitted later with more advanced disease (41–43). Second, a focus on COVID-19 meant essential healthcare services were not available for non-COVID-19 conditions, thus limiting resources for ACSC patients (44–46). Third, lower rates of screening and diagnostic testing prevented the recognition of patients requiring hospitalization (47, 48). Fourth, there was a true decrease in need for ACSC hospitalizations because stay-at-home orders led to fewer circulating seasonal respiratory viruses, less air pollution, and patients having more time to focus on their health (1, 49, 50). In support of the latter, we demonstrated the most pronounced reductions in inpatient visits for COPD and asthma as a possible unintended benefit. In addition, an increase in adherence to medications for asthma and COPD was also noted this time (51–53). Fifth, low rates of outpatient visits may not have resulted in more ED visits and hospitalizations because virtual care was able to effectively replace in-person visits (1, 45, 54). Finally, it may not be one of these explanations, but many of them in combination. Future research on which of these explanations/strategies are most prominent is important to guide where resources are best placed for the next pandemic. Given the possible importance of respiratory viruses as a trigger for exacerbations of certain ACSCs, maybe more resources should be devoted to preventing the spread of respiratory infection through ventilation and vaccination as a public health intervention. Virtual care and stay-at-home orders are arguably effective strategies. Nonetheless, those strategies are greatly disruptive and have their own risks; therefore, more studies to learn how to refine these strategies should be done in anticipation of future pandemics or other disasters.
Our study was consistent with others that demonstrated reductions in outpatient care during the pandemic. For example, there was a significant decrease in diabetes-related outpatient care visits at the beginning of the pandemic, with a rebound in the later stages (55, 56), and an increase in telemedicine utilization (56). We found an increase in outpatient primary care visits for asthma in the first two months of the pandemic, which may be explained by an overlap in symptoms between asthma and COVID-19 and limited access to COVID-19 testing and specialists at the beginning of the pandemic. This was in contrast to existing literature, where a reduction in outpatient primary care visits for asthma was observed (57, 58). Our findings also agreed with studies demonstrating a decline in in-person medical visits for chronic cardiovascular conditions at the beginning of the pandemic, specifically reductions in hospitalizations and ED visits by 25–85% (16, 59–61), 40–80% (62, 63), and 16% (16) for angina, CHF, and hypertension, respectively. Inpatient and ED visits for COPD or asthma declined by approximately 40 and 80%, respectively, at the beginning of the pandemic (15, 64, 65). Similarly, epilepsy-related hospitalizations and ED visits were found to be significantly decreased (4–38%) during the early stages of the COVID-19 pandemic despite antiepileptic medication shortages and increased barriers to in-person tests such as EEG monitoring (9, 66–68). Again, public health restrictions and lock-down measures might have led to improved home management of epilepsy (67), which is supported by high patient satisfaction and lower no-show rates associated with telehealth solutions such as electronic seizure journals, mobile apps, and video conferencing (69).
Our study extends these previous findings by detailing the health system response, which is important for many reasons. First, we demonstrated that – despite the introduction of virtual care and adaptations – disruptions in the health care system and, specifically, the care provided for certain diseases such as COPD persisted until the end of the first year of the pandemic. Some may argue that this is the “new normal” and extends beyond the first year and/or reverberates in other ways in the population. Second, should another crisis occur, perhaps in the form of a new COVID-19 variant, our findings can guide a future response by suggesting where resources are best placed to maintain the health of the population. In addition, predicted mortality and morbidity rates from observed trends would allow the healthcare system to anticipate the impact of future pandemics. Finally, the first year of the pandemic held a lot of uncertainty, which caused a lot of stress and anxiety. Our results can be used to inform the public and healthcare providers what to expect in future pandemics.
Our study has number of strengths, including its inclusion of a large complete population, near-complete data during the first year of the pandemic on acute as well as ambulation care trends, monthly level analysis, open cohort study design, and the use of ARIMA modelling to project rates to account for any underlying trends and seasonality before the COVID-19 pandemic.
This study also has limitations. First, we were able to observe trends in outpatient visits and hospitalizations, but lacked detailed knowledge on what those health services were being used for. Second, while we can speculate on reasons for people not using health services, we lack knowledge of individual patient and healthcare provider motivations. Third, there are many other influences on the healthcare system we did not capture that could have influenced trends in ACSCs, such as visits for non-ACSCs such as COVID-19, delays and a backlog of surgery, which hospitals worked to correct, and health human resources issues with many providers experiencing illness and burnout. Next, with cross-national differences in COVID-19 pandemic-related shutdowns, public health and government mandates related to outbreak control, and resumptions to pre-pandemic levels of healthcare system functioning (70), these trends may have been different in different countries. Finally, it is still not clear what the persistent reductions in COPD, asthma and CHF signify, and it is possible they have led to poor outcomes beyond the first year of the pandemic. It is also not clear if the recovery of the other ACSC was sustained beyond that first year; thus, further study of the second years up until today is needed. Further studies are also needed to explore trends by the COVID-19 hotspot status.
In this province-based study, we demonstrated variation in outpatient visit trends for different ACSCs in the first year of the COVID-19 pandemic. No outpatient visit trends resulted in increased hospitalizations for any ACSC; however, reductions in rates of asthma, COPD, and CHF hospitalizations persisted. Future research should examine healthcare use beyond the first year of the pandemic to determine if these trends continued and/or how they reverberated to impact the health of the population.
The datasets presented in this article are not readily available because the dataset from this study is held securely in coded form at ICES. While legal data sharing agreements between ICES and data providers (e.g., healthcare organizations and government) prohibit ICES from making the dataset publicly available, access may be granted to those who meet pre-specified criteria for confidential access, available at www.ices.on.ca/DAS (email: ZGFzQGljZXMub24uY2E=). The full dataset creation plan and underlying analytic code are available from the authors upon request, understanding that the computer programs may rely upon coding templates or macros that are unique to ICES and are, therefore, either inaccessible or may require modification. Requests to access the datasets should be directed to ICES data sharing, ZGFzQGljZXMub24uY2E=.
The studies involving humans were approved by ICES. ICES is an independent non-profit institution and a prescribed entity under Personal Health Information Protection Act (PHIPA) in Ontario. Under section 45 of PHIPA, ICES is authorized to collect personal health information without consent to compile statistical information or analysis concerning managing, allocating resources to, monitoring, evaluating or planning for the health system. The studies were conducted in accordance with the local legislation and institutional requirements. Written informed consent for participation was not required from the participants or the participants' legal guardians/next of kin in accordance with the national legislation and institutional requirements.
TK and AG were also involved in obtaining administrative data, analyzing data, and drafting the manuscript. MiP was involved in data analyses, visual data presentation and drafting the method section. DZ was involved in the literature search and drafting of the manuscript. TK, MiP, and AG had full access to all the data in the study and took responsibility for the integrity of the data and the accuracy of the data analysis, affirmed that the manuscript is an honest, accurate, and transparent account of the study being reported, no important aspects of the study have been omitted, any discrepancies from the study as planned have been explained. All authors were involved in study conception and design, interpretation of the data, critically revising the manuscript for accuracy and important intellectual content, and final approval of the version to be published, had full access to statistical reports and tables.
This study was supported by the Ottawa Hospital Academic Medical Organization (TOHAMO), the Ontario Health Data Platform (OHDP), a Province of Ontario initiative to support Ontario’s ongoing response to COVID-19 and its related impacts, and by ICES (formerly known as the Institute for Clinical Evaluative Sciences), which was funded by an annual grant from the Ontario Ministry of Health (MOH) and the Ministry of Long-Term Care (MLTC). Parts of this material were based on data and information compiled and provided by the Canadian Institute for Health Information (CIHI). The analyses, conclusions, opinions, and statements expressed herein are solely those of the authors and do not reflect those of the funding or data sources; no endorsement is intended or should be inferred. The analyses, conclusions, opinions, and statements expressed herein are those of the author and not necessarily those of CIHI. No endorsement by the OHDP, its partners, or the Province of Ontario, ICES, CIHI or the Ontario MOH and/or MLTC is intended or should be inferred. TK and AG were supported by the PSI (Physicians’ Services Incorporated) foundation. TT was supported by the Canadian Institutes of Health Research, Tier 1 Canada Research Chair in Asthma. CK was supported by the Faculty of Medicine Clinical Chair Award. The funding sponsors had no role in the study design, data collection and analysis, or preparation of the manuscript. No other relationships or activities could appear to have influenced the submitted work.
We express sincere gratitude to J. Mark FitzGerald, who provided his knowledge and expertise for the study proposal development and the grant application that supported this study. FitzGerald passed away on January 18, 2022. He has been at the forefront of shaping health outcomes for the Canadian and global respiratory community in ways that will live on for many years to come. FitzGerald’s extraordinary contributions and impact on human health has made an indelible mark on the people he influenced as a clinician, researcher, colleague, mentor, and friend; he will be greatly missed.
The authors declare that the research was conducted in the absence of any commercial or financial relationships that could be construed as a potential conflict of interest.
All claims expressed in this article are solely those of the authors and do not necessarily represent those of their affiliated organizations, or those of the publisher, the editors and the reviewers. Any product that may be evaluated in this article, or claim that may be made by its manufacturer, is not guaranteed or endorsed by the publisher.
The Supplementary material for this article can be found online at: https://www.frontiersin.org/articles/10.3389/fpubh.2023.1251020/full#supplementary-material
ACSCs, Ambulatory-Care-Sensitive Conditions; CHF, congestive heart failure; CIs, confidence intervals; DAD, Discharge Abstract Database; ED, emergency department; NACRS, National Ambulatory Care Reporting System Database; OHIP, Ontario Health Insurance Plan; RPDB, Registered Persons Database
1. Kendzerska, T , Zhu, DT , Gershon, AS , Edwards, JD , Peixoto, C , Robillard, R, et al. The effects of the health system response to the COVID-19 pandemic on chronic disease management: a narrative review. Risk Manag Healthc Policy. (2021) 14:575–84. doi: 10.2147/RMHP.S293471
2. Sarmento, J , Rocha, JVM , and Santana, R . Defining ambulatory care sensitive conditions for adults in Portugal. BMC Health Serv Res. (2020) 20:754. doi: 10.1186/s12913-020-05620-9
3. Kim, AM , Park, JH , Yoon, TH , and Kim, Y . Hospitalizations for ambulatory care sensitive conditions as an indicator of access to primary care and excess of bed supply. BMC Health Serv Res. (2019) 19:259. doi: 10.1186/s12913-019-4098-x
4. Kwok, ESH , Clapham, G , and Calder-Sprackman, S . The impact of COVID-19 pandemic on emergency department visits at a Canadian academic tertiary care center. West J Emerg Med. (2021) 22:851–9. doi: 10.5811/westjem.2021.2.49626
5. Wong, LE , Hawkins, JE , Langness, S , Murrell, KL , Iris, P , and Sammann, A . Where are all the patients? Addressing Covid-19 fear to encourage sick patients to seek emergency care. NEJM Catal Innov Care Deliv. (2020) 1:1–12. doi: 10.1056/CAT.20.0193
6. Davies, GA , Alsallakh, MA , Sivakumaran, S , Vasileiou, E , Lyons, RA , Robertson, C, et al. Impact of COVID-19 lockdown on emergency asthma admissions and deaths: national interrupted time series analyses for Scotland and Wales. Thorax. (2021) 76:867–73. doi: 10.1136/thoraxjnl-2020-216380
7. Babapoor-Farrokhran, S , Alzubi, J , Port, Z , Sooknanan, N , Ammari, Z , Al-Sarie, M, et al. Impact of COVID-19 on heart failure hospitalizations. SN Compr Clin Med. (2021) 3:2088–92. doi: 10.1007/s42399-021-01005-z
8. He, L , Lu, F , Du, X , Long, D , Sang, C , Tang, R, et al. Impact of COVID-19 pandemic on hospital admissions of acute coronary syndrome: a Beijing inpatient database study. Lancet Reg Health West Pac. (2022) 19:100335. doi: 10.1016/j.lanwpc.2021.100335
9. Leung, WCY , Lau, EHY , Kwan, P , and Chang, RS . Impact of COVID-19 on seizure-related emergency attendances and hospital admissions – a territory-wide observational study. Epilepsy Behav. (2021) 115:107497. doi: 10.1016/j.yebeh.2020.107497
10. Mayoral, E , Rave, R , Rodriguez de Vera, P , Rojo-Martinez, G , Olveira, G , Aguilar-Diosdado, M, et al. Temporal trends in hospitalizations due to diabetes complications during COVID-19 pandemic in Andalusia, Spain. BMJ Open Diabetes Res Care. (2022) 10:e002623. doi: 10.1136/bmjdrc-2021-002623
11. Ahrens, SM , Ostendorf, AP , Lado, FA , Arnold, ST , Bai, S , Bensalem-Owen, MK, et al. Impact of the COVID-19 pandemic on epilepsy center practice in the United States. Neurology. (2022) 98:e1893–901. doi: 10.1212/WNL.0000000000200285
12. Kendzerska, T , Zhu, DT , Pugliese, M , Manuel, D , Sadatsafavi, M , Povitz, M, et al. Trends in all-cause mortality and inpatient and outpatient visits for ambulatory care sensitive conditions during the first year of the COVID-19 pandemic: a population-based study. J Hosp Med. (2022) 17:726–37. doi: 10.1002/jhm.12920
13. Lawless, M , Burgess, M , and Bourke, S . Impact of COVID-19 on hospital admissions for COPD exacerbation: lessons for future care. Medicina (Kaunas). (2022) 58:66. doi: 10.3390/medicina58010066
14. De Filippo, O , D'Ascenzo, F , Angelini, F , Bocchino, PP , Conrotto, F , Saglietto, A, et al. Reduced rate of hospital admissions for ACS during Covid-19 outbreak in northern Italy. N Engl J Med. (2020) 383:88–9. doi: 10.1056/NEJMc2009166
15. Kenyon, CC , Hill, DA , Henrickson, SE , Bryant-Stephens, TC , and Zorc, JJ . Initial effects of the COVID-19 pandemic on pediatric asthma emergency department utilization. J Allergy Clin Immunol Pract. (2020) 8:2774–2776.e1. doi: 10.1016/j.jaip.2020.05.045
16. Stohr, E , Aksoy, A , Campbell, M , Al Zaidi, M , Ozturk, C , Vorloeper, J, et al. Hospital admissions during Covid-19 lock-down in Germany: differences in discretionary and unavoidable cardiovascular events. PLoS One. (2020) 15:e0242653. doi: 10.1371/journal.pone.0242653
17. Rennert-May, E , Leal, J , Thanh, NX , Lang, E , Dowling, S , Manns, B, et al. The impact of COVID-19 on hospital admissions and emergency department visits: a population-based study. PLoS One. (2021) 16:e0252441. doi: 10.1371/journal.pone.0252441
18. Wongtanasarasin, W , Srisawang, T , Yothiya, W , and Phinyo, P . Impact of national lockdown towards emergency department visits and admission rates during the COVID-19 pandemic in Thailand: a hospital-based study. Emerg Med Australas. (2021) 33:316–23. doi: 10.1111/1742-6723.13666
19. White, F . Application of disease etiology and natural history to prevention in primary health care: a discourse. Med Princ Pract. (2020) 29:501–13. doi: 10.1159/000508718
20. Statistics Canada . (2021) Table 17-10-0009-01 Population estimates, quarterly. Release date: 2021-09-29. Available at: https://www150.statcan.gc.ca/t1/tbl1/en/tv.action?pid=1710000901.
21. ICES Investigative Report . Improving health care data in Ontario. Toronto: Institute for Clinical Evaluative Sciences (2005).
22. Juurlink, DPC , Croxford, R , Chong, A , Austin, P , Tu, J , and Laupacis, A . Canadian Institute for Health Information Discharge Abstract Database: A validation study. Toronto: Institute for Clinical Evaluative Sciences (2006).
23. Goel, V . Patterns of health care in Ontario. 2nd ed. Ottawa: Canadian Medical Association [for] the Institute for Clinical Evaluative Sciences in Ontario (1996) 354 pp.
24. Canadian Instititute for Health Information (2021) Physician billing codes in response to COVID-19. Available at: https://www.cihi.ca/en/physician-billing-codes-in-response-to-covid-19#ON.
25. Rodrigues, G. Ontario government declares state of emergency amid coronavirus pandemic. Global News (2020).
26. Cameron-Blake, E , Breton, C , Sim, P , Tatlow, H , Hale, T , Wood, A, et al. Variation in the Canadian provincial and territorial responses to COVID-19 (2021).
27. Fasken (2020). Canadian Health Sector: Updates Related to COVID-19 in March 2020. Available at: https://www.fasken.com/en/knowledge/2020/03/30-covid19-canadian-health-sector-updates-march-2020.
28. Government of Canada . COVID-19 epidemiology update: Current sitation. Available at: https://health-infobase.canada.ca/covid-19/current-situation.html.
29. Text Table A . International Statistical Classification of Diseases and Related Health Problems, 10th Revision, Canada (ICD-10-CA) codes used to define ambulatory care sensitive conditions Statistics Canada. Date modified: 2017-12-20. Available at: https://www150.statcan.gc.ca/n1/pub/82-003-x/2017012/article/54891/tbl/ttbla-eng.htm.
30. Canadian Institute for Health Information . Ambulatory Care Sensitive Conditions. Available at: www.cihi.ca/en/indicators/ambulatory-care-sensitive-conditions.
31. Box, GEP , Jenkins, GM , and Reinsel, GC . Time series analysis: forecasting and control. Hoboken, NJ: John Wiley (2008).
32. Census.gov . Time series research staff, Center for Statistical Research and Methodology, U.S. Census Bureau Reference Manual for X-13ARIMA-SEATS 2017. Available at: http://www.census.gov/srd/www/x13as/.
33. Dagum, EB . The X11ARIMA/88 seasonal adjustment method – foundations and User's manual. Time Series Research and Analysis Division (1988).
34. Gomez, V , and Maravall, A . Automatic modeling methods for univariate series In: D Pena, GC Tiao, and RS Tsay, editors. A course in time series analysis. New York, NY: John Wiley and Sons (2001)
35. Schaffer, AL , Dobbins, TA , and Pearson, SA . Interrupted time series analysis using autoregressive integrated moving average (ARIMA) models: a guide for evaluating large-scale health interventions. BMC Med Res Methodol. (2021) 21:58. doi: 10.1186/s12874-021-01235-8
36. Hyndman, R , and Kostenko, AV . Minimum sample size requirements for seasonal forecasting models. Foresight Int J Appl Forecast. (2007) 6:12–5.
37. Huang, YT , Lee, YC , and Hsiao, CJ . Hospitalization for ambulatory-care-sensitive conditions in Taiwan following the SARS outbreak: a population-based interrupted time series study. J Formos Med Assoc. (2009) 108:386–94. doi: 10.1016/S0929-6646(09)60082-6
38. Czeisler, MÉ , Marynak, K , Clarke, KE , Salah, Z , Shakya, I , Thierry, JM, et al. Delay or avoidance of medical care because of COVID-19–related concerns — United States, June 2020. MMWR Morb Mortal Wkly Rep. (2020) 69:1250–7. doi: 10.15585/mmwr.mm6936a4
39. Nab, M , van Vehmendahl, R , Somers, I , Schoon, Y , and Hesselink, G . Delayed emergency healthcare seeking behaviour by Dutch emergency department visitors during the first COVID-19 wave: a mixed methods retrospective observational study. BMC Emerg Med. (2021) 21:56. doi: 10.1186/s12873-021-00449-9
40. Guimaraes, RA , Policena, GM , Paula, H , Pedroso, CF , Pinheiro, RS , Itria, A, et al. Analysis of the impact of coronavirus disease 19 on hospitalization rates for chronic non-communicable diseases in Brazil. PLoS One. (2022) 17:e0265458. doi: 10.1371/journal.pone.0265458
41. Banerjee, A , Chen, S , Pasea, L , Lai, AG , Katsoulis, M , Denaxas, S, et al. Excess deaths in people with cardiovascular diseases during the COVID-19 pandemic. Eur J Prev Cardiol. (2021) 28:1599–609. doi: 10.1093/eurjpc/zwaa155
42. Santi, L , Golinelli, D , Tampieri, A , Farina, G , Greco, M , Rosa, S, et al. Non-COVID-19 patients in times of pandemic: emergency department visits, hospitalizations and cause-specific mortality in northern Italy. PLoS One. (2021) 16:e0248995. doi: 10.1371/journal.pone.0248995
43. Haki, C , and Deniz, O . The impact of home quarantine during COVID-19 lockdown on neurological hospitalizations, in-hospital mortality, and acute ischemic stroke management in older patients without COVID-19. Clin Neurol Neurosurg. (2022) 212:107027. doi: 10.1016/j.clineuro.2021.107027
44. Hangartner, N , Di Gangi, S , Elbl, C , Senn, O , Bisatz, F , and Fehr, T . Impact of the COVID-19 pandemic on emergency outpatient consultations and admissions of non-COVID-19 patients (ECCO)-a cross-sectional study. PLoS One. (2022) 17:e0269724. doi: 10.1371/journal.pone.0269724
45. Poucineau, J , Delory, T , Lapidus, N , Hejblum, G , Chouaid, C , Le Coeur, S, et al. Hospital admissions and mortality for acute exacerbations of COPD during the COVID-19 pandemic: a nationwide study in France. Front Med (Lausanne). (2022) 9:995016. doi: 10.3389/fmed.2022.995016
46. Pujolar, G , Oliver-Angles, A , Vargas, I , and Vazquez, ML . Changes in access to health services during the COVID-19 pandemic: a scoping review. Int J Environ Res Public Health. (2022) 19:1749. doi: 10.3390/ijerph19031749
47. Kaufman, HW , Chen, Z , Niles, J , and Fesko, Y . Changes in the number of US patients with newly identified Cancer before and during the coronavirus disease 2019 (COVID-19) pandemic. JAMA Netw Open. (2020) 3:e2017267. doi: 10.1001/jamanetworkopen.2020.17267
48. Olsen, SJ , Azziz-Baumgartner, E , Budd, AP , Brammer, L , Sullivan, S , Pineda, RF, et al. Decreased influenza activity during the COVID-19 pandemic-United States, Australia, Chile, and South Africa, 2020. Am J Transplant. (2020) 20:3681–5. doi: 10.1111/ajt.16381
49. Chow, EJ , Uyeki, TM , and Chu, HY . The effects of the COVID-19 pandemic on community respiratory virus activity. Nat Rev Microbiol. (2022) 25:195–210. doi: 10.1038/s41579-022-00807-9
50. Datta, BK , Ansa, BE , and George, V . An analytical model of population level chronic conditions and COVID-19 related hospitalization in the United States. BMC Public Health. (2022) 22:208. doi: 10.1186/s12889-022-12531-3
51. Kaye, L , Theye, B , Smeenk, I , Gondalia, R , Barrett, MA , and Stempel, DA . Changes in medication adherence among patients with asthma and COPD during the COVID-19 pandemic. J Allergy Clin Immunol Pract. (2020) 8:2384–5. doi: 10.1016/j.jaip.2020.04.053
52. Skene, IP , and Pfeffer, PE . Improved asthma control during the COVID-19 pandemic: are there lessons to be learnt? Thorax. (2021) 76:852–3. doi: 10.1136/thoraxjnl-2021-216930
53. Moore, WC , Ledford, DK , Carstens, DD , and Ambrose, CS . Impact of the COVID-19 pandemic on incidence of asthma exacerbations and hospitalizations in US subspecialist-treated patients with severe asthma: results from the CHRONICLE study. J Asthma Allergy. (2022) 15:1195–203. doi: 10.2147/JAA.S363217
54. Birkmeyer, JD , Barnato, A , Birkmeyer, N , Bessler, R , and Skinner, J . The impact of the COVID-19 pandemic on hospital admissions in the United States. Health Aff (Millwood). (2020) 39:2010–7. doi: 10.1377/hlthaff.2020.00980
55. Dayal, D , Gupta, S , Raithatha, D , and Jayashree, M . Missing during COVID-19 lockdown: children with onset of type 1 diabetes. Acta Paediatr. (2020) 109:2144–6. doi: 10.1111/apa.15443
56. Gujral, UP , Johnson, L , Nielsen, J , Vellanki, P , Haw, JS , Davis, GM, et al. Preparedness cycle to address transitions in diabetes care during the COVID-19 pandemic and future outbreaks. BMJ Open Diabetes Res Care. (2020) 8:e001520. doi: 10.1136/bmjdrc-2020-001520
57. Shah, SA , Quint, JK , Nwaru, BI , and Sheikh, A . Impact of COVID-19 national lockdown on asthma exacerbations: interrupted time-series analysis of English primary care data. Thorax. (2021) 76:860–6. doi: 10.1136/thoraxjnl-2020-216512
58. Shah, SA , Quint, JK , and Sheikh, A . Impact of COVID-19 pandemic on asthma exacerbations: retrospective cohort study of over 500,000 patients in a national English primary care database. Lancet Reg Health Eur. (2022) 19:100428. doi: 10.1016/j.lanepe.2022.100428
59. Papafaklis, MI , Katsouras, CS , Tsigkas, G , Toutouzas, K , Davlouros, P , Hahalis, GN, et al. "Missing" acute coronary syndrome hospitalizations during the COVID-19 era in Greece: medical care avoidance combined with a true reduction in incidence? Clin Cardiol. (2020) 43:1142–9. doi: 10.1002/clc.23424
60. Arabi, A , Ahmad, F , Al-Suwaidi, J , Al-Qahtani, A , Asaad, N , Rafie, I, et al. The impact of COVID-19 outbreak on cardiovascular admissions. Heart Views. (2020) 21:153–6. doi: 10.4103/HEARTVIEWS.HEARTVIEWS_141_20
61. Schwarz, V , Mahfoud, F , Lauder, L , Reith, W , Behnke, S , Smola, S, et al. Decline of emergency admissions for cardiovascular and cerebrovascular events after the outbreak of COVID-19. Clin Res Cardiol. (2020) 109:1500–6. doi: 10.1007/s00392-020-01688-9
62. Severino, P , D'Amato, A , Saglietto, A , D'Ascenzo, F , Marini, C , Schiavone, M, et al. Reduction in heart failure hospitalization rate during coronavirus disease 19 pandemic outbreak. ESC Heart Fail. (2020) 7:4182–8. doi: 10.1002/ehf2.13043
63. Frankfurter, C , Buchan, TA , Kobulnik, J , Lee, DS , Luk, A , McDonald, M, et al. Reduced rate of hospital presentations for heart failure during the COVID-19 pandemic in Toronto, Canada. Can J Cardiol. (2020) 36:1680–4. doi: 10.1016/j.cjca.2020.07.006
64. Simoneau, T , Greco, KF , Hammond, A , Nelson, K , and Gaffin, JM . Impact of the COVID-19 pandemic on pediatric emergency department use for asthma. Ann Am Thorac Soc. (2021) 18:717–9. doi: 10.1513/AnnalsATS.202007-765RL
65. Sevinc, C , Tertemiz, KC , Atik, M , Guler, N , Ulusoy, M , Coskun, F, et al. How were non-COVID pulmonary patients and diseases affected from COVID-19 pandemic period? Turk Thorac J. (2021) 22:149–53. doi: 10.5152/TurkThoracJ.2021.20249
66. Bamaga, AK , Alharbi, O , Bajuaifer, M , Batarfi, A , Althobaiti, KH , and AlQusaibi, B . The effect of the COVID-19 pandemic on emergency department visits for neurological diseases in Saudi Arabia. Cureus. (2020) 12:e12200. doi: 10.7759/cureus.12200
67. Davico, C , Marcotulli, D , Lux, C , Calderoni, D , Terrinoni, A , Di Santo, F, et al. Where have the children with epilepsy gone? An observational study of seizure-related accesses to emergency department at the time of COVID-19. Seizure. (2020) 83:38–40. doi: 10.1016/j.seizure.2020.09.025
68. Mostacci, B , Licchetta, L , Cacciavillani, C , Di Vito, L , Ferri, L , Menghi, V, et al. The impact of the COVID-19 pandemic on people with epilepsy. An Italian survey and a global perspective. Front Neurol. (2020) 11:613719. doi: 10.3389/fneur.2020.613719
69. Adan, GH , Mitchell, JW , and Marson, T . Epilepsy care in the COVID-19 era. Clin Med (Lond). (2020) 20:e104–6. doi: 10.7861/clinmed.2020-0207
Keywords: COVID-19 pandemic, ambulatory care sensitive conditions, outpatient visits, inpatient visits, ARIMA, trends
Citation: Kendzerska T, Zhu DT, Pugliese M, Manuel D, Sadatsafavi M, Povitz M, Stukel TA, To T, Aaron SD, Mulpuru S, Chin M, Kendall CE, Thavorn K, Robillard R and Gershon AS (2023) Trends in outpatient and inpatient visits for separate ambulatory-care-sensitive conditions during the first year of the COVID-19 pandemic: a province-based study. Front. Public Health. 11:1251020. doi: 10.3389/fpubh.2023.1251020
Edited by:
Yitka N. H. Graham, University of Sunderland, United KingdomReviewed by:
Ahmed Y. Azzam, October 6 University, EgyptCopyright © 2023 Kendzerska, Zhu, Pugliese, Manuel, Sadatsafavi, Povitz, Stukel, To, Aaron, Mulpuru, Chin, Kendall, Thavorn, Robillard and Gershon. This is an open-access article distributed under the terms of the Creative Commons Attribution License (CC BY). The use, distribution or reproduction in other forums is permitted, provided the original author(s) and the copyright owner(s) are credited and that the original publication in this journal is cited, in accordance with accepted academic practice. No use, distribution or reproduction is permitted which does not comply with these terms.
*Correspondence: Tetyana Kendzerska, dGtlbmR6ZXJza2FAdG9oLmNh
†These authors have contributed equally to this work
Disclaimer: All claims expressed in this article are solely those of the authors and do not necessarily represent those of their affiliated organizations, or those of the publisher, the editors and the reviewers. Any product that may be evaluated in this article or claim that may be made by its manufacturer is not guaranteed or endorsed by the publisher.
Research integrity at Frontiers
Learn more about the work of our research integrity team to safeguard the quality of each article we publish.